Simple Summary
Breast cancer is influenced by both inherited genetic factors and lifestyle or personal factors such as age, family history, and reproductive history. Scientists have developed tools to estimate a woman’s risk of developing breast cancer. One type of tool, called a polygenic risk score, uses many small genetic variations to estimate risk, while another, the Gail model, uses personal and family medical information. We studied how well these tools predict breast cancer risk in women of European and Asian backgrounds. Our research included more than 180,000 women and compared performance across age groups and cancer types. We found that genetic scores were especially useful in younger women and in women of Asian background, while the Gail model worked better in older women of European background. However, both tools showed some inaccuracy when comparing predicted and observed risks. Overall, combining genetic information with traditional risk factors could improve how doctors identify women at higher risk for breast cancer, leading to more personalized screening and prevention strategies across different populations.
Abstract
Background: Breast cancer polygenic risk scores (PRS) and traditional risk models (e.g., the Gail model [Gail]) are known to contribute largely independent information, but it is unclear how the overlap varies by ancestry, age, disease type (invasive breast cancer, DCIS), and risk threshold. Methods: In a retrospective case–control study, we evaluated risk prediction performance in 180,398 women (161,849 of European ancestry; 18,549 of Asian ancestry). Odds ratios (ORs) from logistic regression models and the area under the receiver operating characteristic curve (AUC) were estimated. Results: PRS for invasive disease showed a stronger association in younger (<50 years) women (OR = 2.51, AUC = 0.622) than in women ≥ 50 years (OR = 2.06, AUC = 0.653) of European ancestry. PRS performance in Asians was lower (OR range = 1.62–1.64, AUC = 0.551–0.600). Gail performance was modest across groups and poor in younger Asian women (OR = 0.94–0.99, AUC = 0.523–0.533). Age interactions were observed for both PRS (p < 0.001) and Gail (p < 0.001) in Europeans, whereas in Asians, age interaction was observed only for Gail (invasive: p < 0.001; DCIS: p = 0.002). PRS identified more high-risk individuals than Gail in Asian populations, especially ≥50 years, while Gail identified more in Europeans. Overlap between PRS, Gail, and family history was limited at higher thresholds. Calibration analysis, comparing empirical and model-based ROC curves, showed divergence for both PRS and Gail (p < 0.001), which indicates miscalibration. In Europeans, family history and prior biopsies drove Gail discrimination. In younger Asians, age at first live birth was influential. Conclusions: PRS adds value to risk stratification beyond traditional tools, especially in younger women and Asian ancestry populations.
1. Introduction
Breast cancer risk arises from many factors, including inherited genetic mutations (e.g., BRCA1/2), reproductive and hormonal history, and lifestyle exposures [1,2]. However, in everyday clinical practice, age and family history (FH) remain the commonly used predictors for preliminary risk stratification. Polygenic risk scores (PRS) and traditional breast cancer risk models, such as the Gail model (Gail), the Tyrer–Cuzick model, or the Breast Cancer Surveillance Consortium (BCSC) model, have each demonstrated predictive power in prior studies [3]. They have been shown to contribute largely independent information and can identify non-overlapping high-risk individuals when combined with FH and pathogenic variants of breast cancer predisposition genes [3,4,5]. Combining PRS with non-genetic risk factors, including mammographic density, has consistently improved discriminatory performance compared to using a single predictor [3]. Many ongoing trials of risk-based breast cancer screening (e.g., MyPEBS and WISDOM) are already implementing integrated risk models [6,7].
Although integrated models generally improve discrimination, their applicability may be limited in populations where there is a lack of validation data. In this context, evaluating PRS and traditional breast cancer risk models comprising non-genetic risk factors separately enables the quantification of (a) unique genetic risk attributed to PRS, (b) distinctive predictive value from clinical and epidemiologic factors, and (c) how each independently identifies high-risk individuals with insights on potential miscalibration. For example, the BREATHE study in Singapore stratifies women using separate risk domains (i.e., PRS, non-genetic risk factors (Gail), mammographic density, and recall history) and considers women as high risk if they exceed thresholds in any one category [8,9]. This approach reveals the proportion of women uniquely identified by PRS, traditional risk factors, and imaging as high-risk. The level of incomplete risk capture may inform policy decisions in settings where PRS assessment is not yet routine.
Typically, women are stratified into two categories of breast cancer risk (high/not high). A wide range of five-year absolute-risk thresholds (1.3%, corresponding to the risk of an average 50-year-old Caucasian woman, to 3% for intervention eligibility) has been used to define elevated breast cancer risk in academic literature and guidelines [4,5]. The National Comprehensive Cancer Network (NCCN) guidelines specify that women aged ≥35 years, with a life expectancy of at least ten years and a five-year Gail risk ≥ 1.67%, may be considered for risk-reducing therapies [10]. The US Preventive Services Task Force (USPSTF) recommends a higher 5-year risk threshold of ≥3.0% to define elevated risk where the benefits of chemoprevention (tamoxifen or raloxifene) are likely to outweigh harms in most women [11]. As risk thresholds for initiating or escalating surveillance (e.g., imaging by mammography) often differ from those guiding preventive interventions, the same risk cut-off may not apply. To assess how different predictors capture unique high-risk women, multiple threshold values should be evaluated.
The incidence of ductal carcinoma in situ (DCIS), a non-invasive form of breast cancer, has increased markedly in recent decades, and DCIS now accounts for approximately 20–25% of newly diagnosed breast cancers [12]. DCIS is widely regarded as a precursor to invasive breast cancer [13,14]. Not unexpectedly, DCIS and invasive disease share many risk factors [15]. However, both Gail and PRS were developed and validated specifically for predicting invasive breast cancer, not DCIS (Gail excludes women with prior DCIS or LCIS). The transferability of these models to DCIS remains uncertain. As DCIS constitutes a non-negligible healthcare burden in terms of overdiagnosis, adverse treatment-related effects, and costs, and given the shared risk factors between DCIS and invasive breast cancer, it is worthwhile to explore the application of invasive cancer prediction tools for DCIS [16,17].
This study aims to evaluate the performance of genetic (PRS) and non-genetic (Gail) breast cancer risk predictors in identifying high-risk individuals across different age groups (<50 years and ≥50 years) and ancestries (Asian and European). By examining the proportion of individuals identified as high risk by these factors across various risk thresholds (five-year absolute risk 0.5–2.5%), we seek to determine how well each predictor performs in diverse populations and age groups.
2. Methods
2.1. Study Population
The Breast Cancer Association Consortium (BCAC) is an international collaboration that was formed to provide large sample sizes for investigating genetic associations [18]. Women diagnosed with invasive breast cancer DCIS and cancer-free controls were recruited by study groups globally and collectively studied under BCAC [17]. Our retrospective case–control study focuses on individuals who are genetically Asian or European White (from here on referred to as “European”). Details of the ancestry analysis (the “EthnicityGeno” variable used in BCAC analyses) have been previously described [19].
To reduce the influence of missing values on the performance of Gail, studies were excluded if they had missing values for at least two of the three risk factors in the model (age at menarche, age at first live birth, and first-degree breast cancer FH), for 50% or more of participants [20]. The studies included are listed in Supplementary Table S1. Exclusion was determined separately for individual studies and each disease status (invasive, DCIS, and controls).
Further exclusions were made on an individual level (Supplementary Figure S1). Women with unknown age at enrolment for controls (n = 5566) and unknown age at diagnosis for invasive breast cancer or DCIS (n = 2103) were excluded. Women below the age of 30 years (n = 2360) and above 80 years (n = 1897) of age for whom Gail prediction is not valid were excluded. A total of 180,398 individuals were included in our study. We compared demographic differences between the included and excluded individuals to assess potential selection bias.
2.2. Prediction Models
2.2.1. Gail Model
Due to the large number of studies with varying degrees of missing data for different risk factors, the parsimonious Gail model, which most studies would have information on, was selected [20]. The model uses information on reproductive risk factors (age of menarche, age at first live birth), personal history (number of breast biopsies, and history of atypical hyperplasia), and family (first-degree) history of breast cancer. The R package “BCRA” (version 2.1.2) was used to calculate five-year absolute risk. Missing values were recoded to the baseline category by the package (i.e., relative risk = 1). In addition, FH (yes/no) was separately studied. Those with unknown FH were considered to have no FH. Five-year absolute risks were estimated by applying the breast cancer incidence rates and mortality rates of “Whites” and “Chinese” (“BCRA” package) to the European and Asian genetic subgroups, respectively.
2.2.2. Handling of Missing Data and Sensitivity Analyses
Information on the number of prior breast biopsies was unavailable for the majority of participants (94% of included European-ancestry and 100% of included Asian-ancestry participants). Because this variable was almost entirely missing, multiple imputation was not performed, as imputed values would have been determined primarily by model assumptions rather than observed data. For the primary analysis, missing values for all Gail model variables were assigned to the reference (lowest-risk) category, consistent with prior validation studies of the model.
To assess the potential influence of missing data on model performance, sensitivity analysis was conducted in which missing values were instead assigned to the highest-risk category for each variable (age at menarche, age at first live birth, number of first-degree relatives with breast cancer, and number of prior breast biopsies). Five-year absolute risk was calculated using the R package BCRA, and the model’s discriminatory ability for invasive breast cancer was evaluated using the area under the receiver operating characteristic curve (AUC) with 95% confidence intervals.
2.2.3. PRS
Among the multiple PRSs available for breast cancer, we used the 313-variant breast cancer PRS developed by the Breast Cancer Association Consortium (BCAC). This PRS was selected because it has been extensively validated in large-scale studies across diverse populations and has demonstrated strong and consistent associations with breast cancer risk and reproducible discriminatory performance [15,21]. Details of the variants, including allele frequencies stratified by ancestry, age, and disease status in our analytical dataset, are presented in Supplementary Table S2.
PRS was calculated with the --score function (scoresum option) in PLINK2 [22]. When PLINK2 encounters missing dosage entries (e.g., NA, -9, or blank), it applies mean imputation to replace the missing value with the allele frequency calculated across the dataset (population average as opposed to zero). The rates from the “BCRA” package were used to maintain comparability between the absolute risk estimated for the PRS and Gail. Details for the calculation of absolute risk were published by Mavaddat et al. [21]. In brief, an individual’s PRS percentile was obtained from the standardized PRS using the “pnorm” function in R. Standardization was performed using the ancestry-specific means and standard deviations of the controls (Supplementary Table S3). The five-year absolute risk was calculated by estimating the theoretical odds ratio of this percentile in relation to the 40–60th percentile, which was taken to represent the general population [23].
2.3. Statistical Analysis
Differences in characteristics for invasive breast cancer cases, DCIS cases, and controls were assessed using the Chi-squared test (categorical variables) and the Kruskal–Wallis test (continuous variables). We assessed the relationship between estimated five-year absolute breast cancer risk (modeled as a continuous variable using PRS and the Gail model) and invasive breast cancer or DCIS. Logistic regression models were fitted to estimate odds ratios (ORs) and corresponding 95% confidence intervals (CIs). Analyses were stratified by disease (invasive, DCIS), genetic ancestry (Asian, European), and age group (<50 years, ≥50 years). This approach provides directly interpretable, age-specific effect estimates without relying on interaction terms. Formal interaction tests between age (modeled as a continuous variable) and each risk score were conducted separately and reported as P interaction values to assess potential heterogeneity of effects by age. Venn diagrams (R package “VennDiagram”, v1.7.3) were used to ascertain the overlaps in high-risk individuals identified by PRS and Gail for five-year absolute-risk thresholds from 0.5 to 2.5%, and FH (binary) for the different groups. Traditional evaluation of calibration often relies on the Hosmer–Lemeshow goodness-of-fit test, which partitions subjects into risk deciles and compares observed versus predicted events. However, in our case–control study, the observed event rate in the sample does not represent the true population prevalence, making the standard Hosmer–Lemeshow test unreliable without design-specific adjustment. Hence, we used the “model-based” ROC curve approach, which focuses on the relative accuracy of predicted risks [24]. The slope is valid without adjustment, reflecting over- or under-fitting in terms of risk spread. The European-ancestry population aged ≥50 years was set as the reference for comparisons.
Although studies with high missingness rates for variables required to compute the Gail risk score were excluded, there were still individuals with missing values. Hence, we studied the potential drivers of Gail in discriminating invasive breast cancer cases from controls using logistic regression models. All combinations of risk factors, where available, were assessed. Discriminatory ability was assessed by the area under the receiver operator curve (AUC).
All analyses were performed in R (version 4.5.0), unless otherwise stated. All analytical code used in this study is publicly available at the GitHub repository: https://github.com/ryan-limjy/Gene.and.Tonic.
3. Results
3.1. Excluded Participants
Supplementary Table S4 compares included and excluded participants (all from studies missing ≥50% of data for at least two of the three Gail variables) by ancestry. Excluded women of European ancestry were younger at interview or diagnosis (mean age of 54 vs. 57; p < 0.001), and none had information on prior biopsies. Excluded Asians were particularly likely to lack data on age at menarche, age at first full-term pregnancy, and FH. Excluded European-ancestry women differed significantly from those included regarding age at first full-term pregnancy, and missing data on age at menarche was more common among excluded European-ancestry women. Across all subgroups, excluded individuals had significantly lower five-year absolute risk according to Gail (p < 0.001). The PRS sum score was significantly higher in excluded European-ancestry women (−0.237 vs. −0.247; p = 0.002) and in excluded Asians (0.308 vs. 0.279; p = 0.002). For Asian-ancestry women, excluded individuals also had significantly higher PRS-based five-year absolute risk (0.716 vs. 0.681; p < 0.001).
Supplementary Tables S5–S8 further stratify participants by age group (<50 years vs. ≥50 years) and disease status (controls, invasive breast cancer, DCIS). In older European invasive breast cancer cases, excluded participants had higher PRS (−0.083 vs. −0.107; p < 0.001). Younger European controls and invasive cases had lower PRS-based five-year risk when excluded. Among Asians, except DCIS, excluded individuals consistently showed higher PRS scores or risk estimates than those included (p < 0.05).
3.2. Analytical Cohort
A total of 180,398 women were included, where 161,849 (90%) women were of European ancestry (52% invasive and 6% DCIS) and 18,549 (10%) were of Asian ancestry (50% invasive and 5% DCIS) (Table 1).

Table 1.
Characteristics of 161,849 European-ancestry (European) and 18,549 Asian-ancestry (Asian) individuals between the ages of 30 and 80 years. IQR: interquartile range; Family history: number of first-degree relatives with breast cancer; Invasive: invasive breast cancer; DCIS: ductal carcinoma in situ.
3.2.1. European Ancestry
The median age at diagnosis for invasive cases of European ancestry was 57 years [interquartile range [IQR]: 49–65]. The corresponding age at interview for European-ancestry controls was 57 years [IQR: 50–64] (Table 1). Invasive cases were more likely to have a FH than controls (14% vs. 9%, respectively). The PRS distributions and corresponding five-year absolute risks were similar across countries (Supplementary Figure S2). The observations were largely similar for DCIS (Table 1).
3.2.2. Asian Ancestry
The median age at diagnosis for Asian-ancestry invasive cases was younger at 49 years [IQR: 43–57], and the age at enrolment was 50 years [IQR: 44–58] for controls (Table 1). Of the invasive cases, 10% reported positive FH, compared to a smaller proportion of controls (6%). In contrast to the European ancestry group, the distribution of PRS and five-year absolute risks varied by country (Supplementary Figure S3). As with the Europeans, the observations were mostly consistent for DCIS in those of Asian ancestry (Table 1).
3.2.3. Performance of Risk Models
In invasive breast cancer among individuals of European ancestry, younger women (<50 years) exhibited a stronger PRS association (OR:2.51 [2.39–2.62]) but lower discrimination (AUC: 0.622 [0.617–0.628]), whereas in older women (≥50 years), the PRS effect was weaker (OR: 2.06 [2.02–2.11]) with higher discrimination (AUC: 0.653 [0.650–0.656]) (Table 2). In contrast, for DCIS, younger women showed both stronger association and better discrimination (OR: 2.56 [2.37–2.78]; AUC = 0.657 [0.645–0.669]), while older women had lower OR and AUC (OR: 1.56 [1.51–1.61]; AUC = 0.620 [0.613–0.626]).
Table 2.
Association between five-year absolute breast cancer risk (modeled as a continuous variable, estimated using the polygenic risk score (PRS) versus the Gail model) and the development of invasive breast cancer or ductal carcinoma in situ (DCIS), stratified by ancestry and age groups. OR: odds ratios; CI: confidence intervals; AUC: area under the curve. ORs and AUCs are estimated separately in age-stratified logistic regression models (<50 years and ≥50 years). p-values for interaction (risk score × Age) were obtained from separate logistic regression models that included the risk score, age (treated as a continuous variable), and their interaction term; the interaction test assessed statistical heterogeneity of the risk-score effect by age.
In a sensitivity analysis assuming missing values corresponded to the highest risk category, the Gail model’s discriminatory ability changed notably among European-ancestry women. (Supplementary Table S9 and Figure S4) For invasive disease, the AUC for the full model increased from 0.493 (0.487–0.499) to 0.627 (0.621–0.632) and for women < 50 years and from 0.517 (0.514–0.520) to 0.561 (0.557–0.564) for those ≥50 years, suggesting that the large proportion of missing data, particularly for family history and biopsy variables, may have led to underestimation of model discrimination in the original analysis. Among Asian women, AUCs were similar between the two approaches (<50 years: 0.523 [0.511–0.535] vs. 0.507 [0.494–0.519]; ≥50 years: 0.554 [0.543–0.566] vs. 0.531 [0.520–0.543]).
In contrast, for DCIS, the Gail model showed minimal change or a reduction in AUCs when missing data were assigned to the high-risk category (Supplementary Table S10 and Figure S5). Among European women, the AUC for the full model was 0.521 (0.509–0.533) compared with 0.610 (0.597–0.622) in the original model for those <50 years, and 0.525 (0.518–0.531) vs. 0.519 (0.512–0.526) for those ≥50 years. Among Asian women, AUCs were similar or modestly higher under the high-risk assumption (0.589 (0.560–0.619) vs. 0.533 (0.505–0.562) for <50 years; 0.599 (0.571–0.627) vs. 0.542 (0.513–0.572) for ≥50 years).
The PRS associations for women of Asian ancestry are lower compared to those of European ancestry across age groups for invasive disease (OR range: 1.62–1.64, AUC range: 0.551–0.600) and DCIS (OR range: 1.70–1.89, AUC range: 0.556–0.654). Gail model associations were weak for younger Asian-ancestry women for invasive disease and DCIS (OR range: 0.94–0.99, AUC range: 0.523–0.533), but stronger for older women (OR range: 1.82–1.88, AUC range: 0.542–0.554). Age interaction was observed only for Gail (invasive: p < 0.001; DCIS: p = 0.002).
When limiting the analysis to population-based controls only, the PRS results remained largely consistent across all disease subgroups (Supplementary Table S11). Among European-ancestry women, PRS discrimination was similar for invasive breast cancer (AUC: 0.633 [0.629–0.636] vs. 0.635 [0.632–0.638] in the full cohort) and slightly lower for DCIS (AUC: 0.623 [0.617–0.629] vs. 0.626 [0.620–0.631]). For the Gail model, discrimination in European-ancestry women decreased slightly when using population-based controls, particularly for invasive disease (AUC: 0.514 [0.510–0.517] vs. 0.492 [0.489–0.495]). In Asian-ancestry women, PRS discrimination showed modest changes: for invasive disease, the AUC decreased slightly from 0.564 [0.556–0.573] in the full cohort to 0.554 [0.542–0.565] with population-based controls, and for DCIS, from 0.587 [0.566–0.607] to 0.576 [0.555–0.598]. By contrast, Gail discrimination in Asian-ancestry women improved with population-based controls, increasing for invasive disease from 0.506 [0.497–0.514] to 0.538 [0.527–0.548] and for DCIS from 0.507 [0.486–0.528] to 0.522 [0.499–0.544]. These results suggest that PRS performance is robust to the control sampling approach, while Gail model discrimination may be more sensitive to the composition of the control group.
3.3. Proportions Identified as High Risk
Among women of European ancestry, Gail generally identified a greater proportion at high risk across all risk thresholds; however, in women of Asian ancestry, risk stratification was driven primarily by PRS (Supplementary Figure S6). Supplementary Table S12 shows the distribution of Venn diagram segments across ancestry groups, age groups, and risk thresholds. In the European-ancestry population aged ≥50 years, the minimum threshold at which PRS picked up twice as many cases as high-risk compared to controls was 1.4% (invasive) and 1.8% (DCIS). At no threshold tested did Gail identify twice as many cases as high-risk compared to controls. In younger women of European ancestry (<50 years), a risk threshold of 1% could capture twice as many invasive and DCIS cases compared to controls; for Gail, the threshold was 1.2–1.3%. At the highest threshold tested (2.5%), the proportion of invasive or DCIS cases identified as high-risk compared to controls was between 3.9 to 4.6 times. In the Asian-ancestry population aged ≥50 years, the risk threshold at which the proportion of high-risk individuals who are invasive cases is twice that of controls is approximately 2% (PRS and Gail); for DCIS, the threshold is 1.1–1.2% (PRS and Gail). For the Asian-ancestry population aged <50 years, the risk threshold at which the proportion of high-risk individuals who are invasive cases is twice that of controls is approximately 1.4% (PRS) and 2% (Gail), and for DCIS cases, the threshold is ~1.2% (PRS) and 1% (Gail).
Figure 1 shows the proportion of individuals uniquely identified by PRS, Gail, and FH across different five-year absolute-risk thresholds (0.5–2.5%). Gail uniquely identifies a large proportion of both cases (invasive and DCIS) and controls in women of European ancestry, especially among older women, at lower thresholds (<1%). At higher-risk thresholds (>~1.3%), less than 10% of the population is classified as high-risk by more than one predictor (Supplementary Figure S7). However, PRS and Gail tend to have higher overlap at lower-risk thresholds. Variations in the proportions of high-risk individuals identified and overlap between predictors by country were observed (Supplementary Figure S8).
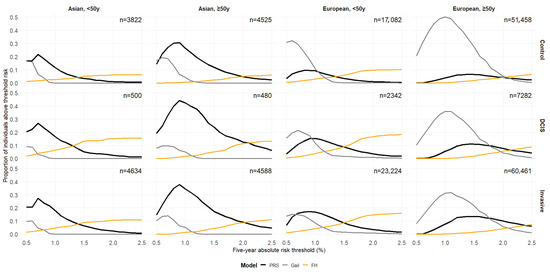
Figure 1.
Proportions of individuals uniquely identified as high-risk by the polygenic risk score (PRS), the Gail model, and family history (FH) at varying absolute-risk thresholds for PRS and Gail. FH is binary (presence vs. absence of a first-degree relative with breast cancer), so its classification as high-risk does not have a varying threshold. Each line represents one identification method (black: PRS only; grey: Gail only; orange: FH only). These values match the non-overlapping regions (unique segments) if Venn diagrams were to be plotted for each threshold. y: years.
Calibration
The empirical ROC curve does not align with the mROC curve (reference: European-ancestry, ≥50 years) for both PRS and Gail, which signals miscalibration (Figure 2). This divergence is supported by small p-values from the mean calibration (ranging from <2.2 × 10⁻¹⁶ to 9.00 × 10⁻⁵), ROC equality (from <2.2 × 10⁻¹⁶ to 0.00032), and unified calibration tests (ranging from <2.2 × 10⁻¹⁶ to 4.37 × 10⁻⁷) (Supplementary Table S13).
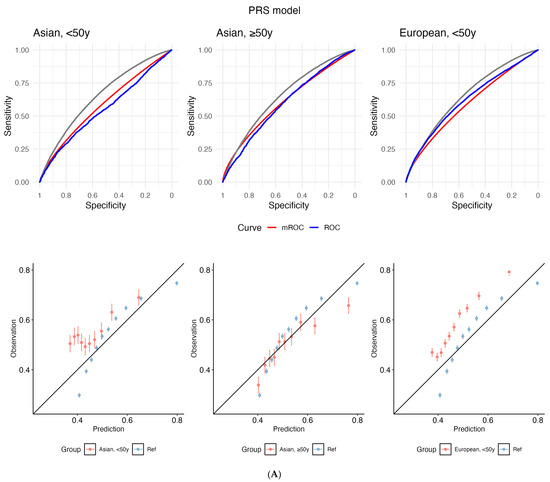
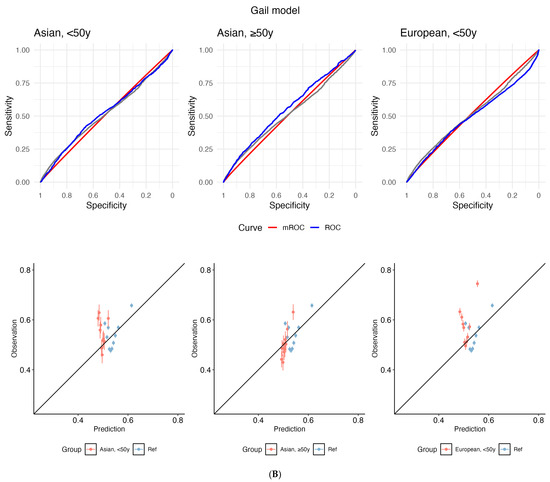
Figure 2.
Receiver operating characteristic (ROC) curves (top panel) and calibration plots (bottom) for (A) polygenic risk score (PRS) and (B) the Gail model. The grey line depicts the empirical ROC of the reference population: European, ≥50 years). The model-based ROC (mROC) curve (red) depicts the ROC performance expected if the prediction model is perfectly calibrated in the external population (i.e., European, <50 years; Asian, ≥50 years; Asian, <50 years). The empirical ROC curve (blue) shows discrimination based on observed outcomes. Alignment between red and blue curves implies good calibration; divergence suggests miscalibration after accounting for case mix. Calibration plots are used to assess the agreement between predictions and observations in different percentiles of the predicted values. The black diagonal line represents ideal calibration, where the predicted probabilities match the observed frequencies. Deviations from this diagonal line indicate either overconfidence or underconfidence in the model’s predictions. y: years.
3.4. Drivers of Gail Model Risk
In Figure 3A, we show that in those of European ancestry, the inclusion of both FH (number of first-degree relatives with breast cancer) and prior breast biopsies yields the highest AUC values (optimal model discrimination) (AUC = 0.545 [0.540–0.551] and 0.559 [0.555–0.562] for <50 years and ≥50 years, respectively), as shown in Supplementary Table S14. For Asians < 50 years (Figure 3B), the most influential predictors are age at first live birth and number of prior biopsies (set at the reference level, as missingness is 100%) (AUC = 0.543 [0.530–0.555]). Models omitting FH performed better (Figure 3C, Supplementary Table S14). For Asian women aged ≥50 years, the best-performing model (age at first live birth + family history; AUC = 0.556 [0.544–0.568]) showed similar discrimination to the full model (AUC = 0.554 [0.543–0.566]) (Figure 3D, Supplementary Table S14).
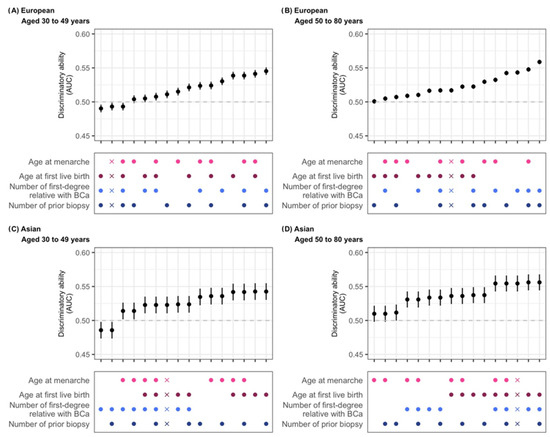
Figure 3.
Discriminatory ability of risk factor combinations in the Gail model. Five-year absolute risk was calculated using the R package “BCRA” and used to predict the risk of invasive breast cancer in a case–control study. Grey dashed line: AUC=0.5, model performs no better than random chance. Dots represent risk factors included in the model (factors not considered are set to missing), and X indicates the model with all risk factors with the addition of atypical hyperplasia. European: women of European ancestry; Asian: women of Asian ancestry. As data on prior biopsies were unavailable for Asian-ancestry participants, retaining this variable in the model produced the same effect as assuming all participants of Asian ancestry had missing values for this variable (i.e., lowest-risk group assigned by default).
4. Discussion
In this large case–control study, we analyzed the performance of PRS and Gail in 180,398 women (161,849 of European ancestry; 18,549 of Asian ancestry), stratified by age (<50 years vs. ≥50 years) and disease subtype (invasive vs. DCIS). PRS consistently outperformed traditional non-genetic risk factors (Gail model), especially in younger women and when non-genetic data were incomplete. For European-ancestry women, PRS captured inflection points where case enrichment was twice that of controls at lower absolute-risk thresholds than Gail. At the highest thresholds (2.5%), PRS enriched for 3.9–4.6× more cases than expected in both invasive and DCIS subtypes, whereas Gail failed to achieve similar discrimination. In Asian women, PRS also drove stratification, and Gail contributed minimal incremental value, particularly in younger women, where its ORs and AUCs were nearly null. PRS and Gail in groups other than the European-ancestry population aged ≥50 years require recalibration before clinical application. Driver analyses further revealed that key Gail contributors vary by ancestry: FH and prior biopsies dominate in Europeans, while reproductive factors and biopsies are most informative in younger Asians, and FH adds little incremental value. Together, these results affirm that PRS provides risk stratification by ancestry, age, and disease status, outperforming Gail across thresholds and subgroups.
PRS offers unique advantages to breast cancer risk stratification, particularly in younger women and in settings where non-genetic risk data (e.g., those used by the Gail model) are missing or unreliable (self-reporting bias, miscalibration). We observed that across age groups and disease subtypes, PRS consistently demonstrated superior discriminative accuracy compared with the Gail model. These advantages are especially pronounced in women under 50 years, for whom traditional non-genetic variables contribute minimally to risk prediction and whose risk profiles are poorly captured (and not designed to be captured) by the Gail model. Consequently, PRS identifies a large proportion of high-risk individuals missed by only considering risk factors used in routine clinical practice (age and FH) or traditional non-genetic risk factors (Gail). Given that the American College of Breast Surgeons recommends formal risk assessment beginning at age 25, integrating PRS into early risk evaluation frameworks is timely and clinically actionable [25]. Unlike traditional non-genetic risk factors, PRS enables individualized risk modeling from a younger age and supports stratified screening and prevention planning. Separating the contributions of genetic and non-genetic risk components remains relevant even when integrated models are available, especially for policy decisions in regions where PRS testing is not yet routine [26,27,28]. By quantifying the independent predictive value of PRS, policymakers can better estimate the added benefit of genetic risk stratification beyond traditional non-genetic risk factors.
These observed advantages of PRS raise the question of why genetic risk scores can provide additional predictive value beyond traditional non-genetic models. One explanation lies in the complex, multifactorial nature of cancer transformation. Cancer development can be conceptualized as a loss of regulatory control over cellular functions at both the unicellular and multicellular layers, resulting in aberrant or atavistic cell behavior [29]. This process is influenced by numerous factors, including ancestry, age, disease subtype, and other risk determinants, that may not be fully captured by clinical models like Gail. PRS, by quantifying inherited genetic susceptibility, captures part of this underlying biological risk, complementing non-genetic risk factors. The observed differences in age interactions between PRS and Gail across populations (i.e., both PRS and Gail in Europeans, but only for Gail in Asians) highlight how genetic and non-genetic contributors to risk may operate differently across populations and contexts. Therefore, integrating PRS into risk models allows for a more individualized and biologically informed assessment of breast cancer susceptibility, improving identification of high-risk individuals who may be missed by traditional risk factors alone.
Despite neither the Gail model nor PRS being explicitly developed to predict DCIS, we found that PRS stratifies DCIS risk meaningfully across age and ancestry groups, outperforming the Gail model in the ability to flag high-risk individuals [21]. In younger European-ancestry women, PRS reached the ≥2× case-to-control enrichment threshold at lower risk levels than Gail, while Gail’s enrichment was weaker and inconsistent. For older Asians, PRS again performed at least as well or better than Gail, particularly where Gail had little discriminatory power in younger women. PRS therefore adds value in DCIS risk stratification even though it was not originally designed for it. Our findings support exploring PRS as an additional component in risk models tailored for DCIS. However, the differentiation between indolent cases and those prone to progression to invasive disease will be important in the context of DCIS [30].
In European-ancestry women, the Gail model flags more individuals as “high-risk” across all risk thresholds, particularly at lower cut-points (<1%). However, PRS identifies more actual breast cancer cases. For instance, among European women aged ≥50, PRS at a 1.4% threshold for invasive disease (1.8% for DCIS) identified twice as many cases as controls, whereas the Gail model never achieves such a level of case-enrichment at any threshold. Among younger women (<50 years), PRS reaches the two-fold case vs. control ratio at a lower threshold (1.0%), compared to 1.2–1.3% for Gail. At the highest threshold (2.5%), PRS identifies 3.9–4.6× DCIS more cases than controls (i.e., it is superior to Gail at identifying women at genuinely elevated risk). Our data suggests that PRS achieves much better case–control discrimination and is able to identify high-risk individuals with fewer false positives at appropriate thresholds.
In Asian-ancestry women, risk stratification is driven primarily by PRS. Both PRS and Gail reach the two-fold enrichment threshold at similar absolute risk levels (~1.4–2.0% for invasive disease, ~1.1–1.2% for DCIS), but Gail contributes minimally in younger Asian women (where its ORs and discrimination are particularly weak). The unique Venn diagram segmentation further highlights that PRS uniquely flags high-risk individuals who are missed by Gail or FH. In sum, these results demonstrate that PRS adds value, especially in populations or age groups where non-genetic predictors are weak. However, it is important to weigh that benefit against expected increases in false positives and overdiagnoses [31].
While both models show reasonable discrimination, they fail to assign accurate absolute risks, which can potentially over- or underestimate risks and mislead clinical decisions. Miscalibration is a common issue when applying PRS or Gail model estimates derived from European-ancestry datasets to independent samples with different case mix characteristics [32,33,34]. In practice, a well-calibrated model typically has a calibration slope close to 1 and an intercept near 0. In the absence of a universally accepted numerical threshold for deviations, it is important to consider miscalibration as clinically meaningful if it leads to over- or underestimation of risk that could influence clinical decision-making [35]. Therefore, in real-world applications, recalibration or adjustment protocols, such as updating baseline incidence rate or performing logistic recalibration, will be necessary to ensure accurate absolute-risk predictions before clinical implementation.
We showed that the Gail model’s performance varies across populations due to differences in risk factor distributions. These variations highlight the need for adapting risk models to specific population characteristics. While our findings may not generalize beyond European and Asian populations, prior work has shown that PRSs derived from European GWAS can retain predictive potential within each ancestry group, highlighting the importance of evaluating PRS performance across diverse populations [36]. Additionally, challenges in accurately completing clinical fields have limited the widespread use of the Gail model in the general population [37].
Our study benefits from a large, multi-ancestry case–control cohort of 180,398 women (161,849 of European ancestry; 18,549 of Asian ancestry), providing substantial power to compare PRS versus Gail model performance across clinically important subgroups of age (<50 years vs. ≥50 years) and disease subtype (invasive vs. DCIS). Where the previous literature typically used one threshold for risk cut-off, we quantified high-risk enrichment across absolute-risk thresholds. We also performed driver analyses, revealing that key contributors to Gail’s performance differ by population.
However, our study has limitations. The heterogeneity in data sources and cohort methods may introduce variability in risk-factor measurement and disease ascertainment. The high proportion of missing data for key Gail model variables represents an important limitation, particularly among European participants. Sensitivity analyses indicated that the model’s discrimination for invasive breast cancer was more affected by assumptions about missing data than for DCIS, likely due to the heavy weighting of family history and biopsy variables in the Gail model. The larger changes in AUC observed among Europeans suggest that missingness in these predictors contributed to greater uncertainty in model performance. Additionally, while we showed PRS superiority for case enrichment, formal calibration assessments and clinical thresholds were not exhaustively validated in every subgroup. Asian-specific polygenic risk scores could improve breast cancer risk prediction and risk stratification. However, they were not evaluated in our study. Finally, our models did not include other potentially informative predictors, such as mammographic density, lifestyle factors, or hormone use, that may further refine individualized risk.
5. Conclusions
Our results highlight ancestry- and age-specific performance of PRS and Gail model across risk thresholds and strengthen the case for incorporating PRS into breast cancer risk stratification. PRS adds value risk stratification beyond traditional tools, especially in younger women and Asian-ancestry populations.
Supplementary Materials
The following supporting information can be downloaded at https://www.mdpi.com/article/10.3390/cancers17213561/s1: Table S1. List of studies included; Table S2. Allele frequencies of the 313 variants in the breast cancer risk polygenic risk score; Table S3. Mean and standard deviation of polygenic risk score in non–breast cancer controls from Europeans and Asians, before exclusions of studies with high missing rates for Gail model risk factors; Table S4. Demographic and risk factor differences between included and excluded individuals; Table S5. Demographic and risk factor differences between included (Yes) and excluded (No) individuals of European ancestry aged 30–49 years; Table S6. Demographic and risk factor differences between included (Yes) and excluded (No) individuals of European ancestry aged 50–80 years; Table S7. Demographic and risk factor differences between included (Yes) and excluded (No) individuals of Asian ancestry aged 30–49 years. No DCIS were excluded; Table S8. Demographic and risk factor differences between included (Yes) and excluded (No) individuals of Asian ancestry aged 50–80 years; Table S9. Sensitivity analysis of the discriminatory ability of the Gail model for invasive breast cancer; Table S10. Sensitivity analysis of the discriminatory ability of the Gail model for DCIS; Table S11. Association between five-year absolute breast cancer risk (PRS vs. Gail model) and development of invasive breast cancer or DCIS, stratified by ancestry and age groups; Table S12. Distribution of Venn diagram segments across ancestry groups, age groups, and risk thresholds; Table S13. p-values for model calibration performance from the predtools package in R; Table S14. Discriminatory ability of risk-factor combinations in the Gail model; Figure S1. Flowchart of individuals selected; Figure S2. Distribution of polygenic risk scores (scoresum) and five-year absolute risk by country for European-ancestry individuals; Figure S3. Distribution of polygenic risk scores (scoresum) and five-year absolute risk by country for Asian-ancestry individuals; Figure S4. Sensitivity analysis of the discriminatory ability of the Gail model for invasive breast cancer; Figure S5. Sensitivity analysis of the discriminatory ability of the Gail model for DCIS; Figure S6. Proportion of individuals identified as high-risk by PRS, Gail model, or family history across varying risk thresholds; Figure S7. Proportion of individuals identified as high-risk by multiple factors across varying absolute-risk thresholds; Figure S8. Proportion of individuals identified as high-risk by PRS and the Gail model by country and age; BCAC Funding and Acknowledgments.
Author Contributions
Conception and design of the study: J.L. (Jingmei Li) Acquisition of data: M.A., T.U.A., I.L.A., N.N.A., K.J.A., A.A., S.B., C.B., N.V.B., M.K.B., K.D.B., H.B. (Hermann Brenner), H.B. (Helen Byers), N.J.C., J.E.C., M.H.C., J.C.-C., S.J.C., G.C.-T., J.-Y.C., S.V.C., K.C., M.B.D., F.D., T.D., A.H.E., C.E., M.E., D.G.E., O.F., L.F., M.G.-D., J.M.G., W.R.R.G.-G., G.G., P.H., U.H., C.Y.S.H., W.-K.H., M.J.H., R.H., A.H., K.H., H.I., M.I. (Motoki Iwasaki), A.J., H.J., E.M.J., N.J., D.K., S.-W.K., C.M.K., Y.-D.K., P.K., A.K., D.L., S.L. (Susanna Larsson), S.L. (Shuai Li), A.L. (Annika Lindblom), M.L., J.L. (Jolanta Lissowska), A.L. (Artitaya Lophatananon), R.J.M., A.M., S.M. (Siranoush Manoukian), S.M. (Sara Margolin), K.M. (Keitaro Matsuo), K.M. (Kyriaki Michailidou), R.L.M., N.A.M.T., K.R.M., R.A.M., W.G.N., K.M.O., N.O., O.I.O., M.I.P., S.K.P., T.-W.P.-S., A.V.P., P.P., D.P.-K., K.P., M.U.R., G.R., J.R., E.S., D.P.S., E.J.S., C.G.S., S.S., X.-O.S., K.S., J.S. (Jacques Simard), M.C.S., J.S. (Jennifer Stone), J.A.T., S.-H.T., L.R.T., M.B.T., D.T., C.M.V., M.V.H., J.V., C.R.W., A.W., T.Y., C.H.Y., W.Z., M.H., J.L. (Jingmei Li), ABCTB Investigators, KConFab Investigators, SGBCC Investigators, and MyBrCa Investigators; Analysis and interpretation of data: P.J.H., M.H.G., C.K.Y.L., R.J.Y.L., and J.L. (Jingmei Li) Drafting of the manuscript: J.L. (Jingmei Li), P.J.H., and C.K.Y.L. Revising of manuscript for important content: All. Final approval of the version submitted for publication: All. All authors have read and agreed to the published version of the manuscript.
Funding
This study was funded by the Agency for Science, Technology and Research (A*STAR) and Precision Health Research Singapore Clinical Implementation Pilot (PRECISE CIP). The breast cancer genome-wide association analyses in BCAC were supported by the Government of Canada through Genome Canada and the Canadian Institutes of Health Research, the ‘Ministère de l’Économie, de la Science et de l’Innovation du Québec’ through Genome Québec and grant PSR-SIIRI-701, The National Institutes of Health (U19 CA148065, X01HG007492), Cancer Research UK (C1287/A10118, C1287/A16563, C1287/A10710), and The European Union (HEALTH-F2-2009-223175 and H2020 633784 and 634935). All BCAC studies and funders are listed in the Supplementary Materials.
Institutional Review Board Statement
This study was approved by the A*STAR Institutional Review Board (reference number: 2022-041, approved on 22 April 2022).
Informed Consent Statement
Informed consent was obtained by the individual studies that contributed data to the Breast Cancer Association Consortium (BCAC). The present study was conducted in accordance with the principles outlined in the Declaration of Helsinki. For the secondary analysis of medical records, the requirement for informed consent was waived.
Data Availability Statement
The data used in our analyses are available upon reasonable request through BCAC, subject to data access committee approval.
Acknowledgments
ABCTB Investigators: Christine Clarke, Deborah Marsh, Rodney Scott, Robert Baxter, Desmond Yip, Jane Carpenter, Alison Davis, Nirmala Pathmanathan, Peter Simpson, J. Dinny Graham, and Mythily Sachchithananthan. kConFab Investigators: Morteza Aghmesheh, David Amor, Lesley Andrews, Yoland Antill, Shane Armitage, Leanne Arnold, Rosemary Balleine, Agnes Bankier, Patti Bastick, Jonathan Beesley, John Beilby, Barbara Bennett, Ian Bennett, Geoffrey Berry, Anneke Blackburn, Michael Bogwitz, Meagan Brennan, Melissa Brown, Michael Buckley, Matthew Burgess, Jo Burke, Phyllis Butow, Keith Byron, David Callen, Ian Campbell, Deepa Chauhan, Georgia Chenevix-Trench, Alice Christian, Christine Clarke, Alison Colley, Dick Cotton, Ashley Crook, James Cui, Bronwyn Culling, Margaret Cummings, Sarah-Jane Dawson, Anna DeFazio, Martin Delatycki, Rebecca Dickson, Joanne Dixon, Alexander Dobrovic, Tracy Dudding, Ted Edkins, Stacey Edwards, Maurice Eisenbruch, Gelareh Farshid, Susan Fawcett, Andrew Fellows, Georgina Fenton, Michael Field, Frank Firgaira, James Flanagan, Jean Fleming, Peter Fong, John Forbes, Stephen Fox, Juliet French, Michael Friedlander, Clara Gaff, Mac Gardner, Mike Gattas, Peter George, Graham Giles, Grantley Gill, Jack Goldblatt, Sian Greening, Scott Grist, Eric Haan, Kate Hardie, Marion Harris, Stewart Hart, Nick Hayward, Sue Healey, Louise Heiniger, John Hopper, Evelyn Humphrey, Clare Hunt, Paul James, Mark Jenkins, Alison Jones, Rick Kefford, Alexa Kidd, Belinda Kiely, Judy Kirk, Jessica Koehler, James Kollias, Serguei Kovalenko, Sunil Lakhani, Amanda Leaming, Jennifer Leary, Jacqueline Lim, Geoff Lindeman, Lara Lipton, Liz Lobb, Graham Mann, Deborah Marsh, Sue Anne McLachlan, Bettina Meiser, Cliff Meldrum, Roger Milne, Gillian Mitchell, Beth Newman, Sophie Nightingale, Shona O’Connell, Imelda O’Loughlin, Richard Osborne, Nick Pachter, Briony Patterson, Lester Peters, Kelly Phillips, Melanie Price, Lynne Purser, Tony Reeve, Jeanne Reeve, Robert Richards, Edwina Rickard, Bridget Robinson, Barney Rudzki, Mona Saleh, Elizabeth Salisbury, Joe Sambrook, Christobel Saunders, Jodi Saunus, Robyn Sayer, Elizabeth Scott, Rodney Scott, Clare Scott, Ram Seshadri, Adrienne Sexton, Raghwa Sharma, Andrew Shelling, Peter Simpson, Melissa Southey, Amanda Spurdle, Graeme Suthers, Pamela Sykes, Donna Taylor, Jessica Taylor, Benjamin Thierry, Ella Thompson, Heather Thorne, Sharron Townshend, Alison Trainer, Lan Tran, Kathy Tucker, Janet Tyler, Jane Visvader, Logan Walker, Ian Walpole, Robin Ward, Paul Waring, Bev Warner, Graham Warren, Rachael Williams, Judy Wilson, Ingrid Winship, Kathy Wu, and Mary Ann Young. MyBrCa Investigators: Kartini Rahmat, See Mee Hoong, Associate Suniza Jamaris, Tania Islam, Hamizah Saat, Jeannie Wong Hsiu Ding, Tai Mei Chee, Shivaani Mariapun, and Yoon Sook-Yee. SGBCC Investigators: Benita Kiat-Tee Tan, Veronique Kiak Mien Tan, Geok Hoon Lim, Ern Yu Tan, Su-Ming Tan, and Philip Tsau Choong Iau.
Conflicts of Interest
All authors declare that the research was conducted in the absence of any commercial or financial relationships that could be construed as a potential conflict of interest.
References
- Bevers, T.B.; Ward, J.H.; Arun, B.K.; Colditz, G.A.; Cowan, K.H.; Daly, M.B.; Garber, J.E.; Gemignani, M.L.; Gradishar, W.J.; Jordan, J.A.; et al. Breast Cancer Risk Reduction, Version 2.2015. J. Natl. Compr. Cancer Netw. 2015, 13, 880–915. [Google Scholar] [CrossRef]
- Practice Bulletin Number 179: Breast Cancer Risk Assessment and Screening in Average-Risk Women. Obstet. Gynecol. 2017, 130, e1–e16. [CrossRef]
- Mbuya-Bienge, C.; Pashayan, N.; Kazemali, C.D.; Lapointe, J.; Simard, J.; Nabi, H. A Systematic Review and Critical Assessment of Breast Cancer Risk Prediction Tools Incorporating a Polygenic Risk Score for the General Population. Cancers 2023, 15, 5380. [Google Scholar] [CrossRef]
- Ho, P.J.; Ho, W.K.; Khng, A.J.; Yeoh, Y.S.; Tan, B.K.; Tan, E.Y.; Lim, G.H.; Tan, S.M.; Tan, V.K.M.; Yip, C.H.; et al. Overlap of high-risk individuals predicted by family history, and genetic and non-genetic breast cancer risk prediction models: Implications for risk stratification. BMC Med. 2022, 20, 150. [Google Scholar] [CrossRef] [PubMed]
- Ho, P.J.; Lim, E.H.; Hartman, M.; Wong, F.Y.; Li, J. Breast cancer risk stratification using genetic and non-genetic risk assessment tools for 246,142 women in the UK Biobank. Genet. Med. 2023, 25, 100917. [Google Scholar] [CrossRef] [PubMed]
- Roux, A.; Cholerton, R.; Sicsic, J.; Moumjid, N.; French, D.P.; Giorgi Rossi, P.; Balleyguier, C.; Guindy, M.; Gilbert, F.J.; Burrion, J.-B.; et al. Study protocol comparing the ethical, psychological and socio-economic impact of personalised breast cancer screening to that of standard screening in the “My Personal Breast Screening” (MyPeBS) randomised clinical trial. BMC Cancer 2022, 22, 507. [Google Scholar] [CrossRef]
- Shieh, Y.; Eklund, M.; Madlensky, L.; Sawyer, S.D.; Thompson, C.K.; Stover Fiscalini, A.; Ziv, E.; van’t Veer, L.J.; Esserman, L.J.; Tice, J.A. Breast Cancer Screening in the Precision Medicine Era: Risk-Based Screening in a Population-Based Trial. J. Natl. Cancer Inst. 2017, 109, djw290. [Google Scholar] [CrossRef] [PubMed]
- Liu, J.; Ho, P.J.; Tan, T.H.L.; Yeoh, Y.S.; Chew, Y.J.; Mohamed Riza, N.K.; Khng, A.J.; Goh, S.A.; Wang, Y.; Oh, H.B.; et al. BREAst screening Tailored for HEr (BREATHE)-A study protocol on personalised risk-based breast cancer screening programme. PLoS ONE 2022, 17, e0265965. [Google Scholar] [CrossRef]
- Ho, P.J.; Liu, J.; Goh, S.-A.; Khng, A.J.; Mohamed Riza, N.K.; Chew, Y.J.; Ong, D.L.S.; Wang, Y.; Hew, F.M.; Jagmohan, P.; et al. Profile of the BREATHE cohort for risk-based breast screening in Singapore. Sci. Rep. 2025, 15, 35424. [Google Scholar] [CrossRef]
- Bevers, T.B.; Niell, B.L.; Baker, J.L.; Bennett, D.L.; Bonaccio, E.; Camp, M.S.; Chikarmane, S.; Conant, E.F.; Eghtedari, M.; Flanagan, M.R.; et al. NCCN Guidelines®® Insights: Breast Cancer Screening and Diagnosis, Version 1.2023. J. Natl. Compr. Cancer Netw. 2023, 21, 900–909. [Google Scholar] [CrossRef]
- Owens, D.K.; Davidson, K.W.; Krist, A.H.; Barry, M.J.; Cabana, M.; Caughey, A.B.; Doubeni, C.A.; Epling, J.W.; Kubik, M.; Landefeld, C.S.; et al. Medication Use to Reduce Risk of Breast Cancer. JAMA 2019, 322, 857–867. [Google Scholar] [CrossRef] [PubMed]
- Schnitt, S.J. Diagnosis of ductal carcinoma in situ in an era of de-escalation of therapy. Mod. Pathol. 2021, 34, 1–7. [Google Scholar] [CrossRef]
- Leonard, G.D.; Swain, S.M. Ductal Carcinoma In Situ, Complexities and Challenges. JNCI J. Natl. Cancer Inst. 2004, 96, 906–920. [Google Scholar] [CrossRef]
- Allred, D.C. Ductal Carcinoma In Situ: Terminology, Classification, and Natural History. JNCI Monogr. 2010, 2010, 134–138. [Google Scholar] [CrossRef]
- Claus, E.B.; Stowe, M.; Carter, D. Breast Carcinoma In Situ: Risk Factors and Screening Patterns. JNCI J. Natl. Cancer Inst. 2001, 93, 1811–1817. [Google Scholar] [CrossRef][Green Version]
- Vatovec, C.; Erten, M.Z.; Kolodinsky, J.; Brown, P.; Wood, M.; James, T.; Sprague, B.L. Ductal carcinoma in situ: A brief review of treatment variation and impacts on patients and society. Crit. Rev. Eukaryot. Gene Expr. 2014, 24, 281–286. [Google Scholar] [CrossRef] [PubMed]
- Petridis, C.; Brook, M.N.; Shah, V.; Kohut, K.; Gorman, P.; Caneppele, M.; Levi, D.; Papouli, E.; Orr, N.; Cox, A.; et al. Genetic predisposition to ductal carcinoma in situ of the breast. Breast Cancer Res. 2016, 18, 22. [Google Scholar] [CrossRef]
- Breast Cancer Association, C. Commonly studied single-nucleotide polymorphisms and breast cancer: Results from the Breast Cancer Association Consortium. J. Natl. Cancer Inst. 2006, 98, 1382–1396. [Google Scholar] [CrossRef]
- Amos, C.I.; Dennis, J.; Wang, Z.; Byun, J.; Schumacher, F.R.; Gayther, S.A.; Casey, G.; Hunter, D.J.; Sellers, T.A.; Gruber, S.B.; et al. The OncoArray Consortium: A Network for Understanding the Genetic Architecture of Common Cancers. Cancer Epidemiol. Biomark. Prev. 2017, 26, 126–135. [Google Scholar] [CrossRef] [PubMed]
- Gail, M.H.; Brinton, L.A.; Byar, D.P.; Corle, D.K.; Green, S.B.; Schairer, C.; Mulvihill, J.J. Projecting individualized probabilities of developing breast cancer for white females who are being examined annually. J. Natl. Cancer Inst. 1989, 81, 1879–1886. [Google Scholar] [CrossRef]
- Mavaddat, N.; Michailidou, K.; Dennis, J.; Lush, M.; Fachal, L.; Lee, A.; Tyrer, J.P.; Chen, T.H.; Wang, Q.; Bolla, M.K.; et al. Polygenic Risk Scores for Prediction of Breast Cancer and Breast Cancer Subtypes. Am. J. Hum. Genet. 2019, 104, 21–34. [Google Scholar] [CrossRef]
- Chang, C.C.; Chow, C.C.; Tellier, L.C.A.M.; Vattikuti, S.; Purcell, S.M.; Lee, J.J. Second-generation PLINK: Rising to the challenge of larger and richer datasets. Gigascience 2015, 4, 7. [Google Scholar] [CrossRef]
- Wen, W.; Shu, X.O.; Guo, X.; Cai, Q.; Long, J.; Bolla, M.K.; Michailidou, K.; Dennis, J.; Wang, Q.; Gao, Y.T.; et al. Prediction of breast cancer risk based on common genetic variants in women of East Asian ancestry. Breast Cancer Res. 2016, 18, 124. [Google Scholar] [CrossRef]
- Sadatsafavi, M.; Saha-Chaudhuri, P.; Petkau, J. Model-Based ROC Curve: Examining the Effect of Case Mix and Model Calibration on the ROC Plot. Med. Decis. Mak. 2021, 42, 487–499. [Google Scholar] [CrossRef]
- Monticciolo, D.L.; Malak, S.F.; Friedewald, S.M.; Eby, P.R.; Newell, M.S.; Moy, L.; Destounis, S.; Leung, J.W.T.; Hendrick, R.E.; Smetherman, D. Breast Cancer Screening Recommendations Inclusive of All Women at Average Risk: Update from the ACR and Society of Breast Imaging. J. Am. Coll. Radiol. 2021, 18, 1280–1288. [Google Scholar] [CrossRef]
- Garcia-Closas, M.; Chatterjee, N.; Swerdlow, A.J.; Gail, M.H.; Jones, M.E.; Schoemaker, M.J.; Coulson, P.; Orr, N.; Ahearn, T.; Zhang, Y.; et al. Comparative Validation of Breast Cancer Risk Prediction Models and Projections for Future Risk Stratification. JNCI J. Natl. Cancer Inst. 2020, 112, 278–285. [Google Scholar] [CrossRef]
- Gao, Y.; Li, S.; Jin, Y.; Zhou, L.; Sun, S.; Xu, X.; Li, S.; Yang, H.; Zhang, Q.; Wang, Y. An Assessment of the Predictive Performance of Current Machine Learning–Based Breast Cancer Risk Prediction Models: Systematic Review. JMIR Public Health Surveill. 2022, 8, e35750. [Google Scholar] [CrossRef] [PubMed]
- Zheng, Y.; Li, J.; Wu, Z.; Li, H.; Cao, M.; Li, N.; He, J. Risk prediction models for breast cancer: A systematic review. BMJ Open 2022, 12, e055398. [Google Scholar] [CrossRef]
- Kasperski, A. Life Entrapped in a Network of Atavistic Attractors: How to Find a Rescue. Int. J. Mol. Sci. 2022, 23, 4017. [Google Scholar] [CrossRef] [PubMed]
- Wang, J.; Li, B.; Luo, M.; Huang, J.; Zhang, K.; Zheng, S.; Zhang, S.; Zhou, J. Progression from ductal carcinoma in situ to invasive breast cancer: Molecular features and clinical significance. Signal Transduct. Target. Ther. 2024, 9, 83. [Google Scholar] [CrossRef] [PubMed]
- van den Broek, J.J.; Schechter, C.B.; van Ravesteyn, N.T.; Janssens, A.C.J.W.; Wolfson, M.C.; Trentham-Dietz, A.; Simard, J.; Easton, D.F.; Mandelblatt, J.S.; Kraft, P.; et al. Personalizing Breast Cancer Screening Based on Polygenic Risk and Family History. JNCI J. Natl. Cancer Inst. 2021, 113, 434–442. [Google Scholar] [CrossRef]
- Liu, L.; Zhou, P.; Hou, L.; Kao, C.; Zhang, Z.; Wang, D.; Yu, L.; Wang, F.; Wang, Y.; Yu, Z. Development and performance of female breast cancer incidence risk prediction models: A systematic review and meta-analysis. Ann. Med. 2025, 57, 2534522. [Google Scholar] [CrossRef]
- Jiao, Y.; Truong, T.; Eon-Marchais, S.; Mebirouk, N.; Caputo, S.M.; Dondon, M.-G.; Karimi, M.; Le Gal, D.; Beauvallet, J.; Le Floch, É.; et al. Association and performance of polygenic risk scores for breast cancer among French women presenting or not a familial predisposition to the disease. Eur. J. Cancer 2023, 179, 76–86. [Google Scholar] [CrossRef] [PubMed]
- Yiangou, K.; Mavaddat, N.; Dennis, J.; Zanti, M.; Wang, Q.; Bolla, M.K.; Abubakar, M.; Ahearn, T.U.; Andrulis, I.L.; Anton-Culver, H.; et al. Polygenic score distribution differences across European ancestry populations: Implications for breast cancer risk prediction. Breast Cancer Res. 2024, 26, 189. [Google Scholar] [CrossRef] [PubMed]
- Vickers, A.J.; Van Calster, B.; Steyerberg, E. Decision Curves, Calibration, and Subgroups. J. Clin. Oncol. 2017, 35, 472–473. [Google Scholar] [CrossRef] [PubMed]
- Zeggini, E.; Fritsche, L.G.; Ma, Y.; Zhang, D.; Salvatore, M.; Lee, S.; Zhou, X.; Mukherjee, B. On cross-ancestry cancer polygenic risk scores. PLoS Genet. 2021, 17, e1009670. [Google Scholar] [CrossRef]
- Zheng, Y.; Allman, R.; Spaeth, E.; Lai, J.; Gross, S.J.; Hopper, J.L. A streamlined model for use in clinical breast cancer risk assessment maintains predictive power and is further improved with inclusion of a polygenic risk score. PLoS ONE 2021, 16, e0245375. [Google Scholar] [CrossRef]
Disclaimer/Publisher’s Note: The statements, opinions and data contained in all publications are solely those of the individual author(s) and contributor(s) and not of MDPI and/or the editor(s). MDPI and/or the editor(s) disclaim responsibility for any injury to people or property resulting from any ideas, methods, instructions or products referred to in the content. |
© 2025 by the authors. Licensee MDPI, Basel, Switzerland. This article is an open access article distributed under the terms and conditions of the Creative Commons Attribution (CC BY) license (https://creativecommons.org/licenses/by/4.0/).