Detection of Protein and Metabolites in Cancer Analyses by MALDI 2000–2025
Simple Summary
Abstract
1. Introduction
1.1. Cancer Metabolism
1.2. Importance of Metabolite Detection in Cancer
1.3. Role of Mass Spectrometry
1.4. Why MALDI?
2. MALDI Technology Overview
2.1. Fundamentals of MALDI
2.2. Ionization Process and Matrix Types
2.3. Improvements from 2000 to 2025
2.4. Comparison with Other MS Techniques
3. Detection of Cancer Metabolites by MALDI from 2000–2025
3.1. Year 2000
3.2. Year 2001
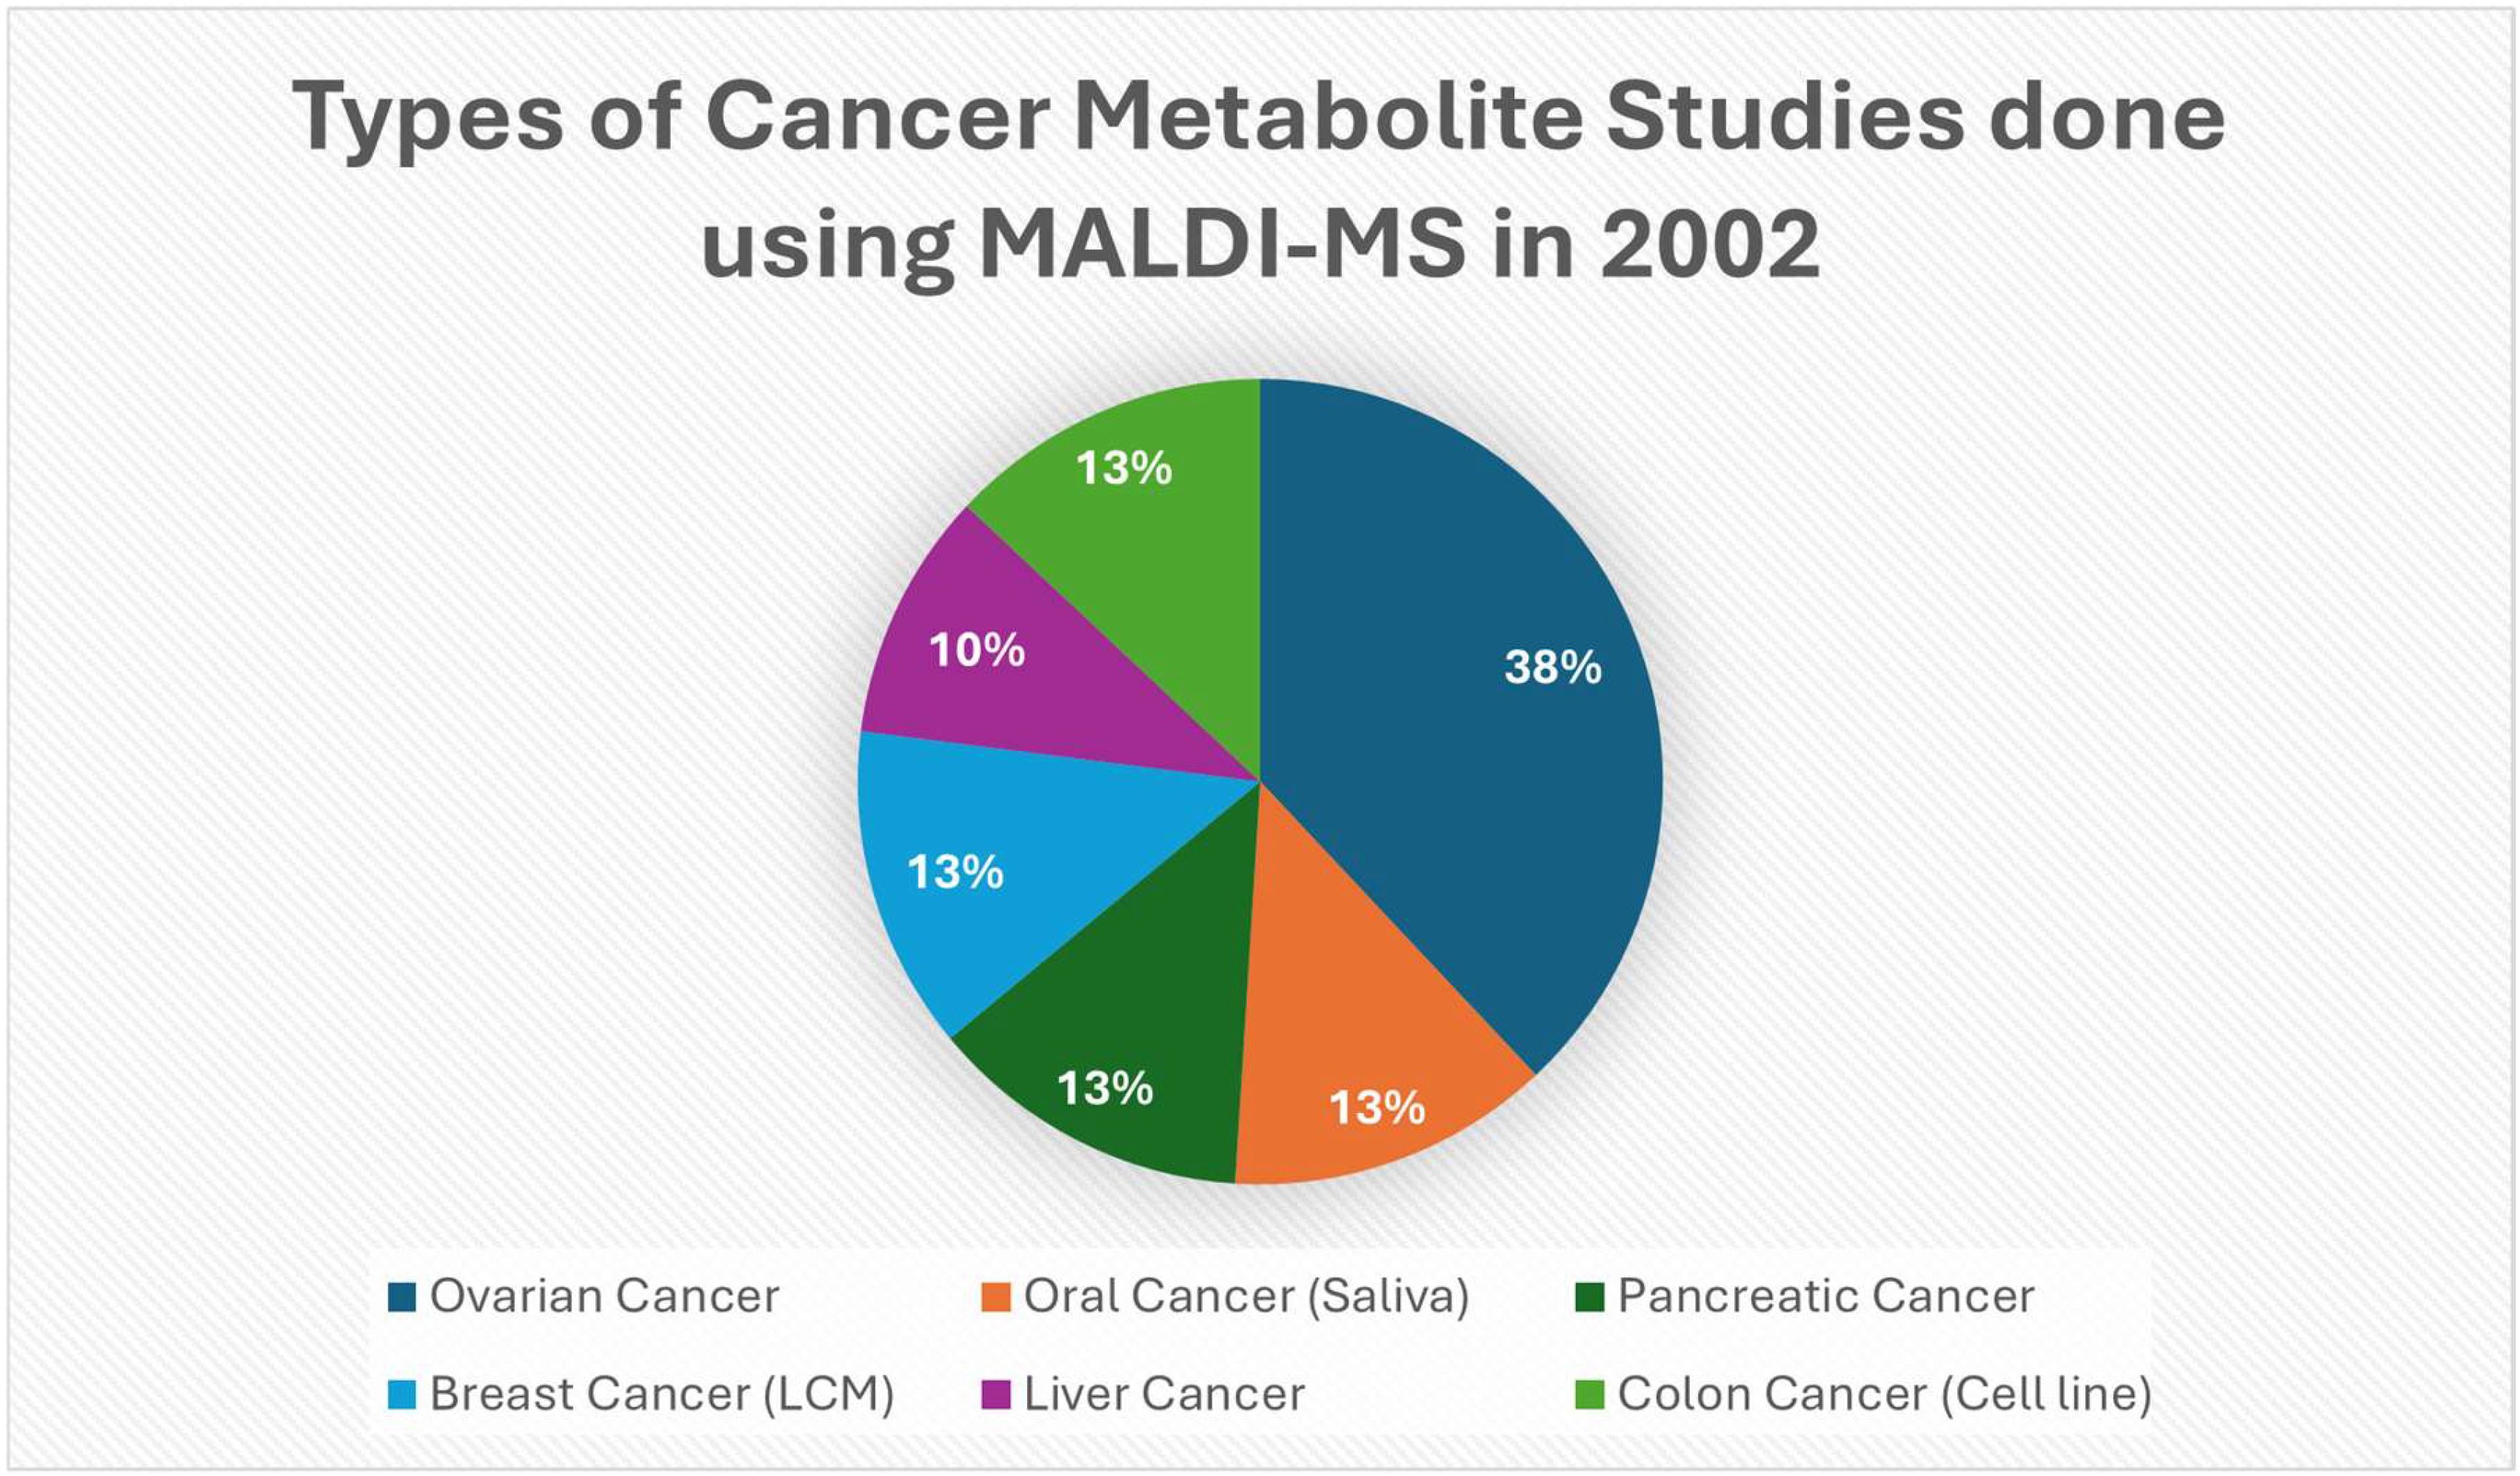
3.3. Year 2002
| No. | Author | Application | Result |
|---|---|---|---|
| 1 | Petricoin EF et al., 2002 [46] | SELDI serum proteomic profiling for ovarian cancer screening. | Identified a proteomic pattern in the serum that differentiated ovarian cancer patients from healthy patients. |
| 2 | Chen YC et al., 2002 [47] | Direct MALDI-TOF profiling of saliva from oral cancer patients and healthy patients. | Found altered saliva MALDI profiles with potential as a fast, non-invasive screening approach for oral cancer |
| 3 | Ball G et al., 2002 [48] | SELDI spectra and machine learning (ANN) to classify tumor types from proteomic patterns. | Showed that combining SELDI profiles with pattern-recognition could classify tumor sample. |
| 4 | Petricoin EF et al., 2002 [49] | SELDI serum profiling for prostate cancer detection. | Found spectral patterns that separated prostate cancer patients from non-cancerous patients, which helped popularize peptide-fingerprint approaches for cancer detection. |
3.4. Year 2003
| No. | Author | Application | Result |
|---|---|---|---|
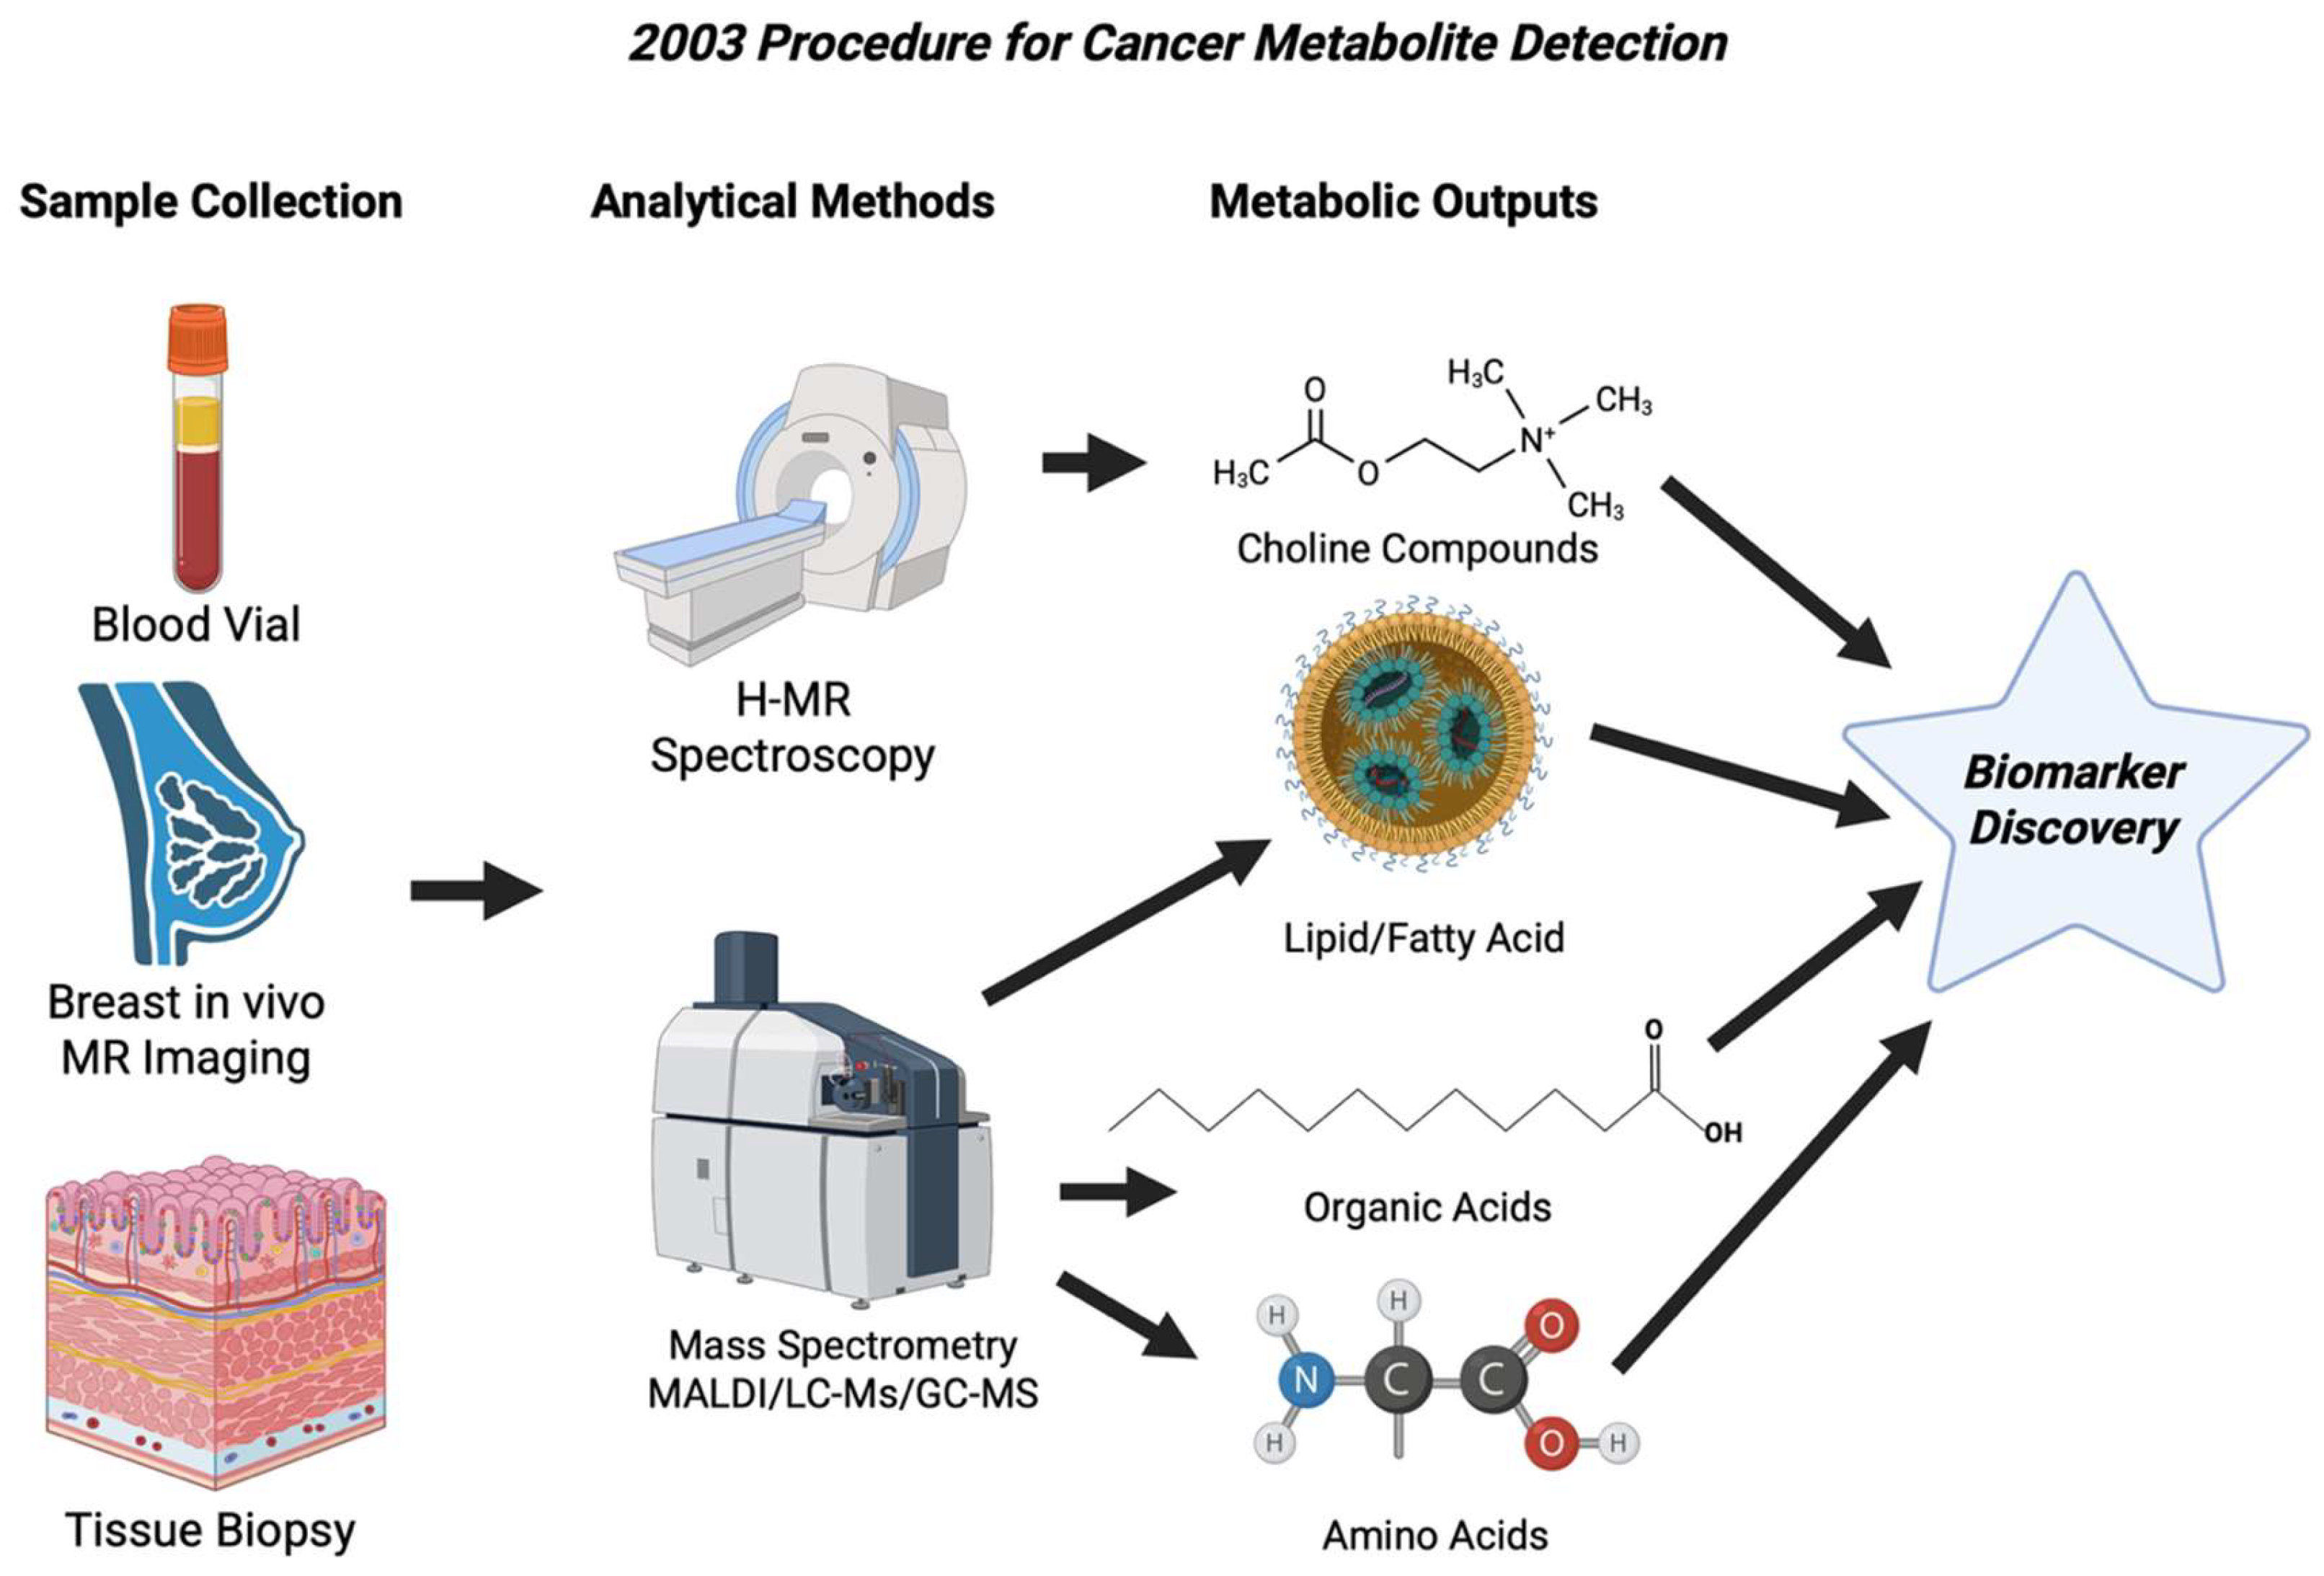
| 1 | Yanagisawa K et al., 2003 [54] | MALDI tissue profiling of non-small cell lung cancer (NSCLC). | Showed proteomic patterns that classify NSCLC subsets and correlate with nodal status, which was evidence that MALDI can have strong clinical relevance. |
| 2 | Schwartz SA et al., 2003 [55] | Analyzed methods for tissue preparation, matrix deposition, and practical methods for tissue analysis. | Provided the best methods for tissue handling and matrix application that improved reproducibility and sensitivity for MALDI in cancer studies. |
| 3 | Reyzer ML et al., 2003 [57] | MALDI-QqTOF imaging of drug candidates or metabolites in tissue. | Showed that MALDI can map small-molecule drugs and metabolites in tissue and correlate with LC-MS, which meant MALDI is applicable across proteins and, now, small molecules. |
| 4 | Campa MJ et al., 2003 [58] | MALDI/Peptide profiling and follow up of identification of tumor associated proteins in lung cancer | Identified tumor associated proteins like MIF and cyclophilin A from tissue profiling showing useful biological targets from MALDI profiling. |
3.5. Year 2004
| No. | Author | Application | Result |
|---|---|---|---|
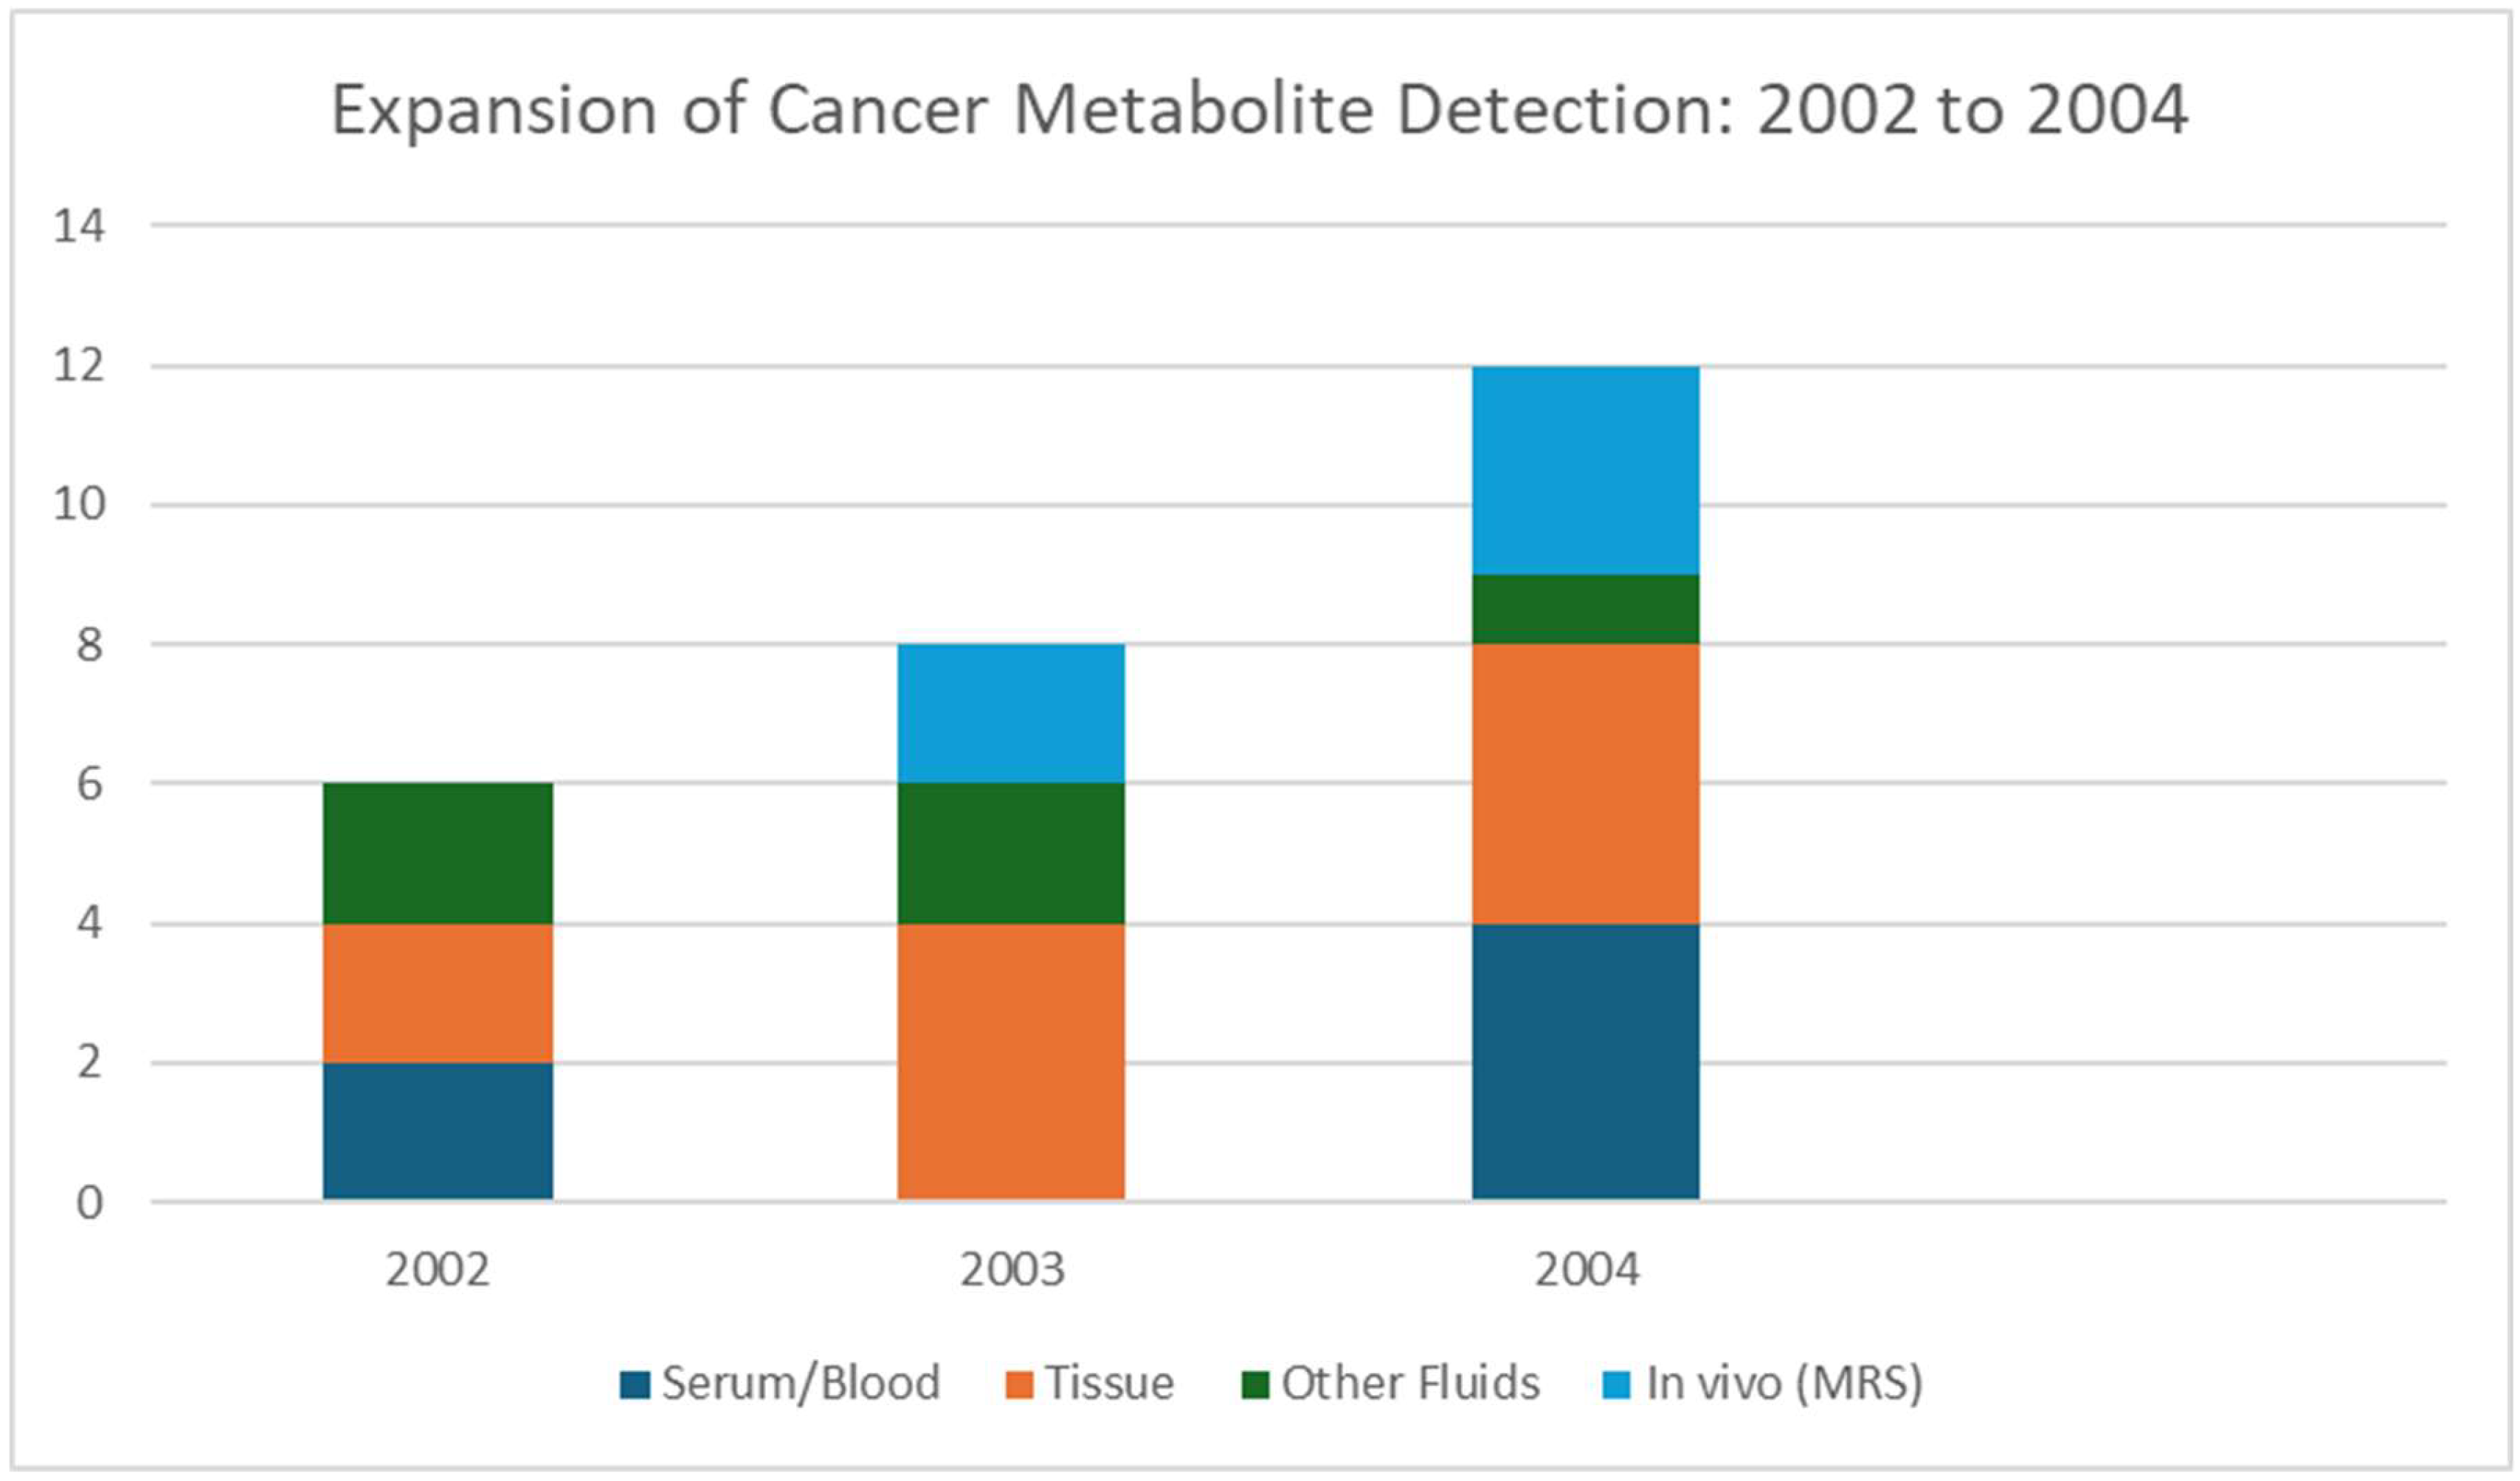
| 1 | Chaurand P et al., 2004 [62] | Coupling MALDI-IMS with histology in tumor tissues. | Showed practices relating MALDI molecular ion maps with stained histological images, thereby enabling region-specific molecular analysis, which was an important foundation for metabolite mapping. |
| 2 | Shen Z et al., 2004 [63] | Introduced DIOS for small-molecule detection. | Gave the proof of principle for matrix-free imaging of small molecules. It was a technical step towards metabolite imaging in cancer tissues. |
3.6. Year 2005
| No. | Author | Result | Application |
|---|---|---|---|
| 1 | Schwartz SA et al., 2005 [64] | Direct tissue MALDI profiling of human gliomas in clinical pathology. | Showed MALDI-based tissue study could classify gliomas and help prognosis. This led the path for MALDI clinical classifiers. |
| 2 | Jurchen JC et al., 2005 [66] | MALDI-MSI oversampling to boost laser-spot limits. | Found how to show features smaller than the laser beam, thereby boosting spatial resolution. This was important for mapping heterogenous tumor metabolite environments. |
| 3 | Rohner TC et al., 2005 [67] | Methods for MALDI-MSI of biological tissue sections. | Explanation of MALDI-MSI for tissues, which became the cornerstone for later metabolite and small-molecule cancer imaging. |
| 4 | Jackson SN et al., 2005 [68] | In situ characterization of phosphatidylcholines in tissue by MALDI-TOF. | Found on-tissue structural identification of lipid metabolites, which became a key feature applied to cancer lipidomics by MALDI-MSI. |

3.7. Year 2006
| No. | Author | Application | Result |
|---|---|---|---|
| 1 | Cornett DS et al., 2006 [71] | Histological MALDI profiling in breast cancer, particularly robotic matrix deposition on regions selected by pathologists. | Showed a process that increased cellular specificity and processing for tissue profiling which enabled region-specific molecular comparisons between tumor and stroma. |
| 2 | de Noo ME et al., 2006 [72] | MALDI-TOF serum protein profiling for colorectal cancer detection. | Large serum study showing high sensitivity and specificity around 95% for CR C classification using MALDI serum profiles. This strengthened serum profiling’s potential and the need for validation. |
| 3 | Aerni HR et al., 2006 [73] | Automated acoustic droplet matrix deposition for MALDI sample preparation. | Introduced high-processing, reproducible acoustic matrix deposition, which improved spot uniformity and sensitivity. This reduced analyte delocalization and improved the detection of low-abundance species. |
| 4 | Sampson JS et al., 2006 [74] | Hybrid MALDI-ESI demonstration for the generation and detection of multiply charged peptides and proteins by laser desorption electrospray ionization. | Found MALD-ESI as an alternate ionization method, boosting small molecules and multiply charged species detection, which provided more options for metabolite ionization and improved MS/MS performance. |

3.8. Year 2007
| No. | Author | Application | Result |
|---|---|---|---|
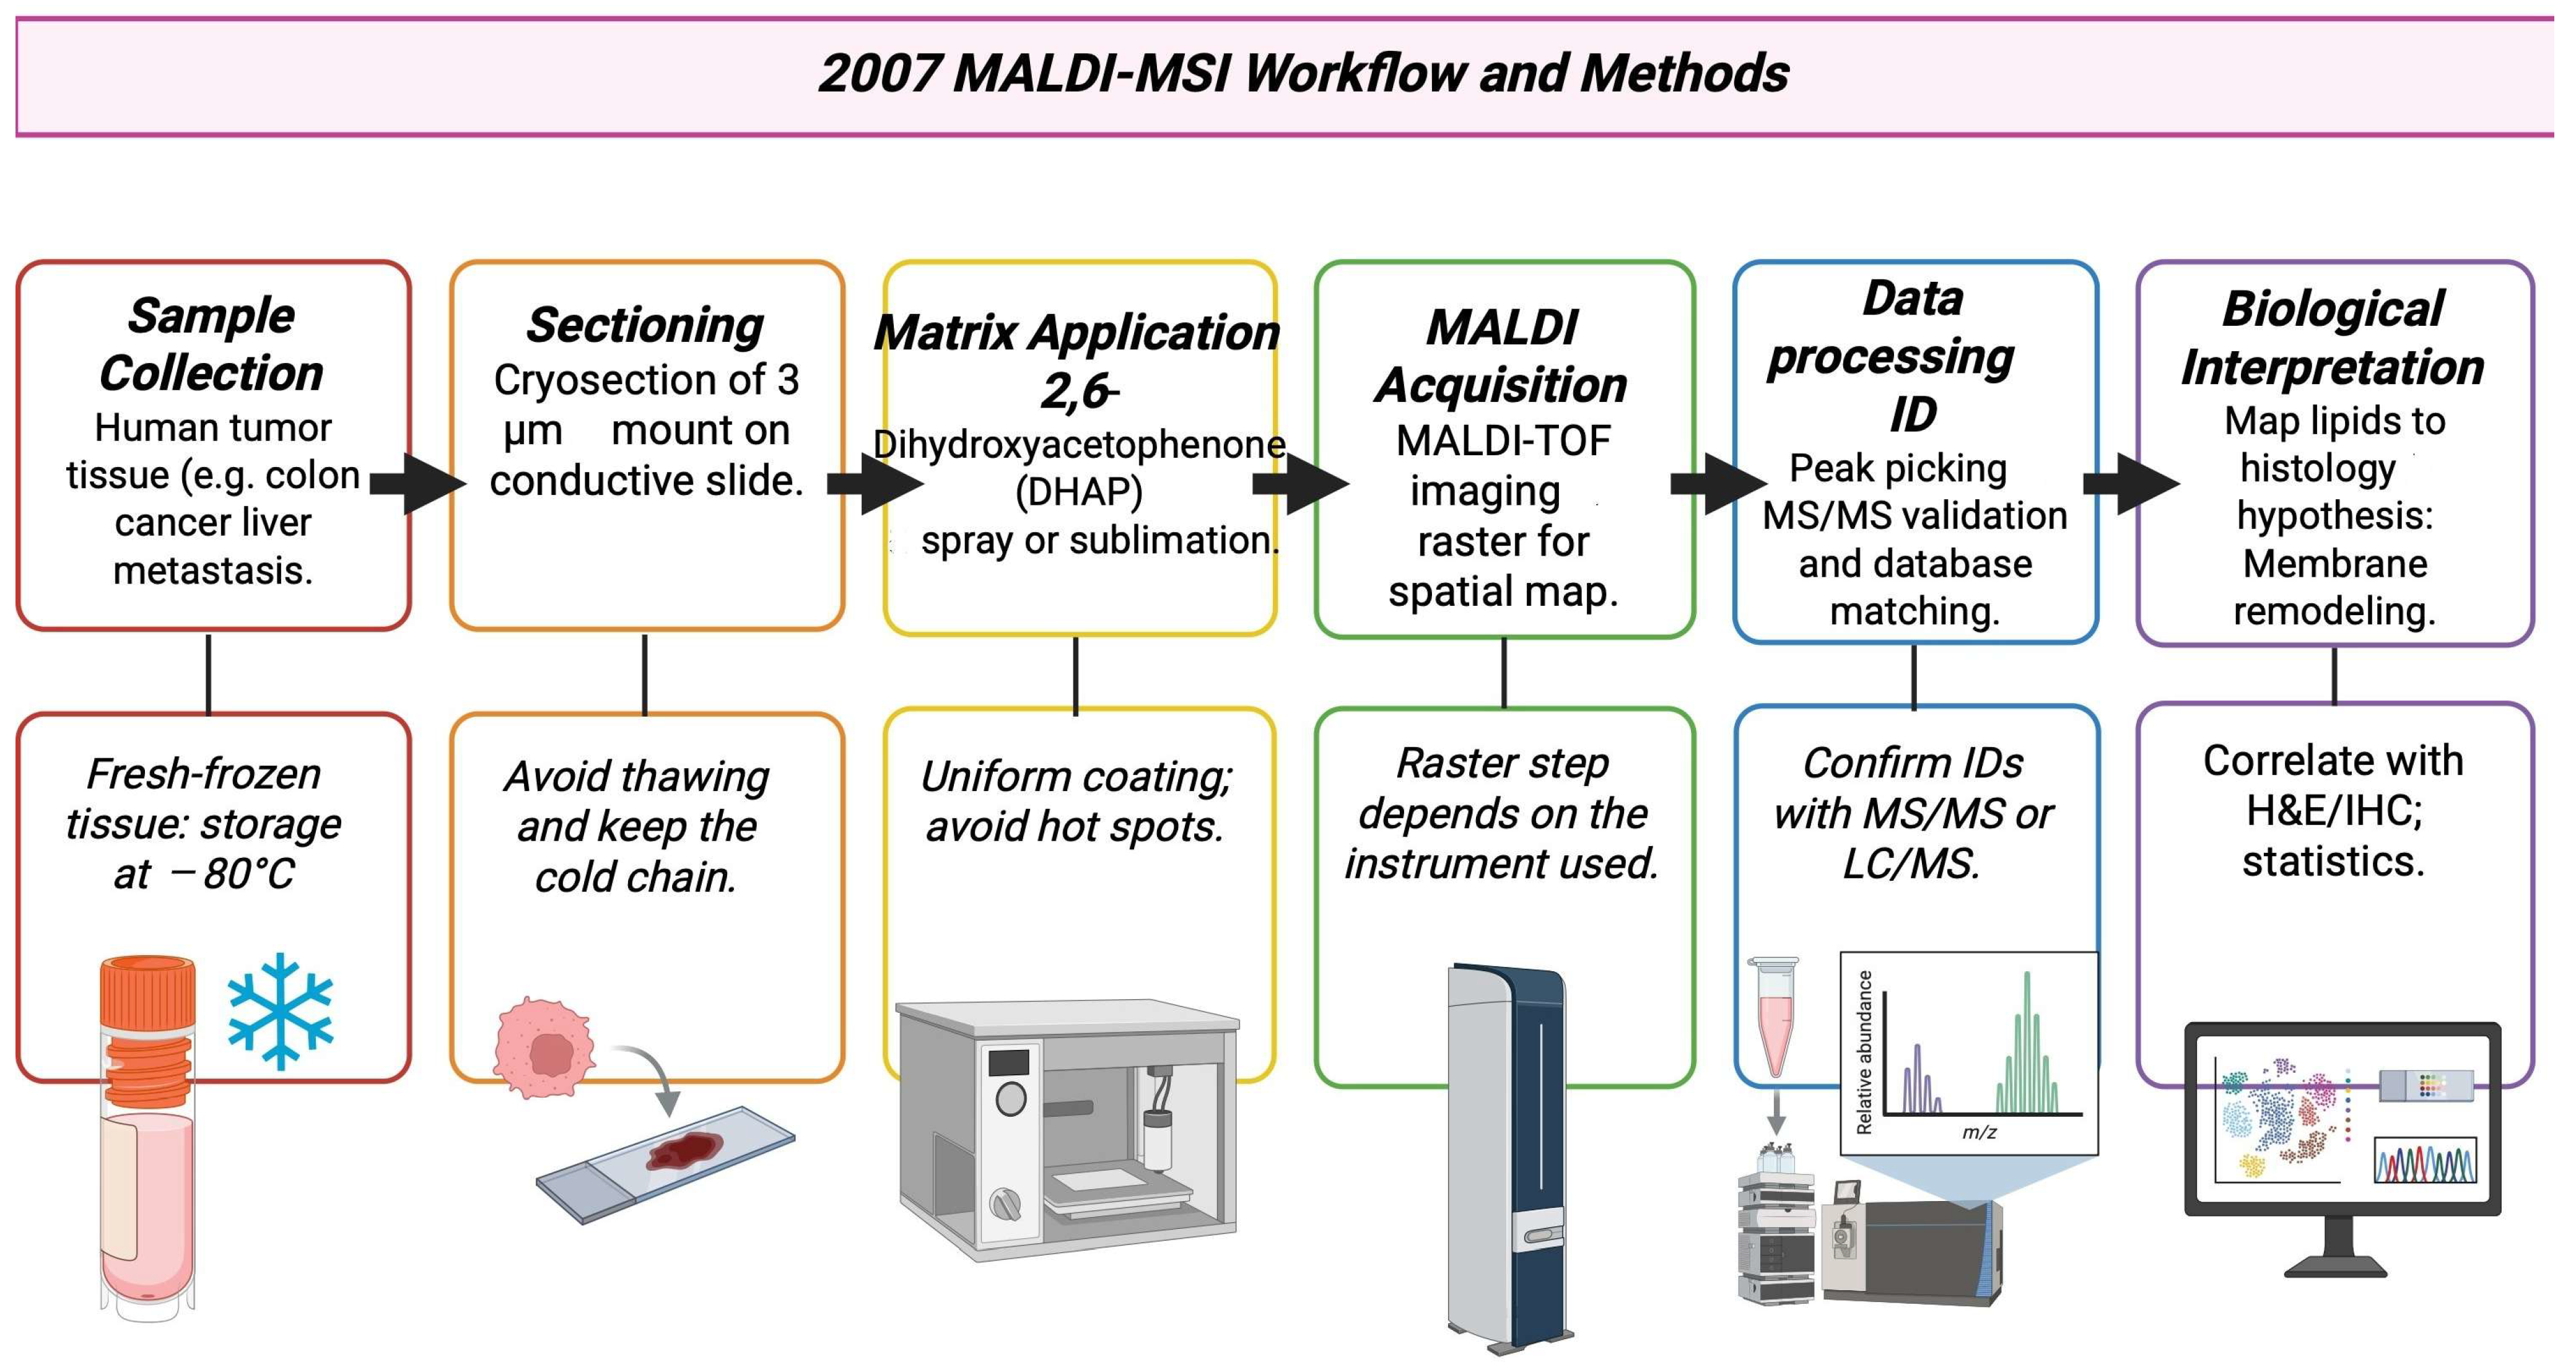
| 1 | Shimma S et al., 2007 [75] | MALDI-IMS mapping of phospholipids in colon cancer and liver metastasis. | Showed abnormal, region-specific distributions of phospholipid species in colon cancer metastasis and used MS/MS to support molecular identification. This was early proof that MALDI-IMS can map endogenous lipids in cancer tissue. |
| 2 | McDonnell LA et al., 2007 [76] | Detailed review of imaging mass spectrometry, covering analyte classes and instrumentation. | Compared ionization methods, matrices, spatial resolution and data analysis. This gave the best practices for lipid and metabolite imaging and became adopted in cancer studies. |
| 3 | Schwamborn K et al., 2007 [78] | Tissue profiling and classification in prostate cancer by MALDI imaging. | A clinical study with 22 prostate sections showed MALDI-IMS protein expression patterns that separate cancerous and non-cancerous regions. It was evidence of its clinical uses for tumor molecular mapping. |
| 4 | Altelaar AFM et al., 2007 [79] | A practical guide for MALDI imaging at cellular length scales. | Gave guidelines for sample preparation, matrix deposition, and measurement at near-cellular resolution; this made high quality, spatially resolved lipid and metabolite measurements in tumors more reproducible. |
3.9. Year 2008
| No. | Author | Application | Result |
|---|---|---|---|
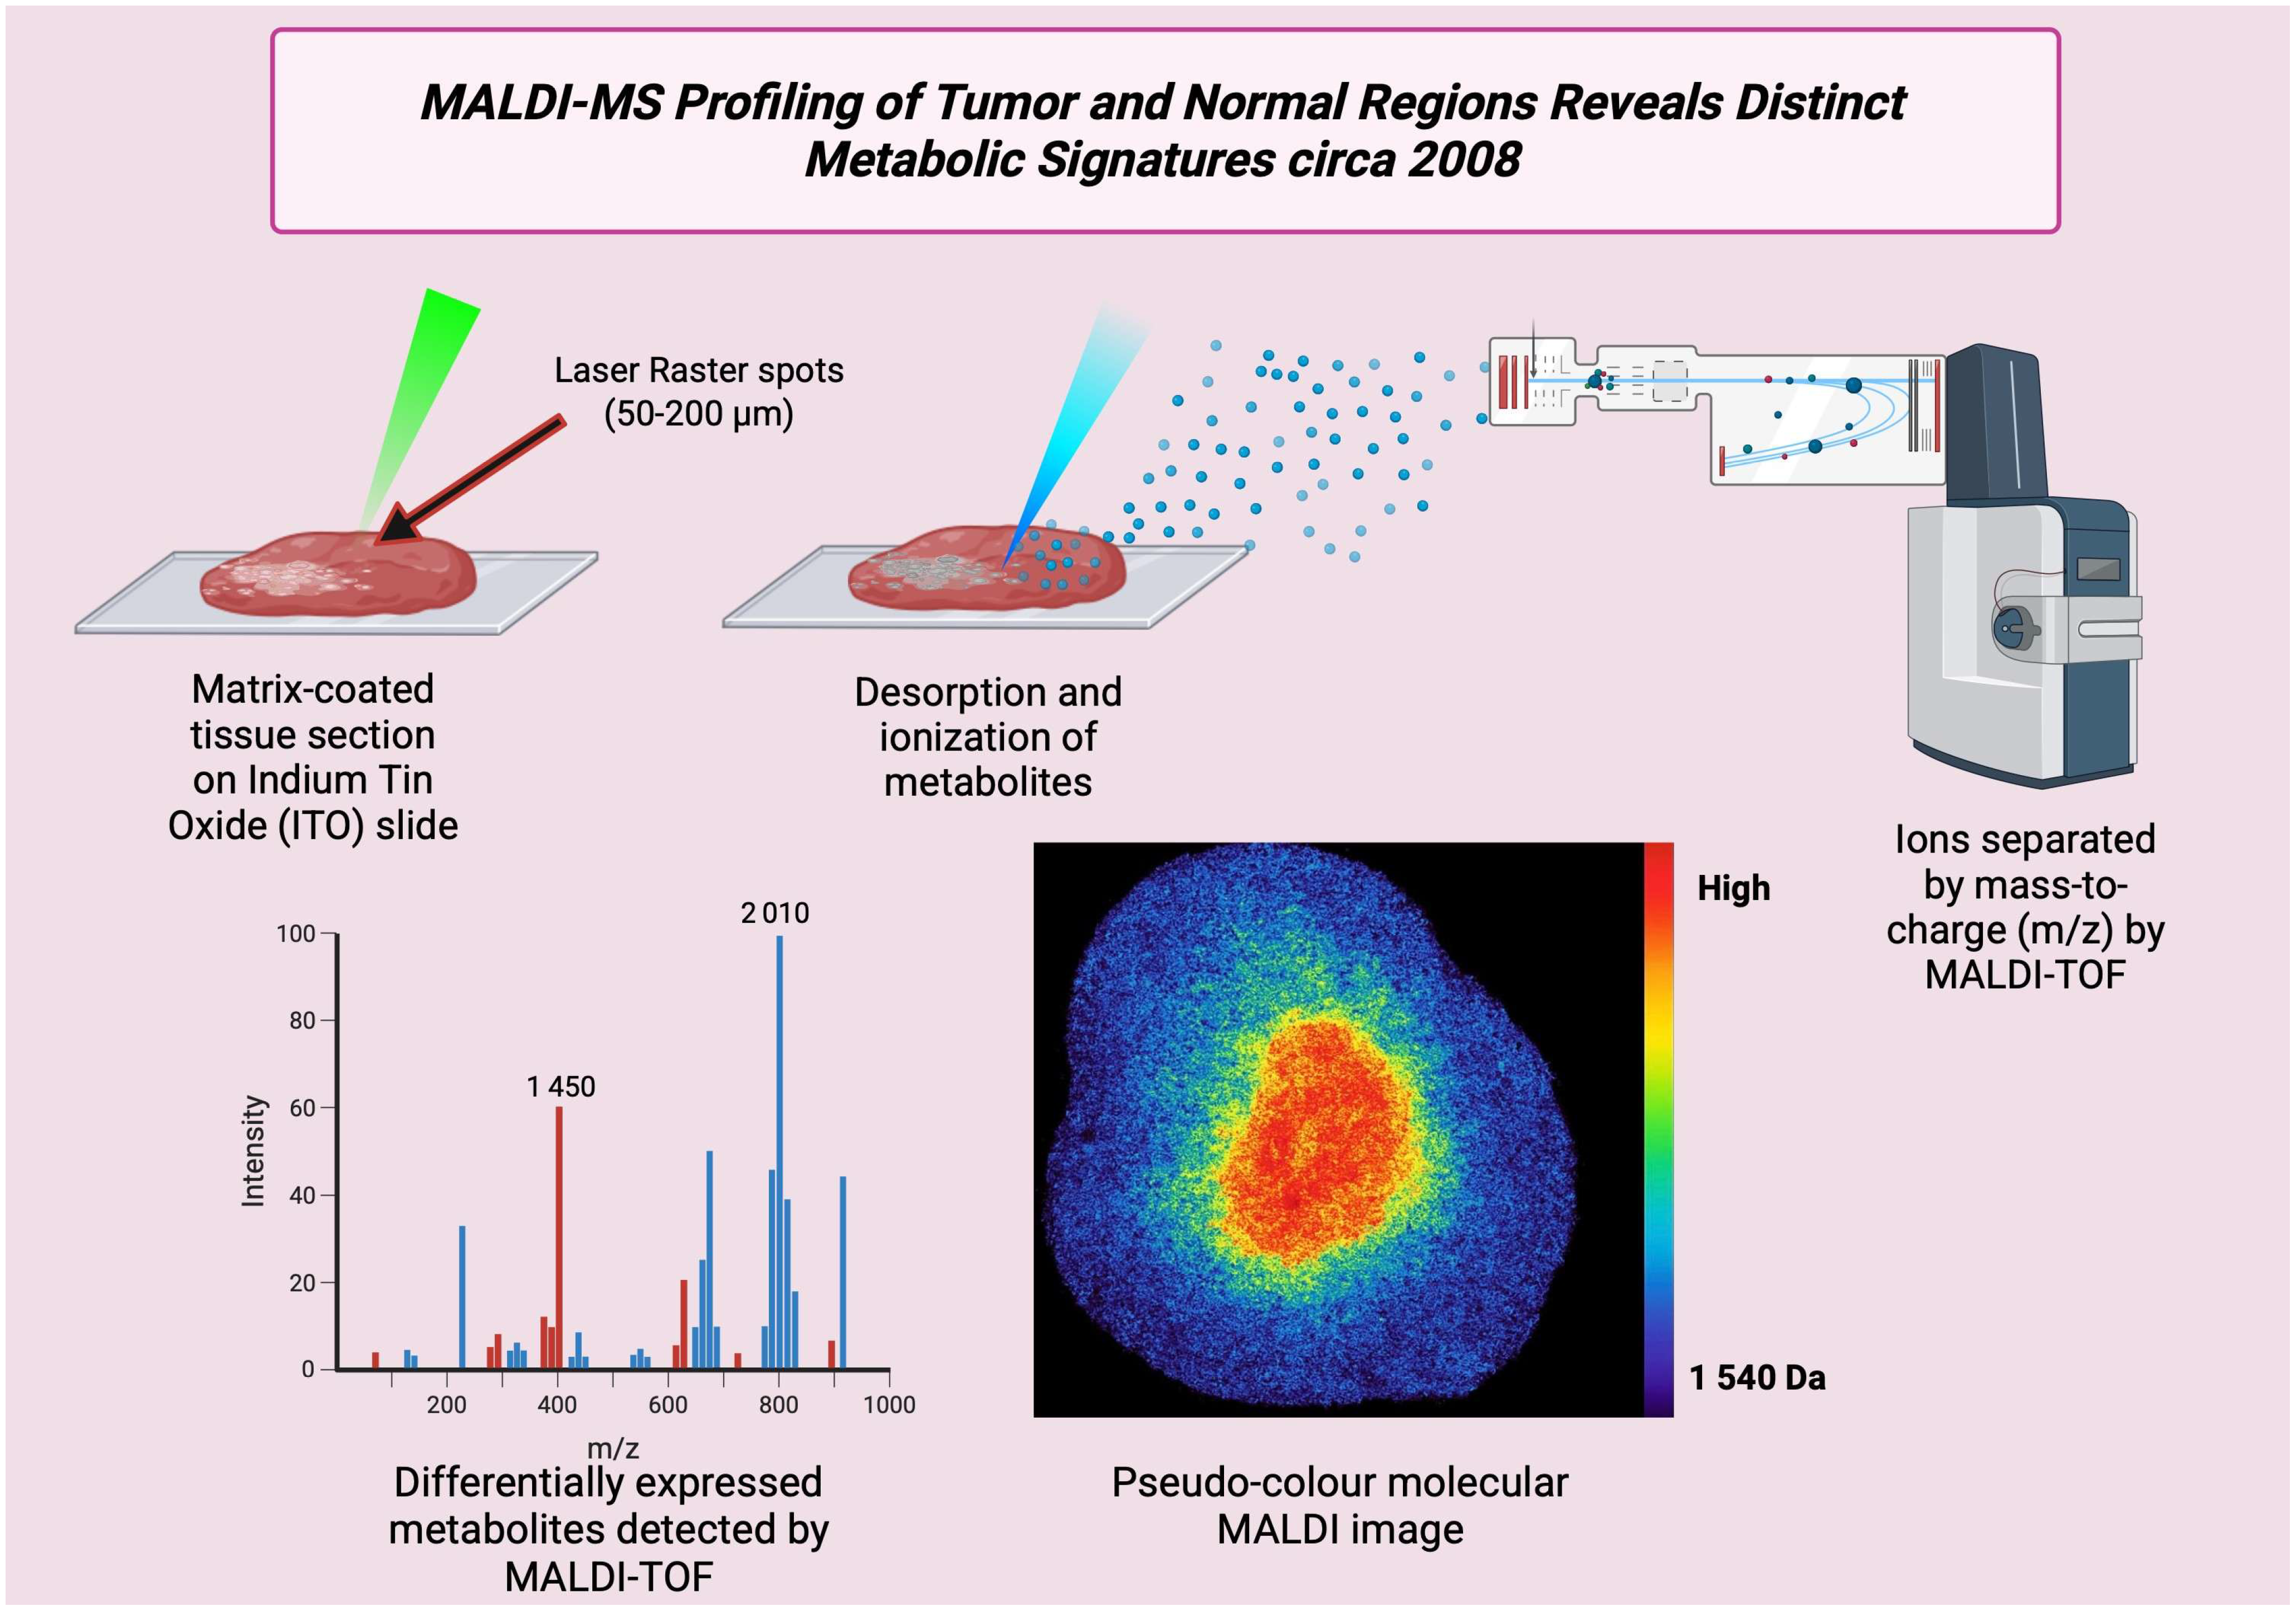
| 1 | Groseclose MR et al., 2008 [82] | On-tissue tryptic digestion and MALDI-IMS applied to FFPE tissue (lung tumors). | Found reproducible peptide and protein imaging across TMA cores and related it with histology. This opened the use of archived clinical FFPE cancer samples for MALDI studies. |
| 2 | Huamani J et al., 2008 [83] | Prostate tumor study that used MALDI to examine EGFR/VEGFR inhibitor AEE788 in xenografts. | Found intratumoral drug distribution (AEE788) related with different treatment responses between models; it was a clear case where MALDI detected a therapeutic and its spatial distribution in cancer tissue. |
| 3 | Deininger SO et al., 2008 [84] | Applied hierarchical analysis to MALDI imaging datasets from cancers to segment tissue regions. | Introduced approaches that separate MALDI images into tumor vs. non-tumor regions. This improved analysis of metabolite detection processes. |
| 4 | Chaurand P et al., 2008 [85] | Tested alcohol-preserved tissue (EPEE) as a replacement for FFPE for intact protein MALDI imaging. | Showed that alcohol preservation allows the imaging of intact proteins, thus avoiding formalin crosslinking problems. This gave a new way to analyze preserved cancer tissue. |
3.10. Year 2009
| No. | Author | Application | Result |
|---|---|---|---|
| 1 | Cristoni S et al., 2009 [87] | Testing a MALDI spectral reference in a NIST-style method for colorectal cancer tissue spectra to improve sample classification. | Showed that comparing patient MALDI spectra with a selected spectral library improved the classification of cancerous vs. normal colorectal tissue. This was a step toward standardized identification of metabolites when present in spectra. |
| 2 | Barkauskas DA et al., 2009 [88] | MALDI-FT-ICR profiling of released serum glycans from breast, ovarian, and prostate cancer | Developed statistical methods for high-resolution MALDI-FT-ICR glycan data and found glycan features that differentiate cancer and normal tissue, thus showing MALDI’s use in glycan metabolite detection in cancer |
| 3 | Cazares LH et al., 2009 [89] | MALDI-MS imaging of prostate tissue to find molecular signals that differentiate tumor and non-tumor regions. | Identified an m/z 4355 fragment (MEKK2) that differentiated prostate cancer from non-cancerous tissue. This was an important study that put forth processes used for metabolite imaging. |
| 4 | Acquadro E et al., 2009 [91] | MALDI-IMS detection of a MRI contrast agent in mouse tissue to show the detection of small molecules by MALDI. | Found that MALDI-IMS can detect, map, and identify a small molecule contrast agent; these methods were directly applied to the imaging of metabolites in tumor tissue. |

3.11. Year 2010
| No. | Author | Application | Result |
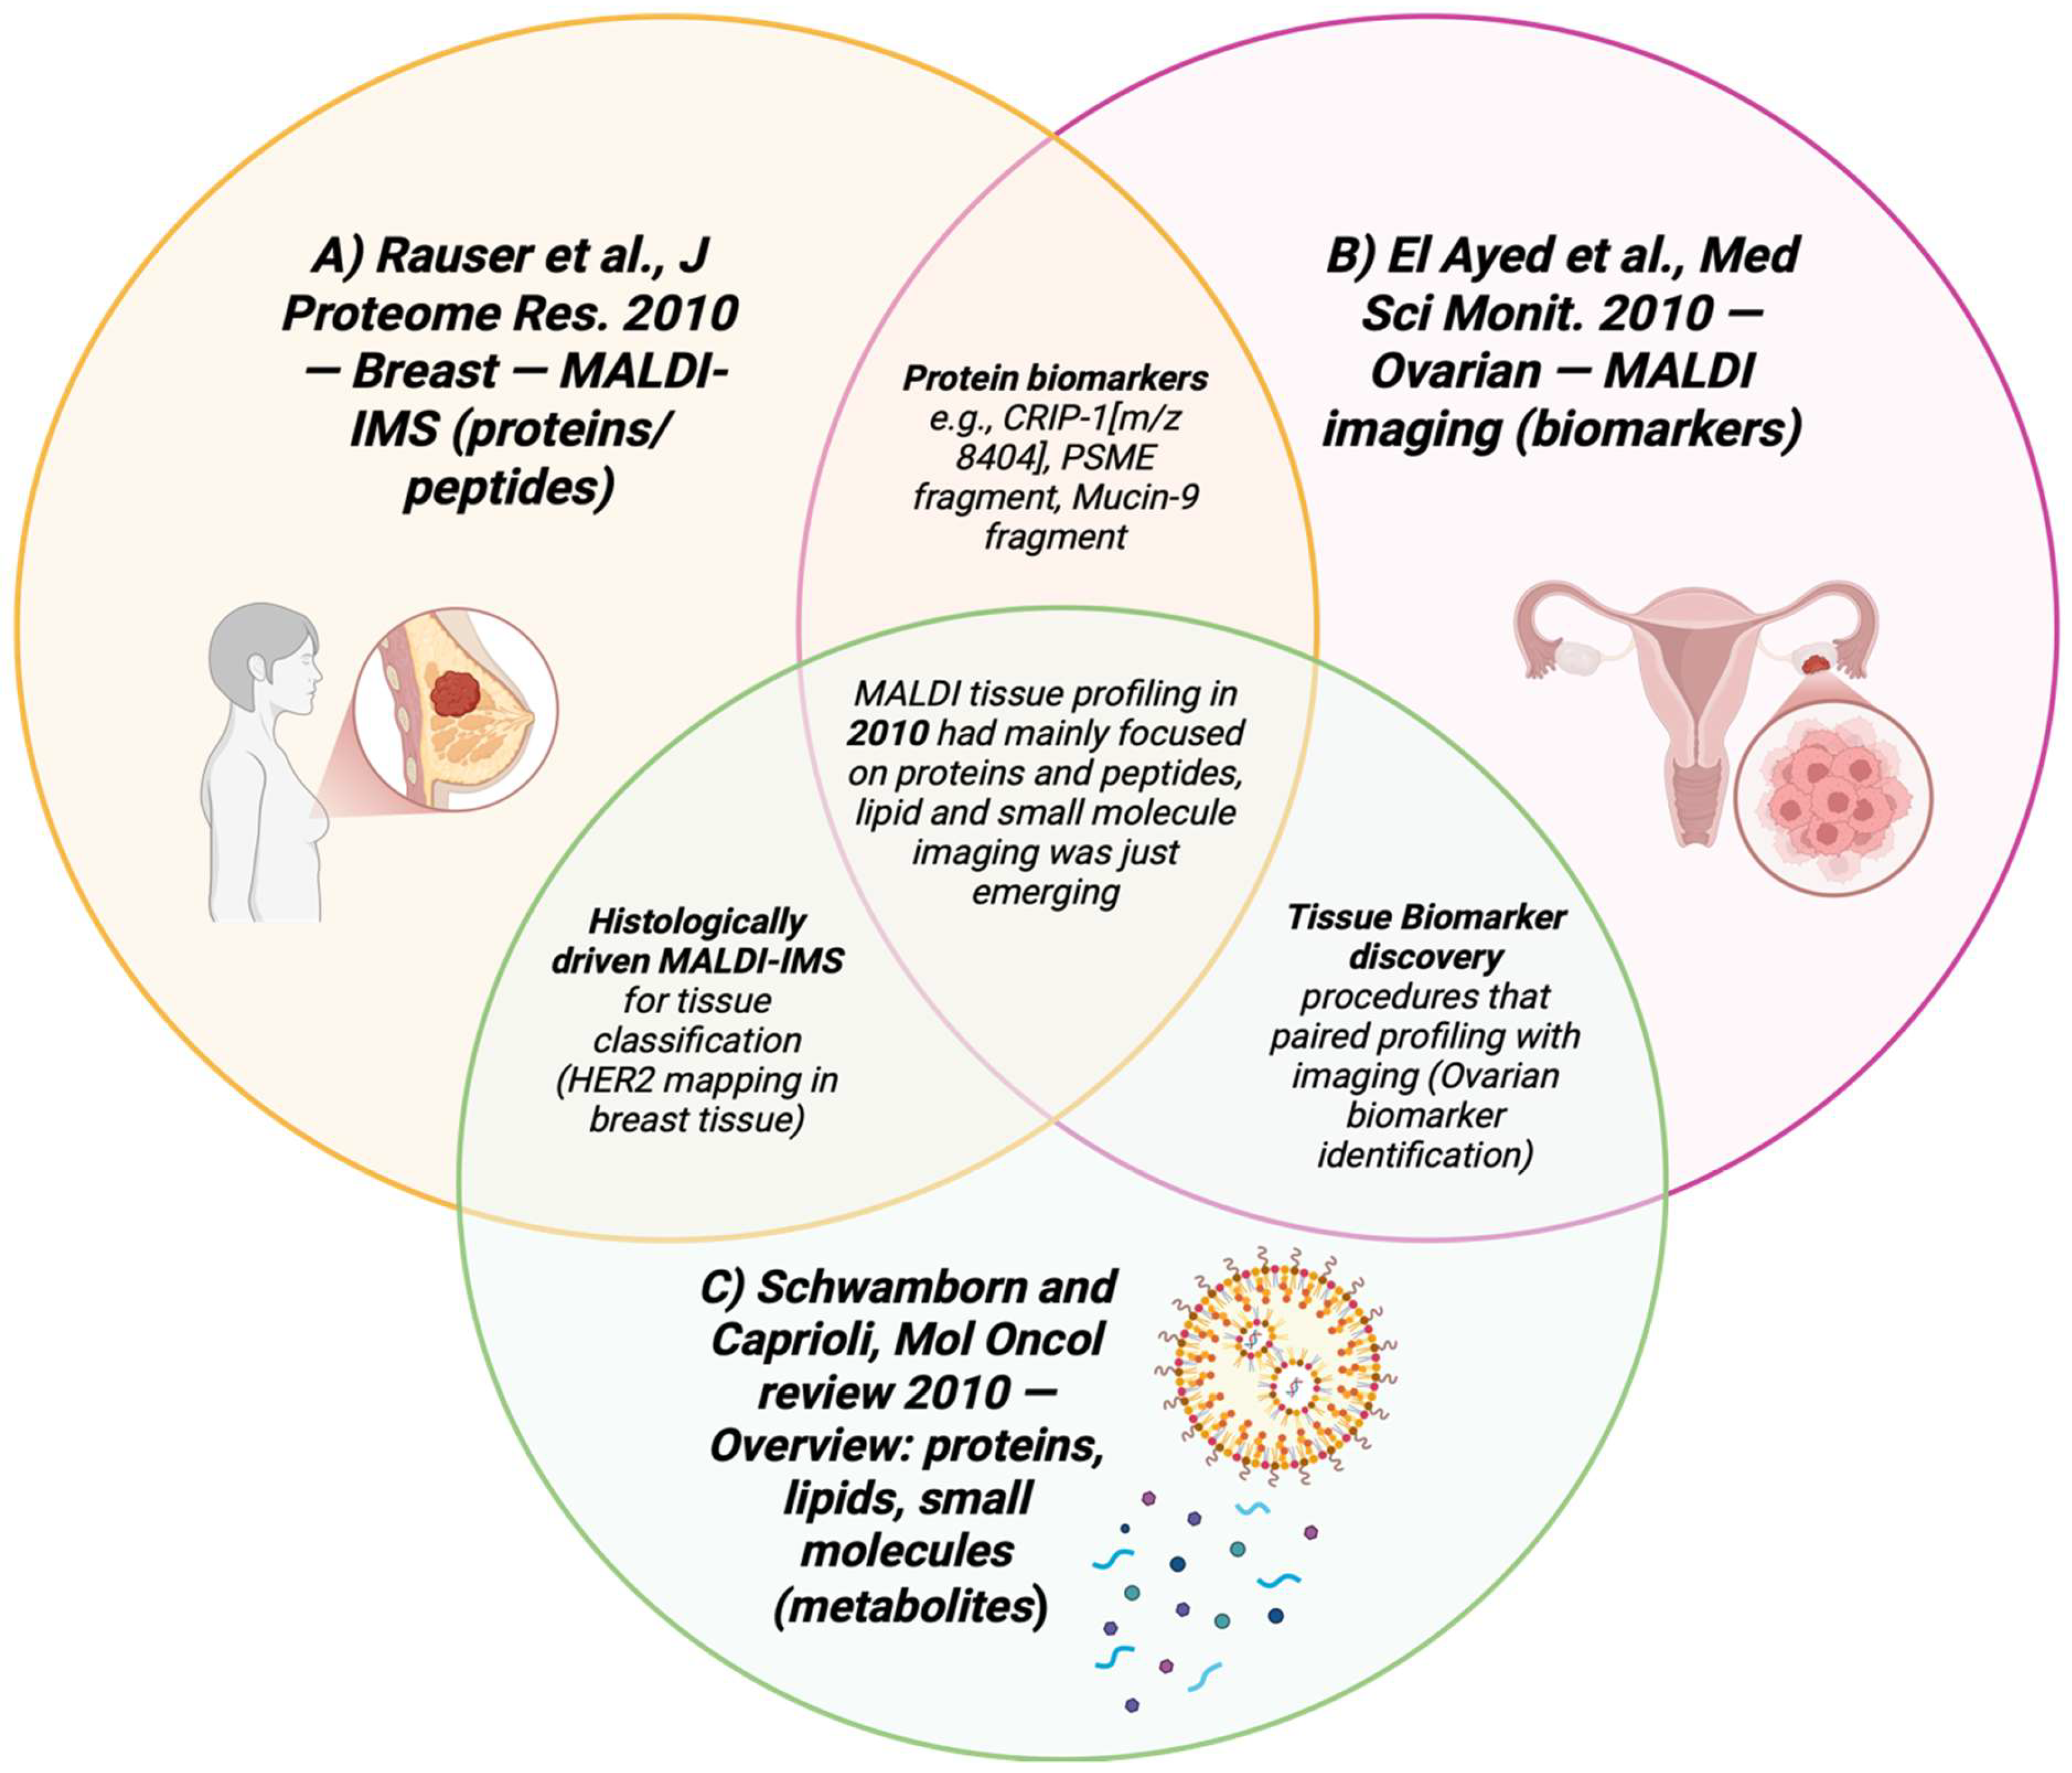
| 1 | Rauser S et al., 2010 [95] | MALDI-IMS was applied to freshly frozen breast cancer sections to classify HER2 using spatially resolved molecular profiles. | Showed that MALDI-IMS can HER2 status with high accuracy, sensitivity ~83%, specificity ~92%. The processes used are the same ones used for metabolite imaging in caner tissues. |
| 2 | Schwamborn K, Caprioli RM, 2010 [96] | Review on MALDI methods and application in oncology, including the detection of cancer metabolites. | Found that MALDI can map glycans and small metabolites in tissues and MS settings that allow metabolite imaging, thus showing MALDI as a great tool for spatial metabolomics in cancer research. |
| 3 | Colsch B, Woods AS, 2010 [97] | Used MALDI to detect sialylated glycosphingolipids in tissue sections using optimized matrices. | Showed spatially resolved detection of ganglioside and glycosphingolipids of m/z < 950 from tissue without derivatization. While conducted on brain tissue, these methods are translatable to cancer studies where and glycosphingolipid metabolism is important. |
| 4 | Iorio E et al., 2010 [98] | An ovarian cancer study that altered phosphatidylcholine metabolism in cancer cells. | Found the activation of phosphatidylcholine cycle in ovarian cancer cells and gave biochemical targets and mass signatures that MALDI later imaged in tumor tissue. It showed important context on which metabolites were oncologic for MALDI detection. |
3.12. Year 2011
| No. | Author | Application | Result |
|---|---|---|---|
| 1 | Kang HS et al., 2011 [101] | Breast cancer tissue lipidomics by MALDI imaging. | Certain phospholipids like PI, PE, PC showed tumor-related spatial patterns in breast cancer, supporting lipids as diagnostic markers. |
| 2 | Park YS et al., 2011 [102] | Cholangiocarcinoma vs. normal liver by MALDI imaging of phospholipids. | Multiple phospholipids were differentiated in tumors vs. nearby liver tissue, thus enabling the differentiation of cholangiocarcinoma. |
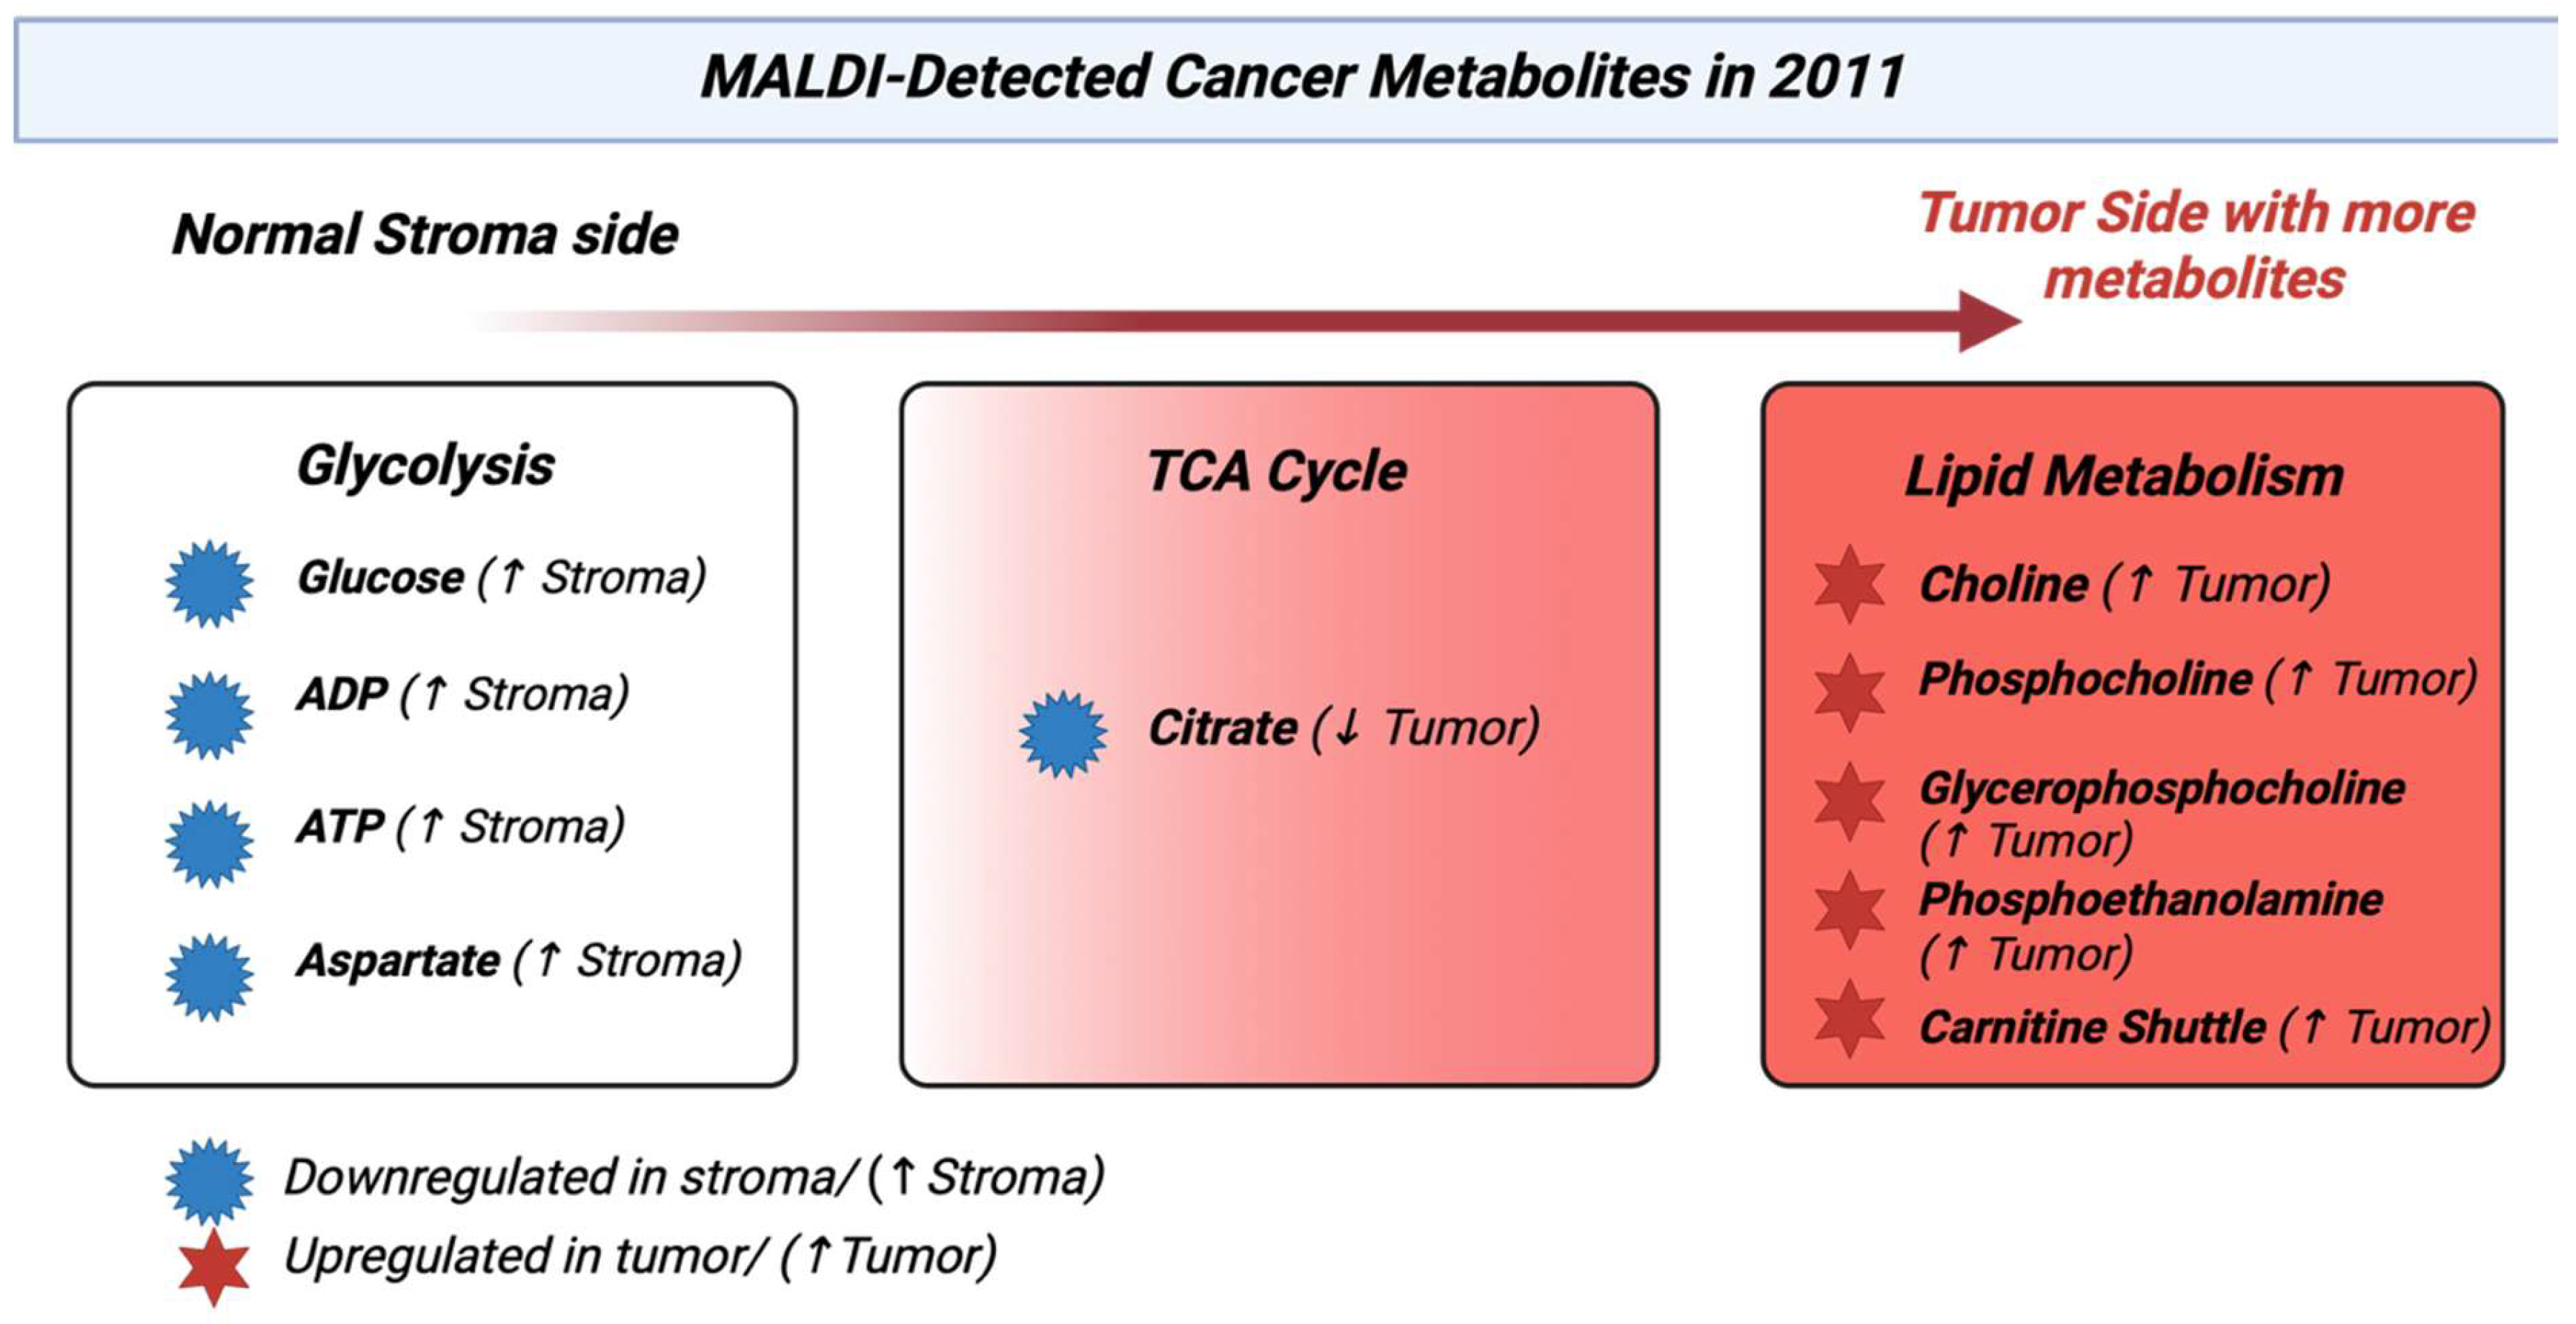
| 3 | Wang J et al., 2011 [105] | Colorectal cancer metastasis (through mouse xenograft) metabolite MALDI-TOF imaging. | On tissue, MALDI-IMS mapped small metabolites and lipids like UDP-HexNAc, glutathione, and phospholipids differing between tumor and stroma, showing metabolic reprogramming in metastases. |
| 4 | Han EC et al., 2011 [106] | Hepatocellular carcinoma direct tissue MALDI analysis, particularly in the low mass protein regions. | Showed MALDI tissue profiling to separate tumor and non-tumor regions. It set the basis for molecular mapping in HCC that proliferated in lipid-focused studies. |
3.13. Year 2012
| No. | Author | Application | Result |
|---|---|---|---|
| 1 | Lee GK et al., 2012 [92] | NSCLC classification from bronchoscopic diagnosis using MALDI lipid profiling. | Lipid profiles accurately differentiated tumors from nearby normal tissue and classified NSCLC histologic type with an 80% accuracy. |
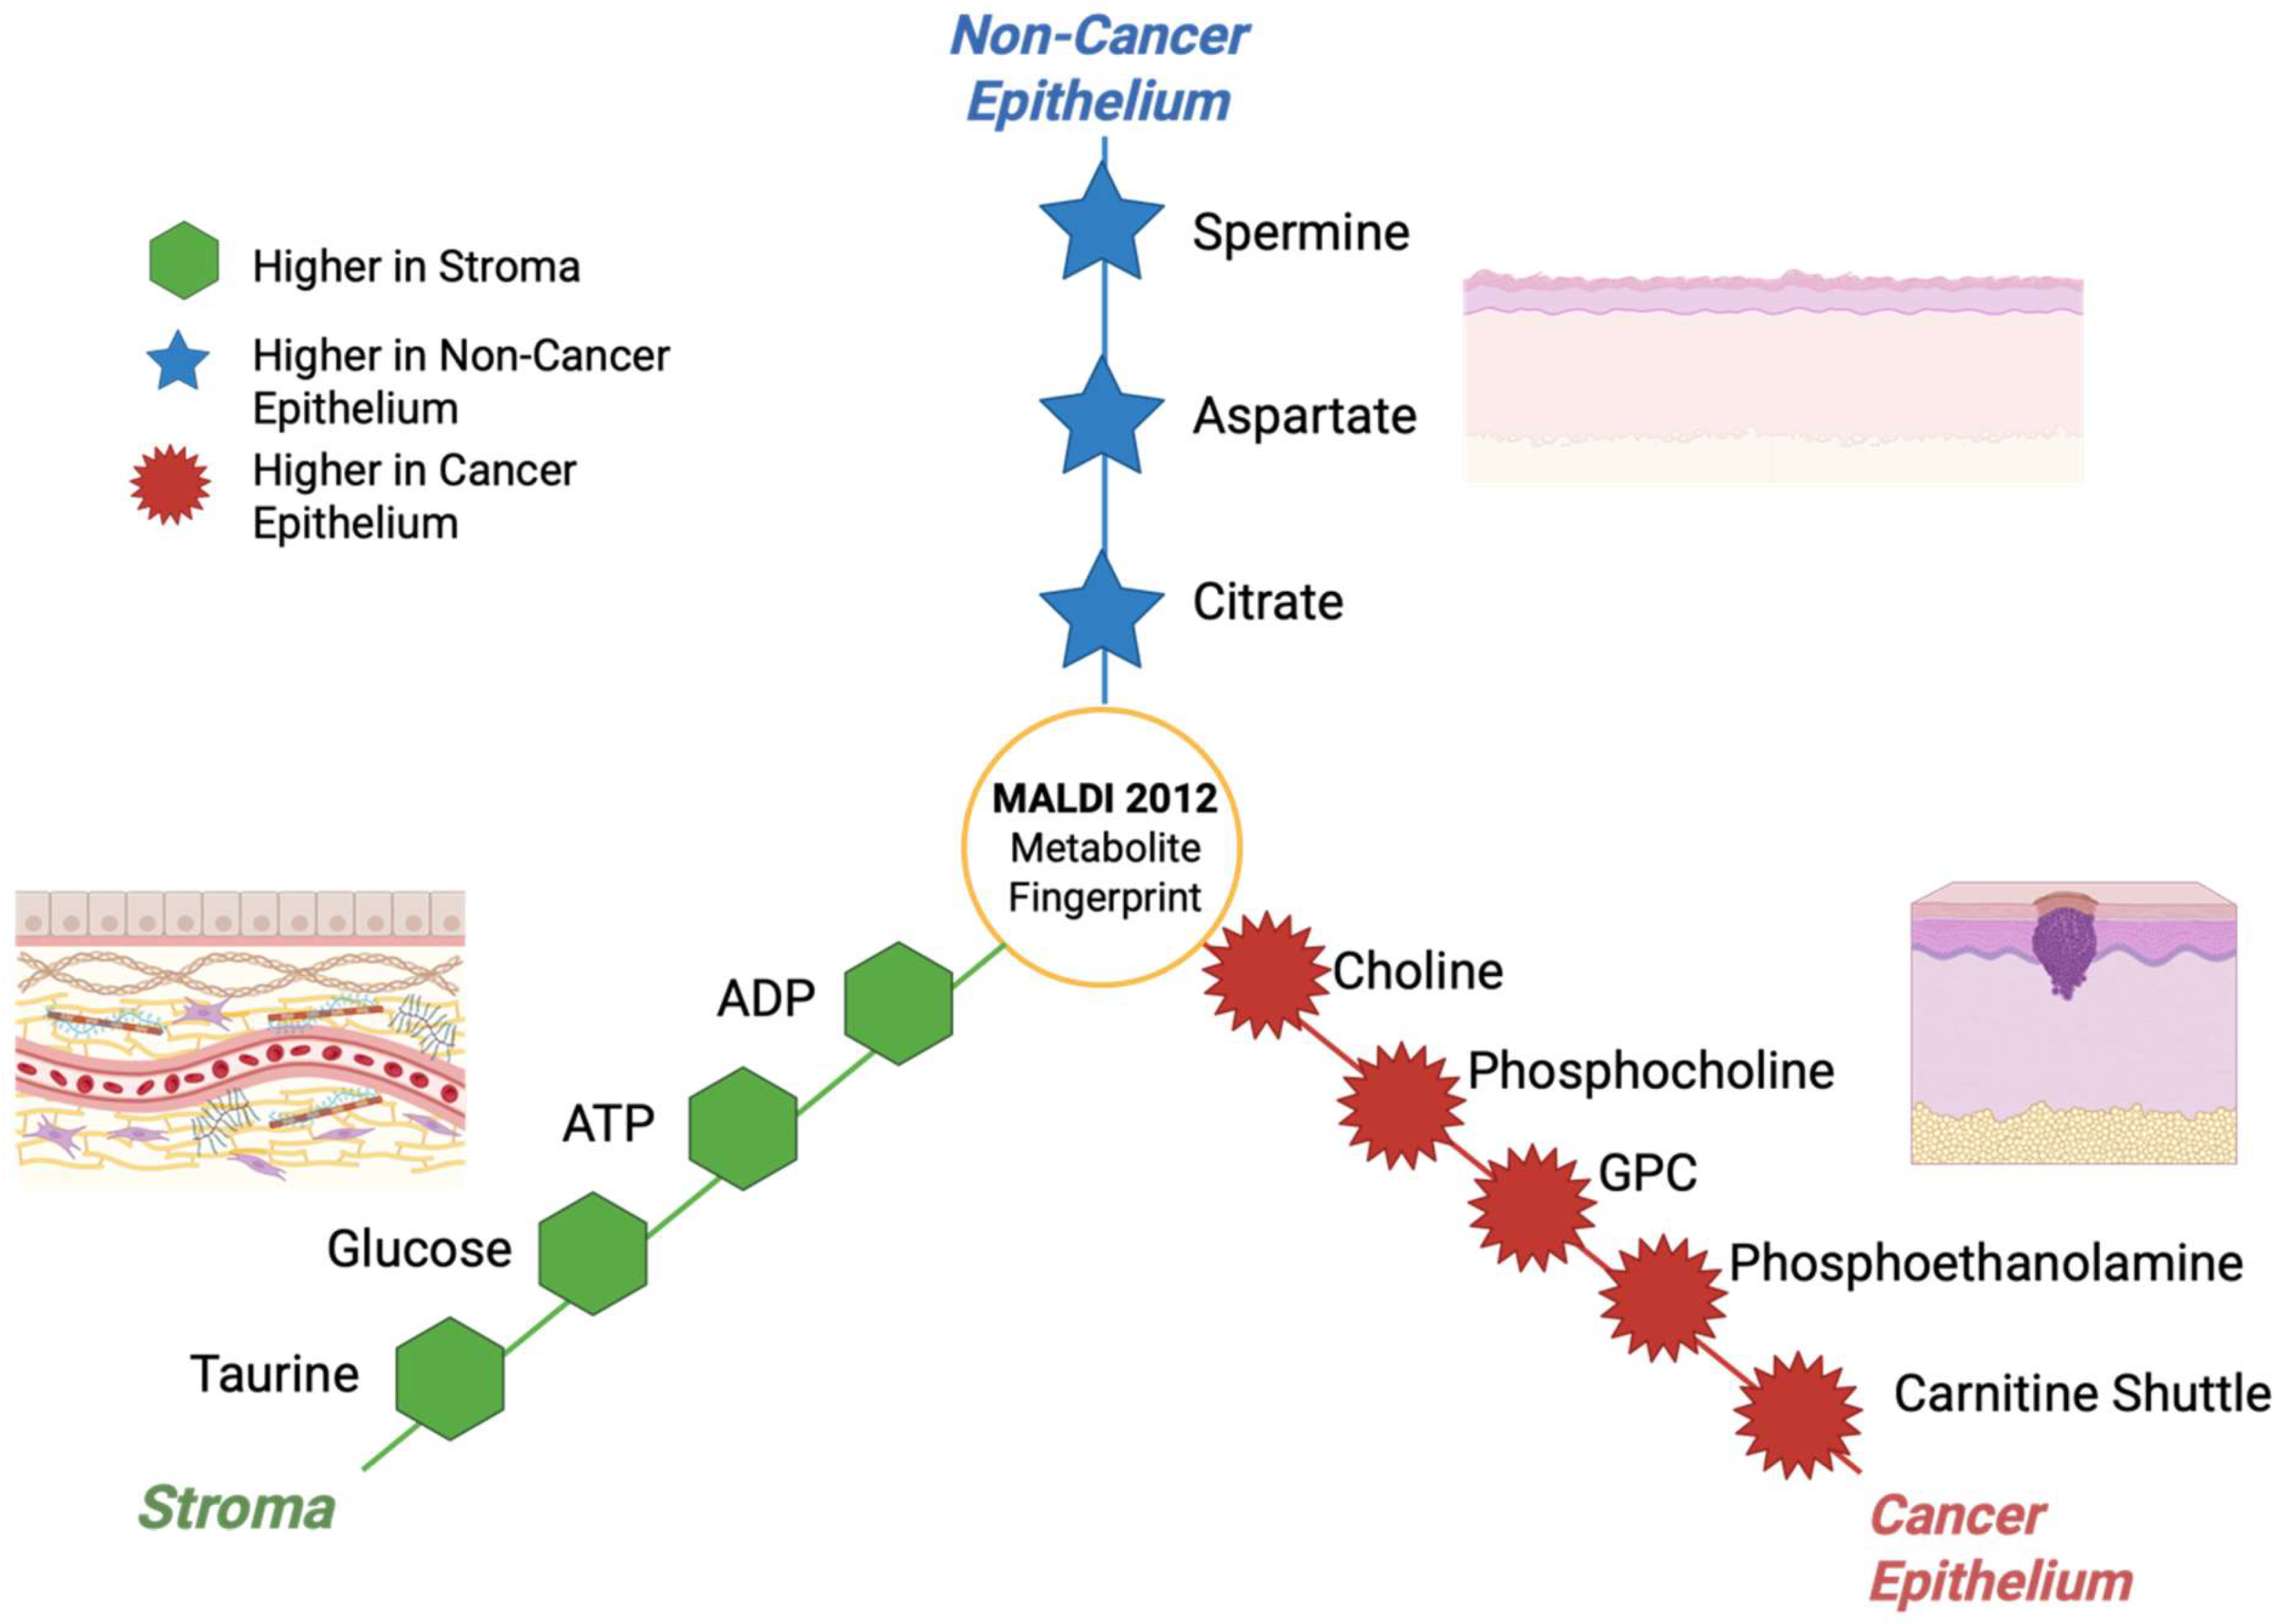
| 2 | Cerruti CD et al., 2012 [110] | 9-aminoacridine (9-AA) MALDI imaging for low-mass/negative-ion detection. | Showed that 9-AA matrix with optimized negative-ion MALDI gives clean, low-mass metabolite and lipid spectra, which became an advanced method commonly used for imaging polar metabolites like lactate and succinate in cancer tissues. |
| 3 | Yang HJ et al., 2012 [111] | MALDI 15-T FT-ICR analysis of cancer cell lipids. | Identified intact phospholipids from malignant glioma cells by MALDI with high resolution and high mass accuracy. This improved reliability in metabolite assignments in cancer studies. |
| 4 | Maurer K et al., 2012 [112] | MALDI-TOF profiling of oral brush biopsies for the early detection of cancer | Found a clinical application showing MALDI profiling of invasive oral samples that can discriminate malignant and premalignant cancer from benign regions. |
3.14. Year 2013
| No. | Author | Application | Result |
|---|---|---|---|
| 1 | Pirman DA et al., 2013 [116] | Direct MALDI-MS analysis of colorectal cancer cells to detect metabolic changes without the prior separation step. | Found cancer-specific metabolic reprogramming, altered energy metabolism, and signaling pathways, thereby showing MALDI’s ability to track functional metabolic shifts in tumor cells. |
| 2 | Quaas A et al., 2013 [117] | MALDI imaging of esophageal carcinoma to study metabolite features in adenocarcinoma and squamous cell carcinoma. | Showed tumor-associated peptide signatures differentiating adenocarcinoma from squamous cell carcinoma. This showed MALDI’s potential in subtyping and precision diagnosis. |
| 3 | Pallua JD et al., 2013 [118] | Used MALDI-MSI to examine prostate cancer tissues with a focus on metabolite detection for clinical use. | Detected overexpression of biliverdin reductase-B, which is a redox enzyme in prostate cancer samples, thus taking it as a new biomarker type with implications for oxidative stress regulation in tumors. |
| 4 | Alexandrov T et al., 2013 [119] | Developed computational segmentation algorithms for MALDI imaging datasets from larynx carcinoma tissue. | Achieved better differentiation of tumor and normal tissue regions, thereby giving a better understanding of complex imaging data. |

3.15. Year 2014
| No. | Author | Application | Result |
|---|---|---|---|
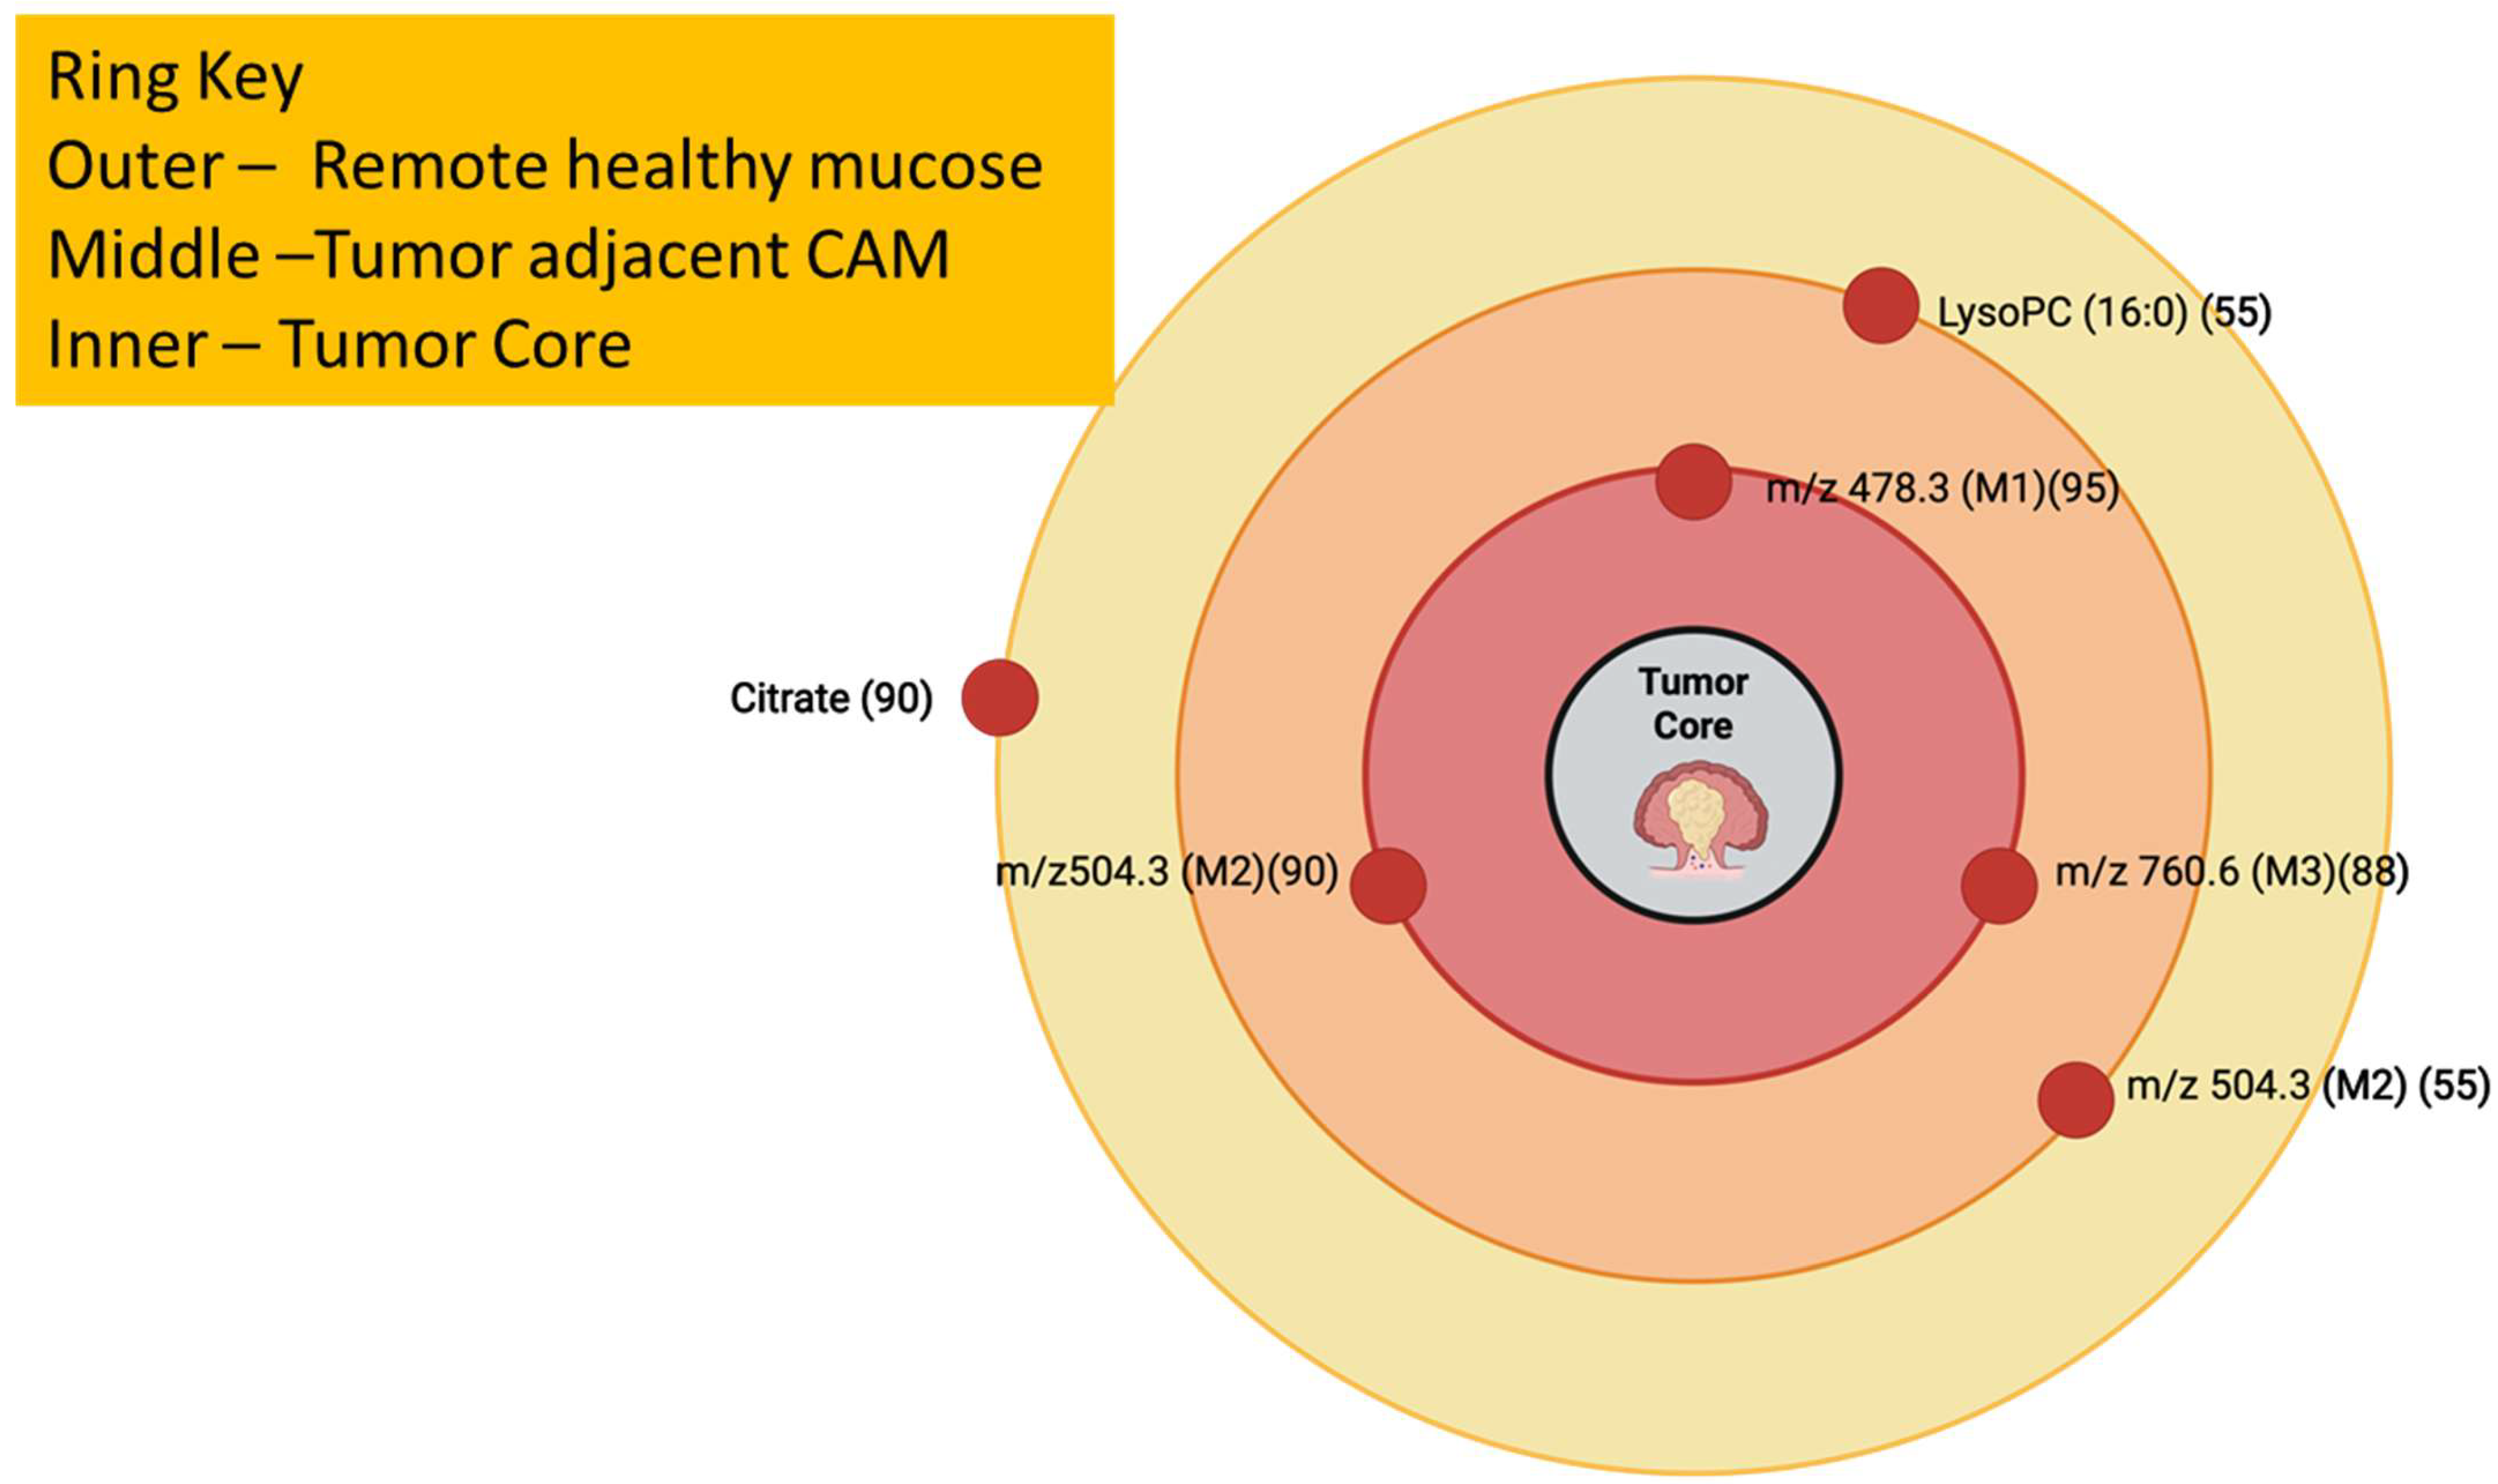
| 1 | Mirnezami R et al., 2014 [120] | MALDI imaging performed on colorectal cancer resections to chemically trace tumor, surrounding mucosa, and stroma, putting focus on small metabolite signatures. | Discovered CRC-related metabolic “field effects” in normal mucosa with modified phospholipid and sphingolipid patterns and other multivariate models were able to differentiate microenvironments. |
| 2 | Jones EE et al., 2014 [124] | MALDI imaging on clear cell renal cell carcinoma (ccRCC) tissue trace low-mass metabolites with protein signals and clinical pathology. | Found panels of tumor-related lipids around 39 species and proteins around 26 that could separate tumor and non-tumor tissue and ranked its recurrence risk. This was proof that spatial lipid metabolism helps ccRCC phenotype. |
| 3 | Toue S et al., 2014 [125] | Found on-tissue chemical derivatization (THAS) to allow the high-contrast imaging of endogenous amino acids, that are key cancer metabolites, on tissue sections. | Was able to visualize more than 20 amino acids with cellular scale contrast, thereby finding a robust process to trace glycolysis and TCA-related metabolites in tumors by MALDI. |
| 4 | Guo S et al., 2014 [126] | MALDI-FT-ICR imaging of resected thyroid tumors along with serum lipidomics to find metabolic biomarkers. | Were able to find region-specific tumor lipid alterations in thyroid tissues and serum lipid specimens supporting the differentiation of tumors and benign- joint tissue–serum metabolite process. |
3.16. Year 2015
| No. | Author | Application | Result |
|---|---|---|---|
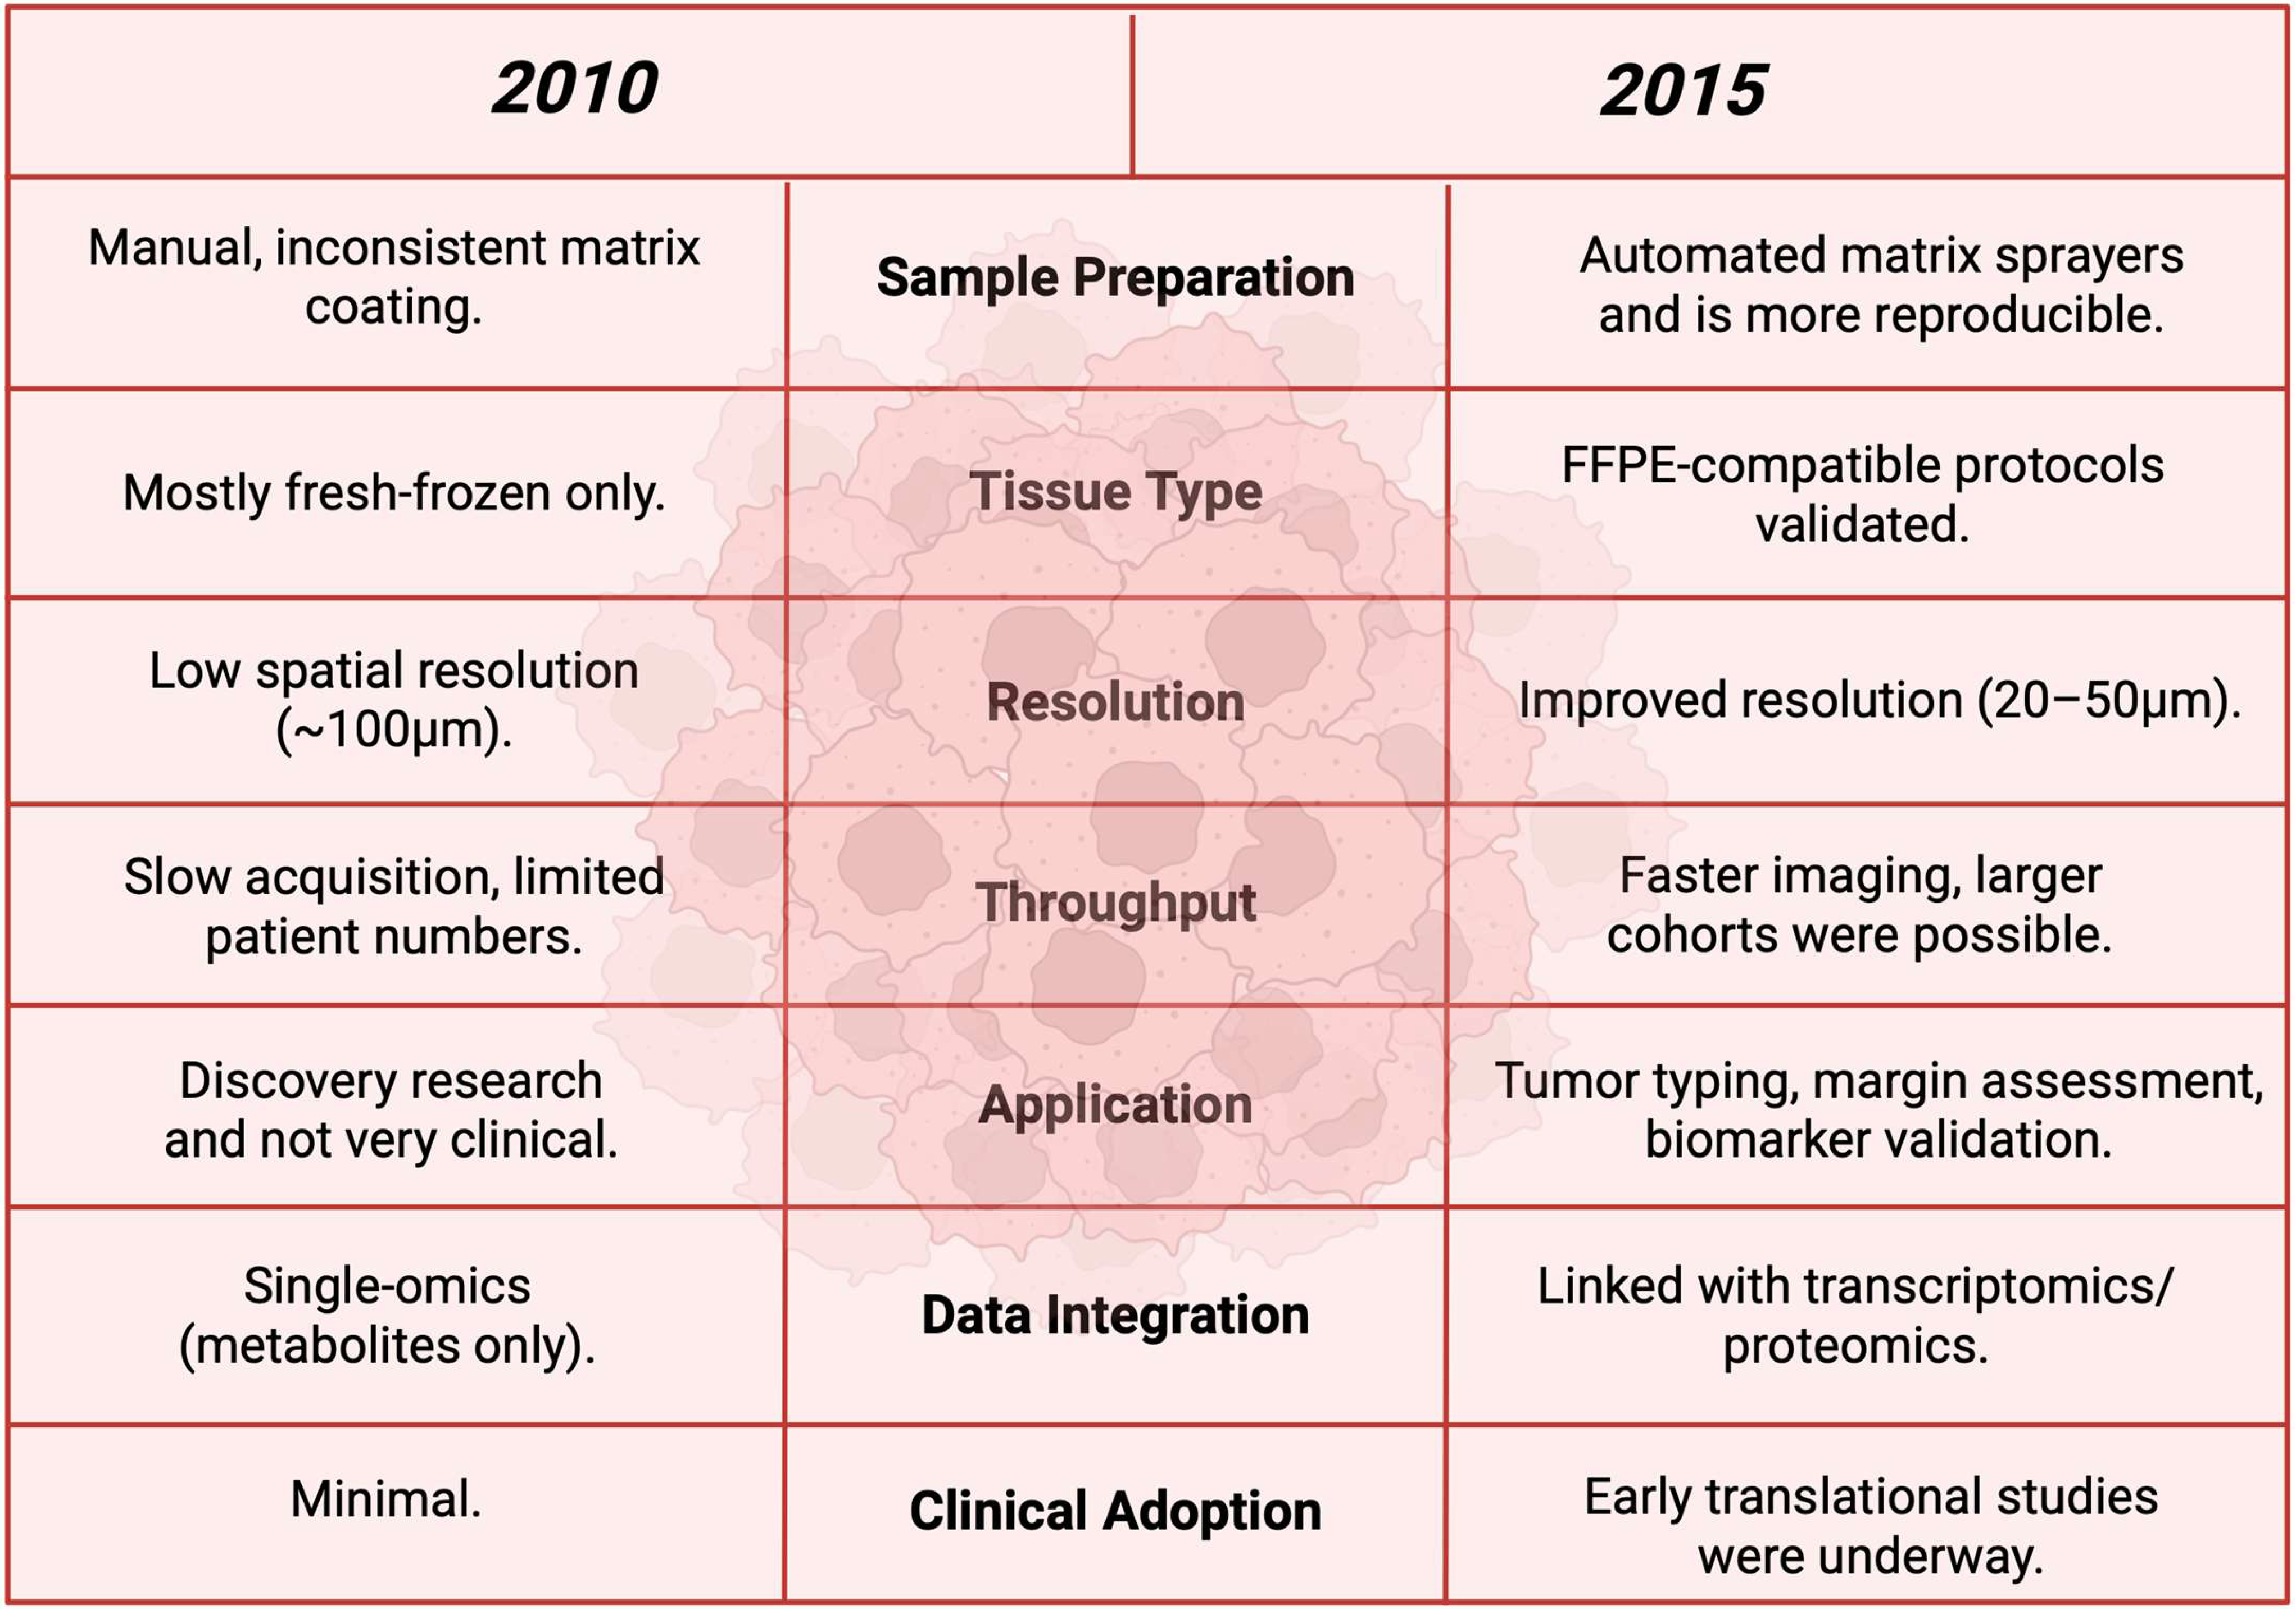
| 1 | Buck A et al., 2015 [128] | MALDI-FT-ICR performed on FFPE cancer tissues to test if endogenous metabolites can survive and be imaged. | Showed in situ imaging of metabolites from FFPE with high mass resolution and big overlap to fresh frozen spectra, with which it opens archival clinical cohorts to metabolite MSI. |
| 2 | Jiang L et al., 2015 [129] | 3D MALDI MSI of breast tumor xenografts that were engineered with a hypoxia reporter; integrated lipid and tryptic peptide maps to study hypoxia-driven metabolic remodeling. | Were able to identify co-localization of hypoxic regions with distinct phospholipids and hypoxia-regulated pathways, showing how hypoxia shapes tumor lipid metabolism spatially. |
| 3 | Goto T et al., 2015 [130] | High-resolution MALDI-IMS of phospholipids in human prostate cancer resection specimens relating lipid distribution to clinical outcomes. | Found decreased LPC (16:0/OH) in cancer regions; this reduction in lipid single-handedly predicted biochemical recurrence, thus a lipid-metabolism biomarker of aggressiveness. |
| 4 | Kriegsmann J et al., 2015 [131] | MALDI-TOF imaging was applied in clinical pathology (FFPE tissue analysis). | MALDI-TOF MSI detected small molecules like lipids, carbohydrates, and small peptides in FFPE and discussed about its potential for biomarker discovery and delineation of tumor margins. |
3.17. Year 2016
| No. | Author | Application | Result |
|---|---|---|---|
| 1 | Végvári Á et al., 2016 [135] | MALDI-MSI localization of tamoxifen and metabolites in human breast tumor sections. | Explained the intratumoral distribution of tamoxifen and its metabolites, showing that MALDI can trace small molecules and metabolites in clinical tumor tissue and let us know metabolism relationships. |
| 2 | LaBonia GJ et al., 2016 [136] | MALDI imaging of irinotecan penetration and metabolism in 3D tumor spheroids treated in a 3D printed fluidic device. | Showed the spatial penetration and metabolic conversion of irinotecan within spheroids including the localization of active metabolites, displaying MALDI’s ability to study intratumoral drug metabolism and microenvironmental barriers. |
| 3 | Giordano S et al., 2016 [137] | MALDI -MSI of paclitaxel distribution on various tumor models like ovarian, colon, breast, and mesothelioma. | Found marked heterogeneity in paclitaxel distribution between tumor types, showing that the metabolite spatial mapping explains the variable therapeutic outcomes. |
| 4 | Patterson NH et al., 2016 [138] | Lipid MSI of colorectal cancer with liver metastases to have a pathological response to therapy. | Produced lipid signatures related with pathological response to neoadjuvant chemotherapy, thus showing that lipid metabolite maps can serve as objective markers of the effect of treatment. |
3.18. Year 2017
| No. | Author | Application | Result |
|---|---|---|---|
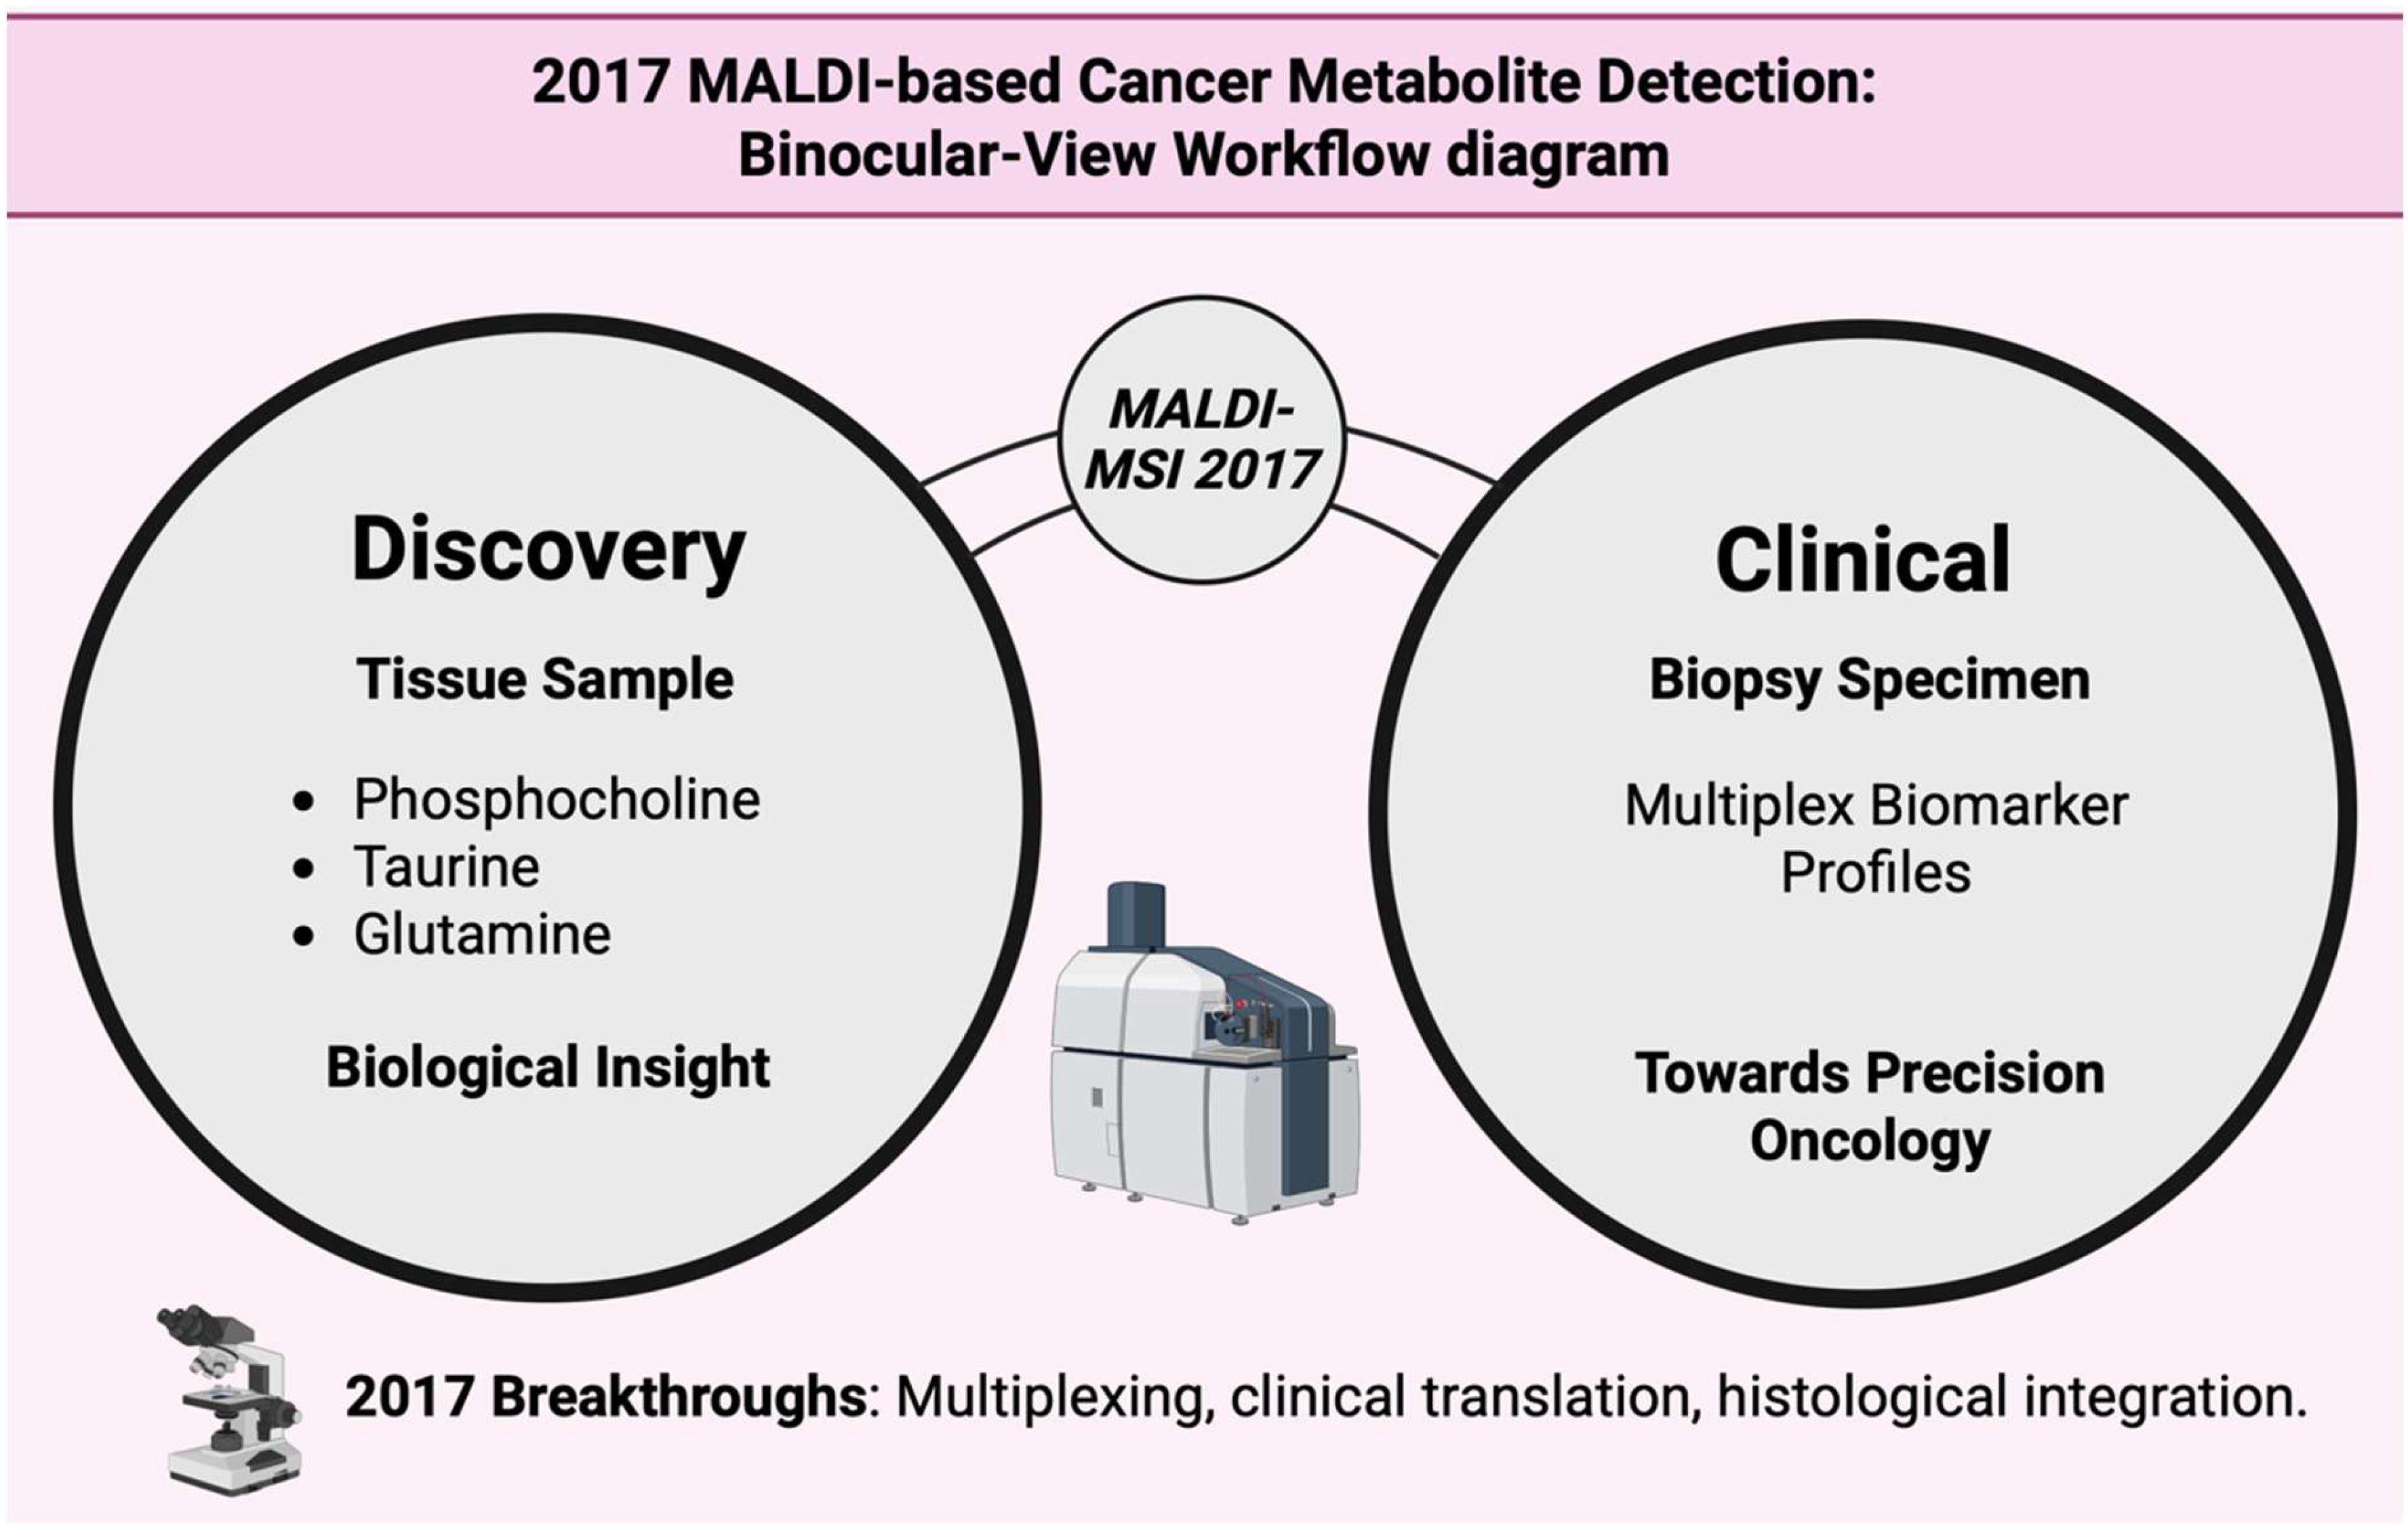
| 1 | Zhang J et al., 2017 [141] | Developed the MasSpec Pen which is a handheld, nondestructive ambient MS sampling method, for fast ex vivo and in vivo tissue analysis during surgery. | Gave close to real-time metabolic fingerprints that differentiated tumor vs. normal tissue on many human sample types; this was a huge step towards intraoperative metabolite-based diagnostics. |
| 2 | Dilillo M et al., 2017 [142] | Applied ultra-high mass resolution 15-T MALDI FT-ICR on a mouse glioblastoma model to trace proteins, lipids, and small metabolites. | Resolved isobaric and isotopic overlaps and traced hundreds of proteins and metabolites with high confidence, thus improving molecular specificity for on-tissue metabolite work. |
| 3 | Casadonte R et al., 2017 [143] | Review on MALDI applied to cancer tissue microarrays (TMAs) on clinical groups. | Showed how MALDI processes scale to large clinical groups like TMAs and FFPE, thereby allowing the reproducible identification of spatial metabolite and protein signatures on many patients. |
| 4 | Sans M et al., 2017 [144] | DESI ambient imaging of serous ovarian tumor tissues for metabolic marker identification and the prediction of aggressiveness. | Identified the lipid and metabolite markers that differentiate tumor subtypes and predicted aggressiveness; this showed ambient MS as a fast clinically relevant metabolite mapping tool. |
3.19. Year 2018
| No. | Author | Application | Result |
|---|---|---|---|
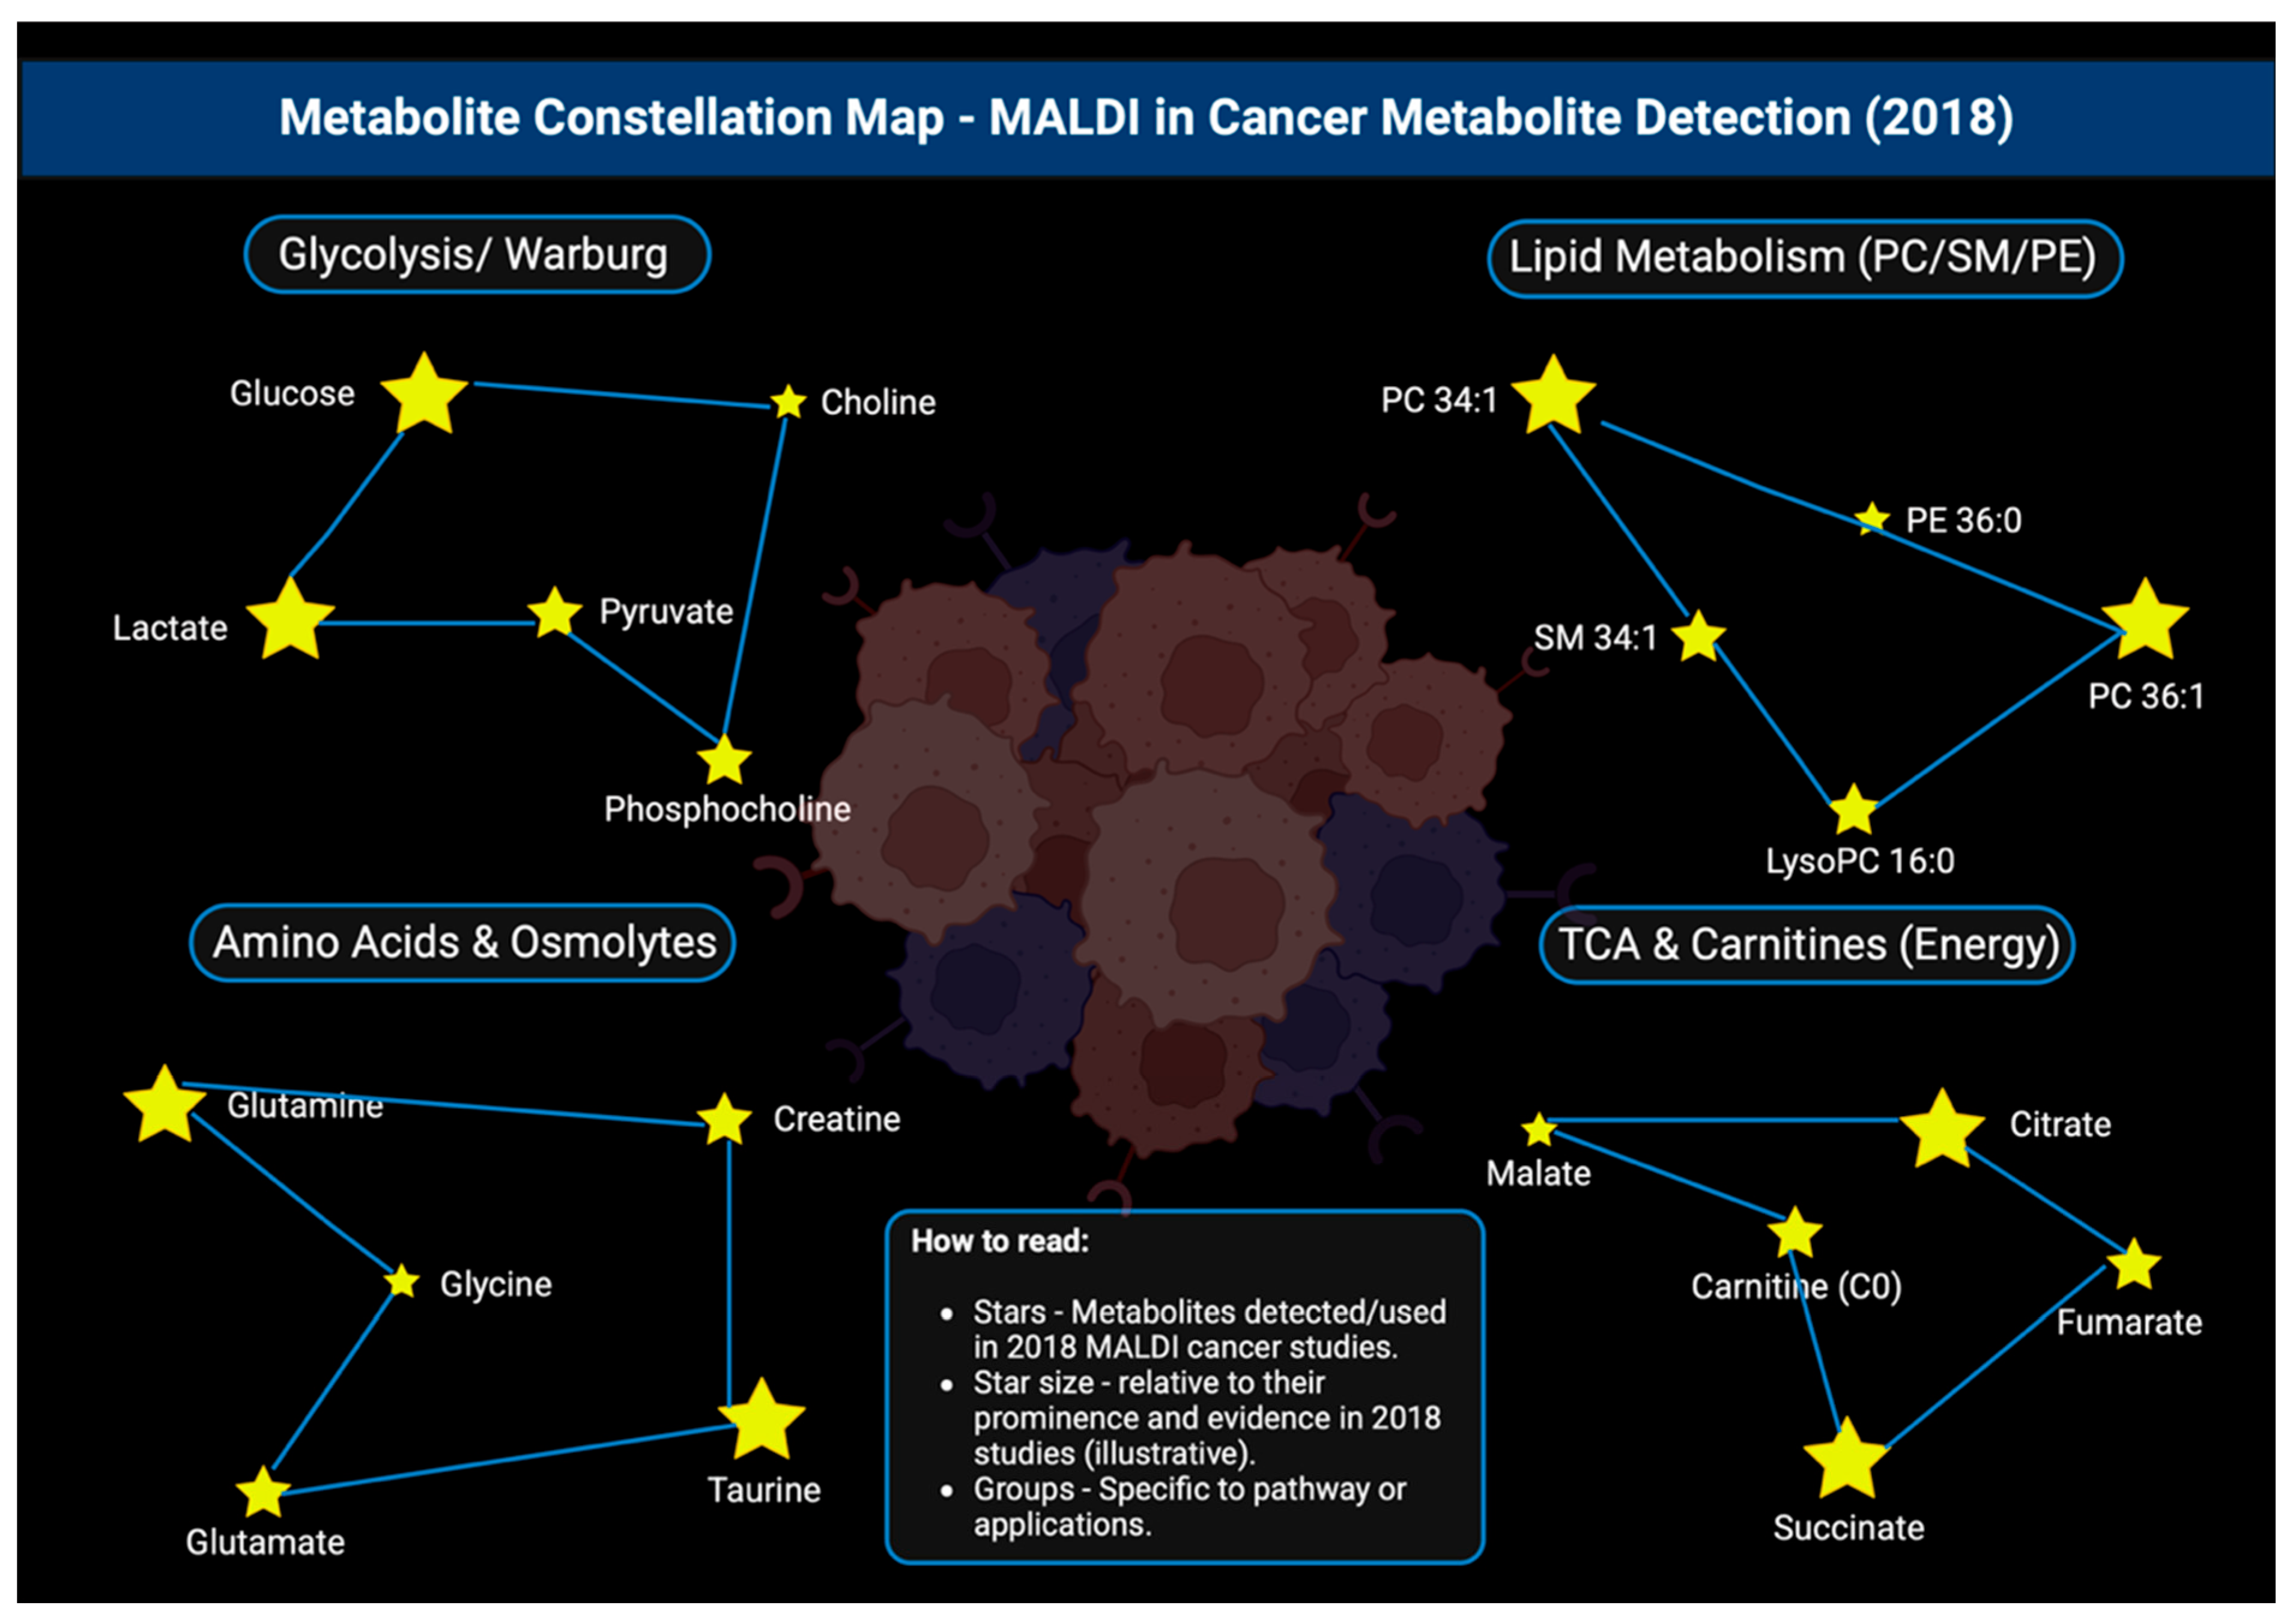
| 1 | Torata N et al., 2018 [147] | MALDI imaging of adenylate nucleotides like ATP, ADP, and AMP to compute energy charge in breast carcinoma compared to surrounding normal tissue. | Tumor regions had shown significantly higher energy charge and adenylate pool, which supported on-tissue mapping of tumor bioenergetics as a diagnostic tool. |
| 2 | Liu X et al., 2018 [148] | MALDI imaging performed on patient-derived colorectal cancer organoids to track irinotecan (CPT-11) and active or inactive metabolites during treatment response studies. | Able to spatially resolve drug metabolite patterns in organoids, showed heterogenous biotransformation like SN-38 and SN-38G, proving MALDI imaging as a preclinical pharmacometabolomics. |
| 3 | Sugihara Y et al., 2018 [149] | MALDI MSI of endogenous small metabolites in human malignant melanoma to map metabolic heterogeneity on tumor regions. | Showed distinct metabolic signatures that separated tumor sub-compartments and tumor vs. peri-tumoral skin, thus underscoring metabolic spatial heterogeneity in melanoma. |
| 4 | Drake RR et al., 2018 [150] | Developed an on-tissue MALDI MSI process for the detection of N-linked glycans from fresh-frozen and FFPE cancer tissues through enzymatic release and chemical stabilization. | Allowed the robust and reproducible imaging of more than 100 N-glycan species, notably increasing small metabolite coverage on cancer tissues. This improved sensitivity, spatial mapping, and compatibility with archived FFPE tumor samples. |
3.20. Year 2019
| No. | Author | Application | Result |
|---|---|---|---|
| 1 | Barré FPY et al., 2019 [25] | The first broad demonstration of laser post ionization (MALDI-2) for imaging small molecules and drugs in tissue. | Hugely increased ion yields, improving the limits of detection, and allowing the visualization of metabolites and pharmaceuticals that were previously undetectable by normal MALDI. |
| 2 | Föll MC et al., 2019 [152] | Published the Galaxy MSI framework and training material to make MSI data analysis accessible and reproducible. | Gave open and shareable guidelines for MSI data preprocessing, normalization, segmentation and statistics which raised reproducibility and allowed for metabolite biomarker identification across labs. |
| 3 | Sun N et al., 2019 [154] | High-resolution MALDI MSI to map steroid sulfates in adrenocortical carcinoma (ACC). | Found steroid sulfation patterns that can classify prognosis in ACC, proving that MALDI can detect clinically relevant small molecules like steroids metabolic reprogramming in tumors. |
| 4 | Mittal P et al., 2019 [155] | MALDI MSI performed on primary cancer spheroids and organic models to look after its drug accumulation, metabolism and response. | Showed the spatial tracking of drug uptake and metabolites in 3-D patient-derived spheroids, thereby accepting MALDI-MSI as a preclinical pharmacometabolomics tool for therapy testing. |
3.21. Year 2020
| No. | Author | Application | Result |
|---|---|---|---|
| 1 | Ščupáková K et al., 2020 [159] | Morphometric single-cell classification by using MALDI-MSI, combining image-based cell morphometrics with MALDI molecular maps. | Showed cell-level molecular classification on tissue section which advanced the near-single-cell metabolite lipid mapping in cancer tissue. |
| 2 | Andersen MK et al., 2020 [160] | MALDI-MSI performed on prostate tissue to simultaneously detect zinc and zinc-related small metabolites. | Was able to visualize zinc and its pathway metabolites in situ. This gave new metabolite markers related to prostate cancer biology. |
| 3 | Randall EC et al., 2020 [161] | MALDI-TOF MSI mapping of glioblastoma vs. nearby tissue metabolites. | Found the spatial shifts in metabolites like antioxidants, purine, and pyrimidine intermediates, 2-HG, lactate, glutamine, and citrate that had delineated tumor borders and glioblastoma subtypes. |
| 4 | Sun C et al., 2020 [162] | MALDI profiling of carnitine metabolism in breast cancer. | Were able to map 17 carnitine species including L-carnitine and acyl-carnitine in tumor tissue vs. normal tissue. Carnitine metabolism dysregulation was an excellent classifier with around 96% accuracy for breast cancer. |

3.22. Year 2021
| No. | Author | Application | Result |
|---|---|---|---|
| 1 | Murakami M et al., 2021 [165] | MALDI MSI metabolomics of pheochromocytoma and paraglioma (PPGL) tissues across genotypes. | Showed tumor-genotype-related metabolic patterns and kynurenine pathway alternations associated with metastatic potential. |
| 2 | Chen Y et al., 2021 [166] | MALDI imaging performed on multicellular tumor spheroids to assess hydroxychloroquine response. | Traced the lipid metabolite changes like in acylcarnitine and PLs within spheroid zones, showing the usage of pharmacometabolomics. |
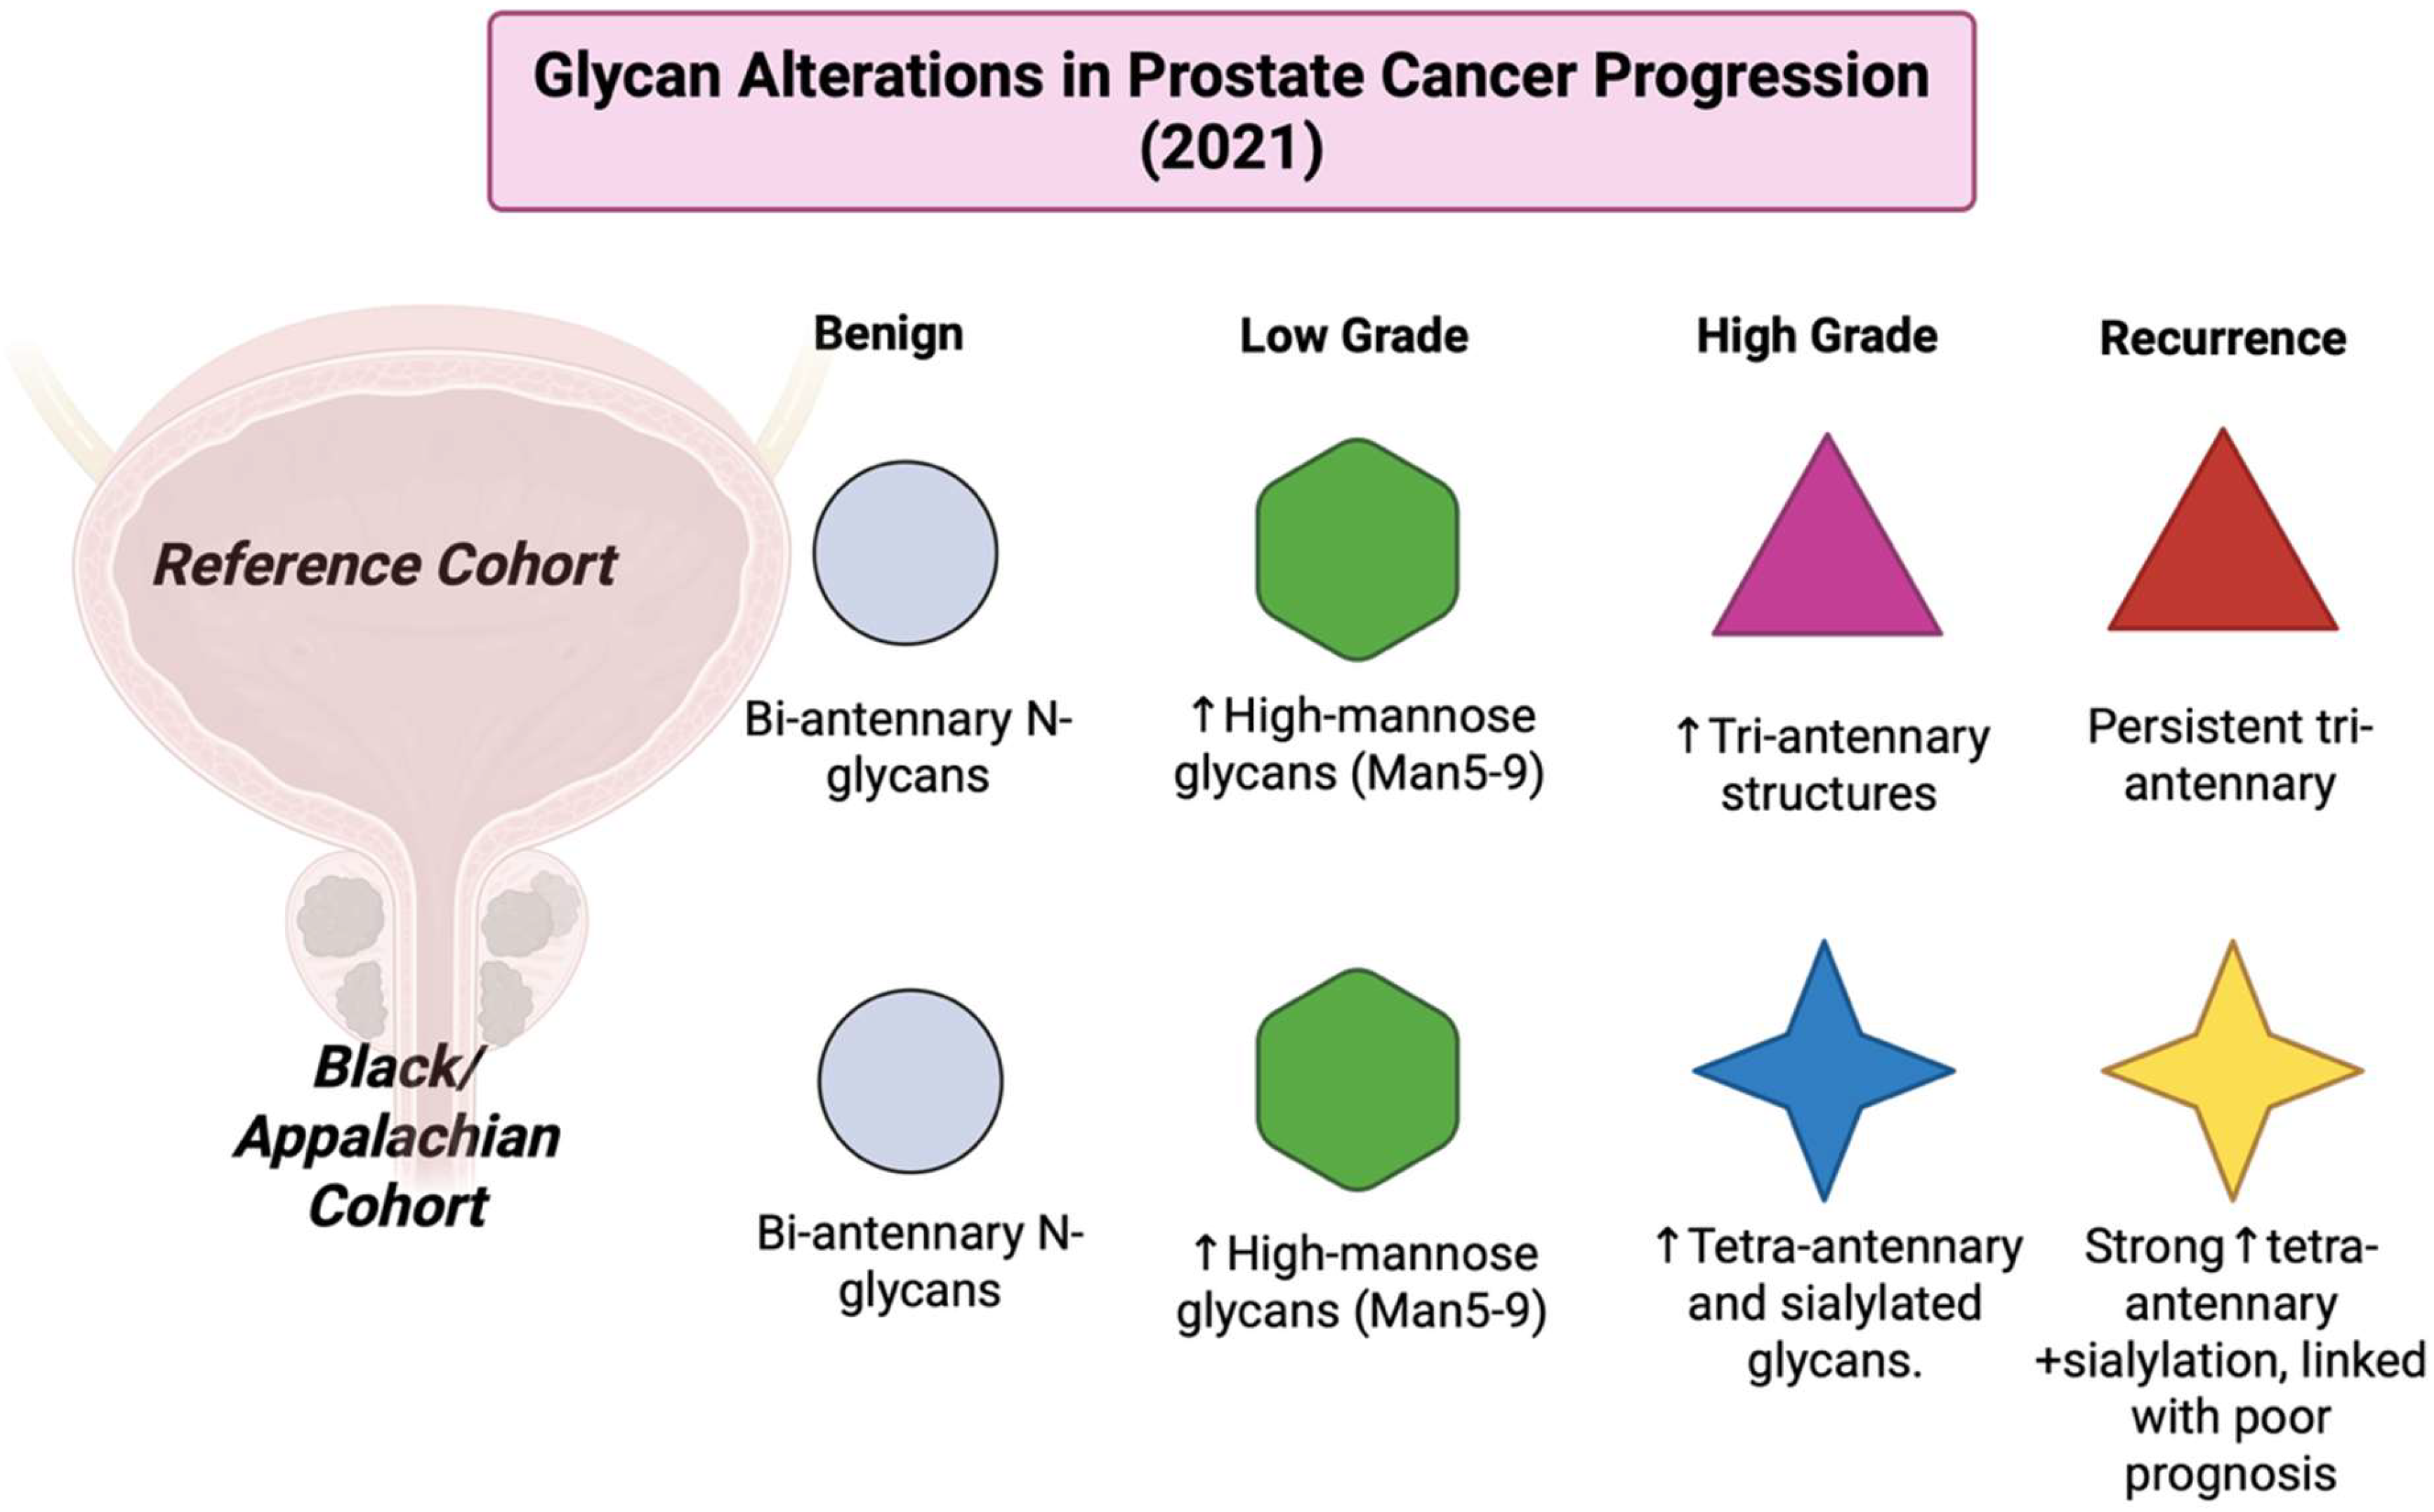
| 3 | Sun N et al., 2021 [167] | MALDI-MSI of native glycan fragments in PDAC FFPE tissues. | Found that specific native glycan fragments are independent prognostic factors in PDAC, thus stating glycan metabolites as tissue biomarkers. |
| 4 | Denti V et al., 2021 [168] | MALDI imaging spatial lipidomics performed on colorectal cancer linked to tumor infiltrating lymphocytes (TILs) | Discovered some lipid and metabolite features associated with immune infiltration; this was a step toward spatial immunometabolism profiling in cancer tissue. |
3.23. Year 2022
| No. | Author | Application | Result |
|---|---|---|---|
| 1 | Bollwein C et al., 2022 [173] | MALDI-MSI proteomic and peptide profiling to differentiate pancreatic ductal adenocarcinoma (PDAC) vs. cholangiocarcinoma. | Achieved an impressive ~95% classification accuracy on a pixel-by-pixel level by using MALDI-MSI-derived peptide features with machine learning classifiers such as gradient boosting (GB), support vector machine (SVM), and k-nearest neighbors (KNN) on formalin-fixed paraffin-embedded (FFPE) tissue microarrays. |
| 2 | Li Z et al., 2023 [174] | High-throughput serum metabolite detection through MALDI-MS together with machine learning. | Was able to identify 13 distinct features that were significantly different (p < 0.001) between lung cancer patients and healthy specimens; 6 of these were identified as intact metabolites. |
| 3 | Han Y et al., 2022 [175] | Adapted on-tissues derivatization with MALDI-MSI for the isomer specific imaging of monosaccharides. | Allowed for the differentiation and relative quantification of monosaccharide isomers directly in tissue sections using MALDI, thus improving the specificity of carbohydrate-based metabolite imaging. |
| 4 | Sommella E et al., 2022 [176] | MALDI metabolite imaging of parotid gland tumors. | Was able to identify distinct metabolomic and lipidomic spatial signatures that differentiate tumor vs. surrounding healthy/parenchymal regions. |
3.24. Year 2023
| No. | Author | Application | Result |
|---|---|---|---|
| 1 | Schwaiger-Haber M et al., 2023 [180] | MALDI and DESI-MSI was combined with a stable isotope labelling in a GL261 glioma mouse model. | Was able to map spatial distributions of metabolite abundances and fluxes derived from isotopes on glioma vs. normal brain; it showed a 3× increase in de novo fatty acid synthesis flux and 8× increase in fatty acid elongation in tumor tissue. |
| 2 | Stopka SA et al., 2023 [181] | Developed a tissue mimetic calibration array (Chemical QuantArray) that was placed on MALDI slides to quantify endogenous metabolites in tissue sections. | Gave a practical calibration approach by using isotopically labeled standards on the same slide. This improved the precision of MALDI quantification on multiple metabolites, which was a step toward clinically relevant metabolite measurements. |
| 3 | Ma B et al., 2023 [182] | MALDI profiling of xenograft models and 21 human hepatocellular carcinoma (HCC) tissues. | Spatially resolved metabolic profiling identified metabolites that were altered during HCC development and validated many metabolic markers in patient sample, showing the importance of metabolic reprogramming in HCC. |
| 4 | Wangyan T et al., 2023 [183] | Deep-learning (mNet) framework was used to analyze MALDI tissue microarrays from breast and lung cancer groups. | Improved tissue classification and preserved the spatial contexts vs. point-level methods. It proved that ML can help with high-throughput MALDI cancer tissue analysis. |
3.25. Year 2024
| No. | Author | Application | Result |
|---|---|---|---|
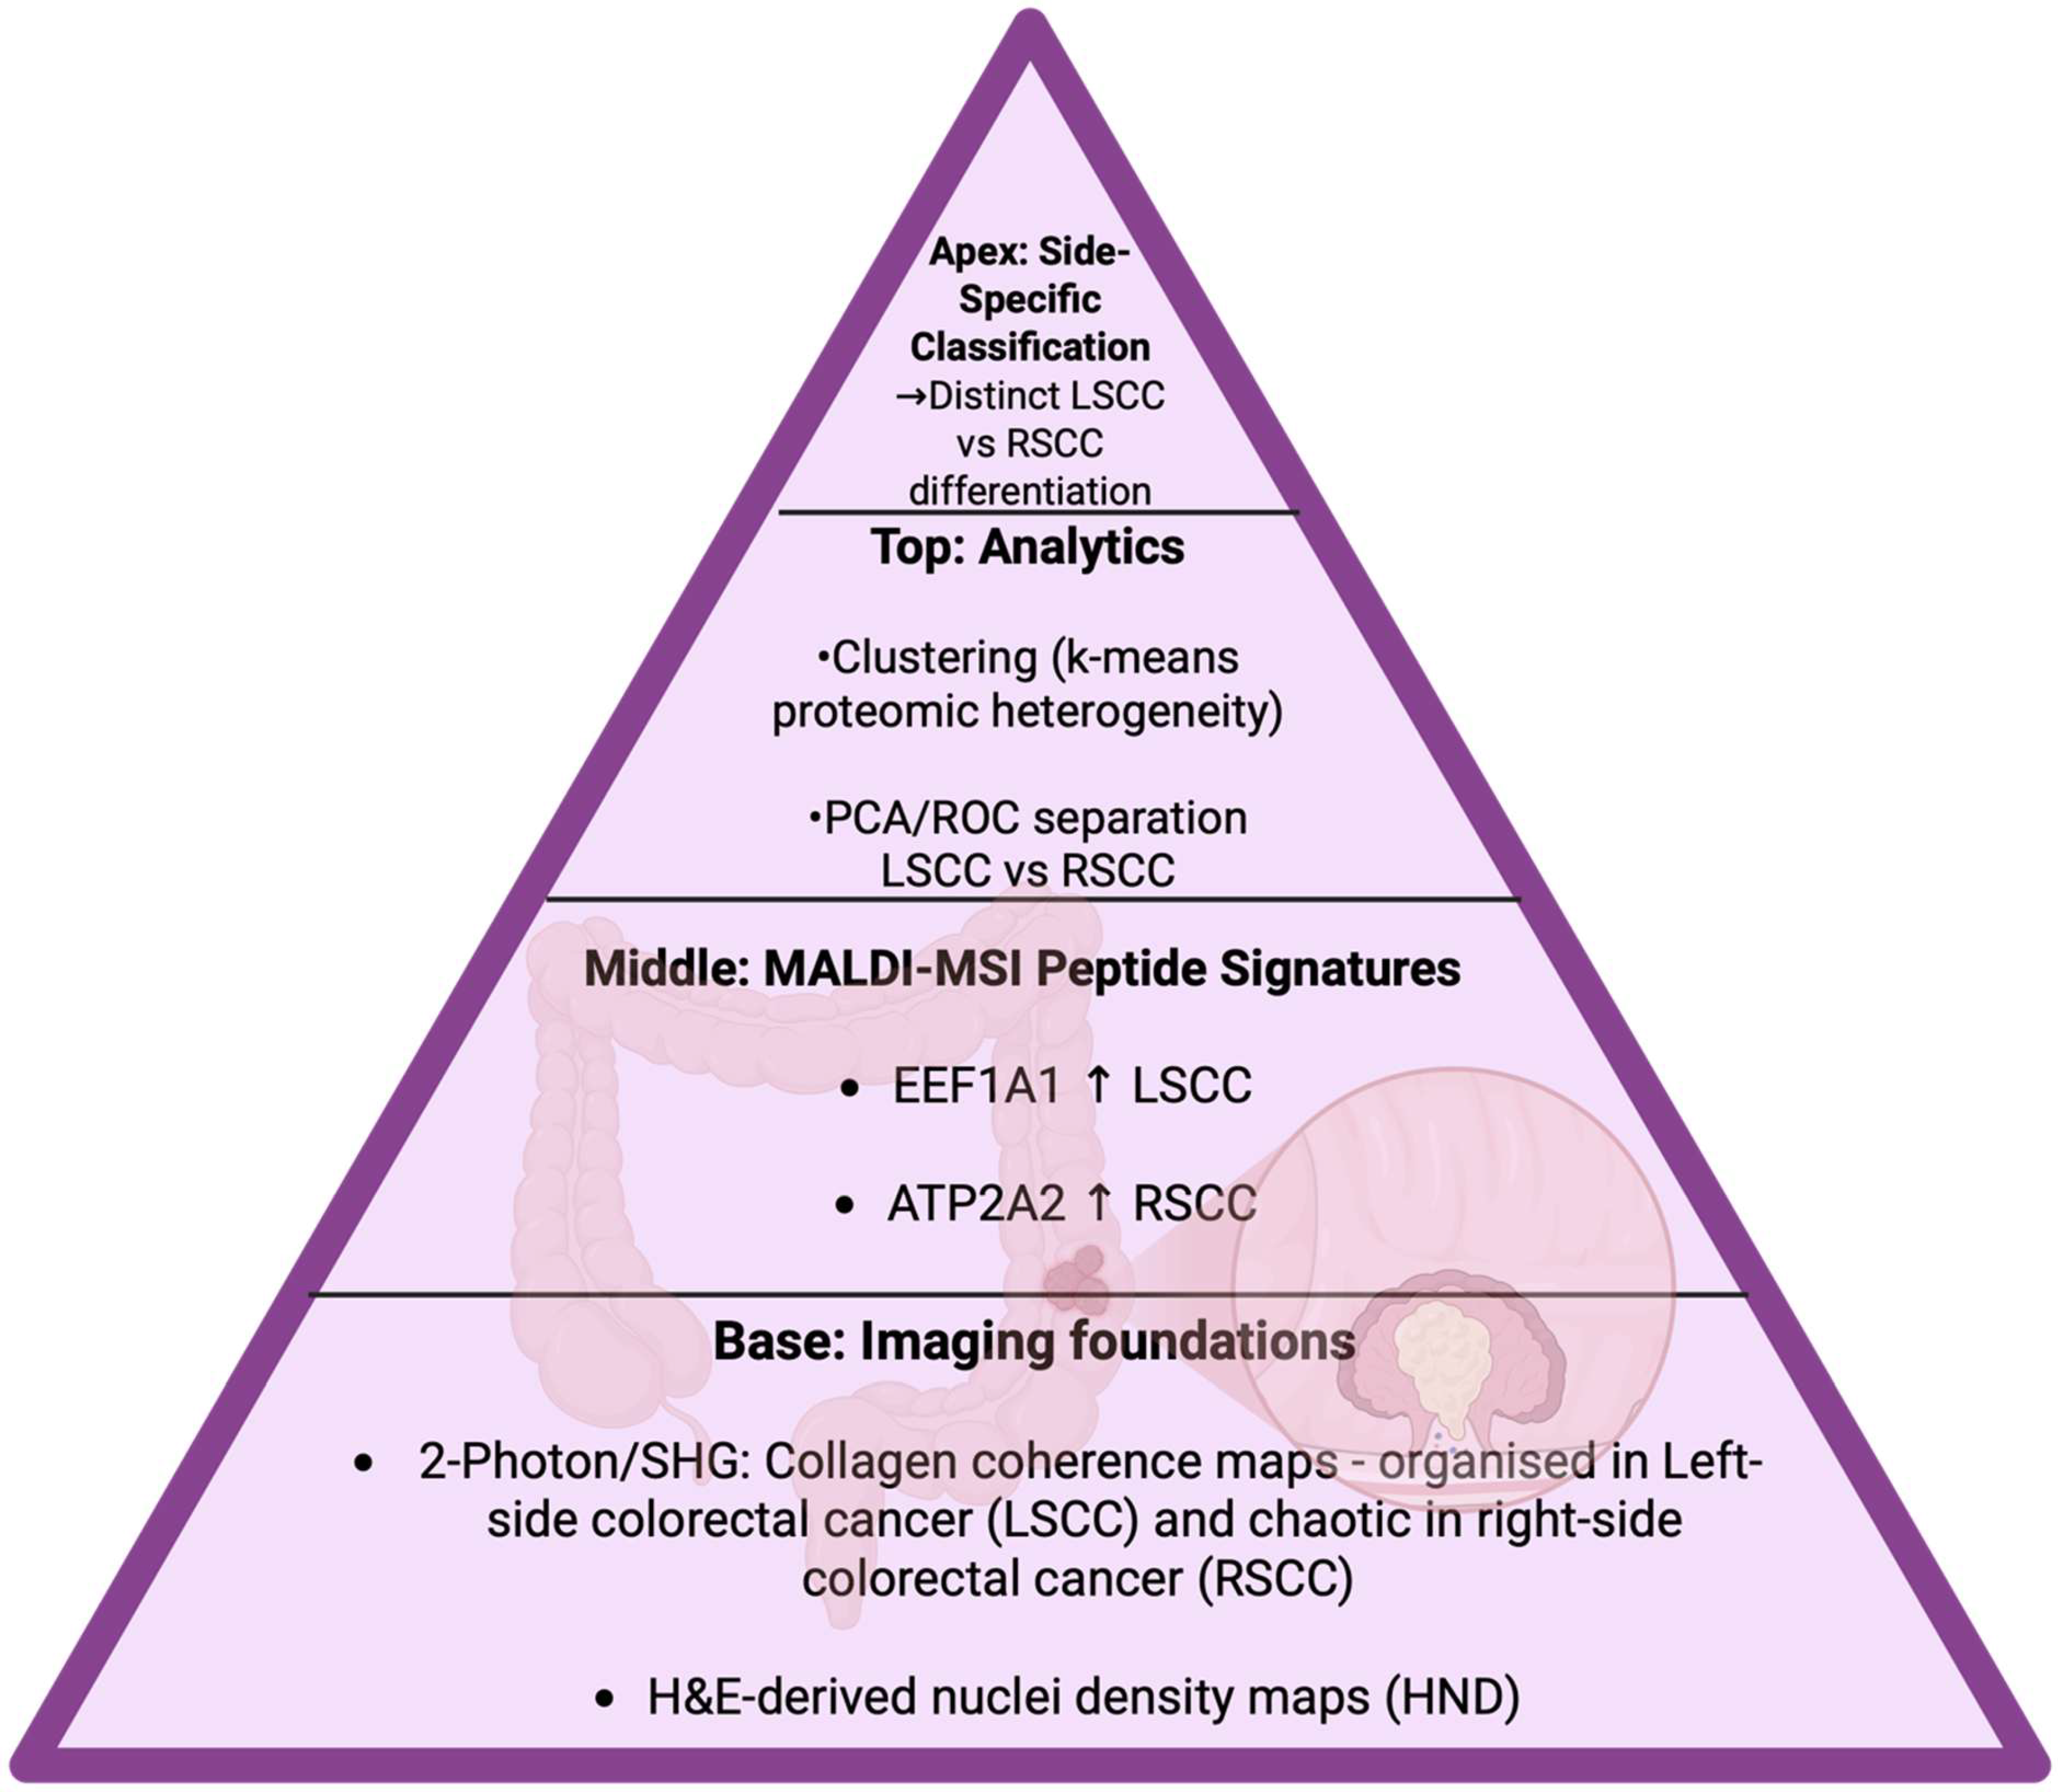
| 1 | Bharti A et al., 2024 [188] | Combination of MALDI-MSI with two photon laser scanning microscopy and histology on human colorectal cancer tissue section. | Showed local heterogeneity in colorectal cancer by co-registering MALDI molecular maps with collagen structure and 2-photon features that highlighted region-specific molecular signatures that are linked to tumor microenvironment [Figure 26]. |
| 2 | Stillger MN et al., 2024 [189] | Review on MALDI-MSI use on rare cancers like sarcoma. | Showed discoveries like metabolic signatures by MALDI in sarcomas and put focus on the challenges in sample prep and FFPE usage and proposed processes to translate MALDI spatial biomarkers for rare cancer research. |
| 3 | Brorsen LF et al., 2024 [190] | MALDI characterization of cutaneous squamous cell carcinoma (SCC) along with machine learning. | Showed MALDI-MSI metabolites features that distinguish SCC tissue regions and support automated histology-aligned classifications. |
| 4 | Hartig JP et al., 2024 [191] | MALDI-MSI analysis of prostate cancer tissue microarrays, putting focus on N-glycan ECM protein composition. | Were able to identify N-glycan and collagen ECM protein patterns that differentiated the outcome groups and suggested ECM linked molecular features as a probable early predictor of prostate cancer metastasis. |
3.26. Year 2025
| No. | Author | Application | Result |
|---|---|---|---|
| 1 | Phulara NR et al., 2025 [196] | Mouse pancreatic ductal adenocarcinoma (PDAC) tumors treated with gemcitabine for the MALDI imaging of lipid metabolites. | Gemcitabine shifted tumor phosphatidylcholine metabolism and PCs such as 30:0, 32:3, 34:2, 36:1, 36:2 had been elevated in treated tumors and indicated therapy linked remodeling. |
| 2 | Chen B et al., 2025 [197] | The evaluation of sphingolipid detection by MALDI which was validated on PyMT breast cancer tissue and glioblastoma samples. | Put forth the best-practice matrices and ion modes, clarified fragmentation artifacts, for example, SM into S1P/C1P and showed the validated detection of ceramides and glycosphingolipids in cancer |
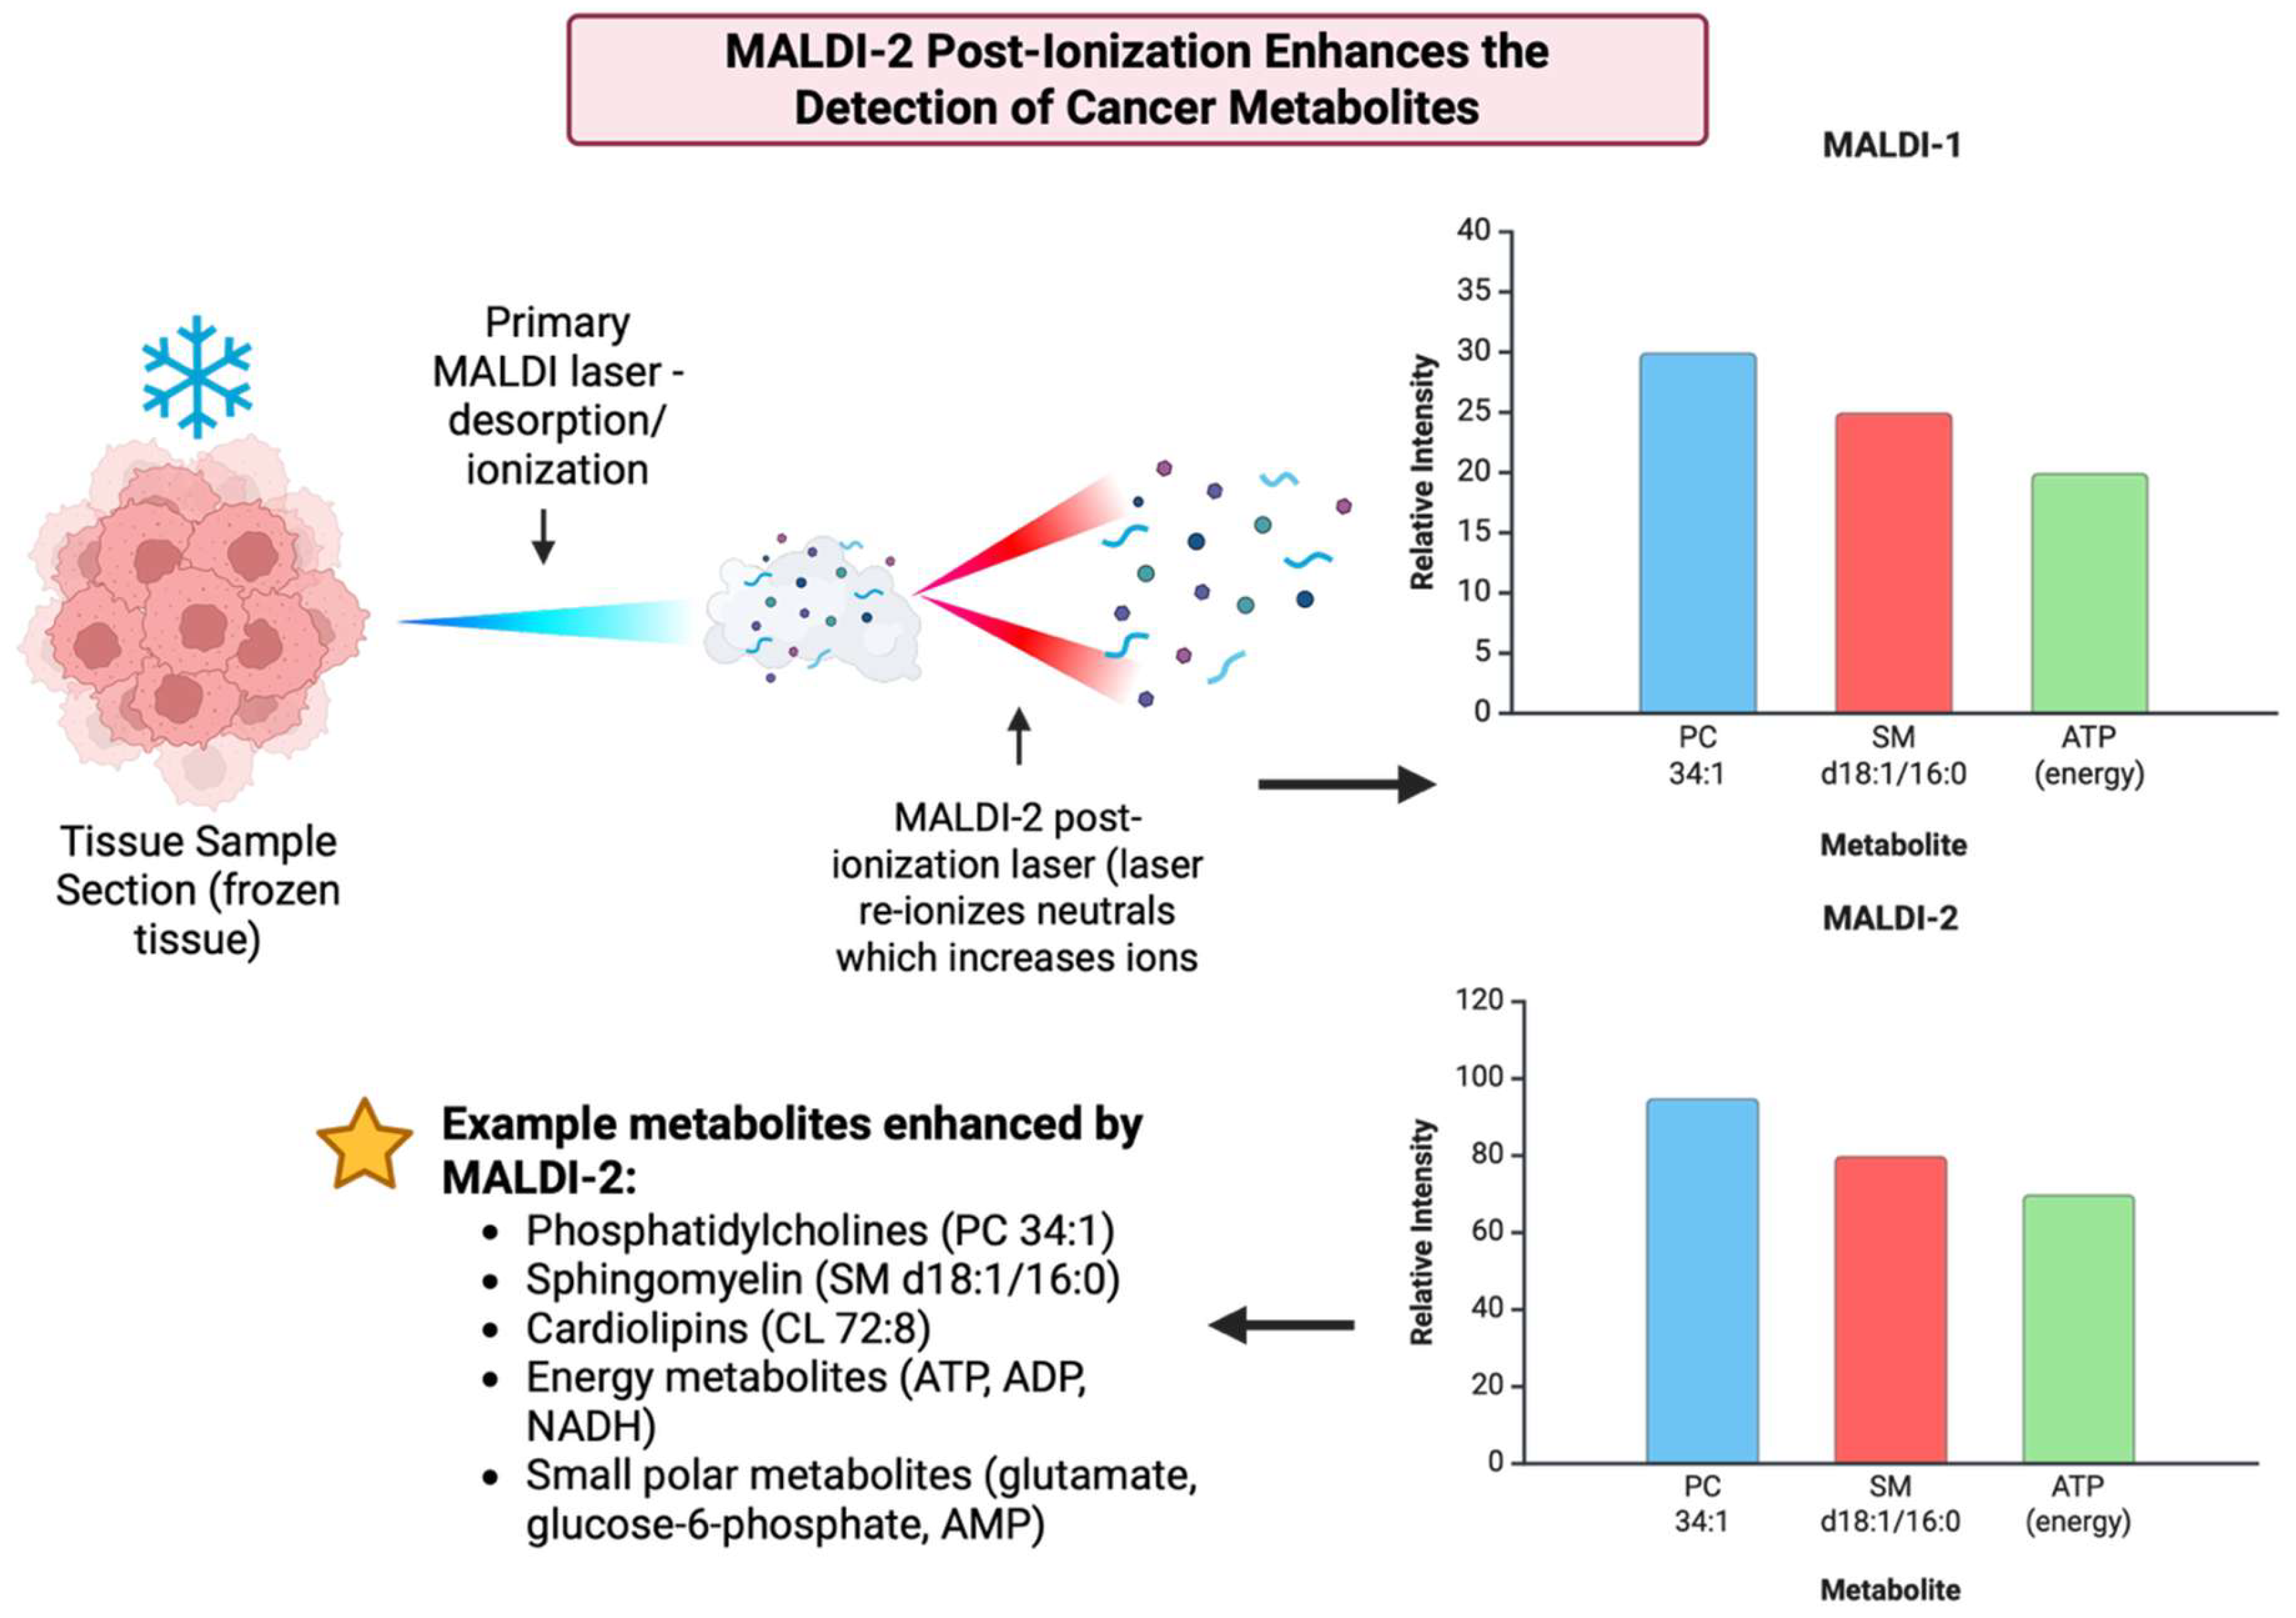
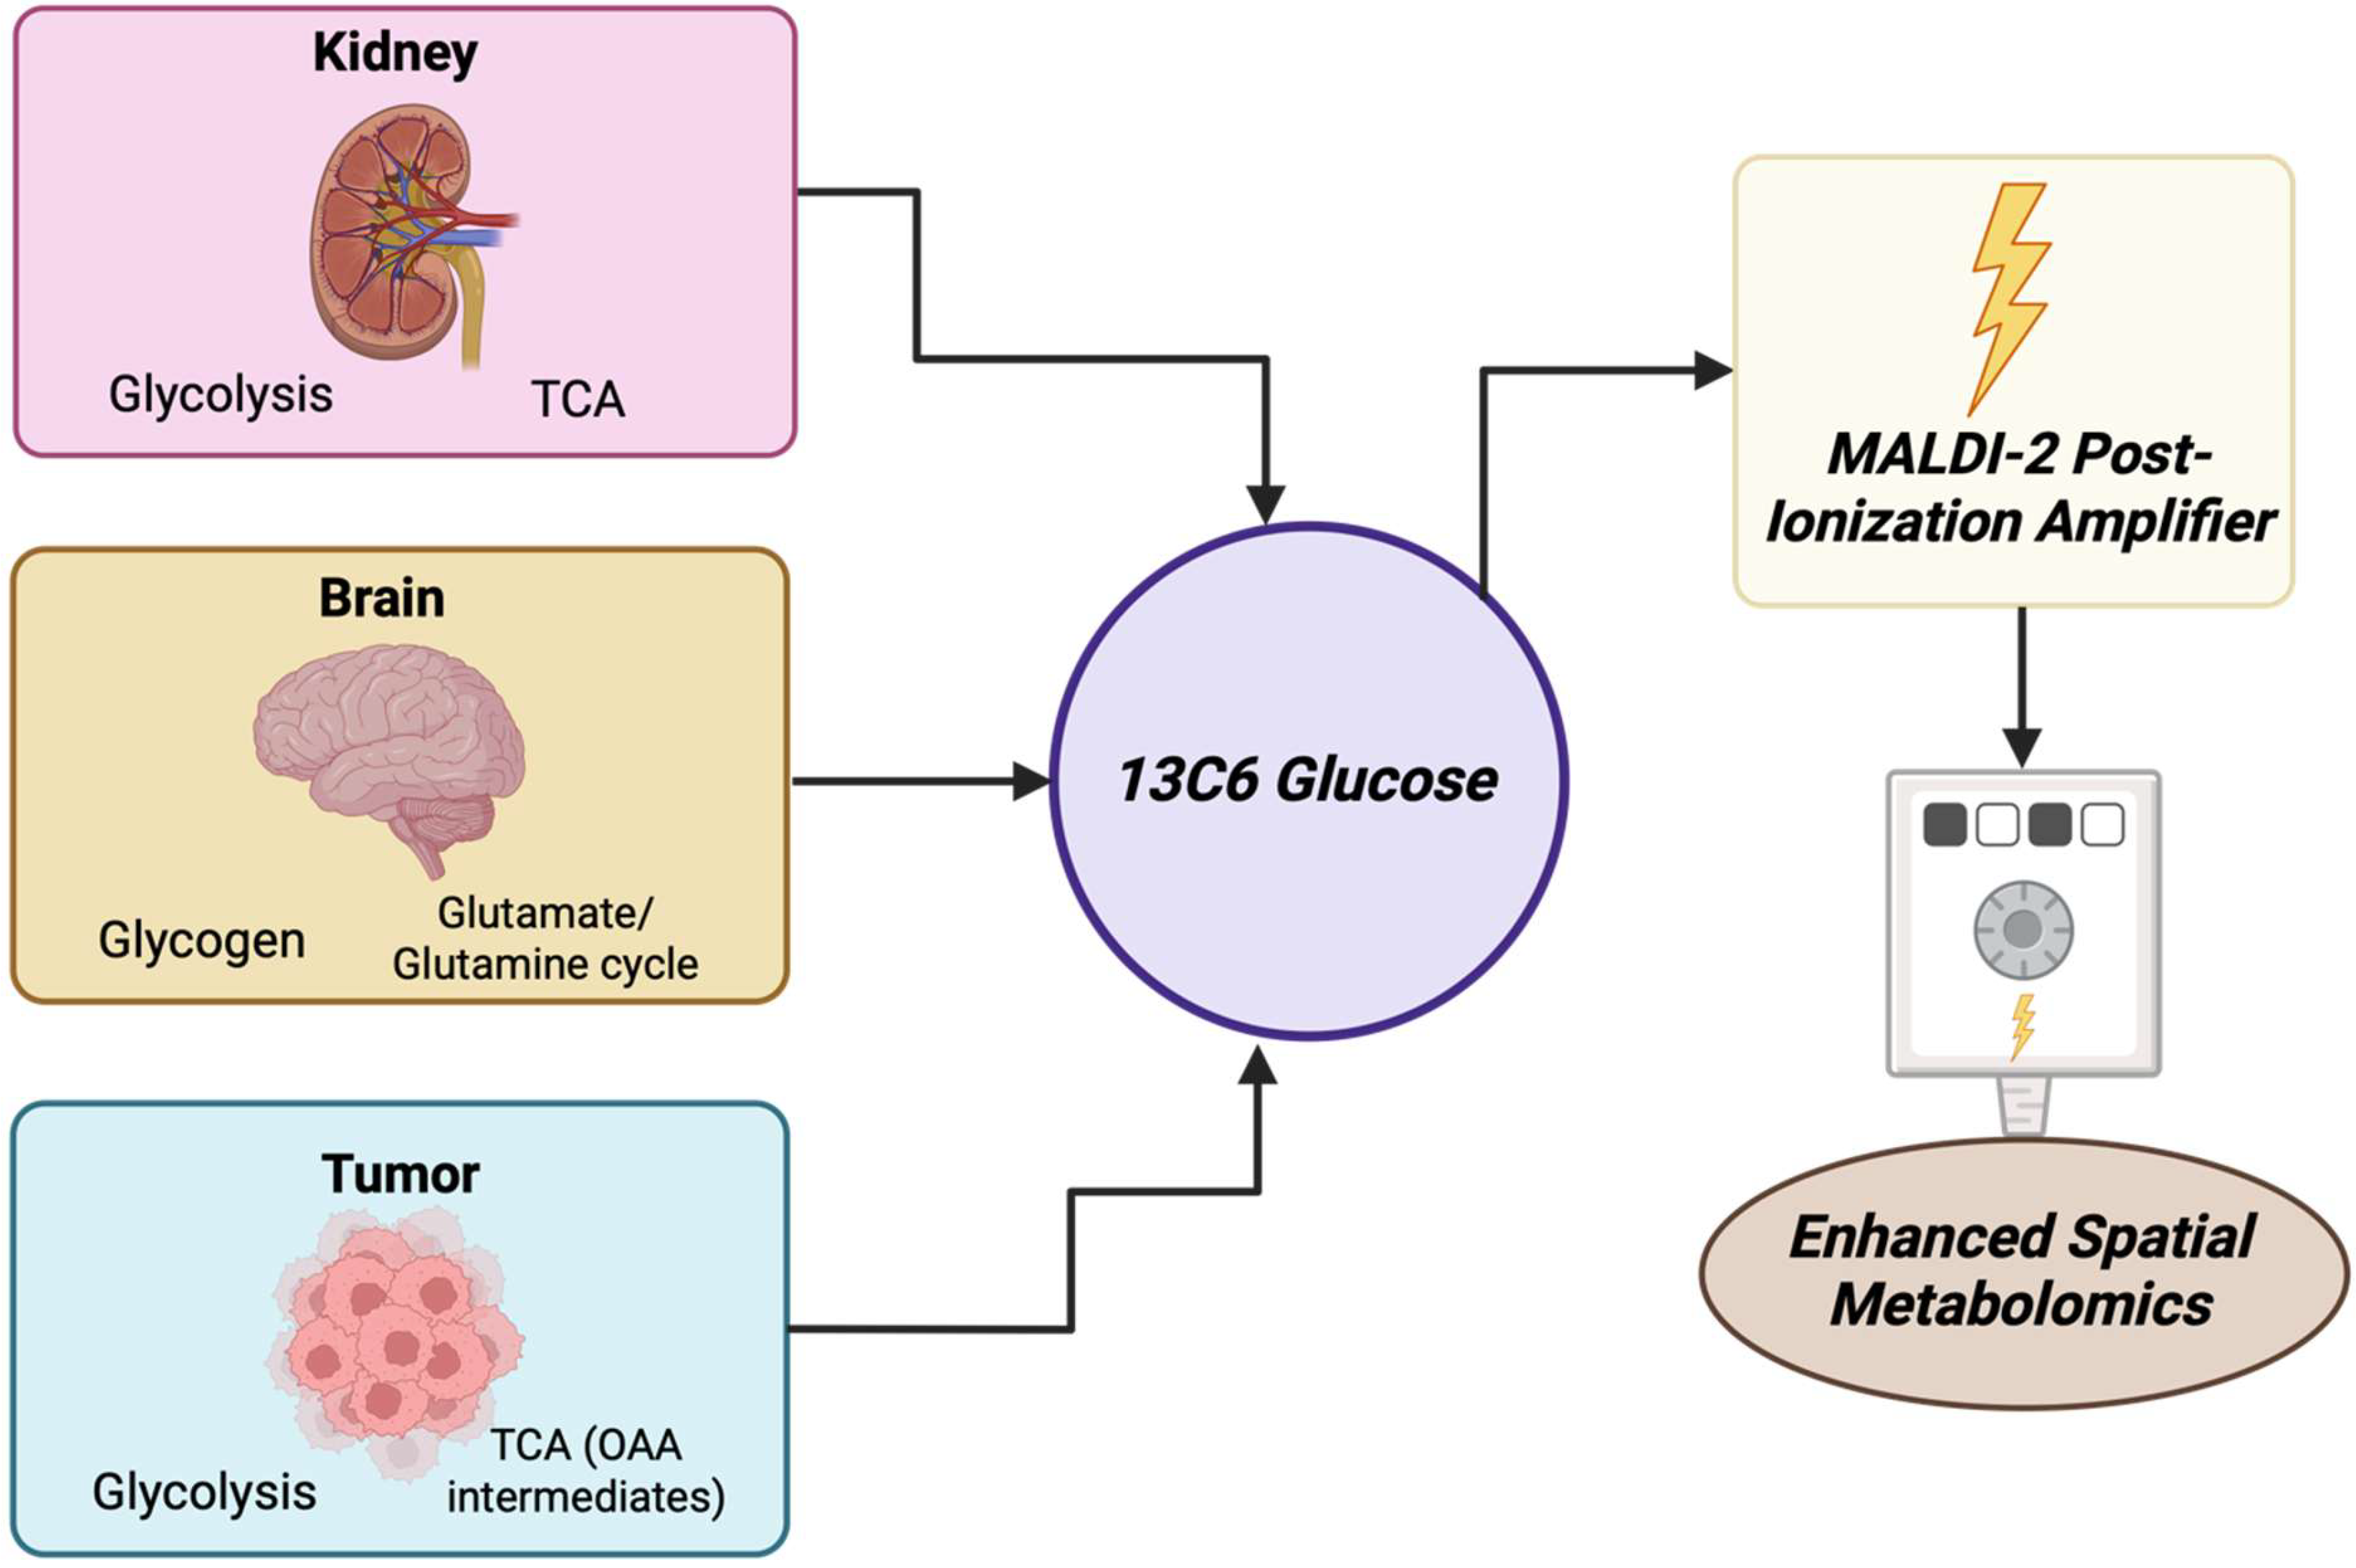
| 3 | Chen Y et al., 2025 [198] | Optimized MALDI-2 MSI to be able to trace stable isotopes in mouse breast, kidney and brain tumors to map ^13C-glucose derived intermediates. | Enabled the spatial glycomics of multiple pathways such as PPP, glycolysis, and TCA in tumors which revealed heterogeneity and markedly expanding low-MW metabolite coverage. |
| 4 | Krestensen KK et al., 2025 [199] | GBM patient-derived single cells and combined with high-resolution MALDI-MSI with MALDI-IHC markers. | The multimodal single-cell procedure showed cell-type-specific lipid profiles for example, PCs, TGs, and SMs and was able to accurately classify GBM vs. neuronal cells and showed metabolite-informed phenotyping. |
4. Recent Trends and Future Directions
4.1. Artificial Intelligence and Deep Learning
4.2. Personalized Medicine
4.3. Regulatory Outlook
4.4. Limitations and Challenges
5. Conclusions
Author Contributions
Funding
Conflicts of Interest
References
- Siegel, R.L.; Kratzer, T.B.; Giaquinto, A.N.; Sung, H.; Jemal, A. Cancer statistics, 2025. CA Cancer J. Clin. 2025, 75, 10–45. [Google Scholar] [CrossRef] [PubMed] [PubMed Central]
- Lunt, S.Y.; Vander Heiden, M.G. Aerobic glycolysis: Meeting the metabolic requirements of cell proliferation. Annu. Rev. Cell Dev. Biol. 2011, 27, 441–464. [Google Scholar] [CrossRef] [PubMed]
- Ohshima, K. The Landscape of Cancer Metabolism as a Therapeutic Target. Pathol. Int. 2025, 75, 387–402. [Google Scholar] [CrossRef] [PubMed]
- Warburg, O. On the origin of cancer cells. Science 1956, 123, 309–314. [Google Scholar] [CrossRef] [PubMed]
- Goldstraw, P.; Chansky, K.; Crowley, J.; Rami-Porta, R.; Asamura, H.; Eberhardt, W.E.; Nicholson, A.G.; Groome, P.; Mitchell, A.; Bolejack, V.; et al. The IASLC Lung Cancer Staging Project: Proposals for Revision of the TNM Stage Groupings in the Forthcoming (Eighth) Edition of the TNM Classification for Lung Cancer. J. Thorac. Oncol. 2016, 11, 39–51. [Google Scholar] [CrossRef] [PubMed]
- Cheung, P.K.; Ma, M.H.; Yeung, K.F.; Tsang, H.F.; Chu, M.K.M.; Kan, C.M.; Cho, W.C.S.; Ng, L.B.W.; Chan, L.W.C.; Wong, S.C.C. The applications of metabolomics in the molecular diagnostics of Cancer. Expert Rev. Mol. Diagn. 2019, 19, 785–793. [Google Scholar] [CrossRef] [PubMed]
- Gadwal, A.; Panigrahi, P.; Khokhar, M.; Sharma, V.; Setia, P.; Vishnoi, J.R.; Elhence, P.; Purohit, P. A critical appraisal of the role of metabolomics in breast cancer research and diagnostics. Clin. Chim. Acta 2024, 561, 119836. [Google Scholar] [CrossRef] [PubMed]
- Vermeersch, K.A.; Styczynski, M.P. Applications of metabolomics in cancer research. J. Carcinog. 2013, 12, 9. [Google Scholar] [CrossRef]
- Want, E.J.; Cravatt, B.F.; Siuzdak, G. The expanding role of mass spectrometry in metabolite profiling and characterization. Chembiochem 2005, 6, 1941–1951. [Google Scholar] [CrossRef] [PubMed]
- Ren, J.L.; Zhang, A.H.; Kong, L.; Wang, X.J. Advances in mass spectrometry-based metabolomics for investigation of metabolites. RSC Adv. 2018, 8, 22335–22350. [Google Scholar] [CrossRef] [PubMed] [PubMed Central]
- Ma, X.; Fernández, F.M. Advances in mass spectrometry imaging for spatial cancer metabolomics. Mass Spectrom. Rev. 2024, 43, 235–268. [Google Scholar] [CrossRef] [PubMed] [PubMed Central]
- Wang, X.; Han, J.; Hardie, D.B.; Yang, J.; Pan, J.; Borchers, C.H. Metabolomic profiling of prostate cancer by matrix assisted laser desorption/ionization-Fourier transform ion cyclotron resonance mass spectrometry imaging using Matrix Coating Assisted by an Electric Field (MCAEF). Biochim. Biophys. Acta Proteins Proteom. 2017, 1865, 755–767. [Google Scholar] [CrossRef] [PubMed]
- Lai, X.; Guo, K.; Huang, W.; Su, Y.; Chen, S.; Li, Q.; Liang, K.; Gao, W.; Wang, X.; Chen, Y.; et al. Combining MALDI-MS with machine learning for metabolomic characterization of lung cancer patient sera. Anal. Methods 2022, 14, 499–507. [Google Scholar] [CrossRef] [PubMed]
- Kwon, H.J.; Oh, J.Y.; Lee, K.S.; Lim, H.K.; Lee, J.; Yoon, H.R.; Jung, J. Lipid Profiles Obtained from MALDI Mass Spectrometric Imaging in Liver Cancer Metastasis Model. Int. J. Anal. Chem. 2022, 2022, 6007158. [Google Scholar] [CrossRef] [PubMed] [PubMed Central]
- Hillenkamp, F.; Karas, M.; Beavis, R.C.; Chait, B.T. Matrix-assisted laser desorption/ionization mass spectrometry of biopolymers. Anal. Chem. 1991, 63, 1193A–1203A. [Google Scholar] [CrossRef] [PubMed]
- Kaufmann, R. Matrix-assisted laser desorption ionization (MALDI) mass spectrometry: A novel analytical tool in molecular biology and biotechnology. J. Biotechnol. 1995, 41, 155–175. [Google Scholar] [CrossRef] [PubMed]
- Stults, J.T. Matrix-assisted laser desorption/ionization mass spectrometry (MALDI-MS). Curr. Opin. Struct. Biol. 1995, 5, 691–698. [Google Scholar] [CrossRef] [PubMed]
- Knochenmuss, R. Ion formation mechanisms in UV-MALDI. Analyst 2006, 131, 966–986. [Google Scholar] [CrossRef] [PubMed]
- Lu, I.C.; Lee, C.; Lee, Y.T.; Ni, C.K. Ionization Mechanism of Matrix-Assisted Laser Desorption/Ionization. Annu. Rev. Anal. Chem. 2015, 8, 21–39. [Google Scholar] [CrossRef] [PubMed]
- Beavis, R.C.; Chait, B.T. Matrix-assisted laser-desorption mass spectrometry using 355 nm radiation. Rapid Commun. Mass Spectrom. 1989, 3, 436–439. [Google Scholar] [CrossRef] [PubMed]
- Kussmann, M.; Roepstorff, P. Sample preparation techniques for peptides and proteins analyzed by MALDI-MS. Methods Mol. Biol. 2000, 146, 405–424. [Google Scholar] [CrossRef] [PubMed]
- Bizzini, A.; Greub, G. Matrix-assisted laser desorption ionization time-of-flight mass spectrometry, a revolution in clinical microbial identification. Clin. Microbiol. Infect. 2010, 16, 1614–1619. [Google Scholar] [CrossRef] [PubMed]
- Clark, A.E.; Kaleta, E.J.; Arora, A.; Wolk, D.M. Matrix-assisted laser desorption ionization-time of flight mass spectrometry: A fundamental shift in the routine practice of clinical microbiology. Clin. Microbiol. Rev. 2013, 26, 547–603. [Google Scholar] [CrossRef] [PubMed] [PubMed Central]
- Leopold, J.; Popkova, Y.; Engel, K.M.; Schiller, J. Recent Developments of Useful MALDI Matrices for the Mass Spectrometric Characterization of Lipids. Biomolecules 2018, 8, 173. [Google Scholar] [CrossRef] [PubMed] [PubMed Central]
- Barré, F.P.Y.; Paine, M.R.L.; Flinders, B.; Trevitt, A.J.; Kelly, P.D.; Ait-Belkacem, R.; Garcia, J.P.; Creemers, L.B.; Stauber, J.; Vreeken, R.J.; et al. Enhanced Sensitivity Using MALDI Imaging Coupled with Laser Postionization (MALDI-2) for Pharmaceutical Research. Anal. Chem. 2019, 91, 10840–10848. [Google Scholar] [CrossRef] [PubMed] [PubMed Central]
- McKinnon, J.C.; Milioli, H.H.; Purcell, C.A.; Chaffer, C.L.; Wadie, B.; Alexandrov, T.; Mitchell, T.W.; Ellis, S.R. Enhancing metabolite coverage in MALDI-MSI using laser post-ionisation (MALDI-2). Anal. Methods 2023, 15, 4311–4320. [Google Scholar] [CrossRef] [PubMed]
- Berghmans, E.; Boonen, K.; Maes, E.; Mertens, I.; Pauwels, P.; Baggerman, G. Implementation of MALDI Mass Spectrometry Imaging in Cancer Proteomics Research: Applications and Challenges. J. Pers. Med. 2020, 10, 54. [Google Scholar] [CrossRef] [PubMed] [PubMed Central]
- Lee, J.H.; Kim, Y.H.; Kim, K.H.; Cho, J.Y.; Woo, S.M.; Yoo, B.C.; Kim, S.C. Profiling of Serum Metabolites Using MALDI-TOF and Triple-TOF Mass Spectrometry to Develop a Screen for Ovarian Cancer. Cancer Res. Treat. 2018, 50, 883–893. [Google Scholar] [CrossRef] [PubMed] [PubMed Central]
- Lu, T.; Freytag, L.; Narayana, V.K.; Moore, Z.; Oliver, S.J.; Valkovic, A.; Nijagal, B.; Peterson, A.L.; de Souza, D.P.; McConville, M.J.; et al. Matrix Selection for the Visualization of Small Molecules and Lipids in Brain Tumors Using Untargeted MALDI-TOF Mass Spectrometry Imaging. Metabolites 2023, 13, 1139. [Google Scholar] [CrossRef] [PubMed] [PubMed Central]
- Lim, H.; Eng, J.; Yates, J.R., 3rd; Tollaksen, S.L.; Giometti, C.S.; Holden, J.F.; Adams, M.W.; Reich, C.I.; Olsen, G.J.; Hays, L.G. Identification of 2D-gel proteins: A comparison of MALDI/TOF peptide mass mapping to mu LC-ESI tandem mass spectrometry. J. Am. Soc. Mass Spectrom. 2003, 14, 957–970. [Google Scholar] [CrossRef] [PubMed]
- Hendriks, T.F.E.; Krestensen, K.K.; Mohren, R.; Vandenbosch, M.; De Vleeschouwer, S.; Heeren, R.M.A.; Cuypers, E. MALDI-MSI-LC-MS/MS Workflow for Single-Section Single Step Combined Proteomics and Quantitative Lipidomics. Anal. Chem. 2024, 96, 4266–4274. [Google Scholar] [CrossRef] [PubMed] [PubMed Central]
- Shahgholi, M.; Garcia, B.A.; Chiu, N.H.; Heaney, P.J.; Tang, K. Sugar additives for MALDI matrices improve signal allowing the smallest nucleotide change (A:T) in a DNA sequence to be resolved. Nucleic Acids Res. 2001, 29, E91. [Google Scholar] [CrossRef] [PubMed] [PubMed Central]
- Walch, A.; Rauser, S.; Deininger, S.O.; Höfler, H. MALDI imaging mass spectrometry for direct tissue analysis: A new frontier for molecular histology. Histochem. Cell Biol. 2008, 130, 421–434. [Google Scholar] [CrossRef] [PubMed] [PubMed Central]
- Lai, Y.H.; Wang, Y.S. Matrix-Assisted Laser Desorption/Ionization Mass Spectrometry: Mechanistic Studies and Methods for Improving the Structural Identification of Carbohydrates. Mass Spectrom. 2017, 6, S0072. [Google Scholar] [CrossRef] [PubMed] [PubMed Central]
- Palmer-Toy, D.E.; Sarracino, D.A.; Sgroi, D.; LeVangie, R.; Leopold, P.E. Direct acquisition of matrix-assisted laser Desorption/Ionization time-of-flight mass spectra from laser capture microdissected tissues. Clin. Chem. 2000, 46, 1513–1516. [Google Scholar] [CrossRef] [PubMed][Green Version]
- Stoeckli, M.; Chaurand, P.; Hallahan, D.E.; Caprioli, R.M. Imaging mass spectrometry: A new technology for the analysis of protein expression in mammalian tissues. Nat. Med. 2001, 7, 493–496. [Google Scholar] [CrossRef] [PubMed]
- Todd, P.J.; Schaaff, T.G.; Chaurand, P.; Caprioli, R.M. Organic ion imaging of biological tissue with secondary ion mass spectrometry and matrix-assisted laser desorption/ionization. J. Mass Spectrom. 2001, 36, 355–369. [Google Scholar] [CrossRef] [PubMed]
- Chong, B.E.; Hamler, R.L.; Lubman, D.M.; Ethier, S.P.; Rosenspire, A.J.; Miller, F.R. Differential screening and mass mapping of proteins from premalignant and cancer cell lines using nonporous reversed-phase HPLC coupled with mass spectrometric analysis. Anal. Chem. 2001, 73, 1219–1227. [Google Scholar] [CrossRef] [PubMed]
- Oppenheimer, S.R.; Mi, D.; Sanders, M.E.; Caprioli, R.M. Molecular analysis of tumor margins by MALDI mass spectrometry in renal carcinoma. J. Proteome Res. 2010, 9, 2182–2190. [Google Scholar] [CrossRef] [PubMed] [PubMed Central]
- Chaurand, P.; DaGue, B.B.; Pearsall, R.S.; Threadgill, D.W.; Caprioli, R.M. Profiling proteins from azoxymethane-induced colon tumors at the molecular level by matrix-assisted laser desorption/ionization mass spectrometry. Proteomics 2001, 1, 1320–1326. [Google Scholar] [CrossRef] [PubMed]
- Franck, J.; Arafah, K.; Elayed, M.; Bonnel, D.; Vergara, D.; Jacquet, A.; Vinatier, D.; Wisztorski, M.; Day, R.; Fournier, I.; et al. MALDI imaging mass spectrometry: State of the art technology in clinical proteomics. Mol. Cell Proteom. 2009, 8, 2023–2033. [Google Scholar] [CrossRef] [PubMed] [PubMed Central]
- Le Naour, F.; Misek, D.E.; Krause, M.C.; Deneux, L.; Giordano, T.J.; Scholl, S.; Hanash, S.M. Proteomics-based identification of RS/DJ-1 as a novel circulating tumor antigen in breast Cancer. Clin. Cancer Res. 2001, 7, 3328–3335. [Google Scholar] [PubMed]
- McDonnell, L.A.; Corthals, G.L.; Willems, S.M.; van Remoortere, A.; van Zeijl, R.J.; Deelder, A.M. Peptide and protein imaging mass spectrometry in cancer research. J. Proteom. 2010, 73, 1921–1944. [Google Scholar] [CrossRef] [PubMed]
- Issaq, H.J.; Veenstra, T.D.; Conrads, T.P.; Felschow, D. The SELDI-TOF MS approach to proteomics: Protein profiling and biomarker identification. Biochem. Biophys. Res. Commun. 2002, 292, 587–592. [Google Scholar] [CrossRef] [PubMed]
- Gustafsson, J.O.; Oehler, M.K.; Ruszkiewicz, A.; McColl, S.R.; Hoffmann, P. MALDI Imaging Mass Spectrometry (MALDI-IMS)-application of spatial proteomics for ovarian cancer classification and diagnosis. Int. J. Mol. Sci. 2011, 12, 773–794. [Google Scholar] [CrossRef] [PubMed] [PubMed Central]
- Petricoin, E.F.; Ardekani, A.M.; Hitt, B.A.; Levine, P.J.; Fusaro, V.A.; Steinberg, S.M.; Mills, G.B.; Simone, C.; Fishman, D.A.; Kohn, E.C.; et al. Use of proteomic patterns in serum to identify ovarian Cancer. Lancet 2002, 359, 572–577. [Google Scholar] [CrossRef] [PubMed]
- Chen, Y.C.; Li, T.Y.; Tsai, M.F. Analysis of the saliva from patients with oral cancer by matrix-assisted laser desorption/ionization time-of-flight mass spectrometry. Rapid Commun. Mass Spectrom. 2002, 16, 364–369. [Google Scholar] [CrossRef] [PubMed]
- Ball, G.; Mian, S.; Holding, F.; Allibone, R.O.; Lowe, J.; Ali, S.; Li, G.; McCardle, S.; Ellis, I.O.; Creaser, C.; et al. An integrated approach utilizing artificial neural networks and SELDI mass spectrometry for the classification of human tumours and rapid identification of potential biomarkers. Bioinformatics 2002, 18, 395–404. [Google Scholar] [CrossRef] [PubMed]
- Petricoin, E.F., 3rd; Ornstein, D.K.; Paweletz, C.P.; Ardekani, A.; Hackett, P.S.; Hitt, B.A.; Velassco, A.; Trucco, C.; Wiegand, L.; Wood, K.; et al. Serum proteomic patterns for detection of prostate Cancer. J. Natl. Cancer Inst. 2002, 94, 1576–1578. [Google Scholar] [CrossRef] [PubMed]
- Basso, D.; Valerio, A.; Seraglia, R.; Mazza, S.; Piva, M.G.; Greco, E.; Fogar, P.; Gallo, N.; Pedrazzoli, S.; Tiengo, A.; et al. Putative pancreatic cancer-associated diabetogenic factor: 2030 MW peptide. Pancreas 2002, 24, 8–14. [Google Scholar] [CrossRef] [PubMed]
- Xu, B.J.; Caprioli, R.M.; Sanders, M.E.; Jensen, R.A. Direct analysis of laser capture microdissected cells by MALDI mass spectrometry. J. Am. Soc. Mass Spectrom. 2002, 13, 1292–1297. [Google Scholar] [CrossRef] [PubMed]
- Tan, S.; Seow, T.K.; Liang, R.C.; Koh, S.; Lee, C.P.; Chung, M.C.; Hooi, S.C. Proteome analysis of butyrate-treated human colon cancer cells (HT-29). Int. J. Cancer 2002, 98, 523–531. [Google Scholar] [CrossRef] [PubMed]
- Kim, J.; Kim, S.H.; Lee, S.U.; Ha, G.H.; Kang, D.G.; Ha, N.Y.; Ahn, J.S.; Cho, H.Y.; Kang, S.J.; Lee, Y.J.; et al. Proteome analysis of human liver tumor tissue by two-dimensional gel electrophoresis and matrix assisted laser desorption/ionization-mass spectrometry for identification of disease-related proteins. Electrophoresis 2002, 23, 4142–4156. [Google Scholar] [CrossRef] [PubMed]
- Yanagisawa, K.; Shyr, Y.; Xu, B.J.; Massion, P.P.; Larsen, P.H.; White, B.C.; Roberts, J.R.; Edgerton, M.; Gonzalez, A.; Nadaf, S.; et al. Proteomic patterns of tumour subsets in non-small-cell lung Cancer. Lancet 2003, 362, 433–439. [Google Scholar] [CrossRef] [PubMed]
- Schwartz, S.A.; Reyzer, M.L.; Caprioli, R.M. Direct tissue analysis using matrix-assisted laser desorption/ionization mass spectrometry: Practical aspects of sample preparation. J. Mass Spectrom. 2003, 38, 699–708. [Google Scholar] [CrossRef] [PubMed]
- Poon, T.C.; Yip, T.T.; Chan, A.T.; Yip, C.; Yip, V.; Mok, T.S.; Lee, C.C.; Leung, T.W.; Ho, S.K.; Johnson, P.J. Comprehensive proteomic profiling identifies serum proteomic signatures for detection of hepatocellular carcinoma and its subtypes. Clin. Chem. 2003, 49, 752–760. [Google Scholar] [CrossRef] [PubMed]
- Reyzer, M.L.; Hsieh, Y.; Ng, K.; Korfmacher, W.A.; Caprioli, R.M. Direct analysis of drug candidates in tissue by matrix-assisted laser desorption/ionization mass spectrometry. J. Mass Spectrom. 2003, 38, 1081–1092. [Google Scholar] [CrossRef] [PubMed]
- Campa, M.J.; Wang, M.Z.; Howard, B.; Fitzgerald, M.C.; Patz, E.F., Jr. Protein expression profiling identifies macrophage migration inhibitory factor and cyclophilin a as potential molecular targets in non-small cell lung Cancer. Cancer Res. 2003, 63, 1652–1656. [Google Scholar] [PubMed]
- Roshan, D. 2003 Procedure for Cancer Metabolite Detection. 2025. Available online: https://BioRender.com/tj5hdbm (accessed on 2 September 2025).
- Schöne, C.; Höfler, H.; Walch, A. MALDI imaging mass spectrometry in cancer research: Combining proteomic profiling and histological evaluation. Clin. Biochem. 2013, 46, 539–545. [Google Scholar] [CrossRef] [PubMed]
- Végvári, A.; Fehniger, T.E.; Gustavsson, L.; Nilsson, A.; Andrén, P.E.; Kenne, K.; Nilsson, J.; Laurell, T.; Marko-Varga, G. Essential tactics of tissue preparation and matrix nano-spotting for successful compound imaging mass spectrometry. J. Proteom. 2010, 73, 1270–1278. [Google Scholar] [CrossRef] [PubMed]
- Chaurand, P.; Schwartz, S.A.; Billheimer, D.; Xu, B.J.; Crecelius, A.; Caprioli, R.M. Integrating histology and imaging mass spectrometry. Anal. Chem. 2004, 76, 1145–1155. [Google Scholar] [CrossRef] [PubMed]
- Shen, Z.; Go, E.P.; Gamez, A.; Apon, J.V.; Fokin, V.; Greig, M.; Ventura, M.; Crowell, J.E.; Blixt, O.; Paulson, J.C.; et al. A mass spectrometry plate reader: Monitoring enzyme activity and inhibition with a Desorption/Ionization on Silicon (DIOS) platform. Chembiochem 2004, 5, 921–927. [Google Scholar] [CrossRef] [PubMed]
- Schwartz, S.A.; Weil, R.J.; Thompson, R.C.; Shyr, Y.; Moore, J.H.; Toms, S.A.; Johnson, M.D.; Caprioli, R.M. Proteomic-based prognosis of brain tumor patients using direct-tissue matrix-assisted laser desorption ionization mass spectrometry. Cancer Res. 2005, 65, 7674–7681. [Google Scholar] [CrossRef] [PubMed]
- Crecelius, A.C.; Cornett, D.S.; Caprioli, R.M.; Williams, B.; Dawant, B.M.; Bodenheimer, B. Three-dimensional visualization of protein expression in mouse brain structures using imaging mass spectrometry. J. Am. Soc. Mass Spectrom. 2005, 16, 1093–1099. [Google Scholar] [CrossRef] [PubMed]
- Jurchen, J.C.; Rubakhin, S.S.; Sweedler, J.V. MALDI-MS imaging of features smaller than the size of the laser beam. J. Am. Soc. Mass Spectrom. 2005, 16, 1654–1659. [Google Scholar] [CrossRef] [PubMed]
- Rohner, T.C.; Staab, D.; Stoeckli, M. MALDI mass spectrometric imaging of biological tissue sections. Mech. Ageing Dev. 2005, 126, 177–185. [Google Scholar] [CrossRef] [PubMed]
- Jackson, S.N.; Wang, H.Y.; Woods, A.S. In situ structural characterization of phosphatidylcholines in brain tissue using MALDI-MS/MS. J. Am. Soc. Mass Spectrom. 2005, 16, 2052–2056. [Google Scholar] [CrossRef] [PubMed]
- Roshan, D. Applications and Outcomes of MALDI-based Cancer Metabolite Detection in 2005. 2025. Available online: https://BioRender.com/kloxi65 (accessed on 2 September 2025).
- Khatib-Shahidi, S.; Andersson, M.; Herman, J.L.; Gillespie, T.A.; Caprioli, R.M. Direct molecular analysis of whole-body animal tissue sections by imaging MALDI mass spectrometry. Anal. Chem. 2006, 78, 6448–6456. [Google Scholar] [CrossRef] [PubMed]
- Cornett, D.S.; Mobley, J.A.; Dias, E.C.; Andersson, M.; Arteaga, C.L.; Sanders, M.E.; Caprioli, R.M. A novel histology-directed strategy for MALDI-MS tissue profiling that improves throughput and cellular specificity in human breast Cancer. Mol. Cell Proteom. 2006, 5, 1975–1983. [Google Scholar] [CrossRef] [PubMed]
- de Noo, M.E.; Mertens, B.J.; Ozalp, A.; Bladergroen, M.R.; van der Werff, M.P.; van de Velde, C.J.; Deelder, A.M.; Tollenaar, R.A. Detection of colorectal cancer using MALDI-TOF serum protein profiling. Eur. J. Cancer 2006, 42, 1068–1076. [Google Scholar] [CrossRef] [PubMed]
- Aerni, H.R.; Cornett, D.S.; Caprioli, R.M. Automated acoustic matrix deposition for MALDI sample preparation. Anal. Chem. 2006, 78, 827–834. [Google Scholar] [CrossRef] [PubMed]
- Sampson, J.S.; Hawkridge, A.M.; Muddiman, D.C. Generation and detection of multiply-charged peptides and proteins by matrix-assisted laser desorption electrospray ionization (MALDESI) Fourier transform ion cyclotron resonance mass spectrometry. J. Am. Soc. Mass Spectrom. 2006, 17, 1712–1716. [Google Scholar] [CrossRef] [PubMed]
- Shimma, S.; Sugiura, Y.; Hayasaka, T.; Hoshikawa, Y.; Noda, T.; Setou, M. MALDI-based imaging mass spectrometry revealed abnormal distribution of phospholipids in colon cancer liver metastasis. J. Chromatogr. B Anal. Technol. Biomed. Life Sci. 2007, 855, 98–103. [Google Scholar] [CrossRef] [PubMed]
- McDonnell, L.A.; Heeren, R.M. Imaging mass spectrometry. Mass Spectrom. Rev. 2007, 26, 606–643. [Google Scholar] [CrossRef] [PubMed]
- Cornett, D.S.; Reyzer, M.L.; Chaurand, P.; Caprioli, R.M. MALDI imaging mass spectrometry: Molecular snapshots of biochemical systems. Nat. Methods 2007, 4, 828–833. [Google Scholar] [CrossRef] [PubMed]
- Schwamborn, K.; Krieg, R.C.; Reska, M.; Jakse, G.; Knuechel, R.; Wellmann, A. Identifying prostate carcinoma by MALDI-Imaging. Int. J. Mol. Med. 2007, 20, 155–159. [Google Scholar] [CrossRef] [PubMed]
- Altelaar, A.F.; Luxembourg, S.L.; McDonnell, L.A.; Piersma, S.R.; Heeren, R.M. Imaging mass spectrometry at cellular length scales. Nat. Protoc. 2007, 2, 1185–1196. [Google Scholar] [CrossRef] [PubMed]
- Roshan, D. 2007 MALDI-MSI Workflow and Methods. 2025. Available online: https://BioRender.com/sqxn6up (accessed on 2 September 2025).
- Cornett, D.S.; Frappier, S.L.; Caprioli, R.M. MALDI-FTICR imaging mass spectrometry of drugs and metabolites in tissue. Anal. Chem. 2008, 80, 5648–5653. [Google Scholar] [CrossRef] [PubMed] [PubMed Central]
- Groseclose, M.R.; Massion, P.P.; Chaurand, P.; Caprioli, R.M. High-throughput proteomic analysis of formalin-fixed paraffin-embedded tissue microarrays using MALDI imaging mass spectrometry. Proteomics 2008, 8, 3715–3724. [Google Scholar] [CrossRef] [PubMed] [PubMed Central]
- Huamani, J.; Willey, C.; Thotala, D.; Niermann, K.J.; Reyzer, M.; Leavitt, L.; Jones, C.; Fleishcher, A.; Caprioli, R.; Hallahan, D.E.; et al. Differential efficacy of combined therapy with radiation and AEE788 in high and low EGFR-expressing androgen-independent prostate tumor models. Int. J. Radiat. Oncol. Biol. Phys. 2008, 71, 237–246. [Google Scholar] [CrossRef] [PubMed] [PubMed Central][Green Version]
- Deininger, S.O.; Ebert, M.P.; Fütterer, A.; Gerhard, M.; Röcken, C. MALDI imaging combined with hierarchical clustering as a new tool for the interpretation of complex human cancers. J. Proteome Res. 2008, 7, 5230–5236. [Google Scholar] [CrossRef] [PubMed]
- Chaurand, P.; Latham, J.C.; Lane, K.B.; Mobley, J.A.; Polosukhin, V.V.; Wirth, P.S.; Nanney, L.B.; Caprioli, R.M. Imaging mass spectrometry of intact proteins from alcohol-preserved tissue specimens: Bypassing formalin fixation. J. Proteome Res. 2008, 7, 3543–3555. [Google Scholar] [CrossRef] [PubMed] [PubMed Central]
- Pevsner, P.H.; Melamed, J.; Remsen, T.; Kogos, A.; Francois, F.; Kessler, P.; Stern, A.; Anand, S. Mass spectrometry MALDI imaging of colon cancer biomarkers: A new diagnostic paradigm. Biomark. Med. 2009, 3, 55–69. [Google Scholar] [CrossRef] [PubMed]
- Cristoni, S.; Molin, L.; Lai, A.; Bernardi, L.R.; Pucciarelli, S.; Agostini, M.; Bedin, C.; Nitti, D.; Seraglia, R.; Repetto, O.; et al. MALDI-MS-NIST library approach for colorectal cancer diagnosis. Rapid Commun. Mass Spectrom. 2009, 23, 2839–2845. [Google Scholar] [CrossRef] [PubMed]
- Barkauskas, D.A.; An, H.J.; Kronewitter, S.R.; de Leoz, M.L.; Chew, H.K.; de Vere White, R.W.; Leiserowitz, G.S.; Miyamoto, S.; Lebrilla, C.B.; Rocke, D.M. Detecting glycan cancer biomarkers in serum samples using MALDI FT-ICR mass spectrometry data. Bioinformatics 2009, 25, 251–257. [Google Scholar] [CrossRef] [PubMed] [PubMed Central]
- Cazares, L.H.; Troyer, D.; Mendrinos, S.; Lance, R.A.; Nyalwidhe, J.O.; Beydoun, H.A.; Clements, M.A.; Drake, R.R.; Semmes, O.J. Imaging mass spectrometry of a specific fragment of mitogen-activated protein kinase/extracellular signal-regulated kinase kinase kinase 2 discriminates cancer from uninvolved prostate tissue. Clin. Cancer Res. 2009, 15, 5541–5551. [Google Scholar] [CrossRef] [PubMed]
- Gámez-Pozo, A.; Sánchez-Navarro, I.; Nistal, M.; Calvo, E.; Madero, R.; Díaz, E.; Camafeita, E.; de Castro, J.; López, J.A.; González-Barón, M.; et al. MALDI profiling of human lung cancer subtypes. PLoS ONE 2009, 4, e7731. [Google Scholar] [CrossRef] [PubMed] [PubMed Central]
- Acquadro, E.; Cabella, C.; Ghiani, S.; Miragoli, L.; Bucci, E.M.; Corpillo, D. Matrix-assisted laser desorption ionization imaging mass spectrometry detection of a magnetic resonance imaging contrast agent in mouse liver. Anal. Chem. 2009, 81, 2779–2784. [Google Scholar] [CrossRef] [PubMed]
- Lee, G.K.; Lee, H.S.; Park, Y.S.; Lee, J.H.; Lee, S.C.; Lee, J.H.; Lee, S.J.; Shanta, S.R.; Park, H.M.; Kim, H.R.; et al. Lipid MALDI profile classifies non-small cell lung cancers according to the histologic type. Lung Cancer 2012, 76, 197–203. [Google Scholar] [CrossRef] [PubMed]
- Zaima, N.; Hayasaka, T.; Goto-Inoue, N.; Setou, M. Matrix-assisted laser desorption/ionization imaging mass spectrometry. Int. J. Mol. Sci. 2010, 11, 5040–5055. [Google Scholar] [CrossRef] [PubMed] [PubMed Central]
- Everest-Dass, A.V.; Briggs, M.T.; Kaur, G.; Oehler, M.K.; Hoffmann, P.; Packer, N.H. N-glycan MALDI Imaging Mass Spectrometry on Formalin-Fixed Paraffin-Embedded Tissue Enables the Delineation of Ovarian Cancer Tissues. Mol. Cell Proteom. 2016, 15, 3003–3016. [Google Scholar] [CrossRef] [PubMed] [PubMed Central]
- Rauser, S.; Marquardt, C.; Balluff, B.; Deininger, S.O.; Albers, C.; Belau, E.; Hartmer, R.; Suckau, D.; Specht, K.; Ebert, M.P.; et al. Classification of HER2 receptor status in breast cancer tissues by MALDI imaging mass spectrometry. J. Proteome Res. 2010, 9, 1854–1863. [Google Scholar] [CrossRef] [PubMed]
- Schwamborn, K.; Caprioli, R.M. MALDI imaging mass spectrometry–painting molecular pictures. Mol. Oncol. 2010, 4, 529–538. [Google Scholar] [CrossRef] [PubMed] [PubMed Central]
- Colsch, B.; Woods, A.S. Localization and imaging of sialylated glycosphingolipids in brain tissue sections by MALDI mass spectrometry. Glycobiology 2010, 20, 661–667. [Google Scholar] [CrossRef] [PubMed] [PubMed Central]
- Iorio, E.; Ricci, A.; Bagnoli, M.; Pisanu, M.E.; Castellano, G.; Di Vito, M.; Venturini, E.; Glunde, K.; Bhujwalla, Z.M.; Mezzanzanica, D.; et al. Activation of phosphatidylcholine cycle enzymes in human epithelial ovarian cancer cells. Cancer Res. 2010, 70, 2126–2135. [Google Scholar] [CrossRef] [PubMed] [PubMed Central]
- El Ayed, M.; Bonnel, D.; Longuespée, R.; Castelier, C.; Franck, J.; Vergara, D.; Desmons, A.; Tasiemski, A.; Kenani, A.; Vinatier, D.; et al. MALDI imaging mass spectrometry in ovarian cancer for tracking, identifying, and validating biomarkers. Med. Sci. Monit. Int. Med. J. Exp. Clin. Res. 2010, 16, 233–245. [Google Scholar] [PubMed]
- Roshan, D. Venn Diagram Summarizing the Applications of 2010 Articles That Used MALDI-MSI in Breast and Ovarian Cancer Tissues. 2025. Available online: https://BioRender.com/v2bgfk7 (accessed on 2 September 2025).
- Kang, H.S.; Lee, S.C.; Park, Y.S.; Jeon, Y.E.; Lee, J.H.; Jung, S.Y.; Park, I.H.; Jang, S.H.; Park, H.M.; Yoo, C.W.; et al. Protein and lipid MALDI profiles classify breast cancers according to the intrinsic subtype. BMC Cancer 2011, 11, 465. [Google Scholar] [CrossRef] [PubMed] [PubMed Central]
- Park, Y.S.; Yoo, C.W.; Lee, S.C.; Park, S.J.; Oh, J.H.; Yoo, B.C.; Paik, S.S.; Lee, K.G.; Jin, S.Y.; Kim, S.C.; et al. Lipid profiles for intrahepatic cholangiocarcinoma identified using matrix-assisted laser desorption/ionization mass spectrometry. Clin. Chim. Acta 2011, 412, 1978–1982. [Google Scholar] [CrossRef] [PubMed]
- Eberlin, L.S.; Liu, X.; Ferreira, C.R.; Santagata, S.; Agar, N.Y.; Cooks, R.G. Desorption electrospray ionization then MALDI mass spectrometry imaging of lipid and protein distributions in single tissue sections. Anal. Chem. 2011, 83, 8366–8371. [Google Scholar] [CrossRef] [PubMed] [PubMed Central]
- Balluff, B.; Schöne, C.; Höfler, H.; Walch, A. MALDI imaging mass spectrometry for direct tissue analysis: Technological advancements and recent applications. Histochem. Cell Biol. 2011, 136, 227–244. [Google Scholar] [CrossRef] [PubMed]
- Wang, J.; Qiu, S.; Chen, S.; Xiong, C.; Liu, H.; Wang, J.; Zhang, N.; Hou, J.; He, Q.; Nie, Z. MALDI-TOF MS imaging of metabolites with a N-(1-naphthyl) ethylenediamine dihydrochloride matrix and its application to colorectal cancer liver metastasis. Anal. Chem. 2015, 87, 422–430. [Google Scholar] [CrossRef] [PubMed]
- Han, E.C.; Lee, Y.S.; Liao, W.S.; Liu, Y.C.; Liao, H.Y.; Jeng, L.B. Direct tissue analysis by MALDI-TOF mass spectrometry in human hepatocellular carcinoma. Clin. Chim. Acta 2011, 412, 230–239. [Google Scholar] [CrossRef] [PubMed]
- Roshan, D. MALDI Detected Cancer Metabolites in 2011. 2025. Available online: https://BioRender.com/ukq2g8m (accessed on 2 September 2025).
- Kubo, A.; Kajimura, M.; Suematsu, M. Matrix-Assisted Laser Desorption/Ionization (MALDI) Imaging Mass Spectrometry (IMS): A Challenge for Reliable Quantitative Analyses. Mass Spectrom. 2012, 1, A0004. [Google Scholar] [CrossRef] [PubMed] [PubMed Central]
- Powers, T.W.; Jones, E.E.; Betesh, L.R.; Romano, P.R.; Gao, P.; Copland, J.A.; Mehta, A.S.; Drake, R.R. Matrix assisted laser desorption ionization imaging mass spectrometry workflow for spatial profiling analysis of N-linked glycan expression in tissues. Anal. Chem. 2013, 85, 9799–9806. [Google Scholar] [CrossRef] [PubMed] [PubMed Central]
- Cerruti, C.D.; Benabdellah, F.; Laprévote, O.; Touboul, D.; Brunelle, A. MALDI imaging and structural analysis of rat brain lipid negative ions with 9-aminoacridine matrix. Anal. Chem. 2012, 84, 2164–2171. [Google Scholar] [CrossRef] [PubMed]
- Yang, H.J.; Park, K.H.; Lim, D.W.; Kim, H.S.; Kim, J. Analysis of cancer cell lipids using matrix-assisted laser desorption/ionization 15-T Fourier transform ion cyclotron resonance mass spectrometry. Rapid Commun. Mass Spectrom. 2012, 26, 621–630. [Google Scholar] [CrossRef] [PubMed]
- Maurer, K.; Eschrich, K.; Schellenberger, W.; Bertolini, J.; Rupf, S.; Remmerbach, T.W. Oral brush biopsy analysis by MALDI-ToF Mass Spectrometry for early cancer diagnosis. Oral. Oncol. 2013, 49, 152–156. [Google Scholar] [CrossRef] [PubMed]
- Roshan, D. MALDI 2012 Metabolite Fingerprints. 2025. Available online: https://BioRender.com/ytsihb5 (accessed on 2 September 2025).
- Steurer, S.; Borkowski, C.; Odinga, S.; Buchholz, M.; Koop, C.; Huland, H.; Becker, M.; Witt, M.; Trede, D.; Omidi, M.; et al. MALDI mass spectrometric imaging based identification of clinically relevant signals in prostate cancer using large-scale tissue microarrays. Int. J. Cancer 2013, 133, 920–928. [Google Scholar] [CrossRef] [PubMed]
- Lee, H.S.; Park, J.W.; Chertov, O.; Colantonio, S.; Simpson, J.T.; Fivash, M.J.; Yoo, C.W.; Lee, G.K.; Zo, J.I.; Kim, H.T.; et al. Matrix-assisted laser desorption/ionization mass spectrometry reveals decreased calcylcin expression in small cell lung Cancer. Pathol. Int. 2012, 62, 28–35. [Google Scholar] [CrossRef] [PubMed]
- Pirman, D.A.; Efuet, E.; Ding, X.P.; Pan, Y.; Tan, L.; Fischer, S.M.; DuBois, R.N.; Yang, P. Changes in cancer cell metabolism revealed by direct sample analysis with MALDI mass spectrometry. PLoS ONE 2013, 8, e61379. [Google Scholar] [CrossRef] [PubMed] [PubMed Central]
- Quaas, A.; Bahar, A.S.; von Loga, K.; Seddiqi, A.S.; Singer, J.M.; Omidi, M.; Kraus, O.; Kwiatkowski, M.; Trusch, M.; Minner, S.; et al. MALDI imaging on large-scale tissue microarrays identifies molecular features associated with tumour phenotype in oesophageal Cancer. Histopathology 2013, 63, 455–462. [Google Scholar] [CrossRef] [PubMed]
- Pallua, J.D.; Schaefer, G.; Seifarth, C.; Becker, M.; Meding, S.; Rauser, S.; Walch, A.; Handler, M.; Netzer, M.; Popovscaia, M.; et al. MALDI-MS tissue imaging identification of biliverdin reductase B overexpression in prostate Cancer. J. Proteom. 2013, 8, 500–514. [Google Scholar] [CrossRef] [PubMed]
- Alexandrov, T.; Becker, M.; Guntinas-Lichius, O.; Ernst, G.; von Eggeling, F. MALDI-imaging segmentation is a powerful tool for spatial functional proteomic analysis of human larynx carcinoma. J. Cancer Res. Clin. Oncol. 2013, 139, 85–95. [Google Scholar] [CrossRef] [PubMed] [PubMed Central]
- Mirnezami, R.; Spagou, K.; Vorkas, P.A.; Lewis, M.R.; Kinross, J.; Want, E.; Shion, H.; Goldin, R.D.; Darzi, A.; Takats, Z.; et al. Chemical mapping of the colorectal cancer microenvironment via MALDI imaging mass spectrometry (MALDI-MSI) reveals novel cancer-associated field effects. Mol. Oncol. 2014, 8, 39–49. [Google Scholar] [CrossRef] [PubMed] [PubMed Central]
- Santagata, S.; Eberlin, L.S.; Norton, I.; Calligaris, D.; Feldman, D.R.; Ide, J.L.; Liu, X.; Wiley, J.S.; Vestal, M.L.; Ramkissoon, S.H.; et al. Intraoperative mass spectrometry mapping of an onco-metabolite to guide brain tumor surgery. Proc. Natl. Acad. Sci. USA 2014, 111, 11121–11126. [Google Scholar] [CrossRef] [PubMed] [PubMed Central]
- Fujimura, Y.; Miura, D. MALDI Mass Spectrometry Imaging for Visualizing In Situ Metabolism of Endogenous Metabolites and Dietary Phytochemicals. Metabolites 2014, 4, 319–346. [Google Scholar] [CrossRef] [PubMed] [PubMed Central]
- Dekker, T.J.; Balluff, B.D.; Jones, E.A.; Schöne, C.D.; Schmitt, M.; Aubele, M.; Kroep, J.R.; Smit, V.T.; Tollenaar, R.A.; Mesker, W.E.; et al. Multicenter matrix-assisted laser desorption/ionization mass spectrometry imaging (MALDI MSI) identifies proteomic differences in breast-cancer-associated stroma. J. Proteome Res. 2014, 13, 4730–4738. [Google Scholar] [CrossRef] [PubMed]
- Jones, E.E.; Powers, T.W.; Neely, B.A.; Cazares, L.H.; Troyer, D.A.; Parker, A.S.; Drake, R.R. MALDI imaging mass spectrometry profiling of proteins and lipids in clear cell renal cell carcinoma. Proteomics 2014, 14, 924–935. [Google Scholar] [CrossRef] [PubMed] [PubMed Central]
- Toue, S.; Sugiura, Y.; Kubo, A.; Ohmura, M.; Karakawa, S.; Mizukoshi, T.; Yoneda, J.; Miyano, H.; Noguchi, Y.; Kobayashi, T.; et al. Microscopic imaging mass spectrometry assisted by on-tissue chemical derivatization for visualizing multiple amino acids in human colon cancer xenografts. Proteomics 2014, 14, 810–819. [Google Scholar] [CrossRef] [PubMed]
- Guo, S.; Qiu, L.; Wang, Y.; Qin, X.; Liu, H.; He, M.; Zhang, Y.; Li, Z.; Chen, X. Tissue imaging and serum lipidomic profiling for screening potential biomarkers of thyroid tumors by matrix-assisted laser desorption/ionization-Fourier transform ion cyclotron resonance mass spectrometry. Anal. Bioanal. Chem. 2014, 406, 4357–4370. [Google Scholar] [CrossRef] [PubMed]
- Roshan, D. Cancer-Adjacent Metaplasia (CAM) Concentric-Zone (2014). 2025. Available online: https://BioRender.com/2ee2xg4 (accessed on 2 September 2025).
- Buck, A.; Ly, A.; Balluff, B.; Sun, N.; Gorzolka, K.; Feuchtinger, A.; Janssen, K.P.; Kuppen, P.J.; van de Velde, C.J.; Weirich, G.; et al. High-resolution MALDI-FT-ICR MS imaging for the analysis of metabolites from formalin-fixed, paraffin-embedded clinical tissue samples. J. Pathol. 2015, 237, 123–132. [Google Scholar] [CrossRef] [PubMed]
- Jiang, L.; Chughtai, K.; Purvine, S.O.; Bhujwalla, Z.M.; Raman, V.; Paša-Tolić, L.; Heeren, R.M.A.; Glunde, K. MALDI-Mass Spectrometric Imaging Revealing Hypoxia-Driven Lipids and Proteins in a Breast Tumor Model. Anal. Chem. 2015, 87, 5947–5956. [Google Scholar] [CrossRef] [PubMed] [PubMed Central]
- Goto, T.; Terada, N.; Inoue, T.; Kobayashi, T.; Nakayama, K.; Okada, Y.; Yoshikawa, T.; Miyazaki, Y.; Uegaki, M.; Utsunomiya, N.; et al. Decreased expression of lysophosphatidylcholine (16:0/OH) in high resolution imaging mass spectrometry independently predicts biochemical recurrence after surgical treatment for prostate Cancer. Prostate 2015, 75, 1821–1830. [Google Scholar] [CrossRef] [PubMed]
- Kriegsmann, J.; Kriegsmann, M.; Casadonte, R. MALDI TOF imaging mass spectrometry in clinical pathology: A valuable tool for cancer diagnostics (review). Int. J. Oncol. 2015, 46, 893–906. [Google Scholar] [CrossRef] [PubMed]
- Roshan, D. A Before and After Comparison Table Between the Year 2010 and 2015 to Show the Advancements in Between These Years. 2025. Available online: https://BioRender.com/rtlwhrs (accessed on 2 September 2025).
- O’Rourke, M.B.; Padula, M.P. A new standard of visual data representation for imaging mass spectrometry. Proteom. Clin. Appl. 2017, 11, 98. [Google Scholar] [CrossRef] [PubMed]
- Mittal, P.; Klingler-Hoffmann, M.; Arentz, G.; Winderbaum, L.; Lokman, N.A.; Zhang, C.; Anderson, L.; Scurry, J.; Leung, Y.; Stewart, C.J.; et al. Lymph node metastasis of primary endometrial cancers: Associated proteins revealed by MALDI imaging. Proteomics 2016, 16, 1793–1801. [Google Scholar] [CrossRef] [PubMed]
- Végvári, Á.; Shavkunov, A.S.; Fehniger, T.E.; Grabau, D.; Niméus, E.; Marko-Varga, G. Localization of tamoxifen in human breast cancer tumors by MALDI mass spectrometry imaging. Clin. Transl. Med. 2016, 5, 10. [Google Scholar] [CrossRef] [PubMed] [PubMed Central]
- LaBonia, G.J.; Lockwood, S.Y.; Heller, A.A.; Spence, D.M.; Hummon, A.B. Drug penetration and metabolism in 3D cell cultures treated in a 3D printed fluidic device: Assessment of irinotecan via MALDI imaging mass spectrometry. Proteomics 2016, 16, 1814–1821. [Google Scholar] [CrossRef] [PubMed] [PubMed Central]
- Giordano, S.; Zucchetti, M.; Decio, A.; Cesca, M.; Fuso Nerini, I.; Maiezza, M.; Ferrari, M.; Licandro, S.A.; Frapolli, R.; Giavazzi, R.; et al. Heterogeneity of paclitaxel distribution in different tumor models assessed by MALDI mass spectrometry imaging. Sci. Rep. 2016, 6, 39284. [Google Scholar] [CrossRef] [PubMed] [PubMed Central]
- Patterson, N.H.; Alabdulkarim, B.; Lazaris, A.; Thomas, A.; Marcinkiewicz, M.M.; Gao, Z.H.; Vermeulen, P.B.; Chaurand, P.; Metrakos, P. Assessment of pathological response to therapy using lipid mass spectrometry imaging. Sci. Rep. 2016, 6, 36814. [Google Scholar] [CrossRef] [PubMed] [PubMed Central]
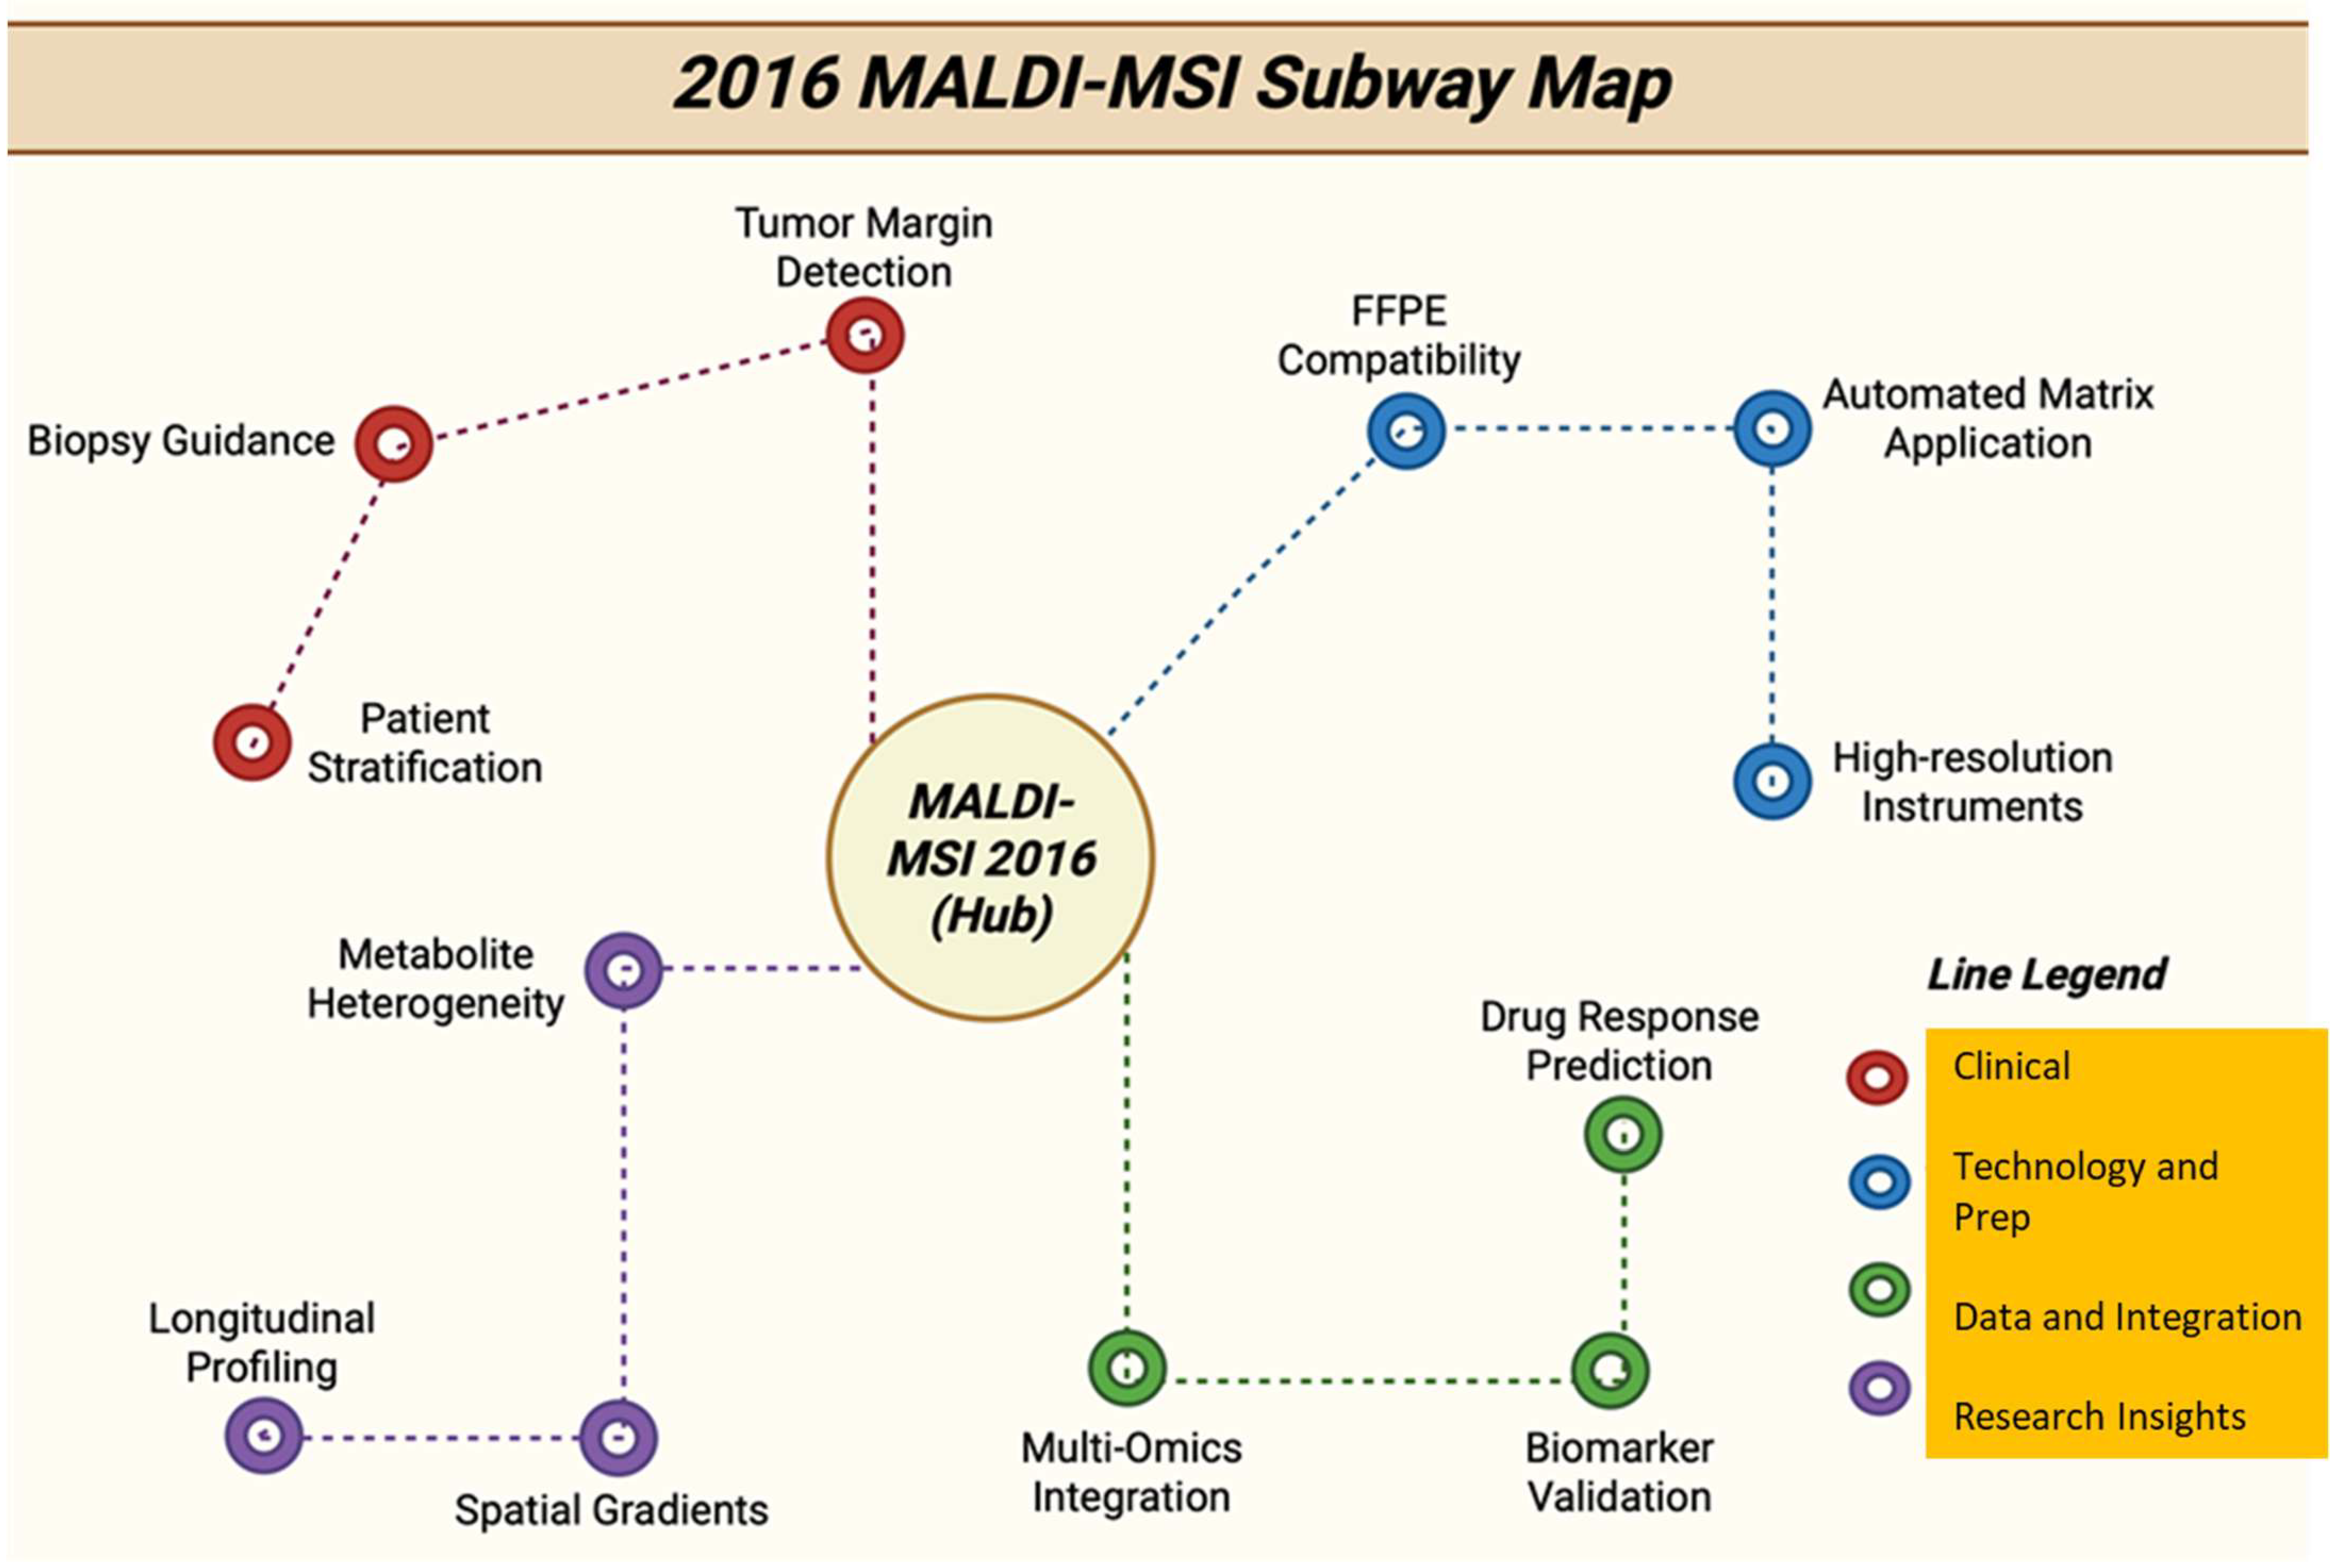
- Roshan, D. Subway Map with Tracks Showing 2016 MALDI-MSI Directions, from Methods and Instruments to Clinical Applications. 2025. Available online: https://BioRender.com/p9xzpb1 (accessed on 2 September 2025).
- Buck, A.; Aichler, M.; Huber, K.; Walch, A. In Situ Metabolomics in Cancer by Mass Spectrometry Imaging. Adv. Cancer Res. 2017, 134, 117–132. [Google Scholar] [CrossRef] [PubMed]
- Zhang, J.; Rector, J.; Lin, J.Q.; Young, J.H.; Sans, M.; Katta, N.; Giese, N.; Yu, W.; Nagi, C.; Suliburk, J.; et al. Nondestructive tissue analysis for ex vivo and in vivo cancer diagnosis using a handheld mass spectrometry system. Sci. Transl. Med. 2017, 9, eaan3968. [Google Scholar] [CrossRef] [PubMed] [PubMed Central]
- Dilillo, M.; Ait-Belkacem, R.; Esteve, C.; Pellegrini, D.; Nicolardi, S.; Costa, M.; Vannini, E.; Graaf, E.L.; Caleo, M.; McDonnell, L.A. Ultra-High Mass Resolution MALDI Imaging Mass Spectrometry of Proteins and Metabolites in a Mouse Model of Glioblastoma. Sci. Rep. 2017, 7, 603. [Google Scholar] [CrossRef] [PubMed] [PubMed Central]
- Casadonte, R.; Longuespée, R.; Kriegsmann, J.; Kriegsmann, M. MALDI IMS and Cancer Tissue Microarrays. Adv. Cancer Res. 2017, 134, 173–200. [Google Scholar] [CrossRef] [PubMed]
- Sans, M.; Gharpure, K.; Tibshirani, R.; Zhang, J.; Liang, L.; Liu, J.; Young, J.H.; Dood, R.L.; Sood, A.K.; Eberlin, L.S. Metabolic Markers and Statistical Prediction of Serous Ovarian Cancer Aggressiveness by Ambient Ionization Mass Spectrometry Imaging. Cancer Res. 2017, 77, 2903–2913. [Google Scholar] [CrossRef] [PubMed] [PubMed Central]
- Roshan, D. 2017 MALDI Based Cancer Metabolite Detection: Binocular View Workflow. 2025. Available online: https://BioRender.com/si3r58s (accessed on 3 September 2025).
- Briggs, M.T.; Condina, M.R.; Klingler-Hoffmann, M.; Arentz, G.; Everest-Dass, A.V.; Kaur, G.; Oehler, M.K.; Packer, N.H.; Hoffmann, P. Translating N-Glycan Analytical Applications into Clinical Strategies for Ovarian Cancer. Proteom. Clin. Appl. 2019, 13, e1800099. [Google Scholar] [CrossRef] [PubMed]
- Torata, N.; Kubo, M.; Miura, D.; Ohuchida, K.; Mizuuchi, Y.; Fujimura, Y.; Hayakawa, E.; Kai, M.; Oda, Y.; Mizumoto, K.; et al. Visualizing Energy Charge in Breast Carcinoma Tissues by MALDI Mass-spectrometry Imaging Profiles of Low-molecular-weight Metabolites. Anticancer Res. 2018, 38, 4267–4272. [Google Scholar] [CrossRef] [PubMed]
- Liu, X.; Flinders, C.; Mumenthaler, S.M.; Hummon, A.B. MALDI Mass Spectrometry Imaging for Evaluation of Therapeutics in Colorectal Tumor Organoids. J. Am. Soc. Mass Spectrom. 2018, 29, 516–526. [Google Scholar] [CrossRef] [PubMed] [PubMed Central]
- Sugihara, Y.; Rivas, D.; Malm, J.; Szasz, M.; Kwon, H.; Baldetorp, B.; Olsson, H.; Ingvar, C.; Rezeli, M.; Fehniger, T.E.; et al. Endogenous expression mapping of malignant melanoma by mass spectrometry imaging. Clin. Transl. Med. 2018, 7, 22. [Google Scholar] [CrossRef] [PubMed] [PubMed Central]
- Drake, R.R.; West, C.A.; Mehta, A.S.; Angel, P.M. MALDI Mass Spectrometry Imaging of N-Linked Glycans in Tissues. Adv. Exp. Med. Biol. 2018, 1104, 59–76. [Google Scholar] [CrossRef] [PubMed]
- Roshan, D. Metabolite Constellation Map—MALDI in Cancer Metabolite Detection (2018). 2025. Available online: https://BioRender.com/ngrbk22 (accessed on 3 September 2025).
- Föll, M.C.; Moritz, L.; Wollmann, T.; Stillger, M.N.; Vockert, N.; Werner, M.; Bronsert, P.; Rohr, K.; Grüning, B.A.; Schilling, O. Accessible and reproducible mass spectrometry imaging data analysis in Galaxy. Gigascience 2019, 8, giz143. [Google Scholar] [CrossRef] [PubMed] [PubMed Central]
- Kawashima, M.; Tokiwa, M.; Nishimura, T.; Kawata, Y.; Sugimoto, M.; Kataoka, T.R.; Sakurai, T.; Iwaisako, K.; Suzuki, E.; Hagiwara, M.; et al. High-resolution imaging mass spectrometry combined with transcriptomic analysis identified a link between fatty acid composition of phosphatidylinositols and the immune checkpoint pathway at the primary tumour site of breast Cancer. Br. J. Cancer 2020, 122, 245–257. [Google Scholar] [CrossRef] [PubMed] [PubMed Central]
- Sun, N.; Kunzke, T.; Sbiera, S.; Kircher, S.; Feuchtinger, A.; Aichler, M.; Herterich, S.; Ronchi, C.L.; Weigand, I.; Schlegel, N.; et al. Prognostic Relevance of Steroid Sulfation in Adrenocortical Carcinoma Revealed by Molecular Phenotyping Using High-Resolution Mass Spectrometry Imaging. Clin. Chem. 2019, 65, 1276–1286. [Google Scholar] [CrossRef] [PubMed]
- Mittal, P.; Price, Z.K.; Lokman, N.A.; Ricciardelli, C.; Oehler, M.K.; Klingler-Hoffmann, M.; Hoffmann, P. Matrix Assisted Laser Desorption/Ionization Mass Spectrometry Imaging (MALDI MSI) for Monitoring of Drug Response in Primary Cancer Spheroids. Proteomics 2019, 19, e1900146. [Google Scholar] [CrossRef] [PubMed]
- Roshan, D. Signal Amplification via MALDI-2 (2019). 2025. Available online: https://BioRender.com/htzv0dm (accessed on 3 September 2025).
- Keating, M.F.; Zhang, J.; Feider, C.L.; Retailleau, S.; Reid, R.; Antaris, A.; Hart, B.; Tan, G.; Milner, T.E.; Miller, K.; et al. Integrating the MasSpec Pen to the da Vinci Surgical System for In Vivo Tissue Analysis during a Robotic Assisted Porcine Surgery. Anal. Chem. 2020, 92, 11535–11542. [Google Scholar] [CrossRef] [PubMed]
- Soltwisch, J.; Heijs, B.; Koch, A.; Vens-Cappell, S.; Höhndorf, J.; Dreisewerd, K. MALDI-2 on a Trapped Ion Mobility Quadrupole Time-of-Flight Instrument for Rapid Mass Spectrometry Imaging and Ion Mobility Separation of Complex Lipid Profiles. Anal. Chem. 2020, 92, 8697–8703. [Google Scholar] [CrossRef] [PubMed]
- Ščupáková, K.; Dewez, F.; Walch, A.K.; Heeren, R.M.A.; Balluff, B. Morphometric Cell Classification for Single-Cell MALDI-Mass Spectrometry Imaging. Angew. Chem. Int. Engl. 2020, 59, 17447–17450. [Google Scholar] [CrossRef] [PubMed] [PubMed Central]
- Andersen, M.K.; Krossa, S.; Høiem, T.S.; Buchholz, R.; Claes, B.S.R.; Balluff, B.; Ellis, S.R.; Richardsen, E.; Bertilsson, H.; Heeren, R.M.A.; et al. Simultaneous Detection of Zinc and Its Pathway Metabolites Using MALDI MS Imaging of Prostate Tissue. Anal. Chem. 2020, 92, 3171–3179. [Google Scholar] [CrossRef] [PubMed] [PubMed Central]
- Randall, E.C.; Lopez, B.G.C.; Peng, S.; Regan, M.S.; Abdelmoula, W.M.; Basu, S.S.; Santagata, S.; Yoon, H.; Haigis, M.C.; Agar, J.N.; et al. Localized Metabolomic Gradients in Patient-Derived Xenograft Models of Glioblastoma. Cancer Res. 2020, 80, 1258–1267. [Google Scholar] [CrossRef] [PubMed] [PubMed Central]
- Sun, C.; Wang, F.; Zhang, Y.; Yu, J.; Wang, X. Mass spectrometry imaging-based metabolomics to visualize the spatially resolved reprogramming of carnitine metabolism in breast Cancer. Theranostics 2020, 10, 7070–7082. [Google Scholar] [CrossRef] [PubMed] [PubMed Central]
- Roshan, D. 2020 MasSpec Pen Sampling + MALDI Ionization Flow. 2025. Available online: https://BioRender.com/416wmhg (accessed on 3 September 2025).
- Conroy, L.R.; Stanback, A.E.; Young, L.E.A.; Clarke, H.A.; Austin, G.L.; Liu, J.; Allison, D.B.; Sun, R.C. In Situ Analysis of N-Linked Glycans as Potential Biomarkers of Clinical Course in Human Prostate Cancer. Mol. Cancer Res. 2021, 19, 1727–1738. [Google Scholar] [CrossRef] [PubMed] [PubMed Central]
- Murakami, M.; Sun, N.; Greunke, C.; Feuchtinger, A.; Kircher, S.; Deutschbein, T.; Papathomas, T.; Bechmann, N.; William Wallace, P.; Peitzsch, M.; et al. Mass spectrometry imaging identifies metabolic patterns associated with malignant potential in pheochromocytoma and paraganglioma. Eur. J. Endocrinol. 2021, 5, 179–191. [Google Scholar] [CrossRef] [PubMed]
- Chen, Y.; Wang, T.; Xie, P.; Song, Y.; Wang, J.; Cai, Z. Mass spectrometry imaging revealed alterations of lipid metabolites in multicellular tumor spheroids in response to hydroxychloroquine. Anal. Chim. Acta. 2021, 1184, 339011. [Google Scholar] [CrossRef] [PubMed]
- Sun, N.; Trajkovic-Arsic, M.; Li, F.; Wu, Y.; Münch, C.; Kunzke, T.; Feuchtinger, A.; Steiger, K.; Schlitter, A.M.; Weichert, W.; et al. Native glycan fragments detected by MALDI mass spectrometry imaging are independent prognostic factors in pancreatic ductal adenocarcinoma. EJNMMI Res. 2021, 11, 120. [Google Scholar] [CrossRef] [PubMed] [PubMed Central]
- Denti, V.; Mahajneh, A.; Capitoli, G.; Clerici, F.; Piga, I.; Pagani, L.; Chinello, C.; Bolognesi, M.M.; Paglia, G.; Galimberti, S.; et al. Lipidomic Typing of Colorectal Cancer Tissue Containing Tumour-Infiltrating Lymphocytes by MALDI Mass Spectrometry Imaging. Metabolites 2021, 11, 599. [Google Scholar] [CrossRef] [PubMed] [PubMed Central]
- Roshan, D. Glycan Alterations in Prostate Cancer Progression (2021). 2025. Available online: https://BioRender.com/du1bif9 (accessed on 3 September 2025).
- Kreutzer, L.; Weber, P.; Heider, T.; Heikenwälder, M.; Riedl, T.; Baumeister, P.; Klauschen, F.; Belka, C.; Walch, A.; Zitzelsberger, H.; et al. Simultaneous metabolite MALDI-MSI, whole exome and transcriptome analysis from formalin-fixed paraffin-embedded tissue sections. Lab Investig. 2022, 102, 1400–1405. [Google Scholar] [CrossRef] [PubMed] [PubMed Central]
- Erlmeier, F.; Sun, N.; Shen, J.; Feuchtinger, A.; Buck, A.; Prade, V.M.; Kunzke, T.; Schraml, P.; Moch, H.; Autenrieth, M.; et al. MALDI Mass Spectrometry Imaging-Prognostic Pathways and Metabolites for Renal Cell Carcinomas. Cancers 2022, 14, 1763. [Google Scholar] [CrossRef] [PubMed] [PubMed Central]
- Tressler, C.M.; Ayyappan, V.; Nakuchima, S.; Yang, E.; Sonkar, K.; Tan, Z.; Glunde, K. A multimodal pipeline using NMR spectroscopy and MALDI-TOF mass spectrometry imaging from the same tissue sample. NMR Biomed. 2023, 36, e4770. [Google Scholar] [CrossRef] [PubMed] [PubMed Central]
- Bollwein, C.; Gonҫalves, J.P.L.; Utpatel, K.; Weichert, W.; Schwamborn, K. MALDI Mass Spectrometry Imaging for the Distinction of Adenocarcinomas of the Pancreas and Biliary Tree. Molecules 2022, 27, 3464. [Google Scholar] [CrossRef] [PubMed] [PubMed Central]
- Li, Z.; Sun, C.; Jia, K.; Wang, X.; Han, J.; Chen, J.; Wang, J.; Liu, H.; Nie, Z. Biofluid Metabolic Profiling for Lung Cancer Screening via Reactive Matrix-Assisted Laser Desorption Ionization Mass Spectrometry. Anal. Chem. 2023, 95, 12062–12070. [Google Scholar] [CrossRef] [PubMed]
- Han, Y.; Zhao, Y.; Chen, P.; Wang, L.; Hu, Q.; Wang, X.; Sun, C. On-tissue derivatization for isomer-specific mass spectrometry imaging and relative quantification of monosaccharides in biological tissues. Anal. Chim. Acta. 2022, 1225, 340241. [Google Scholar] [CrossRef] [PubMed]
- Sommella, E.; Salviati, E.; Caponigro, V.; Grimaldi, M.; Musella, S.; Bertamino, A.; Cacace, L.; Palladino, R.; Mauro, G.D.; Marini, F.; et al. MALDI Mass Spectrometry Imaging Highlights Specific Metabolome and Lipidome Profiles in Salivary Gland Tumor Tissues. Metabolites 2022, 12, 530. [Google Scholar] [CrossRef] [PubMed] [PubMed Central]
- Roshan, D. Translating MALDI-MSI Discoveries to Clinical Use (2022). 2025. Available online: https://BioRender.com/9n4sd6t (accessed on 3 September 2025).
- Lu, W.; Park, N.R.; TeSlaa, T.; Jankowski, C.S.R.; Samarah, L.; McReynolds, M.; Xing, X.; Schembri, J.; Woolf, M.T.; Rabinowitz, J.D.; et al. Acidic Methanol Treatment Facilitates Matrix-Assisted Laser Desorption Ionization-Mass Spectrometry Imaging of Energy Metabolism. Anal. Chem. 2023, 95, 14879–14888. [Google Scholar] [CrossRef] [PubMed] [PubMed Central]
- Wang, Y.; Li, S.; Qian, K. Nanoparticle-based applications by atmospheric pressure matrix assisted desorption/ionization mass spectrometry. Nanoscale Adv. 2023, 5, 6804–6818. [Google Scholar] [CrossRef] [PubMed] [PubMed Central]
- Schwaiger-Haber, M.; Stancliffe, E.; Anbukumar, D.S.; Sells, B.; Yi, J.; Cho, K.; Adkins-Travis, K.; Chheda, M.G.; Shriver, L.P.; Patti, G.J. Using mass spectrometry imaging to map fluxes quantitatively in the tumor ecosystem. Nat. Commun. 2023, 14, 2876. [Google Scholar] [CrossRef] [PubMed] [PubMed Central]
- Stopka, S.A.; Ruiz, D.; Baquer, G.; Bodineau, C.; Hossain, M.A.; Pellens, V.T.; Regan, M.S.; Pourquié, O.; Haigis, M.C.; Bi, W.L.; et al. Chemical QuantArray: A Quantitative Tool for Mass Spectrometry Imaging. Anal. Chem. 2023, 95, 11243–11253. [Google Scholar] [CrossRef] [PubMed] [PubMed Central]
- Ma, B.; Zhang, Y.; Ma, J.; Chen, X.; Sun, C.; Qin, C. Spatially resolved visualization of reprogrammed metabolism in hepatocellular carcinoma by mass spectrometry imaging. Cancer Cell Int. 2023, 23, 177. [Google Scholar] [CrossRef] [PubMed] [PubMed Central]
- Wangyan, T.; Sun, Q.; Grizzard, P.; Liu, J.; Peng, Y. A new deep learning framework to process Matrix-assisted Laser Desorption/Ionisation Mass Spectrometry Imaging (MALDI-MSI) data of Tissue Microarrays (TMAs). AMIA Summits Transl. Sci. Proc. 2023, 2023, 554–561. [Google Scholar] [PubMed] [PubMed Central]
- Roshan, D. MALDI-2 Post-Ionization Enhances the Detection of Cancer Metabolites (2023). 2025. Available online: https://BioRender.com/cr2646i (accessed on 3 September 2025).
- Zhang, H.; Lu, K.H.; Ebbini, M.; Huang, P.; Lu, H.; Li, L. Mass spectrometry imaging for spatially resolved multi-omics molecular mapping. NPJ Imaging 2024, 2, 20. [Google Scholar] [CrossRef] [PubMed] [PubMed Central]
- Cairns, J.L.; Huber, J.; Lewen, A.; Jung, J.; Maurer, S.J.; Bausbacher, T.; Schmidt, S.; Levkin, P.A.; Sevin, D.; Göpfrich, K.; et al. Mass-Guided Single-Cell MALDI Imaging of Low-Mass Metabolites Reveals Cellular Activation Markers. Adv. Sci. 2025, 12, e2410506. [Google Scholar] [CrossRef] [PubMed] [PubMed Central]
- Chen, S.; Zhang, Y.; Li, X.; Zhang, Y.; Zeng, Y. Driving innovations in cancer research through spatial metabolomics: A bibliometric review of trends and hotspot. Front. Immunol. 2025, 16, 1589943. [Google Scholar] [CrossRef] [PubMed] [PubMed Central]
- Bharti, A.; Ajinkya, K.; Andrea, M.M.; Fernanda, R.G.; Hanibal, B.; Philipp, S.; Frauke, A.; Oliver, K. MALDI imaging combined with two-photon microscopy reveals local differences in the heterogeneity of colorectal Cancer. NPJ Imaging 2024, 2, 35. [Google Scholar] [CrossRef] [PubMed] [PubMed Central]
- Stillger, M.N.; Li, M.J.; Hönscheid, P.; von Neubeck, C.; Föll, M.C. Advancing rare cancer research by MALDI mass spectrometry imaging: Applications, challenges, and future perspectives in sarcoma. Proteomics 2024, 4, e2300001. [Google Scholar] [CrossRef] [PubMed]
- Brorsen, L.F.; McKenzie, J.S.; Pinto, F.E.; Glud, M.; Hansen, H.S.; Haedersdal, M.; Takats, Z.; Janfelt, C.; Lerche, C.M. Metabolomic profiling and accurate diagnosis of basal cell carcinoma by MALDI imaging and machine learning. Exp. Dermatol. 2024, 33, e15141. [Google Scholar] [CrossRef] [PubMed]
- Hartig, J.P.; Bejar, K.; Young, L.E.A.; Grimsley, G.; Bethard, J.R.; Troyer, D.A.; Hernandez, J.; Wu, J.D.; Ippolito, J.E.; Ball, L.E.; et al. Determining the N-Glycan and Collagen/Extracellular Matrix Protein Compositions in a Novel Outcome Cohort of Prostate Cancer Tissue Microarrays Using MALDI-MSI. Cancer Res. Commun. 2024, 4, 3036–3048. [Google Scholar] [CrossRef] [PubMed] [PubMed Central]
- Roshan, D. Tri-Modal Co-Registered Imaging Pyramid. 2025. Available online: https://BioRender.com/aco7wr8 (accessed on 3 September 2025).
- Kasarla, S.S.; Fecke, A.; Smith, K.W.; Flocke, V.; Flögel, U.; Phapale, P. Improved MALDI-MS Imaging of Polar and 2H-Labeled Metabolites in Mouse Organ Tissues. Anal. Chem. 2025, 97, 10720–10728. [Google Scholar] [CrossRef] [PubMed] [PubMed Central]
- Grzybowski, M.M.; Uçal, Y.; Muchowicz, A.; Rejczak, T.; Kikulska, A.; Głuchowska, K.M.; Szostakowska-Rodzoś, M.; Zagożdżon, A.; Bausbacher, T.; Tkaczyk, A.; et al. Metabolomic reprogramming of the tumor microenvironment by dual arginase inhibitor OATD-02 boosts anticancer immunity. Sci. Rep. 2025, 15, 18741. [Google Scholar] [CrossRef] [PubMed] [PubMed Central]
- Rubio, V.Y.; Ackerman, H.D.; Hackel, N.; Carr, C.L.; Baldwin, J.; Lockhart, J.H.; Ferrari, C.; Balasi, J.; Johnson, J.O.; Smedley, B.; et al. Reproducible Sectioning and Sample Preparation for Mass Spectrometry Imaging of Cancer Metabolism in Frozen Lung Tissue. Methods Mol. Biol. 2025, 2925, 309–328. [Google Scholar] [CrossRef] [PubMed]
- Phulara, N.R.; Ishida, C.T.; Espenshade, P.J.; Seneviratne, H.K. Gemcitabine Alters Phosphatidylcholine Metabolism in Mouse Pancreatic Tumors. J. Proteome Res. 2025, 24, 1209–1218. [Google Scholar] [CrossRef] [PubMed]
- Chen, B.; Pathak, R.; Subekti, A.; Cheng, X.; Singh, S.; Ostermeyer-Fay, A.G.; Hannun, Y.A.; Luberto, C.; Canals, D. Critical Evaluation of Sphingolipids Detection by MALDI-MSI. bioRxiv 2025. [Google Scholar] [CrossRef]
- Chen, Y.; Song, Y.; Yang, Z.; Ru, Y.; Xie, P.; Han, J.; Chai, X.; Wang, J.; Cai, Z. Optimized MALDI2-Mass Spectrometry Imaging for Stable Isotope Tracing of Tissue-Specific Metabolic Pathways in Mice. Anal. Chem. 2025, 97, 499–507. [Google Scholar] [CrossRef] [PubMed]
- Krestensen, K.K.; Hendriks, T.F.E.; Grgic, A.; Derweduwe, M.; De Smet, F.; Heeren, R.M.A.; Cuypers, E. Molecular Profiling of Glioblastoma Patient-Derived Single Cells Using Combined MALDI-MSI and MALDI-IHC. Anal Chem. 2025, 97, 3846–3854. [Google Scholar] [CrossRef] [PubMed] [PubMed Central]
- Roshan, D. Isotope Circuit-Board Showing 13C6 Glucose Tracer Distributing to Kidney, Brain, and Tumor “Boards” (2025). 2025. Available online: https://BioRender.com/kpu02jp (accessed on 3 September 2025).
- Wadie, B.; Stuart, L.; Rath, C.M.; Drotleff, B.; Mamedov, S.; Alexandrov, T. METASPACE-ML: Context-specific metabolite annotation for imaging mass spectrometry using machine learning. Nat. Commun. 2024, 15, 9110. [Google Scholar] [CrossRef] [PubMed] [PubMed Central]
- Wang, Y.; Hummon, A.B. MS imaging of multicellular tumor spheroids and organoids as an emerging tool for personalized medicine and drug discovery. J. Biol. Chem. 2021, 297, 101139. [Google Scholar] [CrossRef] [PubMed] [PubMed Central]
- Gonçalves, J.P.L.; Bollwein, C.; Schwamborn, K. Mass Spectrometry Imaging Spatial Tissue Analysis toward Personalized Medicine. Life 2022, 12, 1037. [Google Scholar] [CrossRef] [PubMed] [PubMed Central]
- Basu, S.S.; Regan, M.S.; Randall, E.C.; Abdelmoula, W.M.; Clark, A.R.; Gimenez-Cassina Lopez, B.; Cornett, D.S.; Haase, A.; Santagata, S.; Agar, N.Y.R. Rapid MALDI mass spectrometry imaging for surgical pathology. NPJ Precis. Oncol. 2019, 3, 17. [Google Scholar] [CrossRef] [PubMed] [PubMed Central]
- Tobias, F.; Hummon, A.B. Considerations for MALDI-Based Quantitative Mass Spectrometry Imaging Studies. J. Proteome Res. 2020, 19, 3620–3630. [Google Scholar] [CrossRef] [PubMed] [PubMed Central]
- Šamec, N.; Krapež, G.; Skubic, C.; Jovčevska, I.; Videtič Paska, A. From Biomarker Discovery to Clinical Applications of Metabolomics in Glioblastoma. Metabolit 2025, 15, 295. [Google Scholar] [CrossRef] [PubMed] [PubMed Central]
- Planque, M.; Igelmann, S.; Ferreira Campos, A.M.; Fendt, S.M. Spatial metabolomics principles and application to cancer research. Curr. Opin. Chem. Biol. 2023, 76, 102362. [Google Scholar] [CrossRef] [PubMed]
- Passarelli, M.K.; Ewing, A.G. Single-cell imaging mass spectrometry. Curr. Opin. Chem. Biol. 2013, 17, 854–859. [Google Scholar] [CrossRef] [PubMed] [PubMed Central]
- Römpp, A.; Spengler, B. Mass spectrometry imaging with high resolution in mass and space. Histochem. Cell Biol. 2013, 139, 759–783. [Google Scholar] [CrossRef] [PubMed] [PubMed Central]
- Takáts, Z.; Wiseman, J.M.; Gologan, B.; Cooks, R.G. Mass spectrometry sampling under ambient conditions with desorption electrospray ionization. Science 2004, 306, 471–473. [Google Scholar] [CrossRef] [PubMed]
- Alexandrov, T. MALDI imaging mass spectrometry: Statistical data analysis and current computational challenges. BMC Bioinform. 2012, 13 (Suppl. S16), S11. [Google Scholar] [CrossRef] [PubMed] [PubMed Central]
- Kurreck, A.; Vandergrift, L.A.; Fuss, T.L.; Habbel, P.; Agar, N.Y.R.; Cheng, L.L. Prostate cancer diagnosis and characterization with mass spectrometry imaging. Prostate Cancer Prostatic Dis. 2018, 21, 297–305. [Google Scholar] [CrossRef] [PubMed] [PubMed Central]
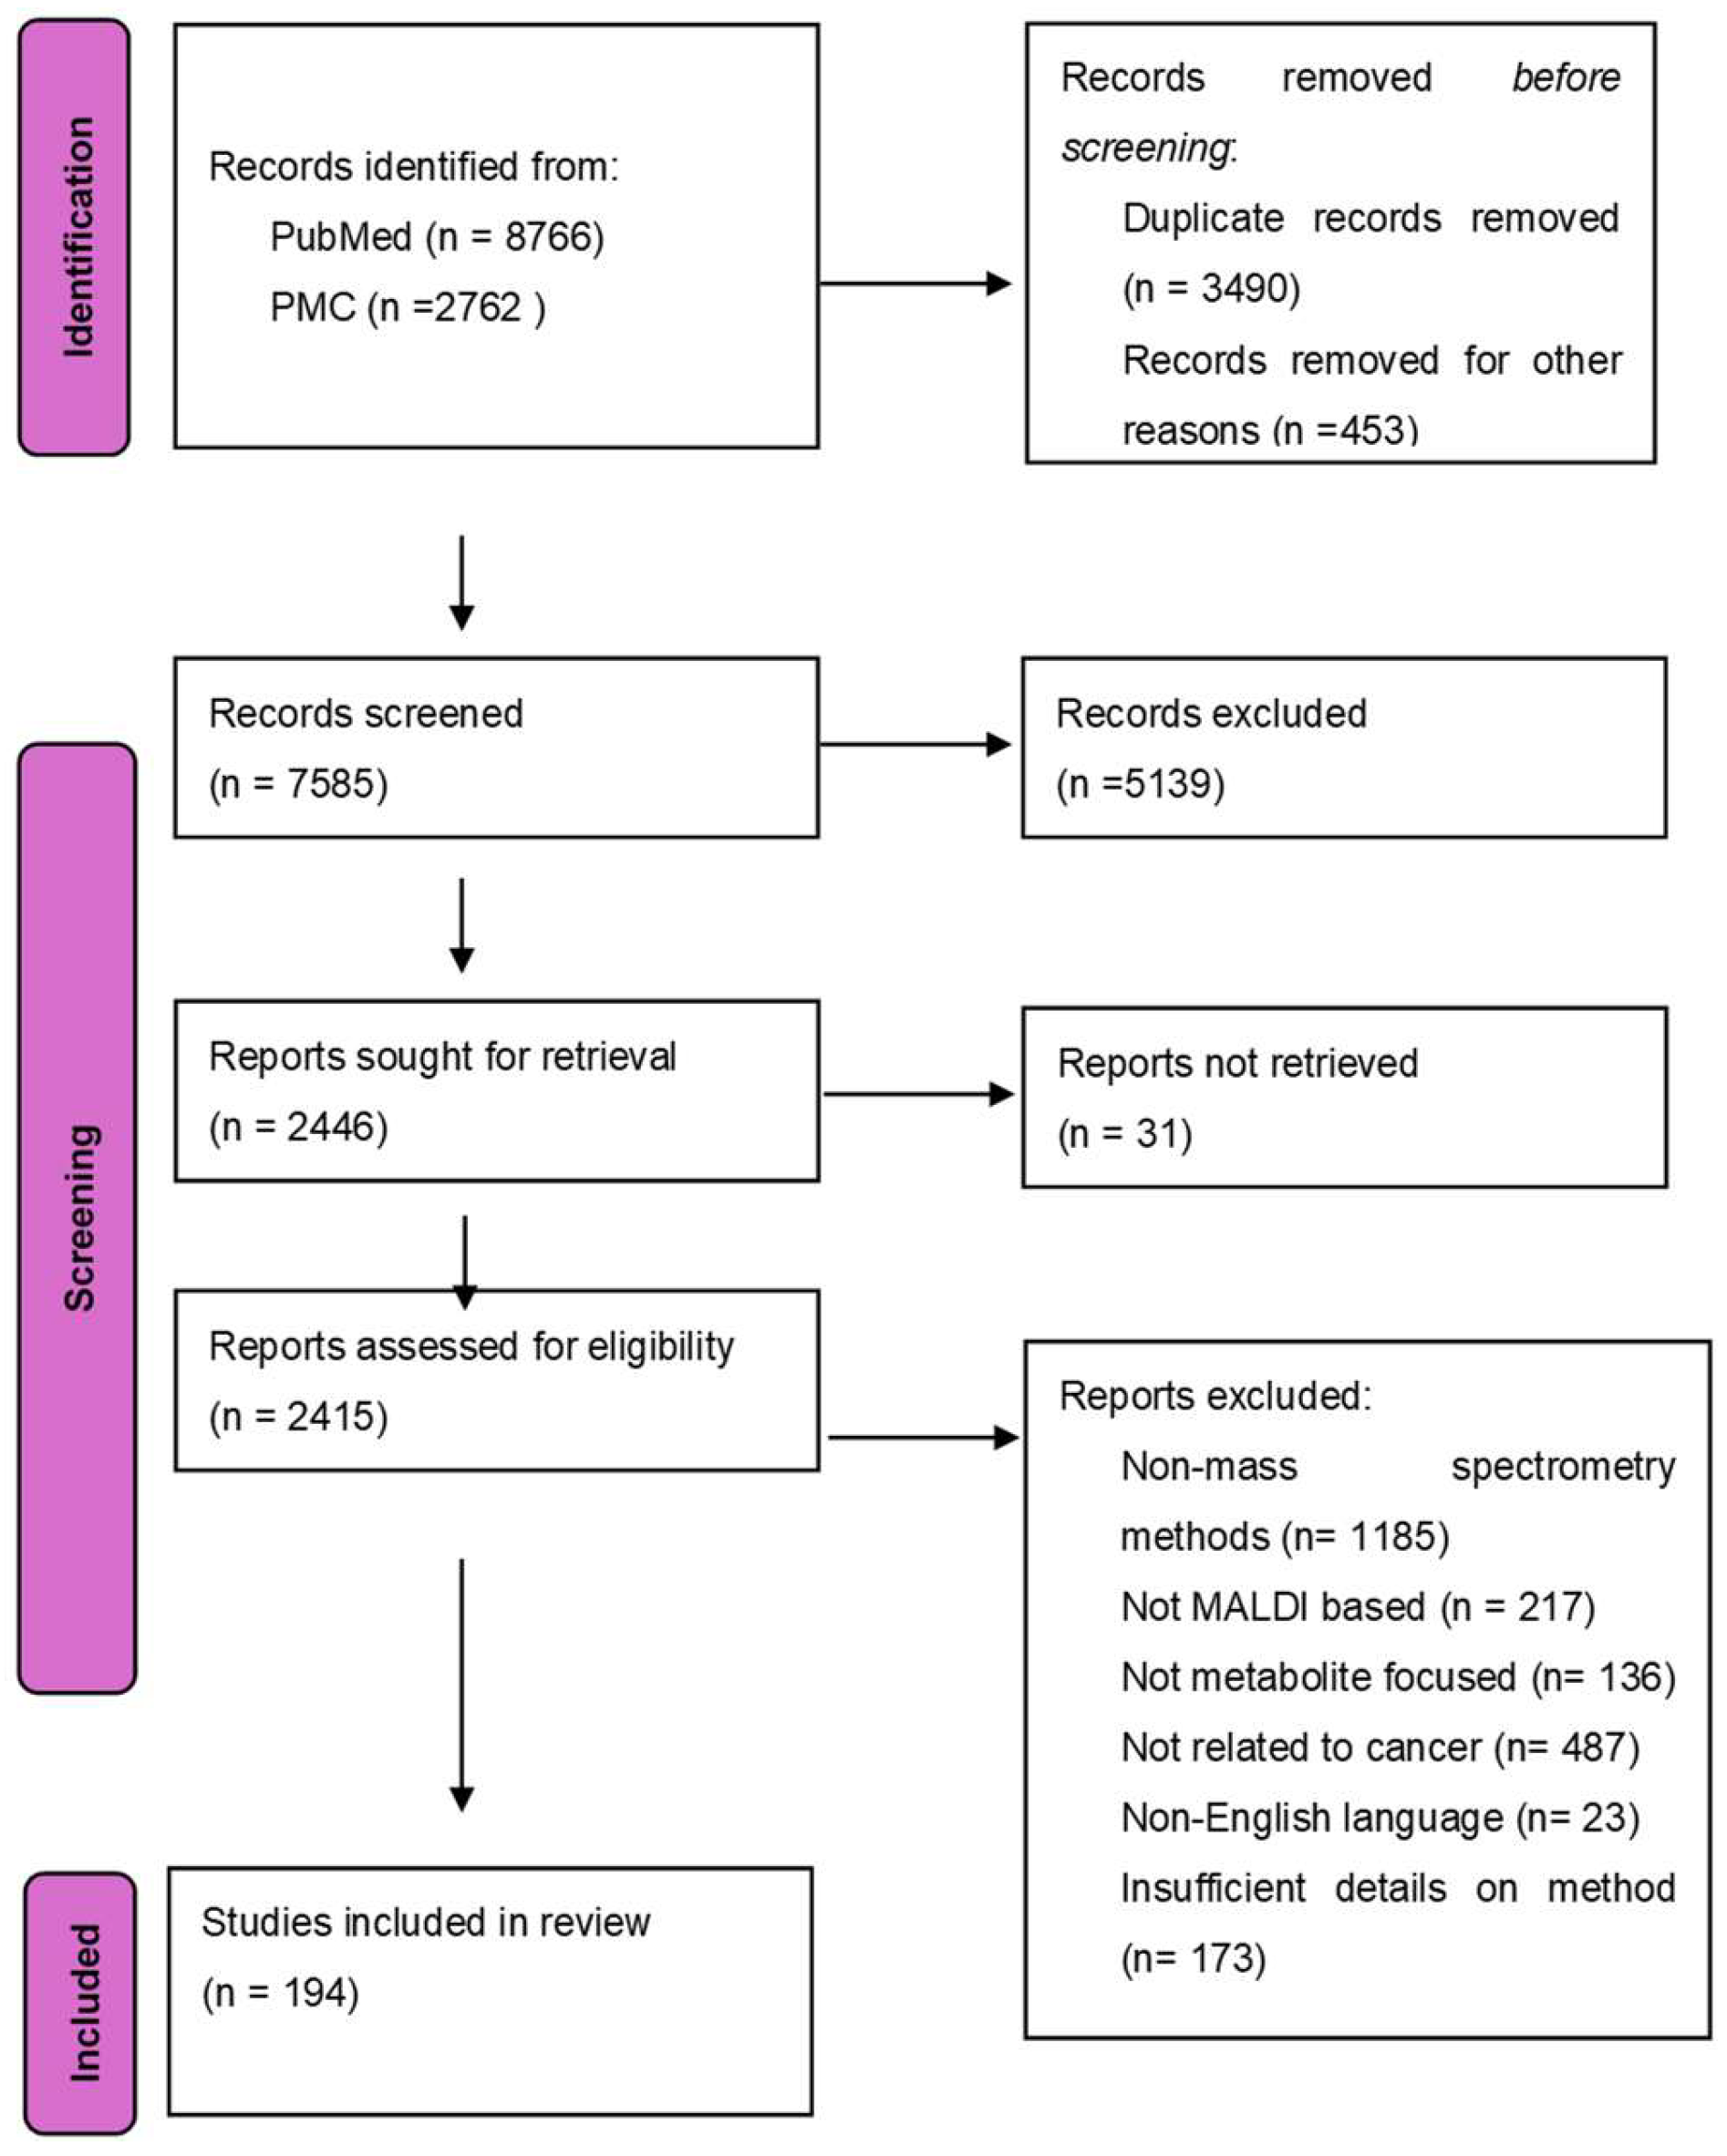
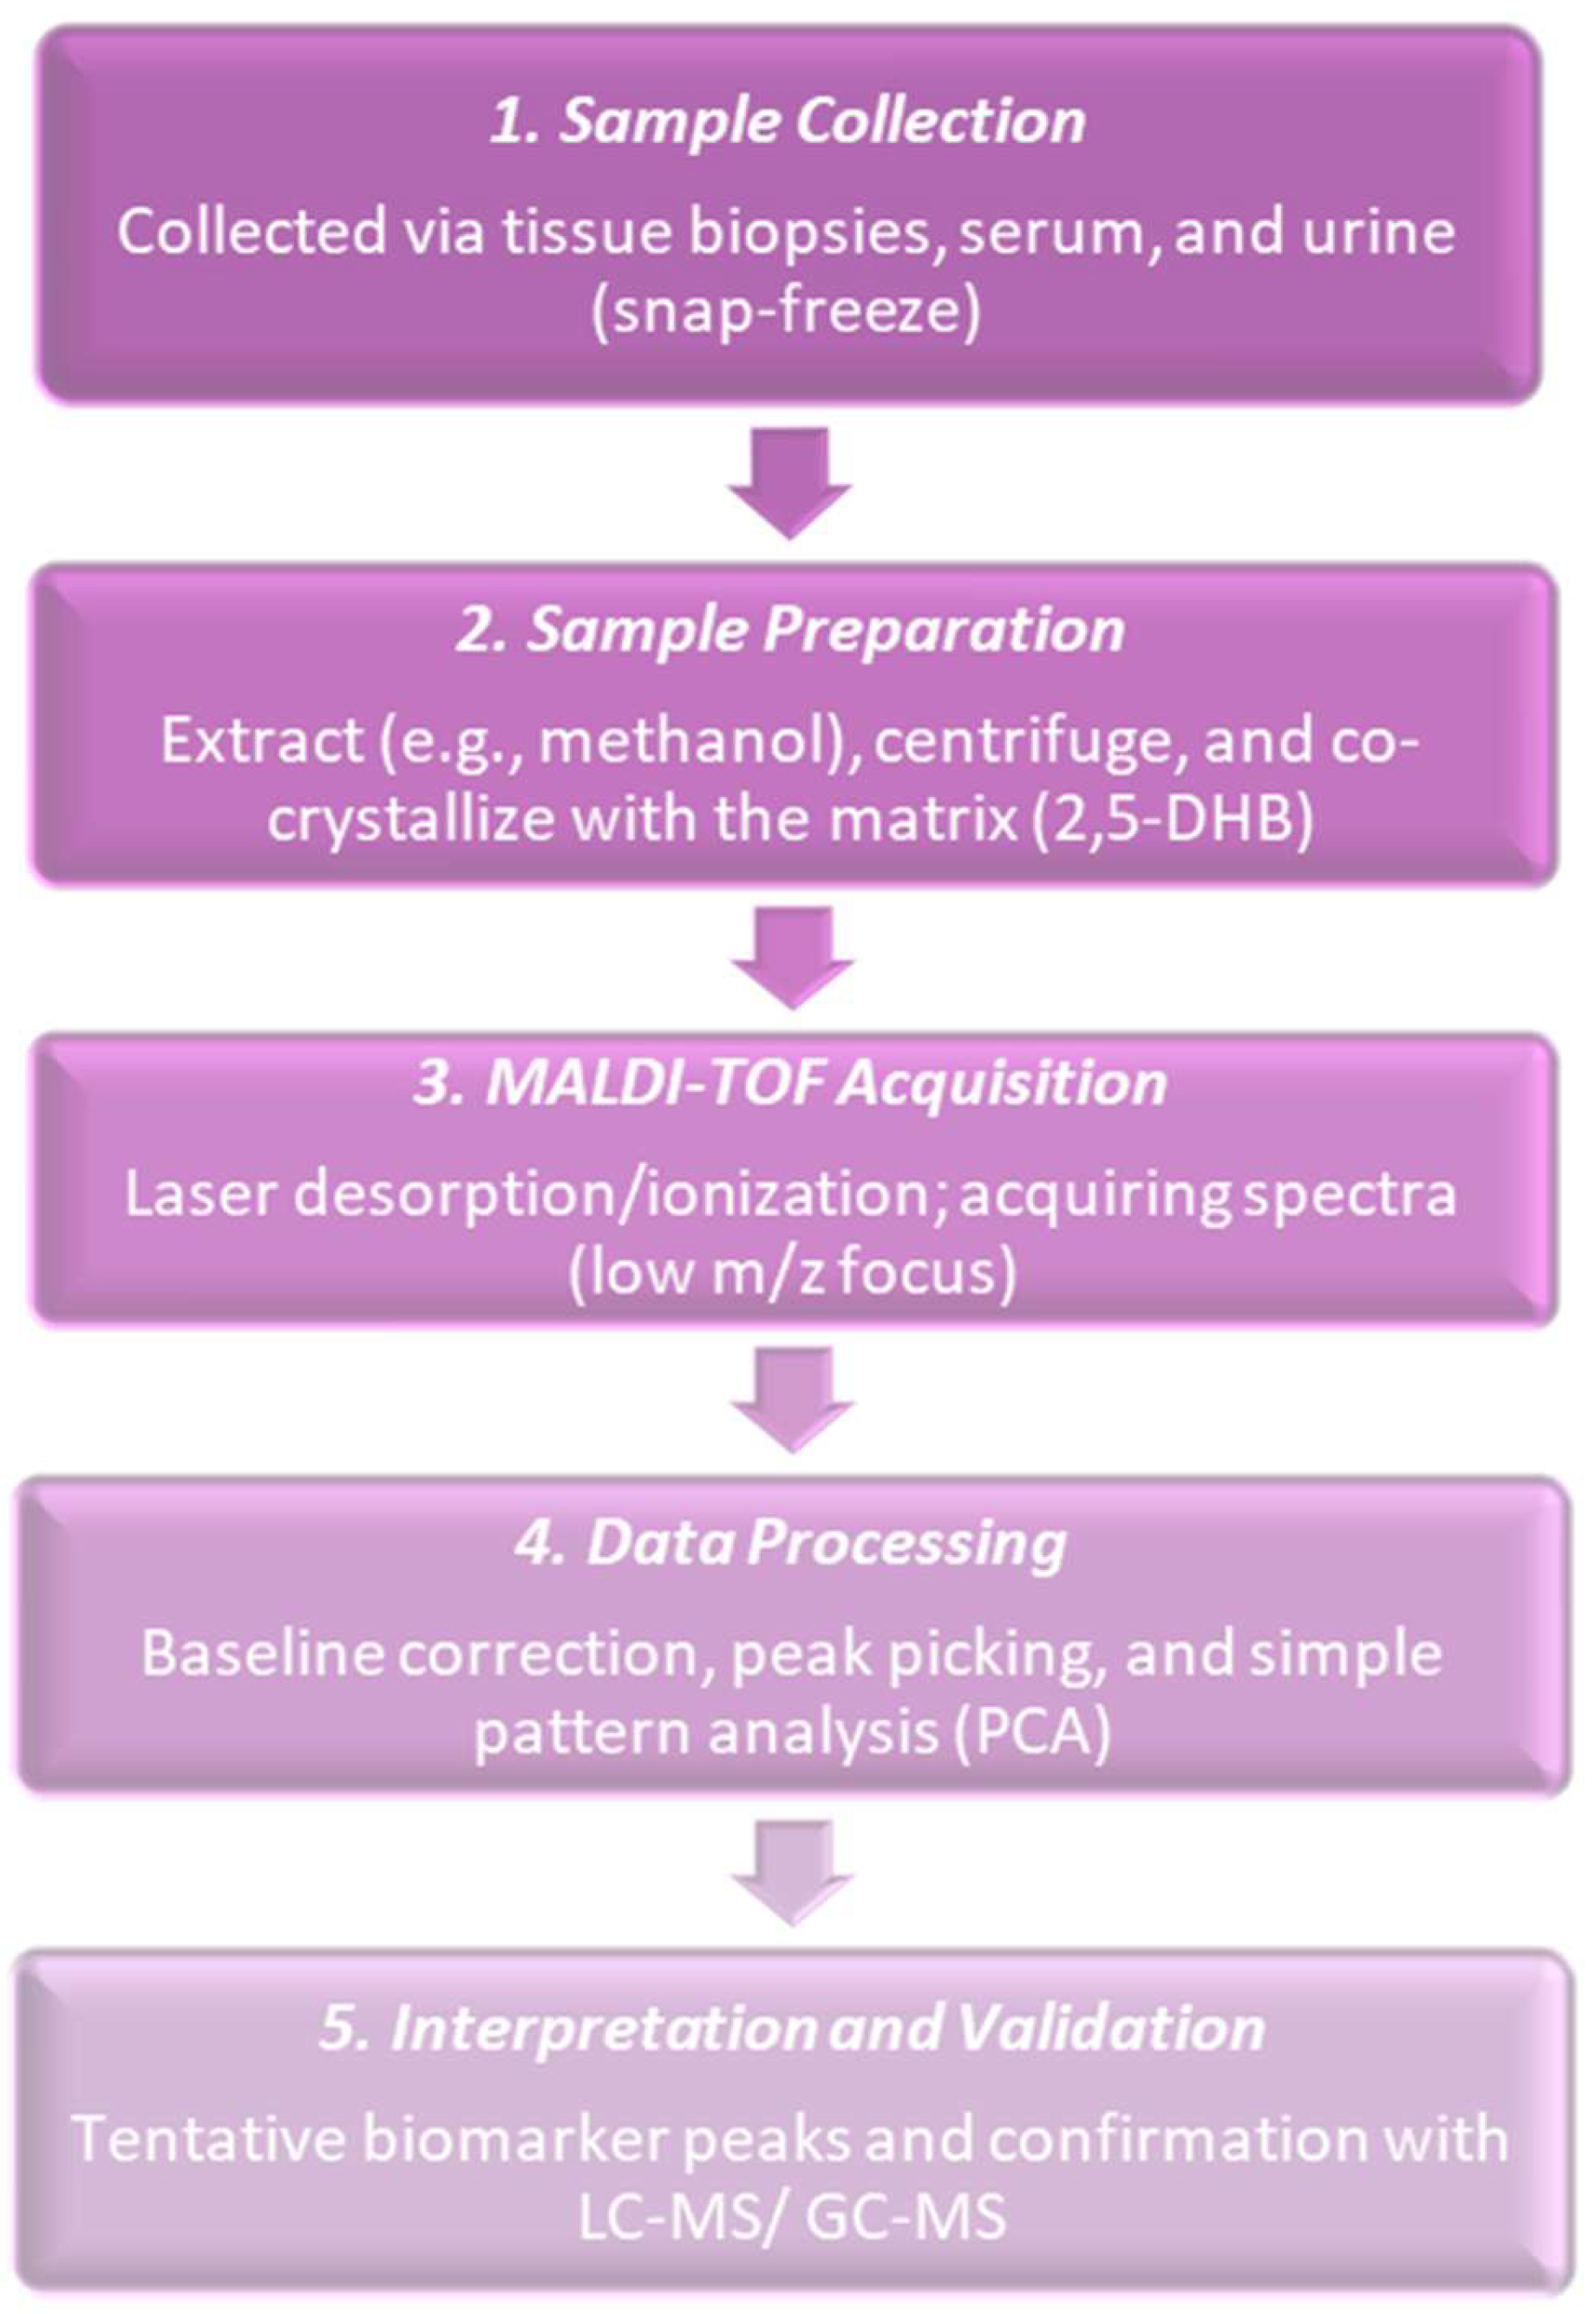
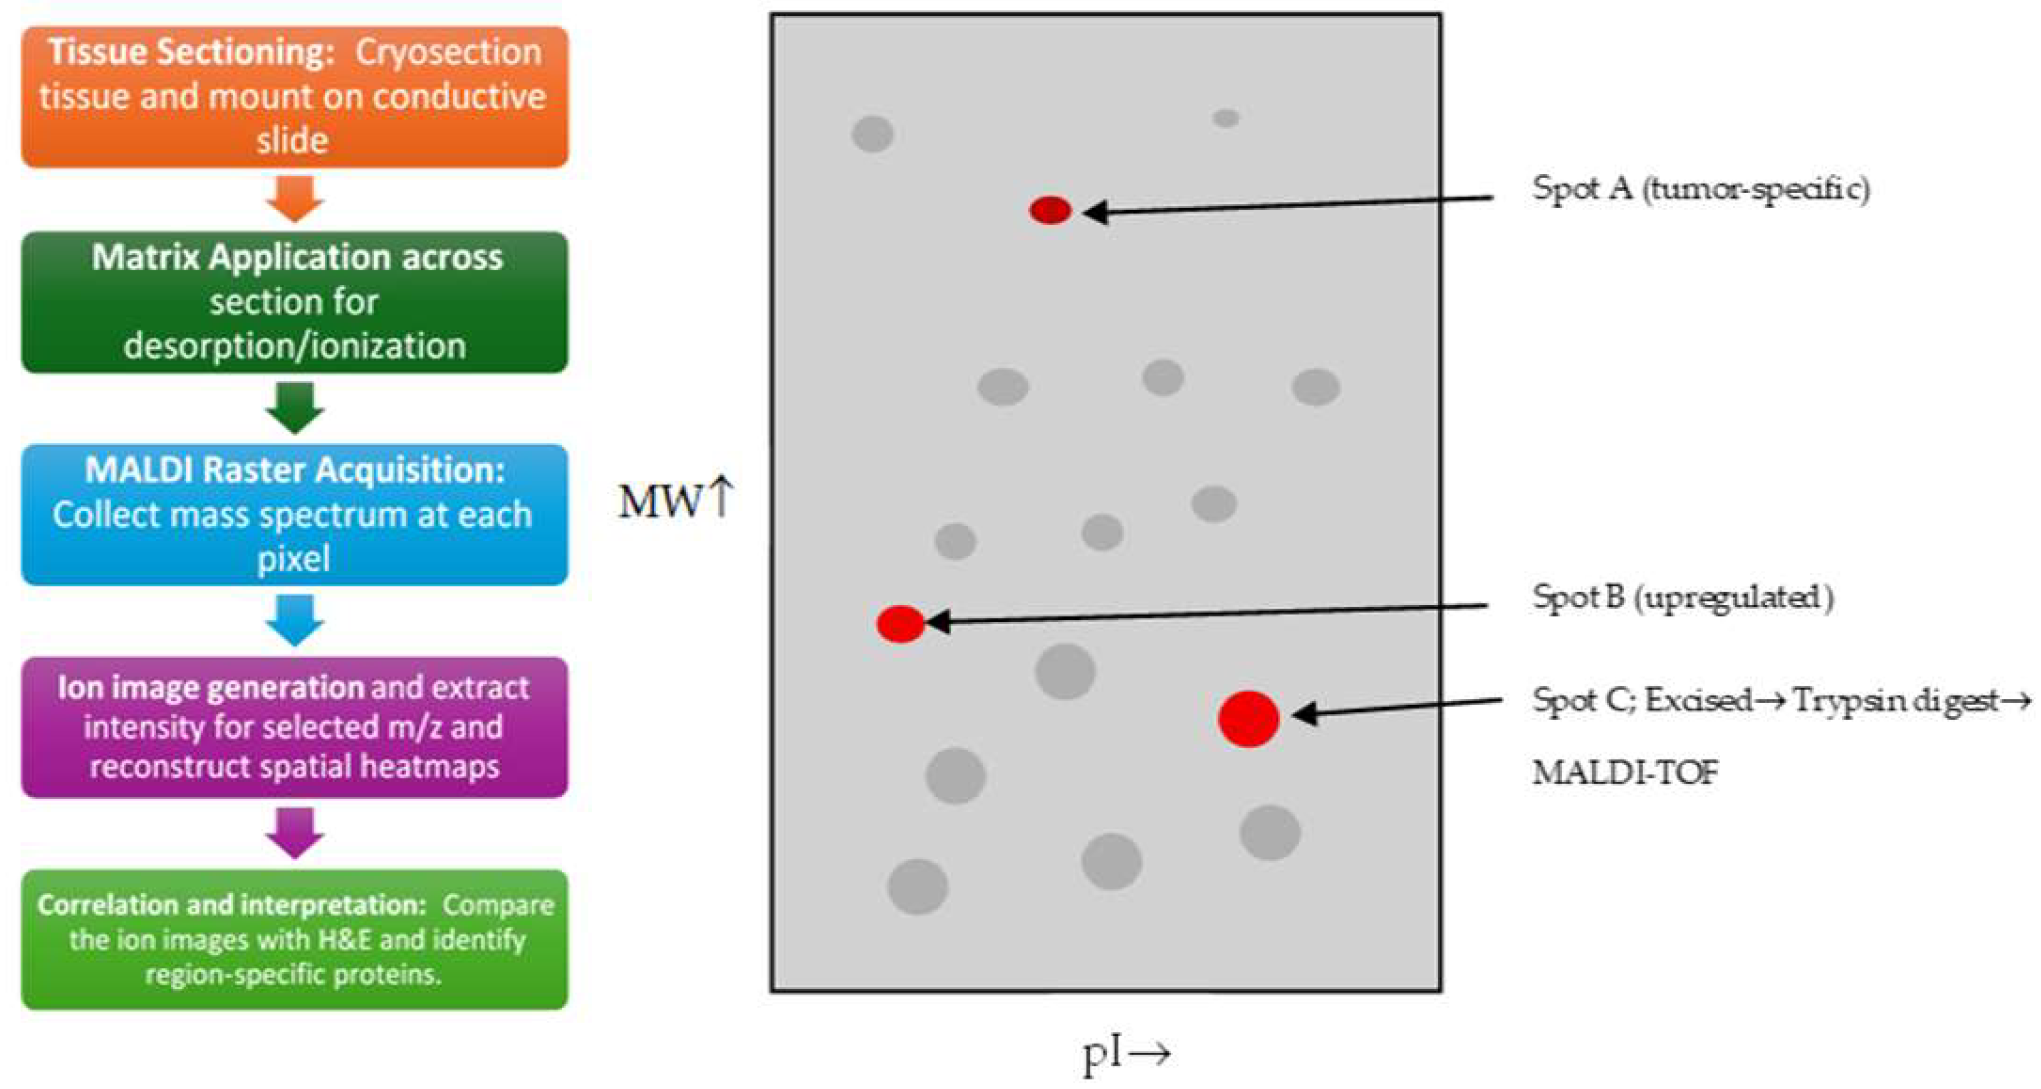
| No. | Author | Application | Result |
|---|---|---|---|
| 1 | Kussmann M, Roepstorff P., 2000 [21] | Step-by-step sample preparation processes for analyzing peptides and proteins by MALDI-MS. | It gave reproducible and refined sample preparation methods that improved MALDI signal quality and reproducibility. It gave instructions on when to use certain deposition methods and matrix choices. |
| 2 | Palmer-Toy DE et al., 2000 [35] | Direct MALDI-TOF MS profiling from laser captured micro-dissected (LCM) breast cancer and normal epithelial cells. | Showed distinct protein and peptide spectral patterns from 1250 cell micro-dissected regions which proved the feasibility of MALDI on histology defined microdomains in cancer tissue. |
| No. | Author | Application | Result |
|---|---|---|---|
| 1 | Stoeckli M et al., 2001 [36] | MALDI imaging mass spectrometry of tissue sections with a glioblastoma example. | Showed spatially resolved protein/peptide ion maps across proliferating vs. necrotic tumor areas and popularized MALDI for molecular histology in cancer. |
| 2 | Todd PJ et al., 2001 [37] | Comparative paper on organic ion imaging methods like TOF-SIMS and MALDI for biological tissue. | Described how SIMS and MALDI could produce molecular images from tissues and compared their strengths (SIMS-higher spatial resolution, MALDI-broader mass range). |
| 3 | Chaurand P et al., 2001 [40] | MALDI profiling of azoxymethane-induced mouse colon tumors. | Identified tumor-specific protein signals from matched normal/tumor colon tissue. Showed MALDI tissue profiling for cancer metabolite discovery. |
| 4 | Le Naour F et al., 2001 [42] | 2-D PAGE and MALDI-TOF to identify tumor antigens, proteins in breast cancer serum, and tumor cell lines. | Identified RS/DJ-1 as a new circulating tumor antigen in breast cancer which showed MALDI’s role in biomarker detection from clinical samples. |
Disclaimer/Publisher’s Note: The statements, opinions and data contained in all publications are solely those of the individual author(s) and contributor(s) and not of MDPI and/or the editor(s). MDPI and/or the editor(s) disclaim responsibility for any injury to people or property resulting from any ideas, methods, instructions or products referred to in the content. |
© 2025 by the authors. Licensee MDPI, Basel, Switzerland. This article is an open access article distributed under the terms and conditions of the Creative Commons Attribution (CC BY) license (https://creativecommons.org/licenses/by/4.0/).
Share and Cite
Bartusik-Aebisher, D.; Justin Raj, D.R.; Aebisher, D. Detection of Protein and Metabolites in Cancer Analyses by MALDI 2000–2025. Cancers 2025, 17, 3524. https://doi.org/10.3390/cancers17213524
Bartusik-Aebisher D, Justin Raj DR, Aebisher D. Detection of Protein and Metabolites in Cancer Analyses by MALDI 2000–2025. Cancers. 2025; 17(21):3524. https://doi.org/10.3390/cancers17213524
Chicago/Turabian StyleBartusik-Aebisher, Dorota, Daniel Roshan Justin Raj, and David Aebisher. 2025. "Detection of Protein and Metabolites in Cancer Analyses by MALDI 2000–2025" Cancers 17, no. 21: 3524. https://doi.org/10.3390/cancers17213524
APA StyleBartusik-Aebisher, D., Justin Raj, D. R., & Aebisher, D. (2025). Detection of Protein and Metabolites in Cancer Analyses by MALDI 2000–2025. Cancers, 17(21), 3524. https://doi.org/10.3390/cancers17213524


