Simple Summary
Malnutrition is common in patients with periampullary cancers and can negatively affect recovery and survival after major surgery. This study focused on the Geriatric Nutritional Risk Index (GNRI), a simple tool that uses basic health data to assess a patient’s nutrition status before surgery. This study reviewed medical records of patients who underwent pancreaticoduodenectomy using the largest private healthcare database in Taiwan, which found that patients with poor GNRI scores had shorter survival, more post-operative complications, and higher short-term death rates. These results were consistent in both pancreatic and other nearby cancers. Our findings suggest that GNRI may be a practical and cost-effective way to identify high-risk patients before surgery.
Abstract
Background: The Geriatric Nutritional Risk Index (GNRI) is a simple tool for nutritional assessment, but its long-term prognostic value in patients undergoing pancreaticoduodenectomy (PD) remains unclear. Methods: This retrospective study included adult patients who underwent PD between January 2014 and December 2023 at Chang Gung Memorial Hospital. Patients were grouped by GNRI: inferior (<82), moderate (82–98), and superior (≥98). Propensity score matching was performed based on age, sex, cancer type, surgical approach, and ASA status. Primary outcomes were overall survival (OS) and recurrence-free survival (RFS). Results: Among 371 patients, inferior GNRI was associated with worse median survival time (18.64 vs. 34.62 months, HR = 2.953, p < 0.001). This association was observed in both pancreatic cancer and other periampullary malignancies. Inferior GNRI also correlated with higher short-term mortality and adverse perioperative outcomes, including longer ICU stay, and greater need for ventilator support, reintubation, reoperation and total parenteral nutrition (TPN). Conclusions: Preoperative GNRI is a strong predictor of survival and short-term outcomes in PD patients. Early nutritional assessment may aid risk stratification and intervention.
1. Introduction
Periampullary neoplasms remain a devastating disease despite advancements in medical treatments. Patients with these malignancies often experience significant nutritional deficits due to tumor-related metabolic disturbances, exocrine insufficiency, and impaired gastrointestinal function [1]. In many cases, particularly among older adults, these tumors contribute to reduced oral intake and nutrient malabsorption caused by biliary or gastrointestinal obstruction [2]. Studies have shown that such nutritional imbalances are associated with poor clinical outcomes, including reduced overall survival and an increased risk of adverse events [2,3,4,5,6].
Pancreaticoduodenectomy (PD) is one of the most complex surgical procedures for managing periampullary lesions. The surgery involves the removal of the duodenum, pancreatic head, bile duct, and sometimes the gastric pylorus, all of which are essential for nutrient absorption [2]. Despite advancements in surgical techniques that have reduced mortality rates, PD continues to carry a high risk of morbidity [7]. Post-operative complications such as surgical site infections, delayed gastric emptying, and pancreatic fistulas are common and occur more frequently in patients with preoperative malnutrition [3,8]. Research indicates that poor nutritional status before surgery increases the risk of surgical complications and mortality, highlighting the need for thorough preoperative nutritional assessment and timely intervention [4,9].
Several screening tools have been developed to identify patients at risk of malnutrition, including the Subjective Global Assessment (SGA), Malnutrition Universal Screening Tool (MUST), Mini Nutritional Assessment (MNA), Nutritional Risk Screening Tool 2002 (NRS-2002), Geriatric Nutrition Risk Index (GNRI), Prognostic Nutritional Index (PNI), and Controlling Nutritional Status (CONUT) score [10,11]. Although some tools are more accurate [12], they often require extensive history-taking and rely on subjective parameters, limiting their practicality in busy clinical settings [13]. GNRI is a simple, cost-effective nutritional assessment tool that incorporates serum albumin levels and the ratio of actual to ideal body weight. Owing to its simplicity, GNRI is a promising option for preoperative nutritional evaluation; however, its application in patients undergoing PD remains unexplored.
This study aimed to evaluate the prognostic value of the GNRI as a practical tool for predicting short- and long-term post-operative outcomes in patients undergoing PD for periampullary neoplasms using the Chang Gung Research Database (CGRD), the largest private healthcare database in Taiwan.
2. Materials and Methods
2.1. Patient
This study retrospectively reviewed data from patients in the Chang Gung Research Database (CGRD) who underwent pancreaticoduodenectomy (PD) between January 2014 and December 2023. The CGRD, managed by Taiwan’s largest healthcare provider, contains data from seven medical institutions across the country. All medical records in the database were de-identified to ensure that no individual could be identified directly or indirectly. Patients without GNRI data, with missing surgical records or younger than 18 years of age were excluded. This study was approved by the Institutional Review Board of Chang Gung Memorial Hospital (IRB No.: 202500746B0), and all procedures were conducted in accordance with its guidelines and regulations. The Institutional Review Board waived the requirement for informed consent.
Clinicopathological data were collected from medical records. The following parameters were analyzed: (1) demographic data and hospital stay including age, sex, height, weight, admission date, hospital stay duration, and intensive care unit (ICU) stay duration; (2) comorbidities such as hypertension, diabetes mellitus and ASA physical status classification; (3) laboratory parameters, including CA19-9, albumin and total bilirubin levels; (4) surgical details, including operative duration, estimated intraoperative blood loss, and surgical approach (open or minimally invasive); (5) pathological findings, including histological type, number of lymph nodes extracted, number of lymph nodes involved, tumor size and margin status; (6) preoperative procedures and treatments, including biliary drainage and perioperative chemotherapy. Histopathological findings, including tumor size, lymph node involvement, and histological differentiation, were classified according to the 8th edition of the American Joint Committee on Cancer (AJCC) Node Metastasis (TNM) classification system. In this study, four common periampullary malignancies were analyzed, including pancreatic cancer, distal extrahepatic bile duct cancer, ampullary cancer, duodenal and gastric cancer. All cancer identification was based on ICD-9 and ICD-10 coding from CGRD. To evaluate perioperative chemotherapy status, we extracted data on whether patients received chemotherapy within a three-month window before or after the date of surgery. Neoadjuvant chemotherapy was defined as chemotherapy administered within 8 weeks prior to surgery, while adjuvant chemotherapy was defined as chemotherapy initiated within 12 weeks following surgery. This three-month perioperative interval was selected based on clinical relevance and existing guideline recommendations [14,15,16,17].
2.2. Nutritional Assessment Using GNRI
All laboratory data for calculating preoperative nutritional status were obtained within 28 days prior to surgery. Patients without a serum albumin measurement or documented body height and/or body weight within this window were excluded. GNRI was calculated using the following formula:
GNRI = 14.89 × [serum albumin] (g/dL) + 41.7 × [present body weight/ideal body weight (kg)]
Ideal body weight was determined using the Lorentz equations: 0.75 × height (cm) − 62.5 for males and 0.60 × height (cm) − 40 for females. If a patient’s actual body weight exceeded the ideal body weight, the ratio [current body weight/ideal body weight] was set to 1 [18].
Patients were categorized into three GNRI groups: inferior GNRI status group (GNRI < 82), moderate GNRI status group (82 ≤ GNRI < 98) and superior GNRI status group (GNRI ≥ 98).
While the optimal categorization of the Geriatric Nutritional Risk Index (GNRI) has not been universally standardized, the original GNRI proposed by Bouillanne et al. stratified patients into four groups: major risk (GNRI < 82), moderate risk (GNRI = 82–92), low risk (GNRI = 92–98), and no risk (GNRI ≥ 98) [18]. This four-tier classification remains widely cited and subsequent studies have adapted it by merging moderate risk (GNRI = 82–92) and low risk (GNRI = 92–98) into a single group (GNRI = 82–98), thereby yielding a simplified three-group model (GNRI < 82, GNRI = 82–98 and GNRI ≥ 98). This modification has been adopted in several clinical settings to enhance interpretability while preserving prognostic discrimination [19,20,21]. Accordingly, this three-tier classification was adopted in our study.
2.3. Outcome Evaluation
The primary outcomes were overall survival (OS) and recurrence-free survival (RFS) in patients undergoing pancreaticoduodenectomy. OS was defined as the interval from surgery to death. For patients alive at the time of analysis, the OS was censored at the last follow-up. RFS was defined as the time from surgery to tumor recurrence or death from any cause, serving as a key indicator of long-term oncologic outcomes. Secondary surgical outcomes included post-operative complications, length of hospital stay, ICU stay duration, duration of ventilator support, rates of reintubation, ICU readmission, and reoperation, use of total parenteral nutrition (TPN), and mortality at 30 days, 90 days, and one year. Post-operative complications were classified using the Clavien–Dindo (CD) system, with major complications defined as grade III or higher. Documented complications included pancreatic fistula, hemorrhage, delayed gastric emptying requiring TPN, intra-abdominal infection, and cardiopulmonary complications necessitating reintubation or prolonged ventilation.
2.4. Statistical Analysis
A propensity score was calculated using logistic regression, including age, sex, cancer type (pancreatic cancer vs. other periampullary malignancies), surgical approach (open vs. minimally invasive), and American Society of Anesthesiologists (ASA) physical status (class I–II vs. III–IV).
Baseline differences between groups were assessed using the chi-square test for categorical variables and the Kruskal–Wallis test for continuous variables owing to the non-normal distribution of data and the presence of three comparison groups. OS was estimated using the Kaplan–Meier method, and survival curves were compared using the log-rank test. Hazard ratios (HRs) with 95% confidence intervals (CIs) were derived from Cox proportional hazards regression models. Both categorical and continuous covariates were incorporated into the models; categorical variables were entered as indicator (dummy) variables, whereas continuous variables were analyzed on a per-unit scale. Univariate analyses were first performed for each variable, and those with a p-value < 0.05 were subsequently included in the multivariate Cox regression model. All statistical analyses were conducted using SAS software (v9.4; SAS Institute, Cary, NC, USA). A two-sided p-value < 0.05 was considered statistically significant.
3. Results
3.1. Patient Characteristics
A total of 1180 patients were included in this study. Of these, 207 were excluded because of missing GNRI data (80 due to missing serum albumin levels and 127 due to missing body weight or body height data), 2 patients were excluded due to incomplete surgical records, and 6 patients younger than 18 years of age were excluded. After 1:3 propensity score matching, 371 patients remained in the final analysis. The inferior GNRI group included 53 patients, whereas the moderate and superior GNRI groups each had 159 patients (Figure 1).
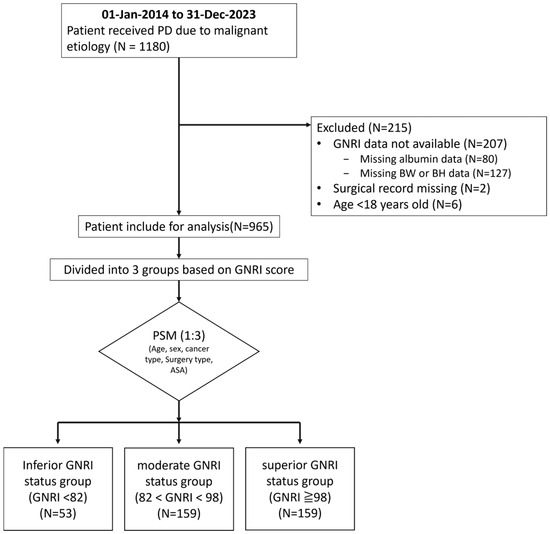
Figure 1.
Flow chart of the patient selection process. A total of 1180 patients who underwent pancreaticoduodenectomy were initially identified. After excluding 207 patients with missing GNRI data, along with 2 patients with incomplete surgical records and 6 patients under the age of 18, a total of 965 eligible patients remained. Following 1:3 propensity score matching, 371 patients were included in the final analysis. These were categorized into three groups: 53 in the inferior GNRI status group (GNRI < 82), 159 each in the moderate GNRI status group (82 ≤ GNRI < 98) and the superior GNRI status group (GNRI ≥ 98). GNRI—Geriatric Nutritional Risk Index; BW—body weight; BH—body height; PD—pancreaticoduodenectomy; PSM—propensity score matching.
Table 1 and Table A1 (Appendix A) compares clinicopathological characteristics among the three groups before and after matching. After matching, significant differences were observed in body mass index (BMI) (p < 0.001), preoperative biliary drainage (p = 0.017), preoperative CA19-9 levels (p < 0.001), preoperative albumin levels (p < 0.001), and preoperative total bilirubin levels (p < 0.001). No significant differences were found in cancer type, age, sex, ASA physical status, operative time, or estimated intraoperative blood loss, tumor staging and the percentage of patients receiving perioperative chemotherapy within 3 months. Additionally, hypertension, diabetes mellitus, surgical approach (open vs. minimally invasive), the number of lymph nodes sampled intraoperatively, the number of lymph nodes involved, tumor size, or surgical margin status did not differ significantly among the groups. Notably, only 10 out of 371 patients (2.69%) received neoadjuvant chemotherapy, and 122 out of 371 (32.88%) received adjuvant chemotherapy within 3 months perioperatively. These represent relatively low proportions.

Table 1.
Baseline characteristics of patients undergoing pancreatoduodenectomy stratified by GNRI categories (n = 371).
3.2. Association Between Different GNRI Groups and Short-Term Outcomes
After propensity score matching, patients with inferior GNRI status had significantly worse outcomes than those with superior GNRI status. They had longer ICU stays (7.22 vs. 4.10 days, p < 0.001), prolonged ventilator use (5.02 vs. 2.81 days, p = 0.019), higher reintubation rates (15.09% vs. 3.77%, p = 0.025), increased TPN use (69.81% vs. 41.51%, p = 0.002), and higher reoperation rates (18.87% vs. 4.40%, p < 0.001). Mortality was also significantly higher in the inferior GNRI group, including 30-day (11.32% vs. 1.89%, p = 0.014), 90-day (24.53% vs. 5.03%, p < 0.001) and 1 year mortality (43.40% vs. 14.47%, p < 0.001). Post-operative hospital stays, unexpected ICU readmissions, and post-operative complications did not differ significantly among the three groups after matching (Table 2 and Table A2).
Table 2.
Comparison of short-term outcomes and mortality in patients undergoing pancreatoduodenectomy stratified by GNRI categories (n = 371).
3.3. Association Between Different GNRI Groups and Survival
3.3.1. Association Between GNRI and Survival
In the overall population (Figure 2), a higher GNRI score was associated with superior survival outcomes. Patients in the superior GNRI status group (GNRI ≥ 98) achieved a 5-year overall survival (OS) of 18.87% and a median survival time (MST) of 34.62 months, significantly surpassing those in the moderate GNRI status group (82 ≤ GNRI < 98) (5-year OS 14.47%, MST 29.67 months; HR = 1.574, 95% CI 1.153–2.150, p = 0.004) and inferior GNRI (GNRI < 82) (5-year OS 3.77%, MST 18.64 months; HR = 2.953, 95% CI 2.009–4.342, p < 0.001).
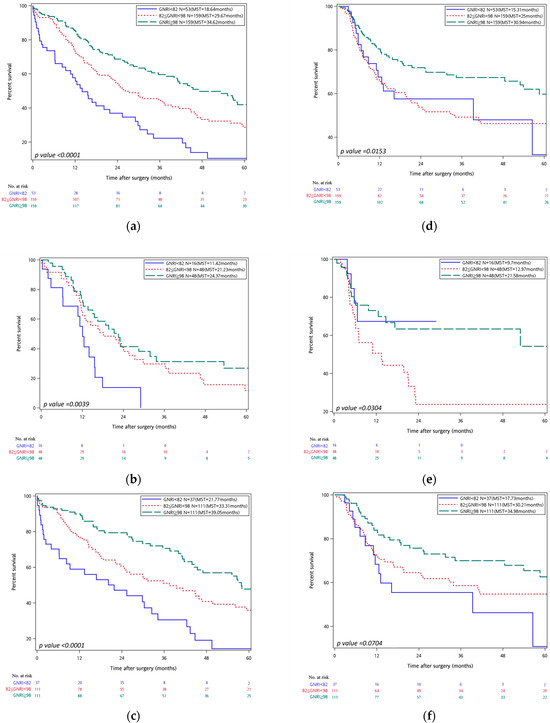
Figure 2.
On the left, Kaplan–Meier curves for overall survival stratified by GNRI are shown for all cancer types (a) pancreatic cancer, (b) and other cancer types (c). On the right, Kaplan–Meier curves for recurrence-free survival stratified by GNRI are displayed for all cancer types (d), pancreatic cancer (e), and other cancer types (f). In all panels, GNRI groups are color-coded as follows: inferior GNRI status group (GNRI < 82) (blue), moderate GNRI status group (82 ≤ GNRI < 98) (red-dotted), superior GNRI status group (GNRI ≥ 98) (green-dashed). Median survival times (MSTs) are indicated in each panel. Risk tables are shown beneath each graph.
A comparable pattern emerged for recurrence-free survival (RFS): the superior GNRI status group achieved a 5-year RFS of 16.35% and an MST of 30.94 months, outperforming the inferior group (3.77%, 25.0 months; HR = 1.599, 95% CI 1.097–2.331, p = 0.015). The difference between superior and moderate GNRI status groups did not reach statistical significance.
3.3.2. Subgroup Analysis: Pancreatic Cancer vs. Other Malignancies
In subgroup analysis of pancreatic cancer patients (N = 112), the superior GNRI cohort demonstrated markedly better OS (5-year OS 10.42%, MST 24.37 months) than the inferior group (0%, 11.42 months; HR = 2.719, 95% CI 1.416–5.220, p = 0.003). OS did not differ significantly between superior and moderate GNRI status categories (HR = 1.487, 95% CI 0.900–2.458, p = 0.122). For RFS, the superior group again achieved more favorable outcomes (5-year RFS 8.33%, MST 21.58 months) compared with the inferior group (0%, 9.7 months; HR = 1.894, 95% CI 1.019–3.518, p = 0.043); no significant difference was observed versus the moderate group.
In patients with malignancies other than pancreatic cancer (N = 259), the superior GNRI status group attained a 5 year OS of 22.52% and an MST of 39.05 months, significantly exceeding both the moderate (18.92%, 33.31 months; HR = 3.164, 95% CI 1.958–5.115, p < 0.001) and inferior groups (5.41%, 21.77 months; HR = 1.617, 95% CI 1.087–2.407, p = 0.018). RFS did not differ significantly across GNRI groups in this subgroup.
3.4. Univariate and Multivariate Cox Regression Analysis
Univariate and multivariate analyses were conducted to identify significant predictors of OS and RFS across subgroups (Table 3 and Table 4). In the overall population, both inferior and moderate GNRI status groups were independently associated with significantly worse OS when compared to the superior GNRI status group. Specifically, patients in the inferior GNRI status group exhibited a HR of 2.869 (95% CI, 1.957–4.205; p < 0.001) in univariate analysis and 2.65 (95% CI, 1.706–4.116; p < 0.001) in multivariate analysis. Similarly, those in the moderate GNRI status group demonstrated an HR of 1.548 (95% CI, 1.146–2.091; p = 0.004) in univariate and 1.768 (95% CI, 1.246–2.511; p = 0.001) in multivariate analyses. In addition to GNRI, several perioperative factors were identified as independent risk factors for decreased OS. These included longer operative time (per hour increase: HR = 1.092, 95% CI: 1.024–1.164, p = 0.007), higher estimated intraoperative blood loss (per 100 mL increase: HR = 1.041, 95% CI: 1.022–1.059, p < 0.001), and larger tumor size (per mm increase: HR = 1.007, 95% CI: 1.001–1.013, p = 0.031). Beyond GNRI, lymph node metastasis was strongly associated with increased mortality risk (HR = 2.407, 95% CI: 1.7–3.413, p < 0.001). Tumor margin status (HR = 1.613, 95% CI: 1.111–2.340, p = 0.012) and receipt of adjuvant chemotherapy within three months post-operatively (HR = 1.346, 95% CI: 1.018–1.778, p = 0.037) were significant predictors in the univariate analysis, although neither remained statistically significant in the multivariate model regarding OS. For RFS, only the moderate GNRI status group showed significantly poorer outcomes, with an HR of 1.688 (95% CI, 1.161–2.454; p = 0.006) in univariate and 1.865 (95% CI, 1.265–2.751; p = 0.002) in multivariate models. Other independent predictors of shorter RFS included an increase in operative time and the presence of lymph node involvement, whereas an increase in age was unexpectedly associated with better RFS. Adjuvant chemotherapy administered within three months post-operatively was significantly associated with worse RFS in the univariate analysis (HR = 2.029, 95% CI: 1.434–2.872, p < 0.001), but this association did not remain significant in the multivariate model.
Table 3.
Univariate and multivariate analysis of predictors for overall survival (matched).
Table 4.
Univariate and multivariate analysis of predictors for recurrence-free survival (matched).
In the pancreatic cancer subgroup, patients with inferior GNRI exhibited significantly worse OS, with an HR of 2.981 (95% CI, 1.531–5.803; p = 0.001) in univariate and 2.697 (95% CI, 1.357–5.358; p = 0.005) in multivariate analyses. Lymph node involvement and an increase in estimated intraoperative blood loss were also identified as significant predictors of poor OS in this subgroup. For RFS, both lymph node involvement, ASA score greater than three and moderate GNRI status were independent predictors of poorer outcomes. Interestingly, patients in the inferior GNRI status group demonstrated a paradoxically better RFS with no significant difference compared with superior GNRI status group.
Among patients with malignancies other than pancreatic cancer, both inferior and moderate GNRI status categories were significantly associated with worse OS. Inferior GNRI status was linked to an HR of 3.035 (95% CI, 1.888–4.879; p < 0.001) in univariate and 2.385 (95% CI, 1.397–4.072; p < 0.001) in multivariate analyses, while moderate GNRI status corresponded to an HR of 1.616 (95% CI, 1.106–2.362; p = 0.013) in univariate and 1.6 (95% CI, 1.058–2.419; p = 0.026) in multivariate models. Additional predictors of poor OS in this group included an ASA score greater than 3, lymph node metastasis, and greater estimated intraoperative blood loss. Lymph node involvement and longer operative time (HR per 1 h increase in operative time = 1.144, 95% CI: 1.05–1.247; p = 0.002) are the two independent predictors of poor RFS found in patients with other malignancies.
4. Discussion
This study evaluated the relationship between preoperative GNRI scores and post-operative outcomes in patients undergoing pancreaticoduodenectomy (PD).
In this study, a lower GNRI was significantly associated with poorer OS and adverse short-term outcomes. Patients in the inferior GNRI status group had markedly higher 90-day (24.53% versus 5.03%) and 1-year mortality rates (43.4% versus 14.47%), compared to those in the superior GNRI status group (GNRI ≥ 98), with an MST of 18.64 months versus 34.62 months. These findings highlight the impact of malnutrition on prognosis, although part of this association may also reflect the severity of disease- and cancer-related cachexia.
Malnutrition affects up to 70% of patients with upper gastrointestinal (GI) cancers, driven by cancer-related metabolic alterations, pancreatic insufficiency, and impaired gastrointestinal function [1]. Prior studies have demonstrated that sarcopenia is linked to worse OS in pancreatic cancer [22], and lower preoperative GNRI scores have been associated with reduced survival across several cancers, including gastric, colorectal, pancreatic, esophageal, and hepatocellular cancers [23,24,25,26,27,28]. These findings are consistent with our results.
In this study, GNRI was identified as a strong and independent determinant of OS, retaining significance even after adjustment for cancer type, tumor stage, and receipt of adjuvant chemotherapy. Consistent with prior reports, patients with inferior GNRI status experienced higher rates of adverse perioperative outcomes, including prolonged post-operative hospital stay, prolonged ICU stay, unplanned ICU readmission, higher rate of pulmonary complications and greater reliance on parenteral nutrition [13,19]. In our cohort, low GNRI scores were further associated with increased ventilator dependence, higher rates of reintubation, and more frequent reoperation in patient undergoing PD. These short-term complications are known to increase early mortality and exert lasting negative effects on survival [29,30,31,32,33,34], providing a plausible explanation for the inferior long-term outcomes observed in patients in the inferior GNRI status group.
Although adjuvant chemotherapy and preoperative CA19-9 have been reported as prognostic variables for periampullary cancers [34,35,36,37,38,39,40], their effects were not independent in this cohort, whereas lymph node metastasis remained a consistent predictor of OS and RFS [41,42]. The dominant influence of GNRI on survival, therefore, appears to reflect the cumulative burden of short-term complications and high early mortality, which may offset the potential benefit of systemic therapy. Supporting evidence indicates that both low GNRI and incomplete chemotherapy independently predict poor survival [35], and that the adverse impact of major complications on OS is mediated through the omission of adjuvant therapy [34,35,36]. Collectively, these findings suggest that nutritional risk exerts a prognostic effect that may be as important as classical oncologic factors, highlighting GNRI as a simple and objective biomarker that may help identify patients who could benefit from intensified nutritional optimization to improve survival.
Several studies, including randomized controlled trials and meta-analyses, have demonstrated the benefits of nutritional care in patients with moderate-to-severe preoperative malnutrition [43,44,45]. emphasizing the need for preoperative nutritional assessment. Various tools are available to assess nutritional status, and noninvasive biomarkers are gaining popularity owing to their ease of use. Some studies focus exclusively on nutrition, while others also incorporate immune status. However, no consensus has yet been reached regarding a standard preoperative nutritional marker for patients undergoing PD.
Lu et al. compared seven inflammatory–nutritional indicators, including the albumin-to-globulin ratio, Prognostic Nutritional Index (PNI), systemic immune-inflammation index (SII), neutrophil-to-lymphocyte ratio (NLR), platelet-to-lymphocyte ratio (PLR), Nutritional Risk Index (NRI), and GNRI, in pancreatic cancer patients, 51.6% of whom underwent PD. Their findings suggested that PNI was a better predictor of post-operative survival [46]. PNI reflects both nutritional and immune status, as it includes albumin and lymphocyte counts. However, since it incorporates immune parameters, it may not purely reflect nutritional status, which could complicate decisions on nutritional interventions. The NRI requires comparison between a patient’s usual and current weight, which can be difficult to recall, particularly for elderly patients. In contrast, GNRI, based solely on serum albumin and BMI, offers a simpler and more practical method for rapid nutritional assessment.
Sarcopenia is a reliable marker of malnutrition and a known predictor of poor outcomes in patients with cancer [47,48]. However, its assessment using techniques such as bioelectrical impedance analysis (BIA), dual-energy X-ray absorptiometry (DXA), and CT/MRI-based muscle mass or intramuscular adipose tissue content (IMAC) can be expensive and less feasible in routine clinical practice. Other nutritional assessment tools such as the Subjective Global Assessment (SGA), Malnutrition Universal Screening Tool (MUST), Mini Nutritional Assessment (MNA), and Nutritional Risk Screening Tool 2002 (NRS-2002), though effective, require time-consuming interviews, limiting their practicality in high-volume clinical settings.
This study has several limitations. First, as data were obtained from the CGRD, all patient information was de-identified and post-operative complications were identified only through diagnostic codes, limiting access to detailed clinical records. Second, the inferior GNRI status group included relatively few patients, making subgroup analysis underpowered and reducing the statistical robustness. Third, because multiple cancer types were included, staging comparisons were avoided to reduce complexity and maintain a sufficient sample size. However, pancreatic cancer was analyzed separately, as it represented a major subgroup of interest. Fourth, post-operative follow-up of nutritional parameters such as weight loss or changes in nutritional status was not performed, limiting assessment of long-term nutritional impact. Fifth, due to the nature of the CGRD, information on perioperative chemotherapy was limited to whether it was administered within three months pre- or post-operatively, in accordance with guideline recommendations [14]. However, the exact timing of initiation could not be determined. Finally, the study did not compare the GNRI with other nutritional assessment tools, which might have provided additional insights into its predictive value. Future research should incorporate more detailed clinical data, larger cohorts, and longitudinal nutritional follow-up to validate these findings.
5. Conclusions
Our study showed that an inferior GNRI status is associated with worse short-term outcomes and reduced overall survival in patients undergoing pancreaticoduodenectomy. These findings highlight the need for preoperative nutritional assessment and suggest that intervention may be warranted, as poor nutritional status is associated with adverse outcomes in this population.
Author Contributions
Conceptualization, C.-Y.L., Y.-H.L., Y.-Y.L., W.-F.L., C.-H.Y., S.-M.Y. and J.-Y.C.; methodology, Y.-W.L. and Y.-Y.L.; software, Y.-H.L. and Y.-Y.L.; validation, Y.-W.L., W.-F.L. and J.-Y.C.; formal analysis, S.-M.Y.; investigation, C.-Y.L., Y.-H.L., C.-H.Y. and S.-M.Y.; resources, S.-M.Y.; data curation, C.-Y.L., C.-H.Y., S.-M.Y. and J.-Y.C.; writing—original draft preparation, C.-Y.L.; writing—review and editing, S.-M.Y.; visualization, C.-Y.L.; supervision, S.-M.Y.; project administration, S.-M.Y.; funding acquisition, S.-M.Y. All authors have read and agreed to the published version of the manuscript.
Funding
This research received no external funding.
Institutional Review Board Statement
The study was conducted in accordance with the Declaration of Helsinki, and approved by the Institutional Review Board of Chang Gung Medical Foundation (protocol code 202500746B0 and starting date of 15 May 2025).
Informed Consent Statement
Patient consent was waived due to the data from CGRD being de-identified.
Data Availability Statement
The datasets generated and analyzed in this study are derived from the Chang Gung Research Database (CGRD) and are de-identified. Due to institutional policy and data use agreements, the raw data is not publicly available.
Acknowledgments
The authors would like to thank the administrative staff of Chang Gung Memorial Hospital for their support in data retrieval and logistics coordination. We also appreciate the assistance from the Clinical Informatics and Medical Statistics Center for data management and consultation.
Conflicts of Interest
The authors declare no conflicts of interest.
Abbreviations
The following abbreviations are used in this manuscript:
| PD | Pancreaticoduodenectomy |
| GNRI | Geriatric Nutritional Risk Index |
| OS | Overall Survival |
| RFS | Recurrence-Free Survival |
| HR | Hazard ratio |
| CI | Confidence Interval |
| MST | Median Survival Time |
| ACT | Adjuvant chemotherapy |
| NACT | Neoadjuvant chemotherapy |
| LN | Lymph node |
| ICU | Intensive Care Unit |
| TPN | Total Parenteral Nutrition |
| ASA | American Society of Anesthesiologists |
| AJCC | American Joint Committee on Cancer |
| PSM | Propensity Score Matching |
| CGRD | Chang Gung Research Database |
Appendix A
Table A1.
Baseline characteristics of patients undergoing pancreaticoduodenectomy according to GNRI categories before and after propensity score matching (PSM).
Table A1.
Baseline characteristics of patients undergoing pancreaticoduodenectomy according to GNRI categories before and after propensity score matching (PSM).
| Cohort (N = 1203) | Match (N = 371) | |||||||
|---|---|---|---|---|---|---|---|---|
| Characteristics | Inferior GNRI < 82 (n = 67) | Moderate 82 ≤ GNRI < 98 (n = 544) | Superior GNRI ≥ 98 (n = 592) | p-Value | Inferior GNRI < 82 (n = 53) | Moderate 82 ≤ GNRI < 98 (n = 159) | Superior GNRI ≥ 98 (n = 159) | p-Value |
| Tumor Type | ||||||||
| Pancreatic cancer, n (%) | 16 (23.88%) | 299 (42.1%) | 242 (40.88%) | 0.0158 | 16 (30.19%) | 48 (30.19%) | 48 (30.19%) | 1 |
| Distal CBD cancer, n (%) | 12 (17.91%) | 76 (13.97%) | 61 (10.3%) | 0.0637 | 12 (22.64%) | 37 (23.27%) | 34 (21.38%) | 0.9206 |
| Ampullary cancer, n (%) | 22 (32.84%) | 140 (25.74%) | 106 (17.91%) | 0.0007 | 22 (41.51%) | 63 (39.62%) | 63 (39.62%) | 0.9668 |
| Duodenal/gastric cancer, n (%) | 3 (4.48%) | 25 (4.6%) | 33 (5.57%) | 0.7349 | 3 (5.66%) | 11 (6.92%) | 14 (8.81%) | 0.6973 |
| Benign, n (%) | 14 (20.9%) | 74 (13.6%) | 150 (25.34%) | <0.0001 | ||||
| Age, year ± SD | 67.06 ± 13.62 | 66.08 ± 10.58 | 60.89 ± 11.69 | <0.0001 | 69.81 ± 10.26 | 68.03 ± 10.11 | 65.82 ± 10.29 | 0.9834 |
| Gender | 0.1015 | 0.904 | ||||||
| Male, n (%) | 39 (58.21%) | 330 (60.66%) | 322 (54.39%) | 28 (52.83%) | 82 (51.57%) | 86 (54.09%) | ||
| Female, n (%) | 28 (41.79%) | 214 (39.34%) | 270 (45.61%) | 25 (47.17%) | 77 (48.43%) | 73 (45.91%) | ||
| BMI, mean ± SD | 21.37 ± 2.29 | 22.21 ± 2.47 | 22.85 ± 2.72 | <0.0001 | 21.5 ± 2.48 | 22.33 ± 2.49 | 23.02 ± 2.63 | 0.0004 |
| Pre-OP biliary drainage, n (%) | 31 (46.27%) | 274 (50.37%) | 176 (29.73) | <0.0001 | 28 (52.83%) | 90 (56.6%) | 65 (40.88%) | 0.0169 |
| Underlying disease | ||||||||
| HTN, n (%) | 23 (34.33%) | 187 (34.38%) | 175 (29.56%) | 0.2023 | 19 (35.85%) | 68 (42.77%) | 55 (34.59%) | 0.3007 |
| DM, n (%) | 22 (32.84%) | 152 (27.94%) | 163 (27.53%) | 0.6565 | 20 (37.74%) | 51 (32.08%) | 44 (27.67%) | 0.3618 |
| Lab data, mean ± SD | ||||||||
| CA19-9 (ng/mL), mean ± SD | 1201.93 ± 4828.04 | 648.88 ± 2571.32 | 306.85 ± 1563.45 | <0.0001 | 1284.97 ± 5067.47 | 660.36 ± 2177.19 | 492.14 ± 2798.76 | <0.0001 |
| ALB (g/dL), mean ± SD | 2.5 ± 0.35 | 3.4 ± 0.3 | 4.24 ± 0.3 | <0.0001 | 2.53 ± 0.32 | 3.37 ± 0.3 | 4.17 ± 0.28 | <0.0001 |
| T-BIL (mg/dL), mean ± SD | 3.36 ± 3.64 | 3.4 ± 3.91 | 1.81 ±2.66 | <0.0001 | 3.44 ± 3.81 | 3.46 ± 3.92 | 2.21 ± 3.3 | <0.0001 |
| Surgery Type | 0.1979 | |||||||
| Open, n (%) | 525 (96.51%) | 599 (94.43%) | 52 (98.11%) | 155 (97.48%) | 155 (97.48%) | 0.8207 | ||
| MIS, n (%) | 19 (3.49%) | 33 (5.57%) | 1 (1.89%) | 4 (2.52%) | 4 (2.52%) | |||
| ASA physical status | 0.0017 | 0.9551 | ||||||
| I–II, n (%) | 12 (17.91%) | 106 (19.49%) | 166 (28.04%) | 10 (18.87%) | 32 (20.13%) | 30 (18.87%) | ||
| III–IV, n (%) | 55 (82.09%) | 438 (80.51%) | 426 (71.96%) | 43 (81.13%) | 127 (79.87%) | 129 (81.13%) | ||
| OP time (minutes), mean ± SD | 520.64 ± 147.07 | 525.75 ± 134.98 | 517.96 ± 145.16 | 0.2332 | 524.95 ± 146.68 | 515.29 ± 132.66 | 511.52 ± 155.08 | 0.5163 |
| OP blood loss (mL), mean ± SD | 791.42 ± 982.41 | 549.52 ± 836.49 | 420.24 ± 581.51 | <0.0001 | 604.34 ± 688.43 | 492.58 ± 861.86 | 473.02 ± 733.84 | 0.0577 |
| LN number, mean ± SD | 19.35 ± 11.48 | 19.87 ± 10.22 | 19.19 ± 10.39 | 0.5356 | 19.36 ± 11.65 | 20.01 ± 10.81 | 19.42 ± 10.54 | 0.7468 |
| positive LN number, mean ± SD | 1.96 ± 3.60 | 1.90 ± 2.49 | 1.85 ± 2.95 | 0.3376 | 1.9 ± 3.66 | 1.46 ± 2.23 | 1.33 ± 2.18 | 0.5032 |
| Tumor size (mm), mean ± SD | 33.10 ± 23.57 | 31.97 ± 18.26 | 30.04 ± 16.27 | 0.256 | 32.9 ± 23.92 | 32.97 ± 23.04 | 28.09 ± 14.66 | 0.1799 |
| Tumor margin | 0.1131 | 0.7125 | ||||||
| R0 resection, n (%) | 58 (86.57%) | 444 (81.62%) | 509 (85.98%) | 44 (83.02%) | 138 (86.79%) | 139 (87.42%) | ||
| Not R0 resection, n (%) | 9 (13.43%) | 100 (18.38%) | 83 (14.02%) | 9 (16.98%) | 21 (13.21%) | 20 (12.58%) | ||
| Pathological staging | 0.014 | 0.192 | ||||||
| Stage I | 10 (14.93%) | 87 (15.99%) | 108 (18.24%) | 10 (18.87%) | 29 (18.24%) | 40 (25.16%) | ||
| Stage II | 29 (43.28%) | 240 (44.12%) | 193 (32.60%) | 28 (52.83%) | 77 (48.43%) | 65 (40.88%) | ||
| Stage III | 7 (10.45%) | 109 (20.04%) | 79 (13.34%) | 6 (11.32%) | 31 (19.50%) | 27 (16.98%) | ||
| Stage IV | 4 (5.97%) | 11 (2.02%) | 19 (3.21%) | 4 (7.55%) | 3 (1.89%) | 6 (3.77%) | ||
| Perioperative chemotherapy in 3 months | ||||||||
| NACT | 2 (2.99%) | 11 (2.02%) | 30 (5.07%) | 0.021 | 1 (1.89%) | 2 (1.26%) | 7 (4.40%) | 0.207 |
| ACT | 16 (23.88%) | 212 (38.97%) | 214 (36.15) | 0.049 | 14 (26.42%) | 60 (37.74%) | 48 (30.19%) | 0.2 |
BMI, body mass index; SD, standard deviation; OP, operation or operative; HTN, hypertension; DM, Diabetes mellitus; CA19-9, Carbohydrate antigen 19-9; ALB, albumin; T-BIL, total bilirubin; MIS, minimally invasive surgery (laparoscopic or robotic approach); LN, lymph node; NACT, neoadjuvant chemotherapy; ACT, adjuvant chemotherapy.
Table A2.
Comparison of short-term outcomes and mortality in patients undergoing pancreatoduodenec-tomy stratified by GNRI categories before and after propensity score matching (PSM).
Table A2.
Comparison of short-term outcomes and mortality in patients undergoing pancreatoduodenec-tomy stratified by GNRI categories before and after propensity score matching (PSM).
| Cohort (n = 1203) | Match (n = 371) | |||||||
|---|---|---|---|---|---|---|---|---|
| Prognostic Outcomes | GNRI < 82 (n = 67) | 82 ≤ GNRI < 98 (n = 544) | GNRI ≥ 98 (n = 592) | p-Value | GNRI < 82 (n = 53) | 82 ≤ GNRI < 98 (n = 159) | GNRI ≥ 98 (n = 159) | p-Value |
| Post-operative stays, day(s) ± SD | 24.28 ± 12.6 | 23.78 ± 10.4 | 24.14 ± 11.9 | 0.682 | 24.51 ± 11.43 | 23.57 ± 9.35 | 27.36 ± 12.7 | 0.0573 |
| Length of ICU stay, day(s) ± SD | 7.55 ± 8.53 | 4.74 ± 6.26 | 3.54 ± 3.66 | <0.0001 | 7.22 ± 8.79 | 4.73 ± 5.05 | 4.1 ± 4.59 | 0.0007 |
| Length of ventilator use, day(s) ± SD | 5.4 ± 7.32 | 3.18 ± 5.41 | 2.49 ± 2.61 | <0.0001 | 5.02 ± 7.44 | 2.9 ± 4.24 | 2.81 ± 3.19 | 0.0191 |
| Reintubation, n (%) | 9 (13.43%) | 18 (3.31%) | 17 (2.87%) | <0.0001 | 8 (15.09%) | 7 (4.4%) | 6 (3.77%) | 0.025 |
| Readmission to ICU, n (%) | 10 (13.43%) | 30 (5.51%) | 25 (4.22%) | 0.0012 | 9 (16.98%) | 11 (6.92%) | 9 (5.66%) | 0.3365 |
| TPN use, n (%) | 46 (68.66%) | 229 (42.1%) | 219 (36.99%) | <0.0001 | 37 (69.81%) | 74 (46.54%) | 66 (41.51%) | 0.0016 |
| ≥Grade 3 Complication, n (%) | 20 (29.85%) | 55 (10.11%) | 47(7.94%) | <0.0001 | 14 (26.42%) | 19 (11.95%) | 17 (10.69%) | 0.112 |
| Reoperation, n (%) | 14 (20.9%) | 30 (5.51%) | 25 (4.22%) | <0.0001 | 10 (18.87%) | 8 (5.03%) | 7 (4.4%) | 0.0007 |
| 30-day Mortality, n (%) | 10 (14.93%) | 12 (2.21%) | 9 (1.52%) | <0.0001 | 6 (11.32%) | 7 (4.4%) | 3 (1.89%) | 0.0137 |
| 90-day Mortality, n (%) | 18 (26.87%) | 30 (5.51%) | 18 (3.04%) | <0.0001 | 13 (24.53%) | 11 (6.92%) | 8 (5.03%) | <0.0001 |
| 1-Year Mortality, n (%) | 28 (41.79%) | 138 (25.37%) | 84 (14.19%) | <0.0001 | 23 (43.4%) | 41 (25.79%) | 23 (14.47%) | <0.0001 |
SD, standard deviation; ICU, intensive care unit; TPN, total parenteral nutrition.
Table A3.
Adjuvant chemotherapy (≤12 weeks) across GNRI groups among stage II–IV patients. To further investigate whether GNRI status influenced the likelihood of receiving adjuvant chemotherapy, we conducted a subgroup analysis restricted to patients with stage II or higher disease from each GNRI status group. A chi-square test revealed no statistically significant difference in adjuvant chemotherapy receipt among these groups.
| GNRI Status | Stage II or Higher (N) | ACT Within 3 Months, n (%) | No ACT Within 3 Months, n (%) |
|---|---|---|---|
| Inferior GNRI status (GNRI < 82) | 38 | 14 (36.8%) * | 24 (63.2%) * |
| moderate GNRI status (82 ≤ GNRI < 98) | 111 | 60 (54.1%) * | 51 (45.9%) * |
| superior GNRI status (GNRI ≥ 98) | 98 | 48 (49%) * | 50 (51.0%) * |
| total | 247 | 122 (49.4%) * | 125 (50.6%) * |
* Denominators are restricted to patients with pathologic stage II–IV (AJCC 8th). Receipt of adjuvant chemotherapy was derived from CGRD treatment records and may include a small number of stage I cases; thus “ACT received” counts reflect all recorded recipients irrespective of final pathologic stage. ACT, adjuvant chemotherapy. Statistical tests: Pearson’s χ2(2) = 3.3662, p-value = 0.185799. The result is not significant at p < 0.05.
References
- De Luca, R.; Gianotti, L.; Pedrazzoli, P.; Brunetti, O.; Rizzo, A.; Sandini, M.; Paiella, S.; Pecorelli, N.; Pugliese, L.; Pietrabissa, A.; et al. Immunonutrition and prehabilitation in pancreatic cancer surgery: A new concept in the era of ERAS® and neoadjuvant treatment. Eur. J. Surg. Oncol. 2023, 49, 542–549. [Google Scholar] [CrossRef]
- Kim, E.; Lee, D.H.; Jang, J.Y. Effects of Preoperative Malnutrition on Postoperative Surgical Outcomes and Quality of Life of Elderly Patients with Periampullary Neoplasms: A Single-Center Prospective Cohort Study. Gut Liver 2019, 13, 690–697. [Google Scholar] [CrossRef]
- du, Y.; Li, L.; Liu, Y.; Wang, S. Prevalence of Malnutrition and the Value of Predicting Pancreatic Fistula in Patients with Laparoscopic Pancreatoduodenectomy. J. Laparoendosc. Adv. Surg. Tech. A 2023, 33, 937–943. [Google Scholar] [CrossRef] [PubMed]
- Lobo, D.N.; Gianotti, L.; Adiamah, A.; Barazzoni, R.; Deutz, N.E.P.; Dhatariya, K.; Greenhaff, P.L.; Hiesmayr, M.; Hjort Jakobsen, D.; Klek, S.; et al. Perioperative nutrition: Recommendations from the ESPEN expert group. Clin. Nutr. 2020, 39, 3211–3227. [Google Scholar] [CrossRef]
- Arends, J.; Bachmann, P.; Baracos, V.; Barthelemy, N.; Bertz, H.; Bozzetti, F.; Fearon, K.; Hütterer, E.; Isenring, E.; Kaasa, S.; et al. ESPEN guidelines on nutrition in cancer patients. Clin. Nutr. 2017, 36, 11–48. [Google Scholar] [CrossRef]
- Meguid, M.M.; Debonis, D.; Meguid, V.; Hill, L.R.; Terz, J.J. Complications of abdominal operations for malignant disease. Am. J. Surg. 1988, 156, 341–345. [Google Scholar] [CrossRef]
- Karim, S.A.M.; Abdulla, K.S.; Abdulkarim, Q.H.; Rahim, F.H. The outcomes and complications of pancreaticoduodenectomy (Whipple procedure): Cross sectional study. Int. J. Surg. 2018, 52, 383–387. [Google Scholar] [CrossRef]
- Lee, B.; Han, H.S.; Yoon, Y.S.; Cho, J.Y.; Lee, J.S. Impact of preoperative malnutrition, based on albumin level and body mass index, on operative outcomes in patients with pancreatic head cancer. J. Hepatobiliary Pancreat. Sci. 2021, 28, 1069–1075. [Google Scholar] [CrossRef]
- Funamizu, N.; Nakabayashi, Y.; Iida, T.; Kurihara, K. Geriatric nutritional risk index predicts surgical site infection after pancreaticoduodenectomy. Mol. Clin. Oncol. 2018, 9, 274–278. [Google Scholar] [CrossRef] [PubMed]
- Afaneh, C.; Gerszberg, D.; Slattery, E.; Seres, D.S.; Chabot, J.A.; Kluger, M.D. Pancreatic cancer surgery and nutrition management: A review of the current literature. Hepatobiliary Surg. Nutr. 2015, 4, 59–71. [Google Scholar] [CrossRef] [PubMed]
- Cong, K.; Chunwei, G. Exploration of three different nutritional scores in predicting postoperative complications after pancreaticoduodenectomy. Nutr. Hosp. 2022, 39, 101–110. [Google Scholar] [CrossRef]
- Cheung, H.H.T.; Joynt, G.M.; Lee, A. Diagnostic test accuracy of preoperative nutritional screening tools in adults for malnutrition: A systematic review and network meta-analysis. Int. J. Surg. 2024, 110, 1090–1098. [Google Scholar] [CrossRef] [PubMed]
- Hou, T.Y.; Lin, Y.H.; Liu, Y.W.; Liu, Y.Y.; Li, W.F.; Kuo, M.C.; Huang, S.W.; Yeh, C.H.; Lin, Y.C.; Yin, S.M. The impact of preoperative nutritional status on postoperative outcomes: An insight from Geriatric Nutritional Risk Index in elderly pancreaticoduodenectomy patients. BMC Surg. 2024, 24, 100. [Google Scholar] [CrossRef] [PubMed]
- National Comprehensive Cancer Network. NCCN Clinical Practice Guidelines in Oncology (NCCN Guidelines®): Pancreatic Adenocarcinoma; Version 3.2025; National Comprehensive Cancer Network: Plymouth Meeting, PA, USA, 2025. [Google Scholar]
- Cui, J.; Jiao, F.; Li, Q.; Wang, Z.; Fu, D.; Liang, J.; Liang, H.; Xia, T.; Zhang, T.; Zhang, Y.; et al. Chinese Society of Clinical Oncology (CSCO): Clinical guidelines for the diagnosis and treatment of pancreatic cancer. J. Natl. Cancer Cent. 2022, 2, 205–215. [Google Scholar] [CrossRef]
- Martin-Perez, E.; Domínguez-Muñoz, J.E.; Botella-Romero, F.; Cerezo, L.; Matute Teresa, F.; Serrano, T.; Vera, R. Multidisciplinary consensus statement on the clinical management of patients with pancreatic cancer. Clin. Transl. Oncol. 2020, 22, 1963–1975. [Google Scholar] [CrossRef]
- National Comprehensive Cancer Network. NCCN Clinical Practice Guidelines in Oncology (NCCN Guidelines®): Ampullary Adenocarcinoma. Version 2.2025. Available online: https://www.nccn.org/professionals/physician_gls/pdf/ampullary.pdf (accessed on 3 February 2025).
- Bouillanne, O.; Morineau, G.; Dupont, C.; Coulombel, I.; Vincent, J.P.; Nicolis, I.; Benazeth, S.; Cynober, L.; Aussel, C. Geriatric Nutritional Risk Index: A new index for evaluating at-risk elderly medical patients. Am. J. Clin. Nutr. 2005, 82, 777–783. [Google Scholar] [CrossRef]
- Wang, M.H.; Chen, C.Y.; Lin, Y.H.; Liu, Y.W.; Liu, Y.Y.; Li, W.F.; Lin, C.T.; Huang, S.W.; Yeh, C.H.; Yin, S.M. High Geriatric Nutritional Risk Index Risk as a Predictor of Postoperative Complications and Early Mortality in Older Adult Patients Undergoing Pancreatoduodenectomy for Periampullary Malignancies. J. Clin. Med. 2025, 14, 655. [Google Scholar] [CrossRef] [PubMed]
- Yu, Z.; Kong, D.; Peng, J.; Wang, Z.; Chen, Y. Association of malnutrition with all-cause mortality in the elderly population: A 6-year cohort study. Nutr. Metab. Cardiovasc. Dis. 2021, 31, 52–59. [Google Scholar] [CrossRef]
- Nakayama, M.; Gosho, M.; Adachi, M.; Ii, R.; Matsumoto, S.; Miyamoto, H.; Hirose, Y.; Nishimura, B.; Tanaka, S.; Wada, T.; et al. The Geriatric Nutritional Risk Index as a Prognostic Factor in Patients with Advanced Head and Neck Cancer. Laryngoscope 2021, 131, E151–E156. [Google Scholar] [CrossRef]
- Thormann, M.; Hinnerichs, M.; Barajas Ordonez, F.; Saalfeld, S.; Perrakis, A.; Croner, R.; Omari, J.; Pech, M.; Zamsheva, M.; Meyer, H.J.; et al. Sarcopenia is an Independent Prognostic Factor in Patients With Pancreatic Cancer—A Meta-analysis. Acad. Radiol. 2023, 30, 1552–1561. [Google Scholar] [CrossRef]
- Miyamoto, H.; Toyokawa, T.; Ishidate, T.; Kuroda, K.; Miki, Y.; Yoshii, M.; Tamura, T.; Lee, S.; Maeda, K. Significance of the geriatric nutritional risk index and neutrophil-to-lymphocyte ratio as prognostic indicators in older patients with gastric cancer: A retrospective cohort study. BMC Cancer 2024, 24, 1396. [Google Scholar] [CrossRef]
- Zhao, H.; Xu, L.; Tang, P.; Guo, R. Geriatric Nutritional Risk Index and Survival of Patients With Colorectal Cancer: A Meta-Analysis. Front. Oncol. 2022, 12, 906711. [Google Scholar] [CrossRef]
- Qiu, J.; Yu, Y.; Wang, Z.; Hong, L.; Shao, L.; Wu, J. Comprehensive analysis of the prognostic value of pre-treatment nutritional indicators in elderly rectal cancer patients. Sci. Rep. 2024, 14, 22078. [Google Scholar] [CrossRef]
- Kato, A.; Aoyama, T.; Maezawa, Y.; Hashimoto, I.; Hara, K.; Kazama, K.; Numata, M.; Sawazaki, S.; Tamagawa, A.; Cho, H.; et al. Geriatric Nutritional Risk Index Is an Independent Prognostic Factor for Patients With Esophageal Cancer Who Receive Curative Treatment. Anticancer. Res. 2024, 44, 331–337. [Google Scholar] [CrossRef]
- Yang, C.K.; Huang, K.T.; Qin, W.; Wu, Q.Y.; Huang, X.L.; Peng, K.; Lao, Q.; Ye, X.P.; Zhu, G.Z.; Li, T.M.; et al. Prognostic value of geriatric nutritional risk index and prognostic nutritional index in hepatocellular carcinoma. Clin. Nutr. ESPEN 2024, 59, 355–364. [Google Scholar] [CrossRef] [PubMed]
- Grinstead, C.; Yoon, S.L. Geriatric Nutritional Risk Index (GNRI) and Survival in Pancreatic Cancer: A Retrospective Study. Nutrients 2025, 17, 509. [Google Scholar] [CrossRef]
- Ramachandran, S.K.; Nafiu, O.O.; Ghaferi, A.; Tremper, K.K.; Shanks, A.; Kheterpal, S. Independent predictors and outcomes of unanticipated early postoperative tracheal intubation after nonemergent, noncardiac surgery. Anesthesiology 2011, 115, 44–53. [Google Scholar] [CrossRef]
- Mosquera, C.; Koutlas, N.J.; Edwards, K.C.; Strickland, A.; Vohra, N.A.; Zervos, E.E.; Fitzgerald, T.L. Impact of malnutrition on gastrointestinal surgical patients. J. Surg. Res. 2016, 205, 95–101. [Google Scholar] [CrossRef] [PubMed]
- Fernandez-Zamora, M.D.; Gordillo-Brenes, A.; Banderas-Bravo, E.; Arboleda-Sánchez, J.A.; Hinojosa-Pérez, R.; Aguilar-Alonso, E.; Herruzo-Aviles, Á.; Curiel-Balsera, E.; Sánchez-Rodríguez, Á.; Rivera-Fernández, R. Prolonged Mechanical Ventilation as a Predictor of Mortality After Cardiac Surgery. Respir. Care 2018, 63, 550–557. [Google Scholar] [CrossRef] [PubMed]
- Hamed, M.; Brandecker, S.; Rana, S.; Potthoff, A.L.; Eichhorn, L.; Bode, C.; Schmeel, F.C.; Radbruch, A.; Schäfer, N.; Herrlinger, U.; et al. Postoperative prolonged mechanical ventilation correlates to poor survival in patients with surgically treated spinal metastasis. Front. Oncol. 2022, 12, 940790. [Google Scholar] [CrossRef]
- Lessing, Y.; Pencovich, N.; Nevo, N.; Lubezky, N.; Goykhman, Y.; Nakache, R.; Lahat, G.; Klausner, J.M.; Nachmany, I. Early reoperation following pancreaticoduodenectomy: Impact on morbidity, mortality, and long-term survival. World J. Surg. Oncol. 2019, 17, 26. [Google Scholar] [CrossRef]
- Henry, A.C.; van Dongen, J.C.; van Goor, I.; Smits, F.J.; Nagelhout, A.; Besselink, M.G.; Busch, O.R.; Bonsing, B.A.; Bosscha, K.; van Dam, R.M.; et al. Impact of complications after resection of pancreatic cancer on disease recurrence and survival, and mediation effect of adjuvant chemotherapy: Nationwide, observational cohort study. BJS Open 2023, 7, zrac174. [Google Scholar] [CrossRef]
- Higashi, T.; Murase, K.; Yokoi, R.; Kuno, M.; Fukada, M.; Tajima, J.Y.; Kiyama, S.; Tanaka, Y.; Okumura, N.; Matsuhashi, N. Association of Pre-operative Geriatric Nutritional Risk Index With Complete Adjuvant Chemotherapy and Prognosis Post-pancreatectomy. Anticancer. Res. 2024, 44, 427–434. [Google Scholar] [CrossRef]
- Wu, W.; He, J.; Cameron, J.L.; Makary, M.; Soares, K.; Ahuja, N.; Rezaee, N.; Herman, J.; Zheng, L.; Laheru, D.; et al. The impact of postoperative complications on the administration of adjuvant therapy following pancreaticoduodenectomy for adenocarcinoma. Ann. Surg. Oncol. 2014, 21, 2873–2881. [Google Scholar] [CrossRef]
- Wentz, S.C.; Zhao, Z.G.; Shyr, Y.; Shi, C.J.; Merchant, N.B.; Washington, K.; Xia, F.; Chakravarthy, A.B. Lymph node ratio and preoperative CA 19-9 levels predict overall survival and recurrence-free survival in patients with resected pancreatic adenocarcinoma. World J. Gastrointest. Oncol. 2012, 4, 207–215. [Google Scholar] [CrossRef]
- Park, S.H.; Shin, J.H.; Jung, K.U.; Lee, S.R. Prognostic value of carcinoembryonic antigen and carbohydrate antigen 19-9 in periampullary cancer patients receiving pancreaticoduodenectomy. Asian J. Surg. 2021, 44, 829–835. [Google Scholar] [CrossRef] [PubMed]
- Boyev, A.; Prakash, L.R.; Chiang, Y.J.; Newhook, T.E.; Bruno, M.L.; Arvide, E.M.; Dewhurst, W.L.; Kim, M.P.; Ikoma, N.; Lee, J.E.; et al. Elevated CA 19-9 is associated with worse survival in patients with resected ampullary adenocarcinoma. Surg. Oncol. 2023, 51, 101994. [Google Scholar] [CrossRef] [PubMed]
- Uijterwijk, B.A.; Lemmers, D.H.; Ghidini, M.; Wilmink, H.; Zaniboni, A.; Salvia, R.; Kito Fusai, G.; Groot Koerkamp, B.; Koek, S.; Ghorbani, P.; et al. The Five Periampullary Cancers, not Just Different Siblings but Different Families: An International Multicenter Cohort Study. Ann. Surg. Oncol. 2024, 31, 6157–6169. [Google Scholar] [CrossRef]
- Russell, T.B.; Labib, P.L.; Denson, J.; Ausania, F.; Pando, E.; Roberts, K.J.; Kausar, A.; Mavroeidis, V.K.; Marangoni, G.; Thomasset, S.C.; et al. Predictors of actual five-year survival and recurrence after pancreatoduodenectomy for ampullary adenocarcinoma: Results from an international multicentre retrospective cohort study. HPB 2023, 25, 788–797. [Google Scholar] [CrossRef] [PubMed]
- Lee, D.H.; Kim, H.J.; Cho, C.W.; Yun, S.S.; Lee, D.S. Factors influencing patterns of recurrence following pancreaticoduodenectomy for patients with distal bile duct cancer and ampulla of Vater cancer. Ann. Hepatobiliary Pancreat. Surg. 2022, 26, 138–143. [Google Scholar] [CrossRef]
- Perioperative total parenteral nutrition in surgical patients. N. Engl. J. Med. 1991, 325, 525–532. [CrossRef]
- Bozzetti, F.; Gavazzi, C.; Miceli, R.; Rossi, N.; Mariani, L.; Cozzaglio, L.; Bonfanti, G.; Piacenza, S. Perioperative total parenteral nutrition in malnourished, gastrointestinal cancer patients: A randomized, clinical trial. JPEN J. Parenter. Enter. Nutr. 2000, 24, 7–14. [Google Scholar] [CrossRef]
- Serón-Arbeloa, C.; Labarta-Monzón, L.; Puzo-Foncillas, J.; Mallor-Bonet, T.; Lafita-López, A.; Bueno-Vidales, N.; Montoro-Huguet, M. Malnutrition Screening and Assessment. Nutrients 2022, 14, 2392. [Google Scholar] [CrossRef] [PubMed]
- Lu, J.N.; Zhou, L.S.; Zhang, S.; Li, J.X.; Xu, C.J. Performance of nutritional and inflammatory markers in patients with pancreatic cancer. World J. Clin. Oncol. 2024, 15, 1021–1032. [Google Scholar] [CrossRef] [PubMed]
- Meza-Valderrama, D.; Marco, E.; Dávalos-Yerovi, V.; Muns, M.D.; Tejero-Sánchez, M.; Duarte, E.; Sánchez-Rodríguez, D. Sarcopenia, Malnutrition, and Cachexia: Adapting Definitions and Terminology of Nutritional Disorders in Older People with Cancer. Nutrients 2021, 13, 761. [Google Scholar] [CrossRef] [PubMed]
- Liu, R.; Qiu, Z.; Zhang, L.; Ma, W.; Zi, L.; Wang, K.; Kuang, T.; Zhao, K.; Wang, W. High intramuscular adipose tissue content associated with prognosis and postoperative complications of cancers. J. Cachexia Sarcopenia Muscle 2023, 14, 2509–2519. [Google Scholar] [CrossRef]
Disclaimer/Publisher’s Note: The statements, opinions and data contained in all publications are solely those of the individual author(s) and contributor(s) and not of MDPI and/or the editor(s). MDPI and/or the editor(s) disclaim responsibility for any injury to people or property resulting from any ideas, methods, instructions or products referred to in the content. |
© 2025 by the authors. Licensee MDPI, Basel, Switzerland. This article is an open access article distributed under the terms and conditions of the Creative Commons Attribution (CC BY) license (https://creativecommons.org/licenses/by/4.0/).