
Development and Validation of the Early Gastric Carcinoma Prediction Model in Post-Eradication Patients with Intestinal Metaplasia

Simple Summary
Abstract
1. Introduction
2. Materials and Methods
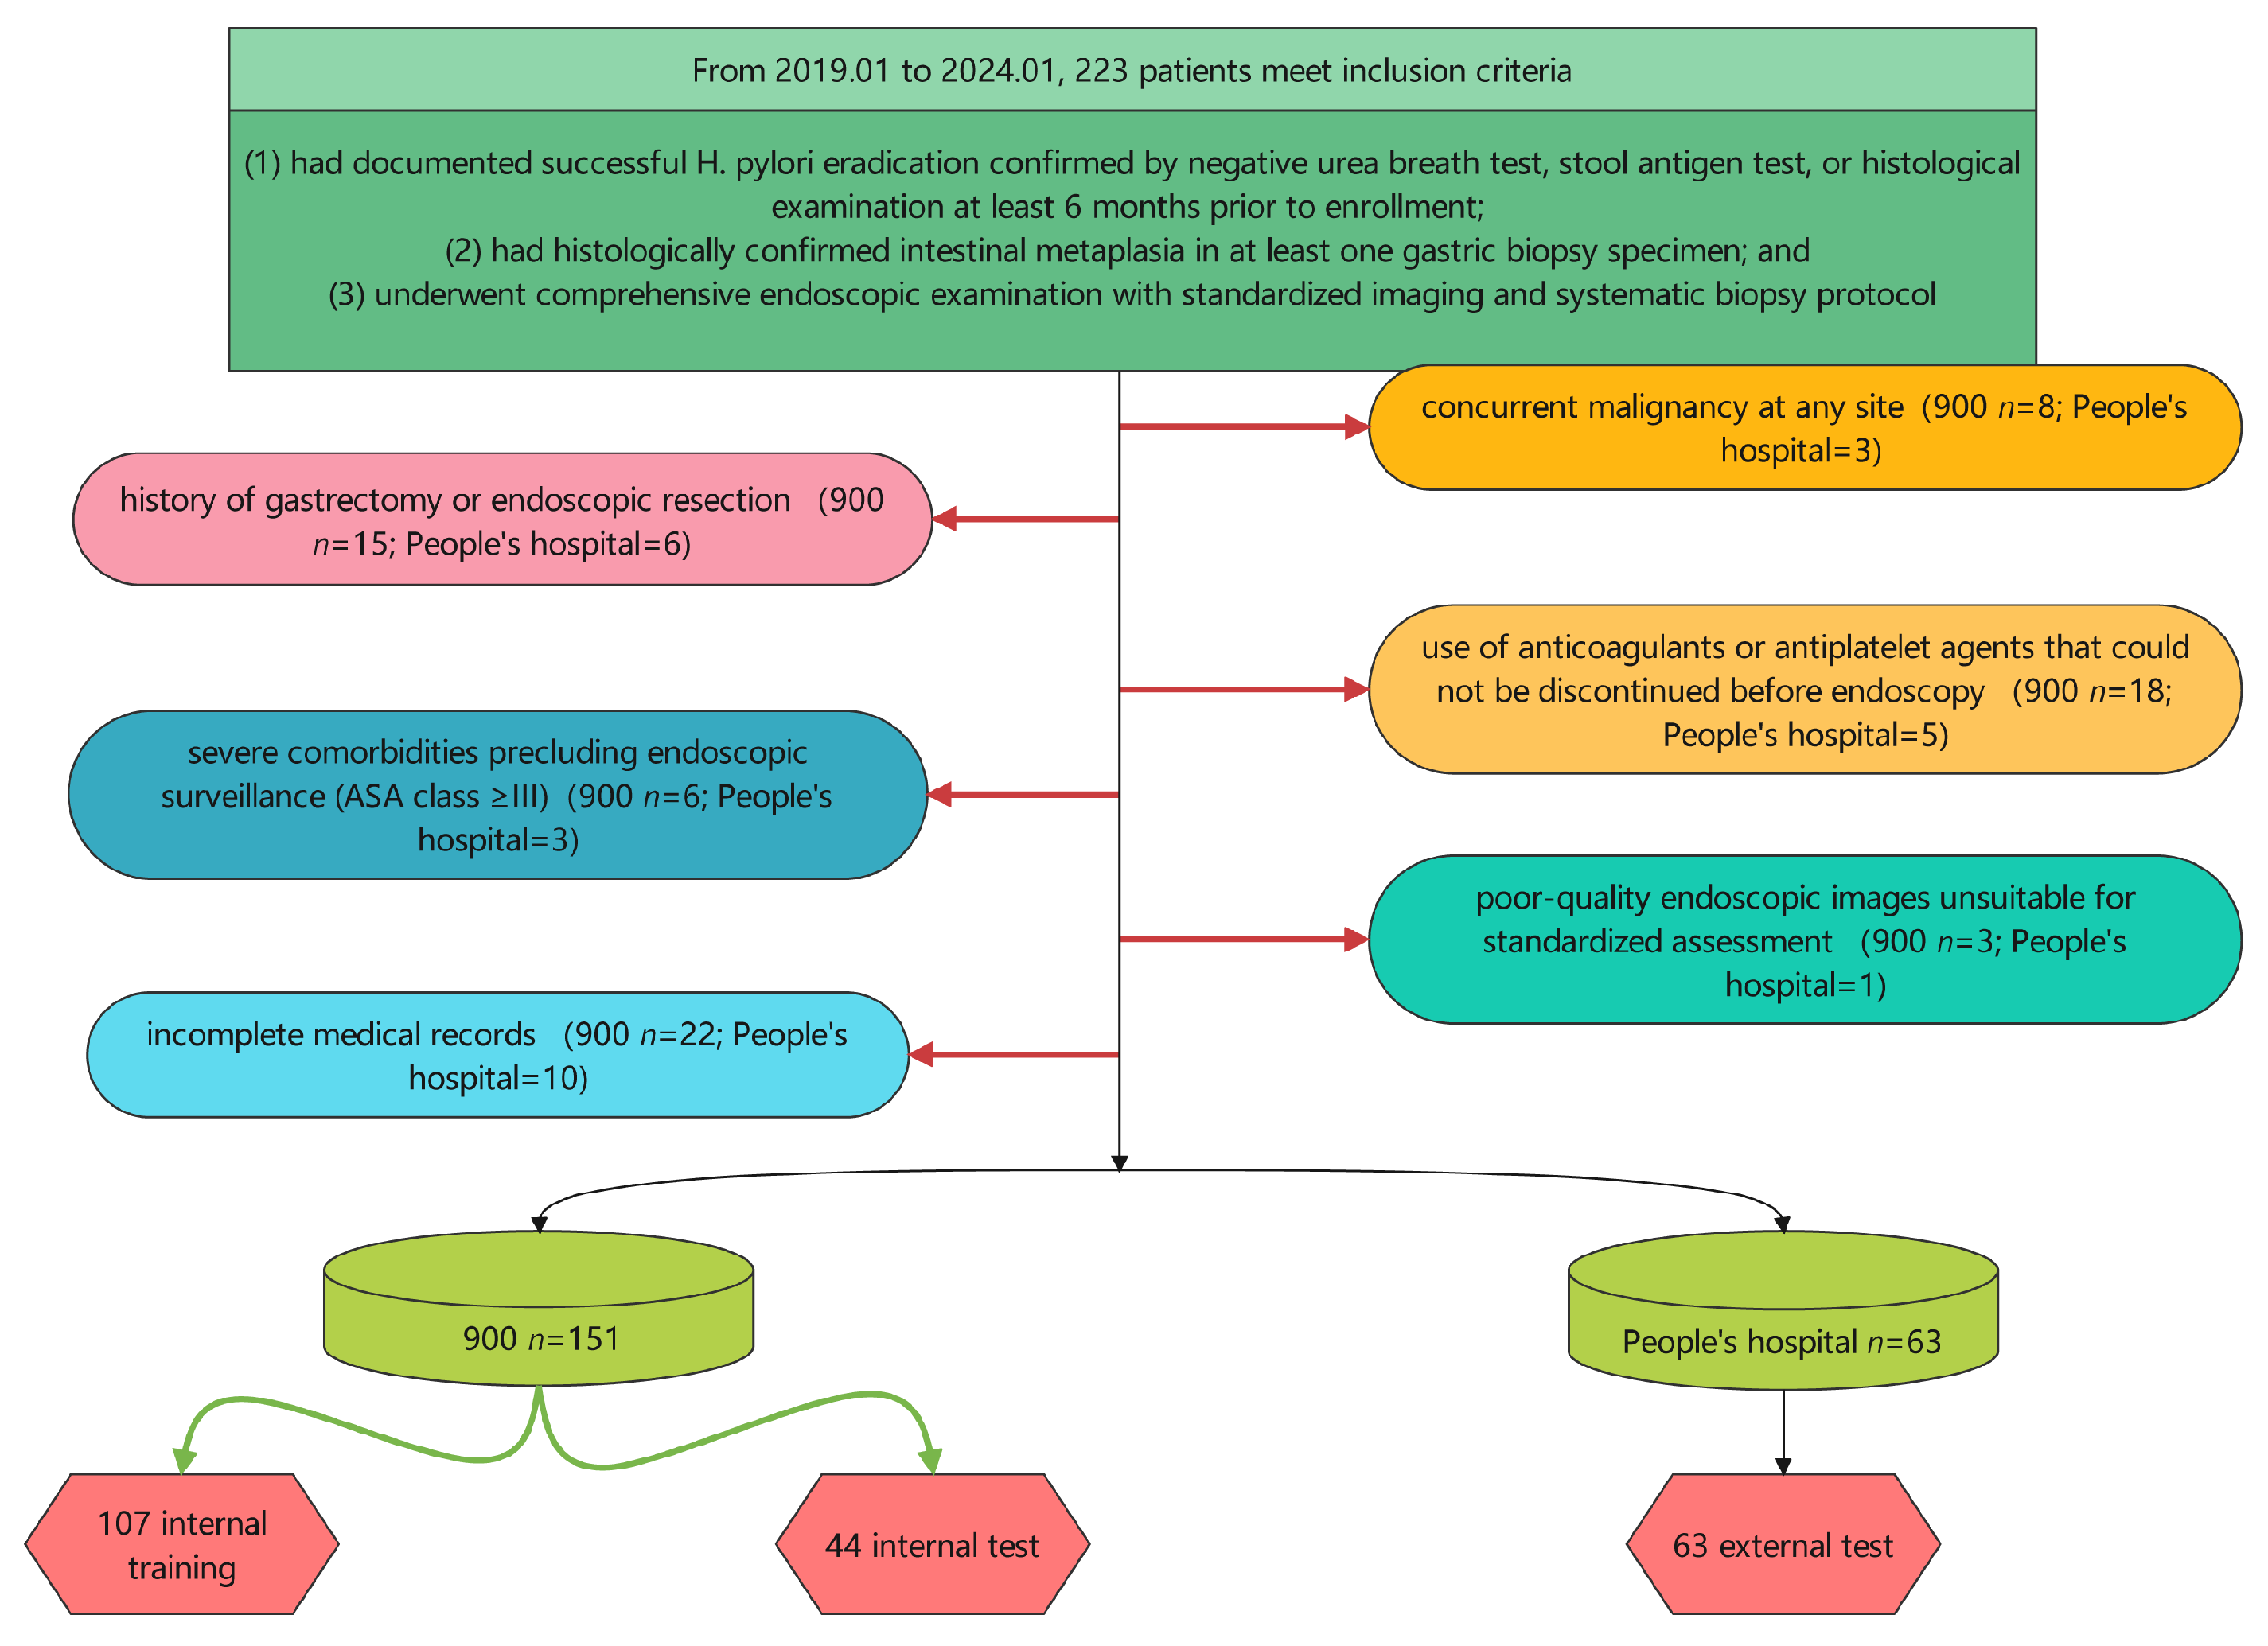
2.1. Study Design and Patient Population
2.2. Data Collection
2.3. Demographic and Clinical Variables
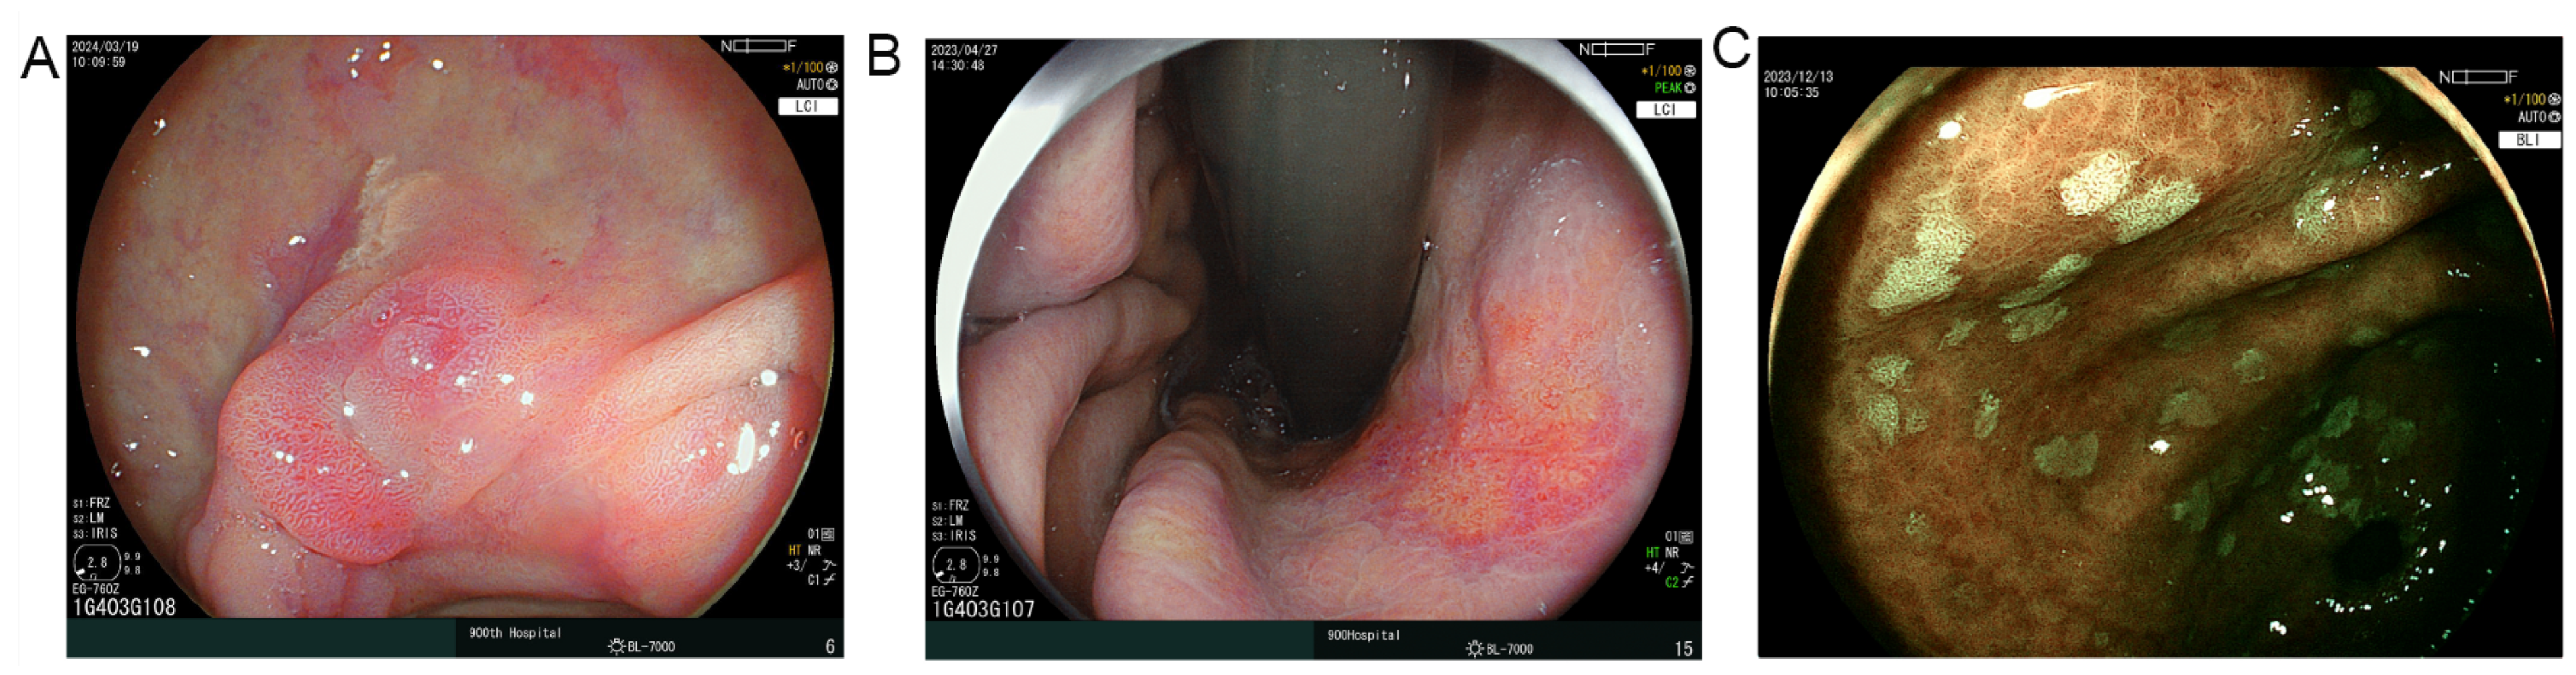
2.4. Endoscopic Assessment
2.5. Laboratory Parameters and Inflammatory Indices
- Neutrophil-to-lymphocyte ratio (NLR) [15] = neutrophil count/lymphocyte count
- Platelet-to-lymphocyte ratio (PLR) [15] = platelet count/lymphocyte count
- Lymphocyte-to-monocyte ratio (LMR) [15] = lymphocyte count/monocyte count
- Prognostic nutritional index (PNI) [15] = 10 × serum albumin (g/dL) + 0.005 × total lymphocyte count (per mm3)
- Systemic immune-inflammation index (SII) [15] = platelet count × neutrophil count/lymphocyte count
- Systemic inflammation response index (SIRI) [15] = neutrophil count × monocyte count/lymphocyte count
- Geriatric nutritional risk index (GNRI) [15] = 1.489 × albumin (g/L) + 41.7 × (weight/ideal weight)
- Hemoglobin, albumin, lymphocyte, and platelet score (HALP) [16] = hemoglobin (g/L) × albumin (g/L) × lymphocyte count/platelet count
- Platelet-to-albumin ratio (PAR) [16] = platelet count/serum albumin (g/L)
2.6. Feature Selection and Engineering
2.7. Model Development and Validation
- Tree-based methods: CatBoost, LightGBM, Random Forest, Extra Trees, Gradient Boosting, Decision Tree
- Ensemble methods: Bagging, AdaBoost
- Support vector machines: SVC (Polynomial kernel), SVC (Radial Basis Function kernel), Linear SVC
- Bayesian methods: Gaussian Naive Bayes, Bernoulli Naive Bayes
- Linear models: Quadratic Discriminant Analysis (QDA), Linear Discriminant Analysis (LDA), Ridge Classifier, Logistic Regression, Stochastic Gradient Descent (SGD) Classifier
- Neural networks: Multi-Layer Perceptron (MLP)
- Instance-based methods: K-Nearest Neighbors (k = 3), K-Nearest Neighbors (k = 5)
2.8. Model Comparison and Ensemble Creation
2.9. Calibration and Decision Curve Analysis
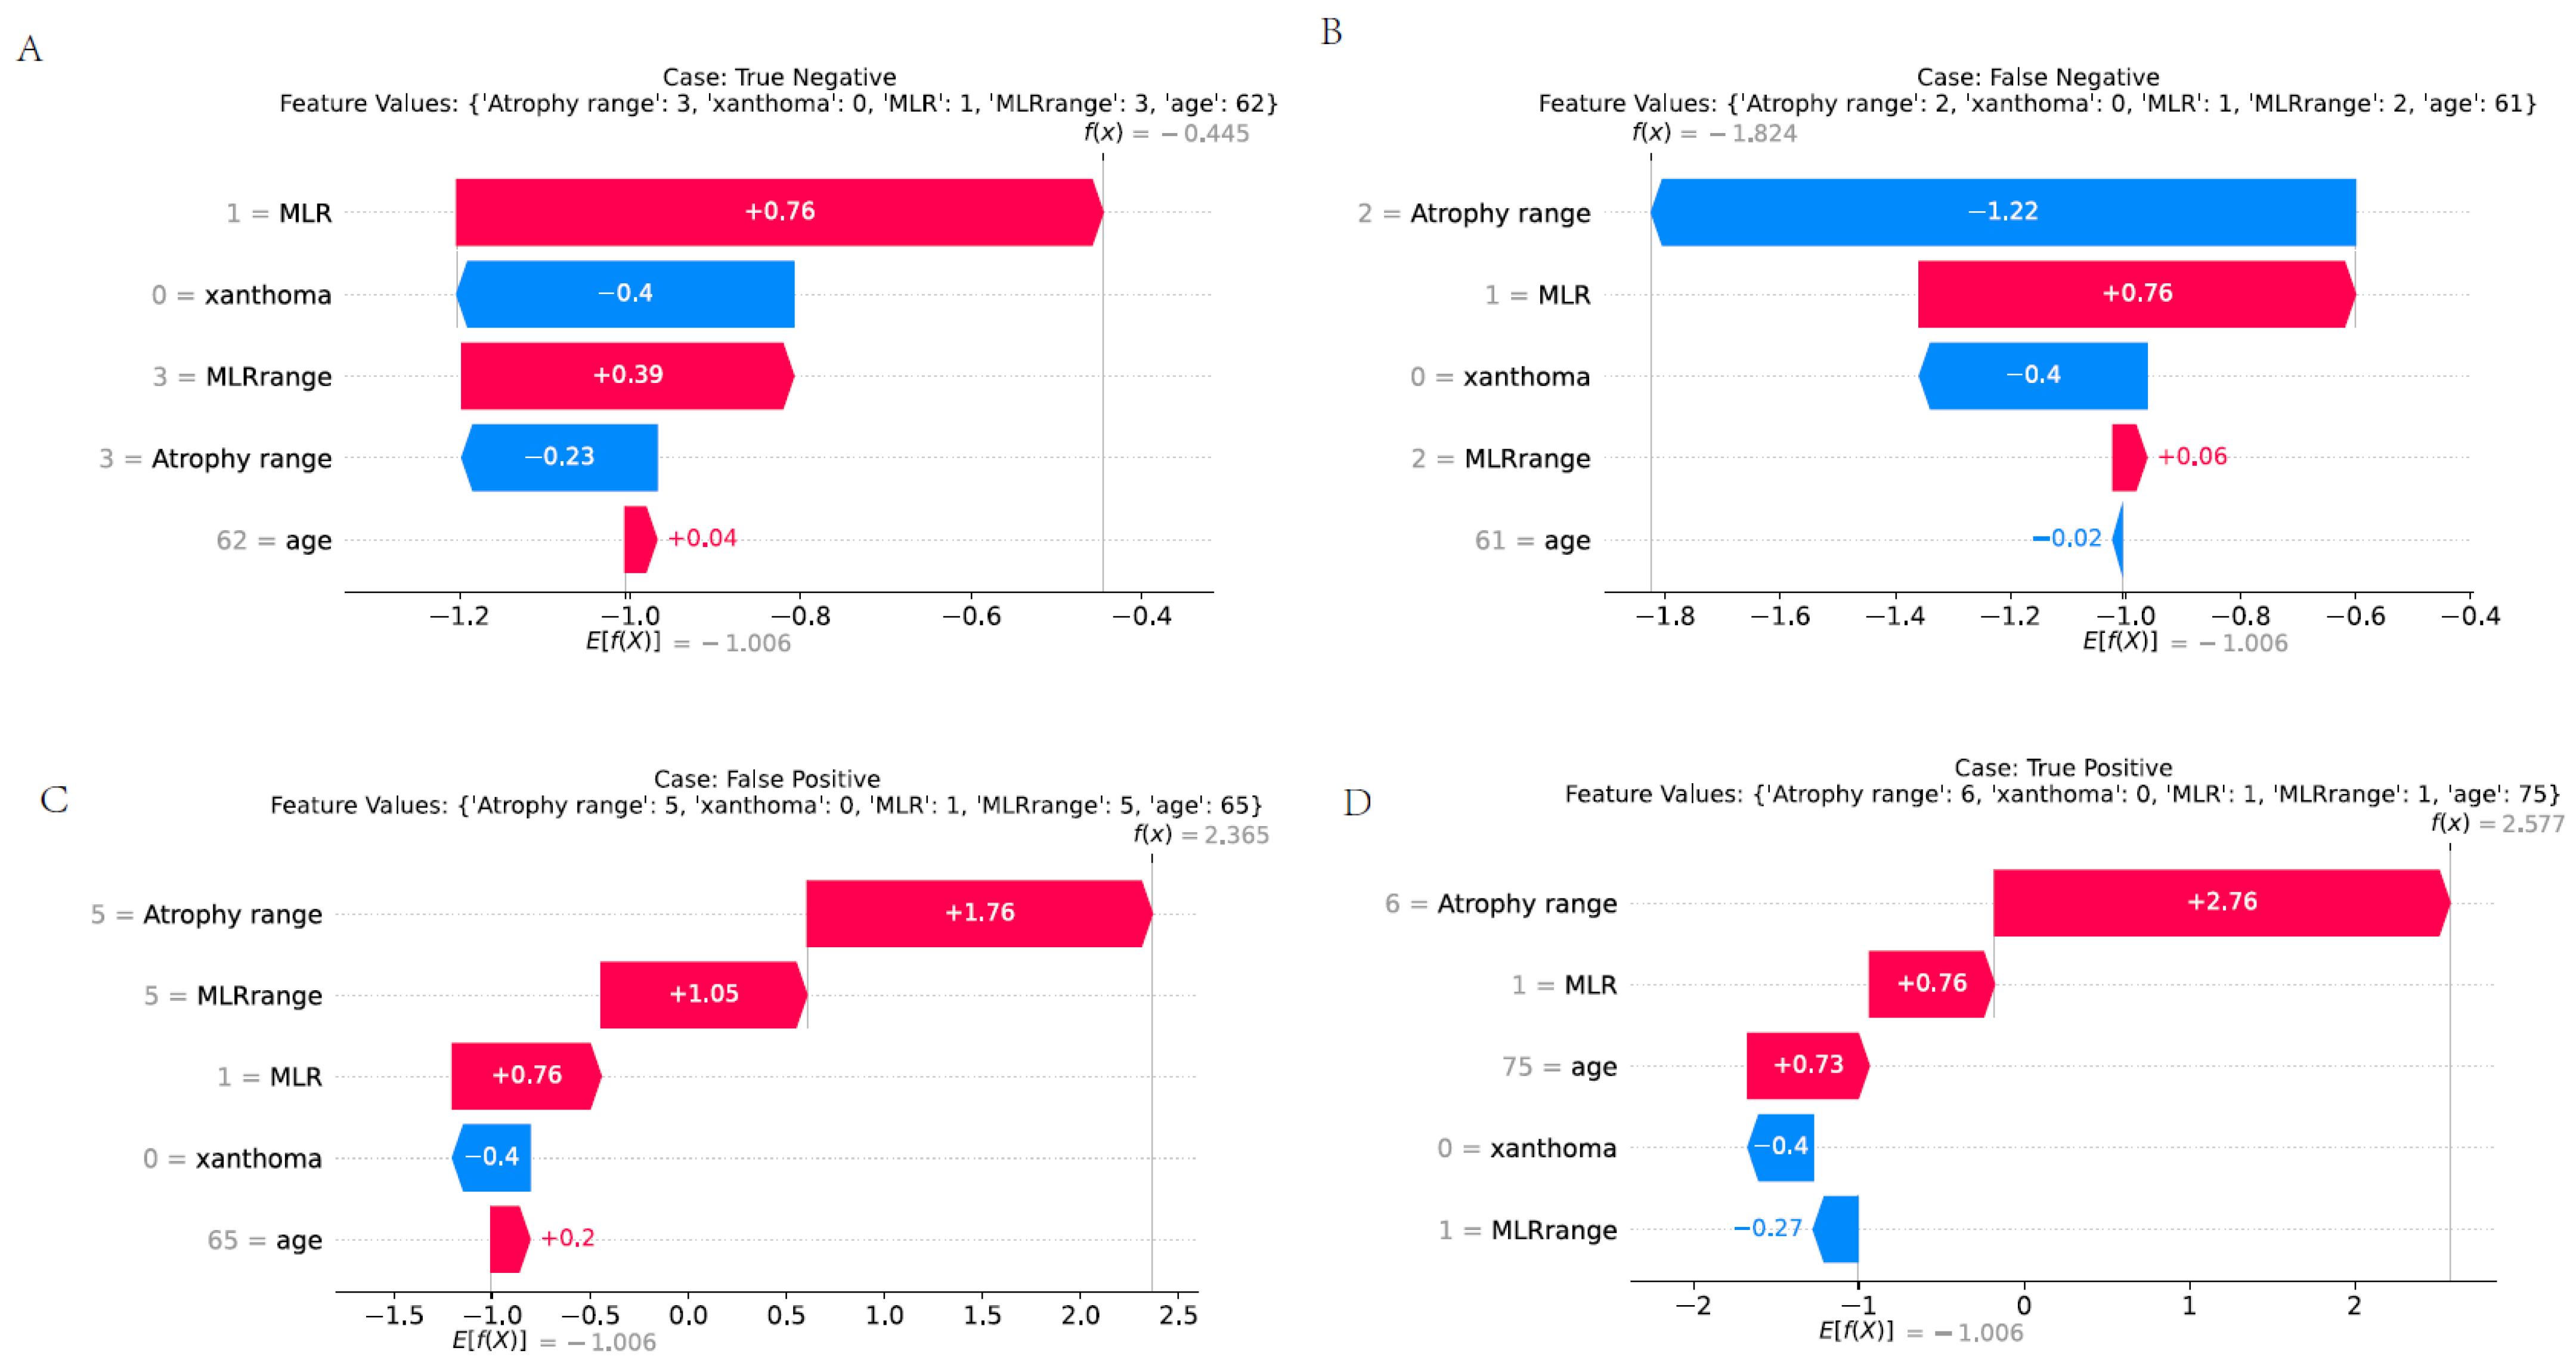
2.10. Interpretability Analysis
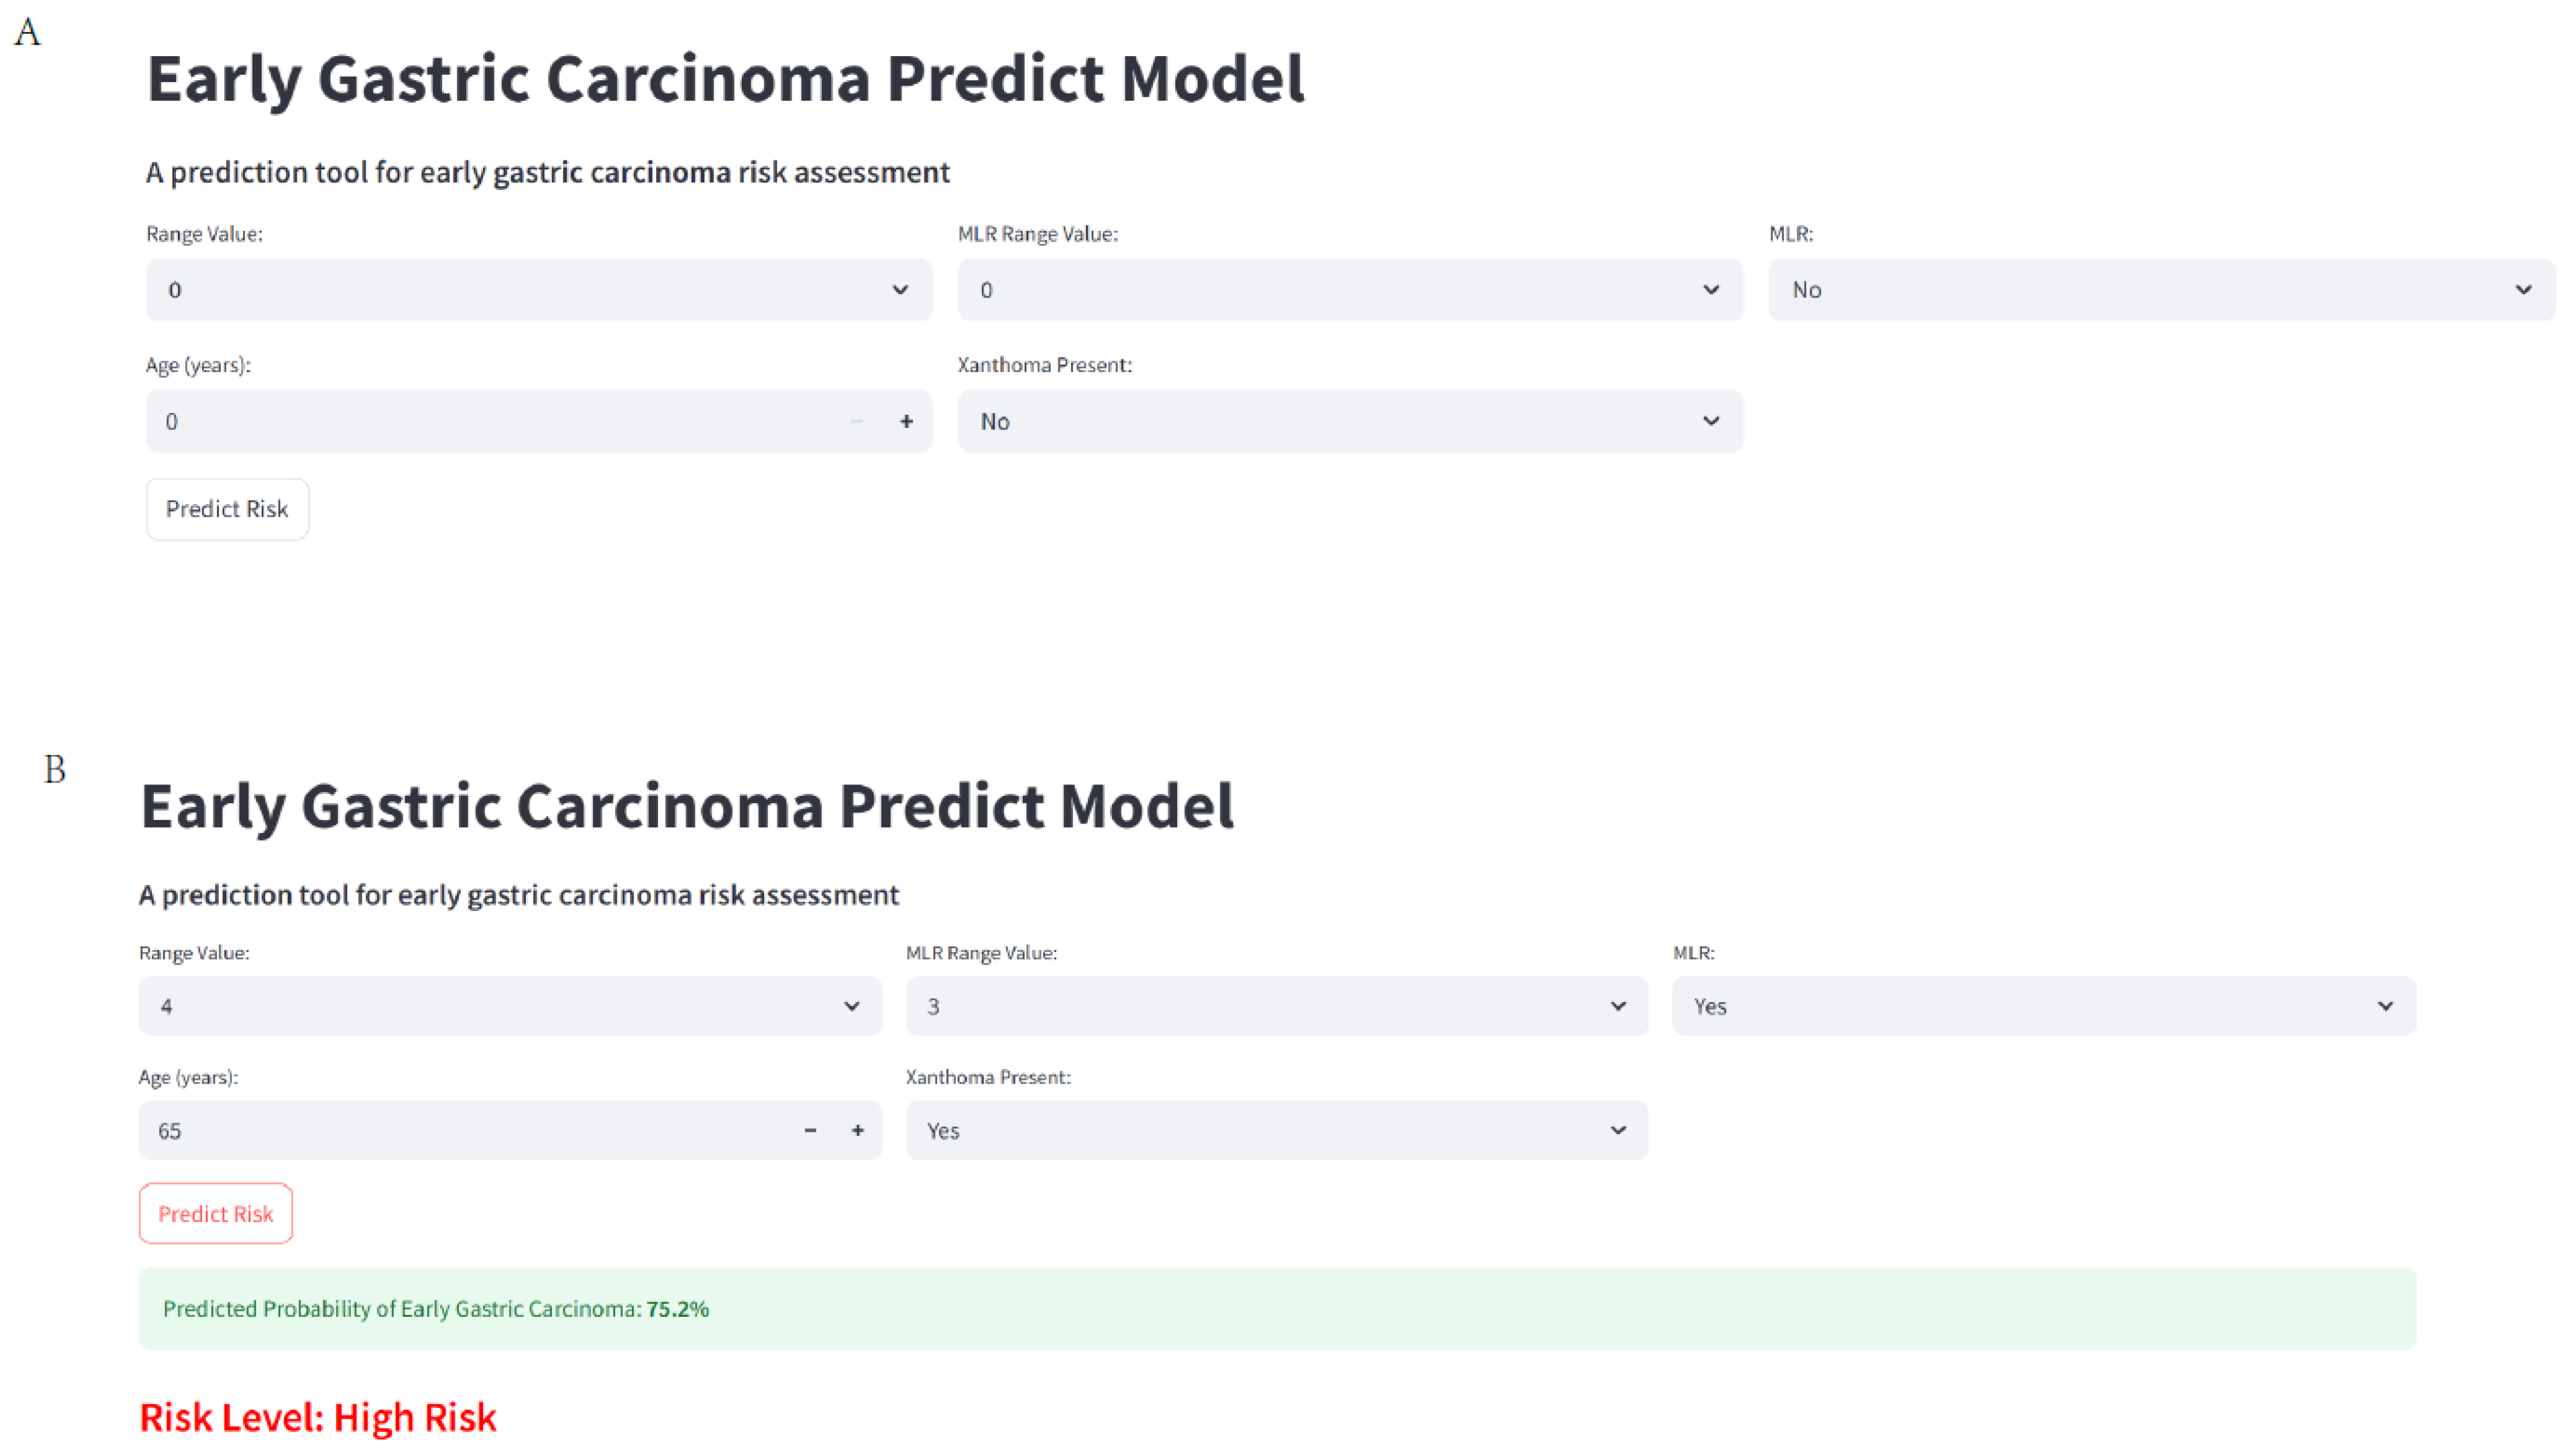
2.11. Web-Based Calculator Development
2.12. Statistical Analysis
3. Result
3.1. Basic Information of All Patients
3.2. Information in Training Set
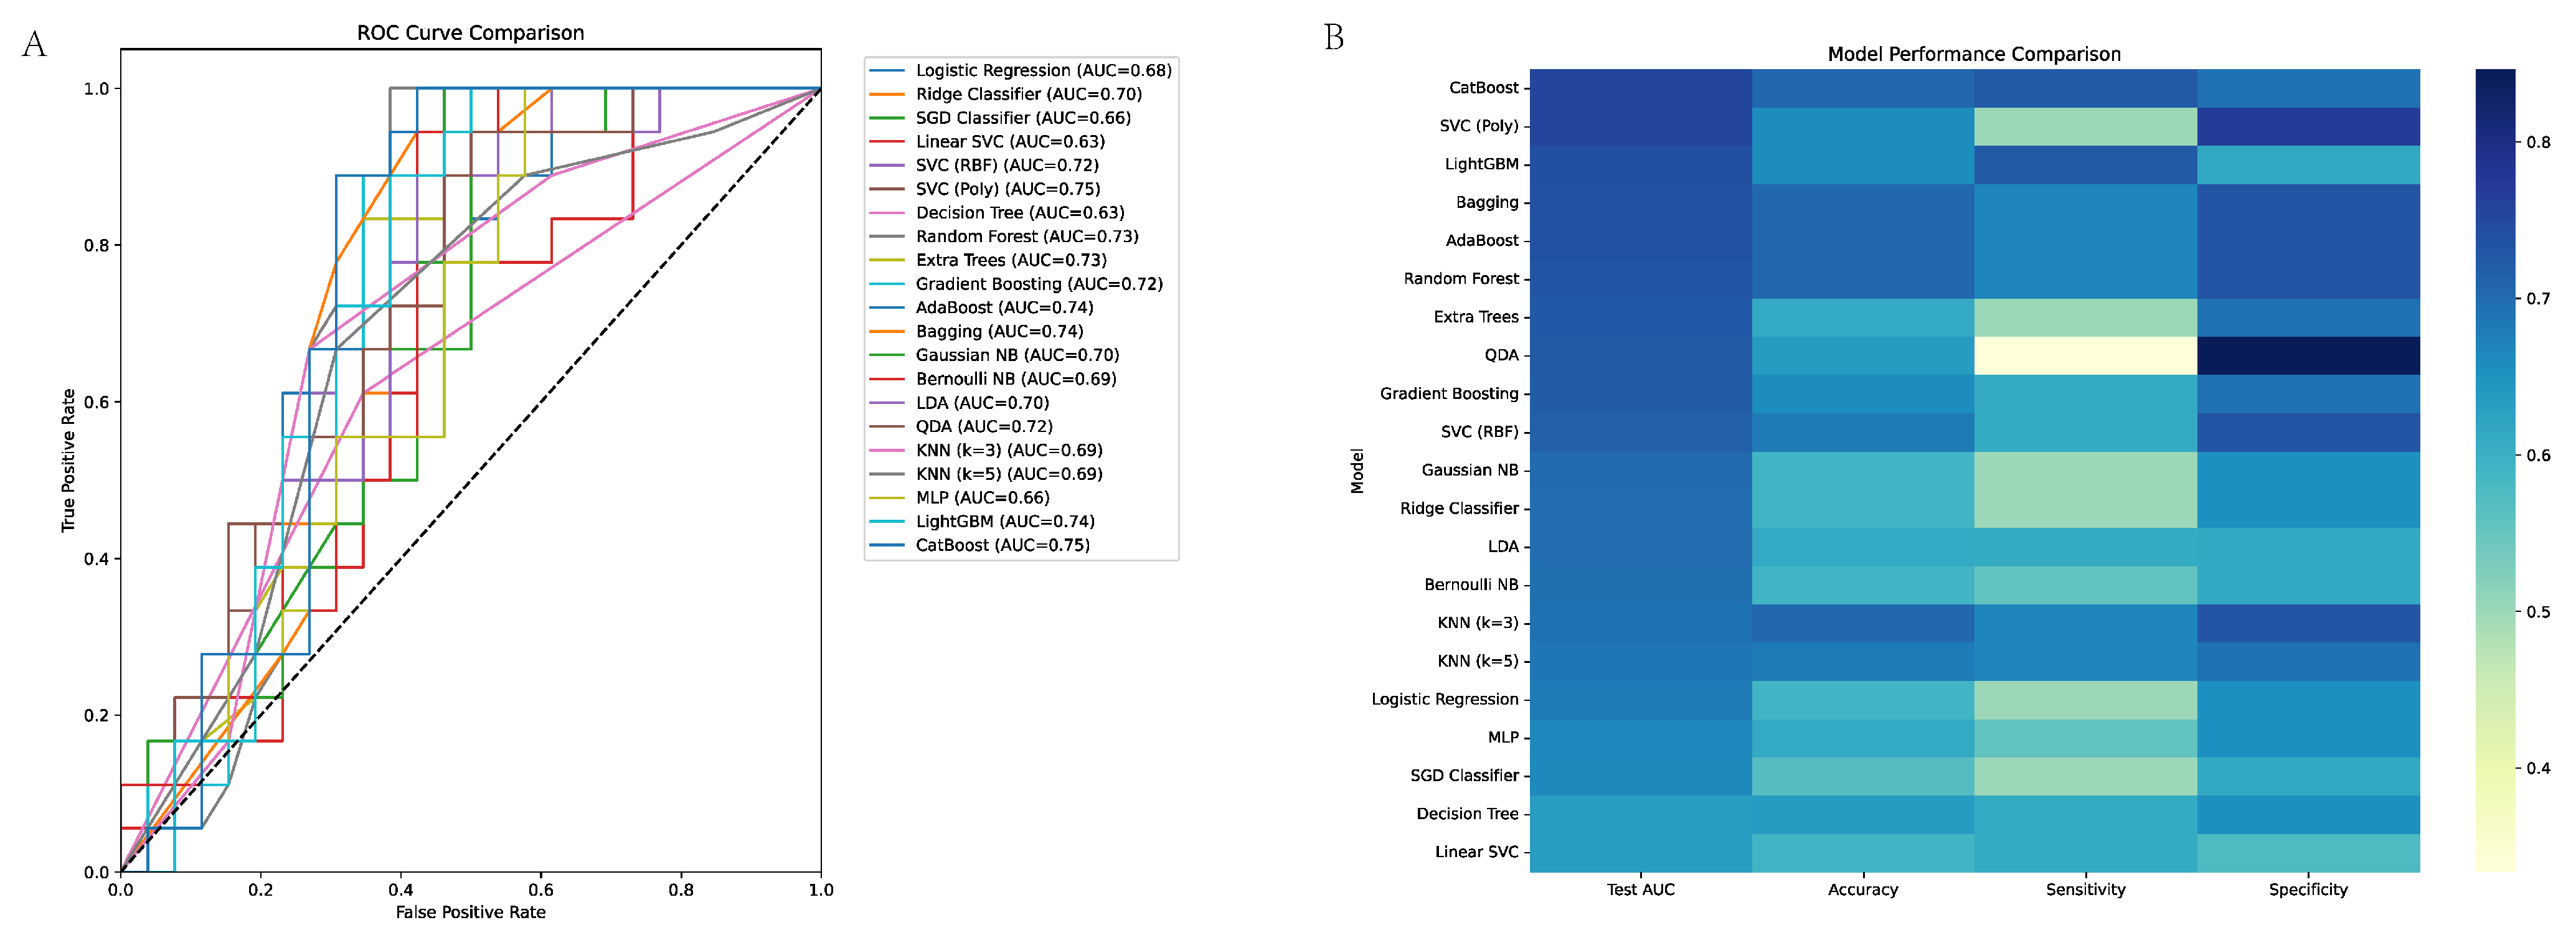
3.3. Machine Learning Model Performance in EGC Discrimination
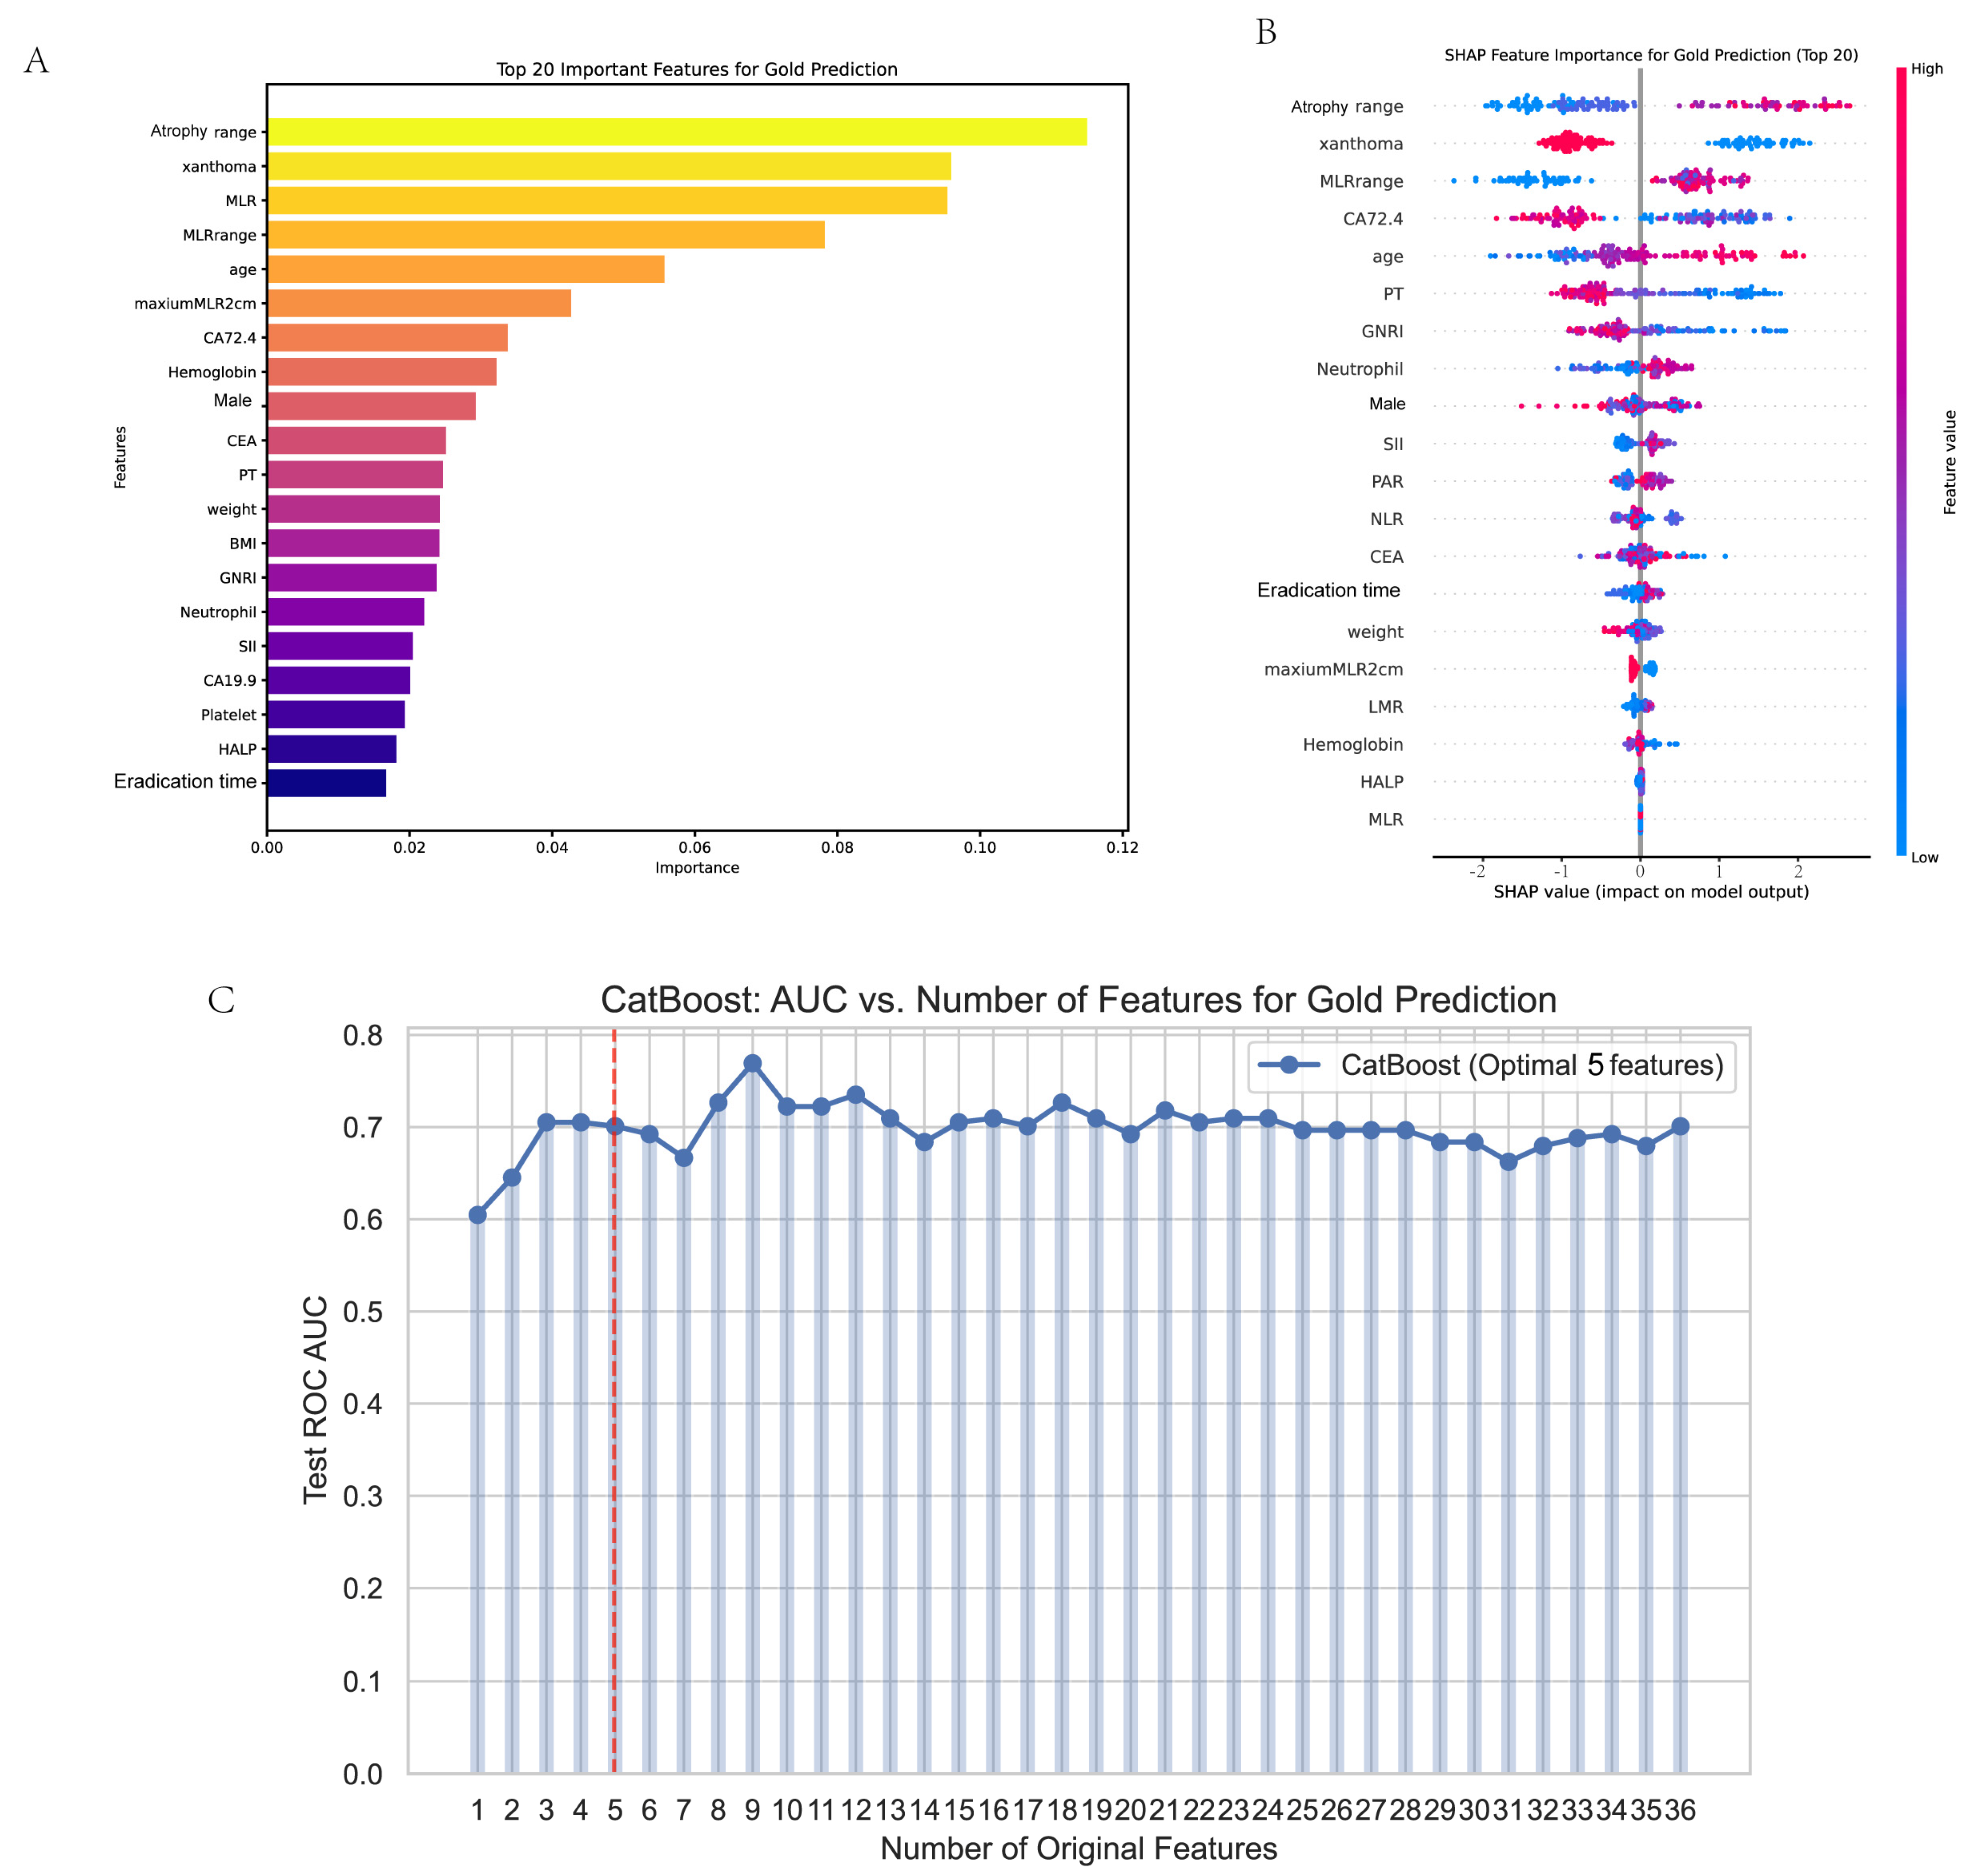
3.4. Feature Selection
3.5. ROC
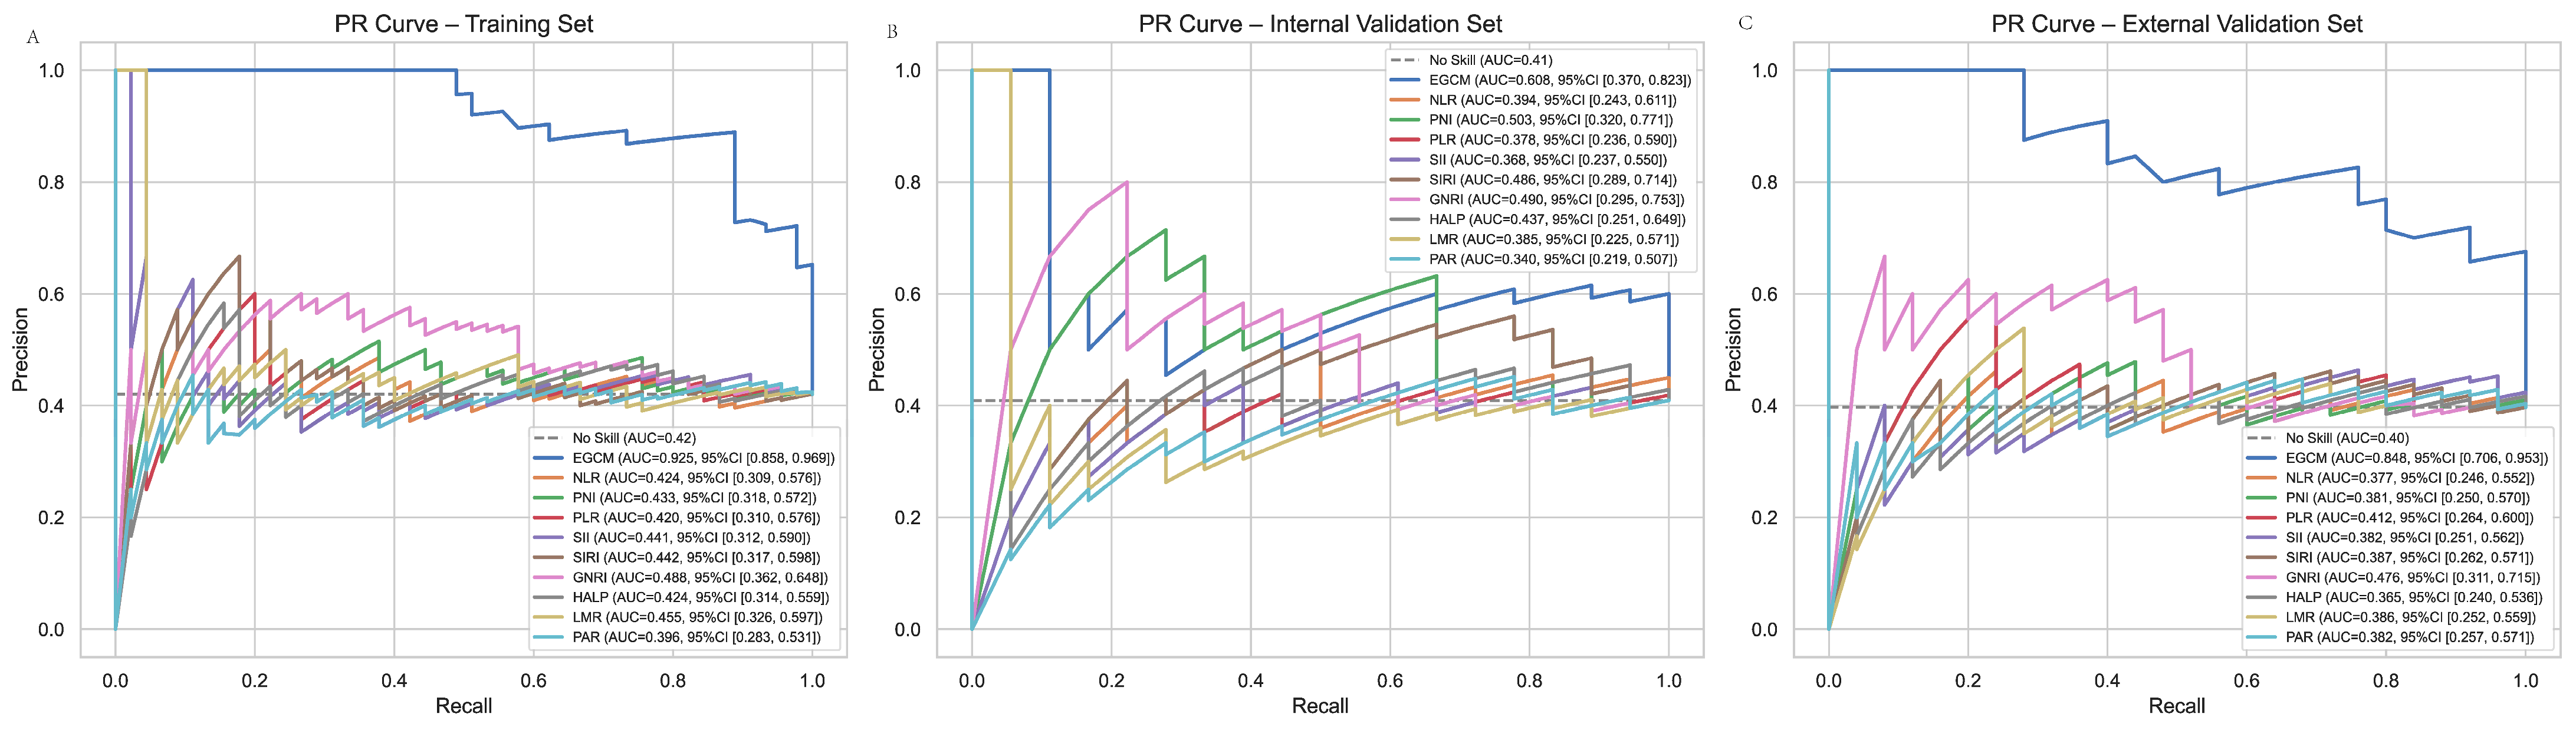
3.6. PR Curve
3.7. Calibration Curve
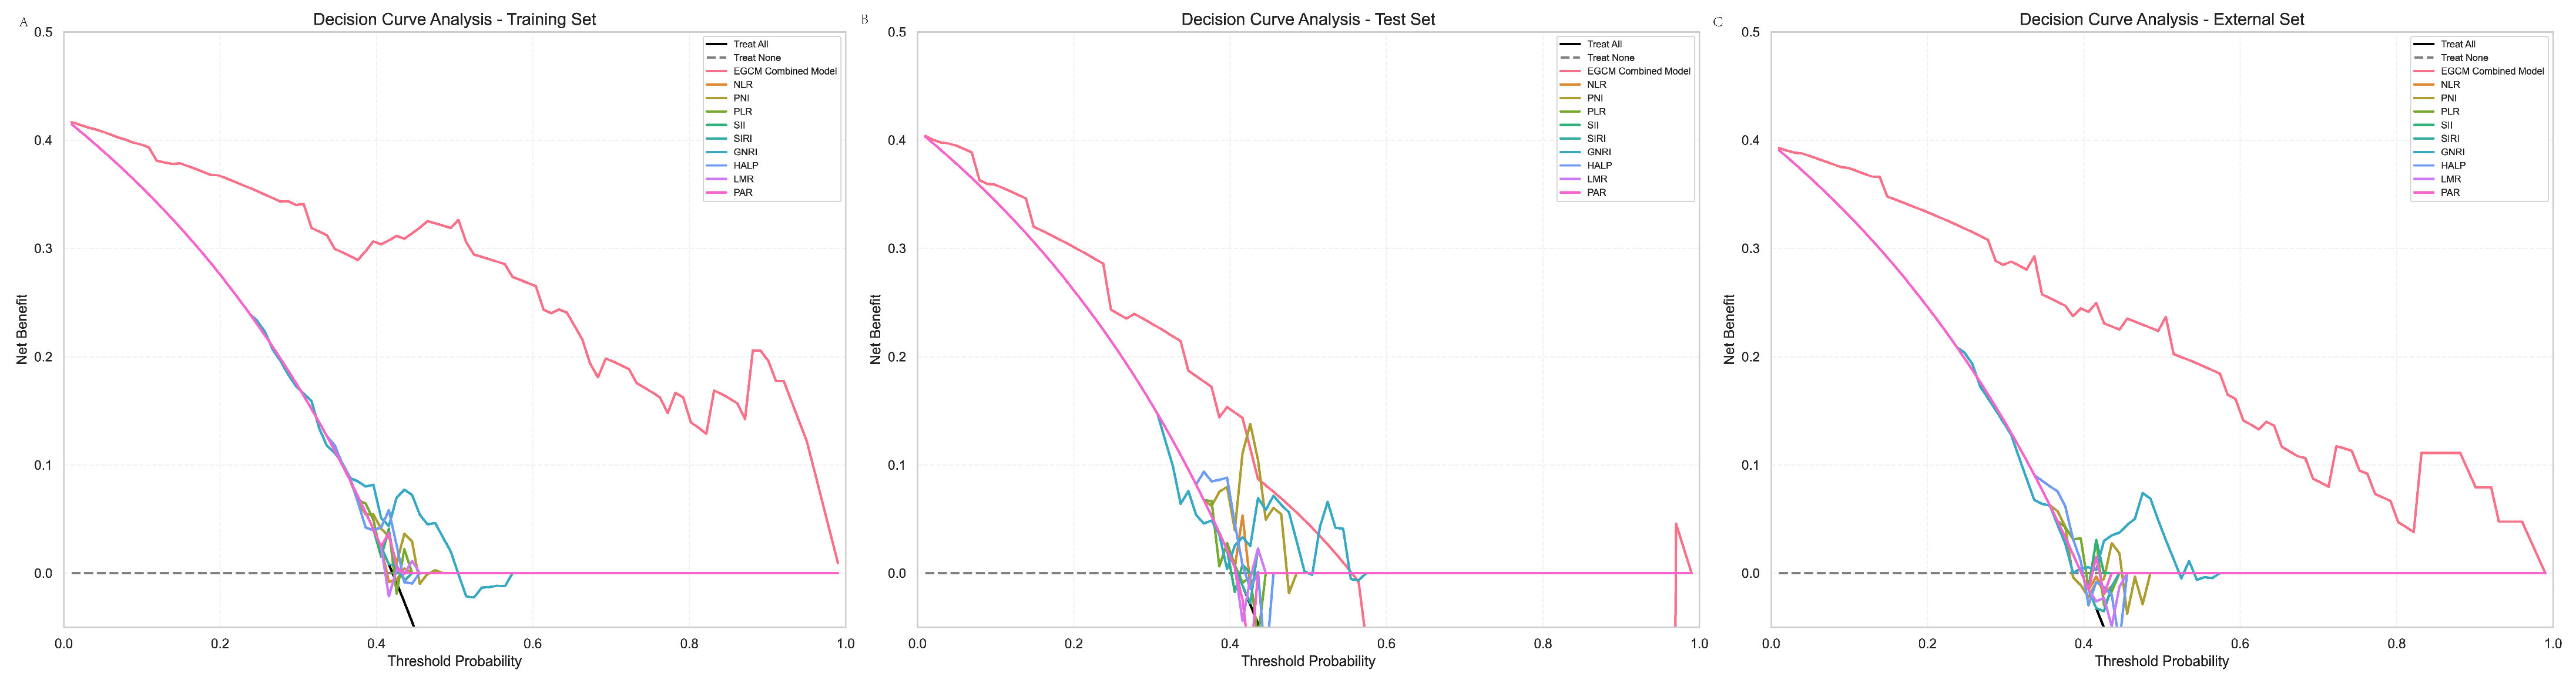
3.8. DCA
3.9. Presentation of Various Predictive Scenarios
3.10. Web Calculate
4. Discussion
5. Limitations
6. Future Directions
7. Conclusions
Author Contributions
Funding
Institutional Review Board Statement
Informed Consent Statement
Data Availability Statement
Acknowledgments
Conflicts of Interest
References
- Xia, J.Y.; Aadam, A.A. Advances in screening and detection of gastric cancer. J. Surg. Oncol. 2022, 125, 1104–1109. [Google Scholar] [CrossRef] [PubMed]
- Sundar, R.; Nakayama, I.; Markar, S.R.; Shitara, K.; van Laarhoven, H.W.M.; Janjigian, Y.Y.; Smyth, E.C. Gastric cancer. Lancet 2025, 405, 2087–2102. [Google Scholar] [CrossRef] [PubMed]
- Tan, N.; Wu, H.; Cao, M.; Yang, F.; Yan, X.; He, S.; Cao, M.; Zhang, S.; Teng, Y.; Li, Q.; et al. Global, regional, and national burden of early-onset gastric cancer. Cancer Biol. Med. 2024, 21, 667–678. [Google Scholar] [CrossRef]
- Mousavi, S.E.; Ilaghi, M.; Elahi Vahed, I.; Nejadghaderi, S.A. Epidemiology and socioeconomic correlates of gastric cancer in Asia: Results from the GLOBOCAN 2020 data and projections from 2020 to 2040. Sci. Rep. 2025, 15, 6529. [Google Scholar] [CrossRef] [PubMed]
- Fu, X.Y.; Mao, X.L.; Chen, Y.H.; You, N.N.; Song, Y.Q.; Zhang, L.H.; Cai, Y.; Ye, X.N.; Ye, L.P.; Li, S.W. The Feasibility of Applying Artificial Intelligence to Gastrointestinal Endoscopy to Improve the Detection Rate of Early Gastric Cancer Screening. Front. Med. 2022, 9, 886853. [Google Scholar] [CrossRef]
- Bao, Z.; Jia, N.; Zhang, Z.; Hou, C.; Yao, B.; Li, Y. Prospects for the application of pathological response rate in neoadjuvant therapy for gastric cancer. Front. Oncol. 2025, 15, 1528529. [Google Scholar] [CrossRef]
- Chivu, R.F.; Bobirca, F.; Melesteu, I.; Patrascu, T. The Role of Helicobacter Pylori Infection in the Development of Gastric Cancer—Review of the Literature. Chirurgia 2024, 119, 1–10. [Google Scholar] [CrossRef]
- Wu, Z.; Tang, Y.; Tang, M.; Wu, Z.; Xu, Y. The relationship between the eradication of Helicobacter pylori and the occurrence of stomach cancer: An updated meta-analysis and systemic review. BMC Gastroenterol. 2025, 25, 278. [Google Scholar] [CrossRef]
- Iwata, E.; Sugimoto, M.; Akimoto, Y.; Hamada, M.; Niikura, R.; Nagata, N.; Yanagisawa, K.; Itoi, T.; Kawai, T. Long-term endoscopic gastric mucosal changes up to 20 years after Helicobacter pylori eradication therapy. Sci. Rep. 2024, 14, 13003. [Google Scholar] [CrossRef]
- Mizukami, K.; Kodama, M.; Hirashita, Y.; Fukuda, M.; Ozaka, S.; Tsutsumi, K.; Sagami, R.; Fukuda, K.; Ogawa, R.; Murakami, K. Predictors of the Development of Gastric Cancer in Post-Helicobacter pylori-Eradication Patients Followed Up for More than 10 Years: A Histological, Serological, and Endoscopic Study. Cancers 2025, 17, 552. [Google Scholar] [CrossRef]
- Hara, D.; Okamura, T.; Iwaya, Y.; Nagaya, T.; Ota, H.; Umemura, T. Histopathologically defined intestinal metaplasia in lesser curvature of corpus prior to Helicobacter pylori eradication is a risk factor for gastric cancer development. Helicobacter 2022, 27, e12934. [Google Scholar] [CrossRef]
- Matsumoto, S.; Sugimoto, M.; Terai, T.; Maruyama, Y.; Sahara, S.; Kanaoka, S.; Yoshizawa, Y.; Unno, S.; Murata, M.; Uotani, T.; et al. Map-Like Redness Development After Eradication Therapy for Helicobacter pylori Infection: Prospective Multicenter Observational Study. Helicobacter 2024, 29, e13146. [Google Scholar] [CrossRef] [PubMed]
- Park, B.; Kim, C.H.; Jun, J.K.; Suh, M.; Choi, K.S.; Choi, I.J.; Oh, H.J. A Machine Learning Risk Prediction Model for Gastric Cancer with SHapley Additive exPlanations. Cancer Res. Treat. 2024; epub ahead of print. [Google Scholar] [CrossRef]
- Afrash, M.R.; Mirbagheri, E.; Mashoufi, M.; Kazemi-Arpanahi, H. Optimizing prognostic factors of five-year survival in gastric cancer patients using feature selection techniques with machine learning algorithms: A comparative study. BMC Med. Inform. Decis. Mak. 2023, 23, 54. [Google Scholar] [CrossRef]
- Prijovic, N.; Acimovic, M.; Santric, V.; Stankovic, B.; Nikic, P.; Vukovic, I.; Soldatovic, I.; Nale, D.; Kovacevic, L.; Nale, P.; et al. Predictive Value of Inflammatory and Nutritional Indexes in the Pathology of Bladder Cancer Patients Treated with Radical Cystectomy. Curr. Oncol. 2023, 30, 2582–2597. [Google Scholar] [CrossRef]
- Demir Cendek, B.; Bayraktar, B.; Sapmaz, M.A.; Yildirim, A.E.; Can Ibanoglu, M.; Engin Ustun, Y. The Role of Inflammatory and Nutritional Indices in Postmenopausal Osteoporosis: A Retrospective Study. J. Clin. Med. 2024, 13, 7741. [Google Scholar] [CrossRef] [PubMed]
- Adachi, K.; Kishi, K.; Sakamoto, U.; Ishimura, N.; Ishihara, S. Degree of Gastric Mucosal Atrophy Correlated Well with Gastric Cancer Occurrence in Patients with Helicobacter pylori-eradicated Status. Intern. Med. 2023, 62, 1389–1394. [Google Scholar] [CrossRef] [PubMed]
- Kuraoka, S.; Kawano, S.; Ino, S.; Satomi, T.; Hamada, K.; Kono, Y.; Iwamuro, M.; Kawahara, Y.; Tanaka, T.; Okada, H.; et al. Characteristics of Early Gastric Cancer in a Patient with a History of Helicobacter pylori Infection and No History of Eradication Therapy. Intern. Med. 2025, 64, 343–350. [Google Scholar] [CrossRef]
- Matsumoto, S.; Sugimoto, M.; Fukuzawa, M.; Uesugi, N.; Iwata, E.; Kagawa, Y.; Madarame, A.; Koyama, Y.; Morise, T.; Uchida, K.; et al. Risk of map-like redness development after eradication therapy for Helicobacter pylori infection. Helicobacter 2024, 29, e13046. [Google Scholar] [CrossRef]
- Tahara, T.; Horiguchi, N.; Yamada, H.; Terada, T.; Yoshida, D.; Okubo, M.; Funasaka, K.; Nakagawa, Y.; Shibata, T.; Ohmiya, N. Clinical, Pathological and Endoscopic Features of Neoplastic or Non-neoplastic Reddish Depressed Lesions after Helicobacter pylori Eradication. J. Gastrointest. Liver Dis. 2024, 33, 164–169. [Google Scholar] [CrossRef]
- Shen, W.N.; Qu, X.D.; Chen, S.S.; Liu, Y.H.; Gao, M.J.; Shi, Y.Q. Relationship between gastric xanthoma, gastric precancerous lesions, and gastric cancer: A retrospective study. J. Dig. Dis. 2023, 24, 340–347. [Google Scholar] [CrossRef]
- Gao, M.J.; Li, S.B.; Zhu, X.J.; Zhang, L.F.; Chen, M.; Shi, Y.Q. Analysis of Risk Factors for Gastric Cancer and Precancerous Lesions: A Case-Control Study. J. Dig. Dis. 2024, 25, 674–684. [Google Scholar] [CrossRef]
- Feng, L.; Zhang, M.; Guan, J.; Zhang, Y.; Huang, Y.; Dong, R.; Zhao, K.; Xia, S.; Xiao, F.; Liao, J. Gastric xanthelasma is a warning sign for Helicobacter pylori infection, atrophic gastritis, and intestinal metaplasia. Front. Med. 2023, 10, 1252346. [Google Scholar] [CrossRef] [PubMed]
- Wei, Y.; Min, C.; Zhao, C.; Li, Y.; Wang, X.; Jing, X.; Yu, Y.; Li, X.; Yin, X. Endoscopic characteristics and high-risk background mucosa factors of early gastric cancer after helicobacter pylori eradication: A single-center retrospective study. Front. Oncol. 2023, 13, 1272187. [Google Scholar] [CrossRef]
- Matsushima, R.; Matsushima, S.; Kobayashi, M.; Fujimori, K.; Sakamoto, N.; Asaka, M. An increasing trend of gastric cancer deaths and inadequate preventive measures in elderly adults. Helicobacter 2023, 28, e12988. [Google Scholar] [CrossRef] [PubMed]
- Jung, Y.S.; Tran, M.T.X.; Park, B.; Moon, C.M. Preventive effect of Helicobacter pylori treatment on gastric cancer incidence and mortality: A Korean population study. Gastroenterology, 2025; in press. [Google Scholar] [CrossRef] [PubMed]
- Lin, X.M.; Wang, L.; Xi, C.H.; Wang, J.; Wang, X.F.; Wang, Q.; Yuan, C. Morphometric features of gastric mucosa in atrophic gastritis: A different pattern between corpus and antrum. Medicine 2023, 102, e33480. [Google Scholar] [CrossRef]
- Luo, X.; Qi, S.; Chen, M.; Gan, T.; Lv, X.; Yang, J.; Deng, K. Maintaining, H. pylori Negativity After Eradication Can Consolidate Its Benefit in Gastric Cancer Prevention: A Meta-Analysis. Clin. Transl. Gastroenterol. 2024, 15, e00742. [Google Scholar] [CrossRef]
- Xu, J.; Song, C.; Wen, J.; Deng, W.; Wang, X.; Li, S.; Su, J.; Shen, W. Effects of different treatments on the prognosis of patients with single-organ oligometastasis of esophageal cancer after surgery-a retrospective single center study. Front. Oncol. 2025, 15, 1504410. [Google Scholar] [CrossRef]
- He, J.Y.; Cao, M.X.; Li, E.Z.; Hu, C.; Zhang, Y.Q.; Zhang, R.L.; Cheng, X.D.; Xu, Z.Y. Development and validation of a nomogram for predicting lymph node metastasis in early gastric cancer. World J. Gastrointest. Oncol. 2024, 16, 2960–2970. [Google Scholar] [CrossRef]
- Yuan, Z.N.; Xue, Y.J.; Wang, H.J.; Qu, S.N.; Huang, C.L.; Wang, H.; Zhang, H.; Zhang, M.Z.; Xing, X.Z. A predictive model for hospital death in cancer patients with acute pulmonary embolism using XGBoost machine learning and SHAP interpretation. Sci. Rep. 2025, 15, 18268. [Google Scholar] [CrossRef] [PubMed]
- Li, J.; Cui, T.; Huang, Z.; Mu, Y.; Yao, Y.; Xu, W.; Chen, K.; Liu, H.; Wang, W.; Chen, X. Analysis of risk factors for lymph node metastasis and prognosis study in patients with early gastric cancer: A SEER data-based study. Front. Oncol. 2023, 13, 1062142. [Google Scholar] [CrossRef] [PubMed]
- Kotelevets, S.M. Global strategy for prevention of gastric cancer. World J. Clin. Cases 2024, 12, 6353–6357. [Google Scholar] [CrossRef] [PubMed]
- Ren, L.; Liu, J.; Xu, Y.Y.; Shi, Z.W. Serum pro-inflammatory cytokines as potential biomarkers for the diagnosis of gastric carcinoma. World J. Clin. Oncol. 2025, 16, 107551. [Google Scholar] [CrossRef]
- Huang, Y.; Lu, X.; Wang, Y.; Zhang, Y.; Cen, M. Increasing miR-1260b predicts the risk of gastric cancer in atrophic gastritis patients and regulates cell growth and metastasis of gastric cancer. Rev. Esp. Enferm. Dig. 2025, 117, 327–335. [Google Scholar] [CrossRef]


| Variable | Total | Internal Train | Internal Test | External Test | p_Value |
|---|---|---|---|---|---|
| No early gastric carcinoma | 126 (58.9%) | 62 (57.9%) | 26 (59.1%) | 38 (60.3%) | 0.95 |
| Early gastric carcinoma | 88 (41.1%) | 45 (42.1%) | 18 (40.9%) | 25 (39.7%) | |
| Female | 49 (22.9%) | 23 (21.5%) | 14 (31.8%) | 12 (19%) | 0.27 |
| Male | 165 (77.1%) | 84 (78.5%) | 30 (68.2%) | 51 (81%) | |
| nonMLR | 82 (38.3%) | 38 (35.5%) | 18 (40.9%) | 26 (41.3%) | 0.7 |
| MLR | 132 (61.7%) | 69 (64.5%) | 26 (59.1%) | 37 (58.7%) | |
| MLR < 2 cm | 136 (63.6%) | 67 (62.6%) | 29 (65.9%) | 40 (63.5%) | 0.93 |
| MLR > 2 cm | 78 (36.4%) | 40 (37.4%) | 15 (34.1%) | 23 (36.5%) | |
| no xanthoma | 139 (65%) | 67 (62.6%) | 27 (61.4%) | 45 (71.4%) | 0.43 |
| xanthoma | 75 (35%) | 40 (37.4%) | 17 (38.6%) | 18 (28.6%) | |
| no RE | 171 (80.3%) | 84 (78.5%) | 37 (86%) | 50 (79.4%) | 0.56 |
| RE | 42 (19.7%) | 23 (21.5%) | 6 (14%) | 13 (20.6%) | |
| Family history (no) | 191 (89.3%) | 93 (86.9%) | 39 (88.6%) | 59 (93.7%) | 0.42 |
| Family history (yes) | 23 (10.7%) | 14 (13.1%) | 5 (11.4%) | 4 (6.3%) | |
| smoke (no) | 124 (57.9%) | 63 (58.9%) | 24 (54.5%) | 37 (58.7%) | 0.88 |
| smoke (yes) | 90 (42.1%) | 44 (41.1%) | 20 (45.5%) | 26 (41.3%) | |
| drink (no) | 120 (56.1%) | 59 (55.1%) | 30 (68.2%) | 31 (49.2%) | 0.14 |
| drink (yes) | 94 (43.9%) | 48 (44.9%) | 14 (31.8%) | 32 (50.8%) | |
| age (year) | 62 [56, 69] | 62 [55.5, 69] | 63 [56, 68.25] | 62 [56.5, 68.5] | 0.95 |
| height (cm) | 166.03 ± 9.03 | 166.32 ± 9.71 | 165.52 ± 8.52 | 165.9 ± 8.25 | 0.88 |
| weight (kg) | 68 [60, 80] | 68 [62, 80] | 65 [57.75, 80] | 70 [61.5, 79.5] | 0.6 |
| BMI | 24.8 [21.42, 28.6] | 24.6 [21.55, 29.35] | 24.95 [20.7, 28.23] | 24.9 [21.55, 28.6] | 0.83 |
| Neutrophil (109/L) | 4.88 [2.8, 6.42] | 4.34 [2.82, 5.94] | 5.53 [2.85, 7.04] | 5.02 [2.77, 6.05] | 0.23 |
| lymphocyte (109/L) | 2.27 [1.46, 3.27] | 2.34 [1.6, 3.35] | 2.16 [1.27, 3.06] | 2.21 [1.46, 3.24] | 0.62 |
| NLR | 2.03 [1.4, 2.95] | 1.94 [1.23, 2.83] | 2.32 [1.79, 3.87] | 2.01 [1.51, 2.88] | 0.09 |
| Platelet (109/L) | 196 [145, 247] | 196 [145, 246] | 169 [134.75, 247.25] | 216 [145, 251] | 0.56 |
| PLR | 87.41 [61.49, 124.76] | 83.71 [61.79, 117.78] | 85.83 [56.13, 142.39] | 89.5 [64.01, 137.42] | 0.81 |
| Hemoglobin (g/L) | 132 [115, 149] | 132 [114.5, 149] | 128 [115, 145.25] | 132 [118, 151.5] | 0.69 |
| Albumin (g/L) | 49 [41, 54] | 49 [41, 54] | 49 [42, 56] | 49 [40, 55] | 0.96 |
| HALP | 67.67 [45.78, 106.16] | 67.67 [49.19, 107.32] | 71.62 [43.77, 109.77] | 63.27 [48, 99.69] | 0.86 |
| LMR | 4.9 [2.98, 8.75] | 4.86 [2.98, 8.38] | 5.35 [3.22, 9.95] | 4.61 [2.91, 8.49] | 0.96 |
| PAR | 4.05 [3.12, 5.02] | 4.05 [3.11, 5.05] | 3.94 [2.84, 4.83] | 4.14 [3.24, 5.06] | 0.43 |
| CEA (ng/mL) Normal range [0–5] | 2.6 [1.34, 3.93] | 2.6 [1.35, 3.88] | 2.75 [1.64, 4.36] | 2.39 [1.24, 3.77] | 0.33 |
| CA19.9 (IU/mL) Normal range [0–37] | 20.14 [10.62, 32.17] | 19.7 [9.51, 30.84] | 18.8 [10.88, 30.24] | 20.9 [13.14, 32.67] | 0.49 |
| CA72.4 (IU/mL) Normal range [0–6.7] | 3.49 [1.64, 5.09] | 3.18 [1.53, 5.04] | 3.55 [1.93, 4.79] | 3.55 [1.79, 5.4] | 0.73 |
| PT (s) | 11.8 [10.9, 13] | 12 [11.1, 13] | 11.85 [10.9, 13] | 11.6 [10.7, 12.6] | 0.23 |
| AMC (109/L) | 0.5 [0.28, 0.64] | 0.52 [0.29, 0.68] | 0.42 [0.26, 0.69] | 0.5 [0.29, 0.62] | 0.8 |
| RDW | 13.3 [12.4, 14.1] | 13.4 [12.4, 14.2] | 13 [12.38, 14.03] | 13.4 [12.4, 14.1] | 0.7 |
| PNI | 49.01 [41.01, 54.02] | 49.01 [41.01, 54.01] | 49.01 [42.01, 56.01] | 49.01 [40.01, 55.01] | 0.96 |
| SII | 421.94 [225.28, 581.1] | 370.66 [202.62, 551.35] | 447.04 [272.48, 687.91] | 447.36 [241.9, 597.76] | 0.38 |
| SIRI | 0.92 [0.41, 1.53] | 0.94 [0.38, 1.38] | 0.85 [0.5, 1.67] | 0.91 [0.44, 1.53] | 0.86 |
| GNRI | 119.35 ± 15.61 | 119.66 ± 15.18 | 118.57 ± 15.53 | 119.37 ± 16.59 | 0.93 |
| Atrophy range | 3 [2, 4] | 3 [2, 4] | 3 [2.75, 4] | 3 [2, 3.5] | 0.21 |
| MLRrange | 2 [0, 3] | 2 [0, 3] | 2 [0, 3] | 2 [0, 3] | 0.51 |
| Eradication time (year) | 3 [2, 7] | 3 [1, 6.5] | 3 [2, 6] | 3 [1.5, 7] | 0.78 |
| Variable | Overall | No Early Gastric Cancer | Early Gastric Cancer | Statistic | p_Value |
|---|---|---|---|---|---|
| Female | 23 (21.5%) | 18 (29%) | 5 (11.1%) | 3.96 | 0.047 |
| Male | 84 (78.5%) | 44 (71%) | 40 (88.9%) | ||
| nonMLR | 38 (35.5%) | 37 (59.7%) | 1 (2.2%) | 35.12 | <0.001 |
| MLR | 69 (64.5%) | 25 (40.3%) | 44 (97.8%) | ||
| MLR < 2 cm | 67 (62.6%) | 48 (77.4%) | 19 (42.2%) | 12.34 | <0.001 |
| MLR > 2 cm | 40 (37.4%) | 14 (22.6%) | 26 (57.8%) | ||
| no xanthoma | 67 (62.6%) | 52 (83.9%) | 15 (33.3%) | 26.33 | <0.001 |
| xanthoma | 40 (37.4%) | 10 (16.1%) | 30 (66.7%) | ||
| no RE | 84 (78.5%) | 52 (83.9%) | 32 (71.1%) | 1.82 | 0.178 |
| RE | 23 (21.5%) | 10 (16.1%) | 13 (28.9%) | ||
| Family history (no) | 93 (86.9%) | 56 (90.3%) | 37 (82.2%) | 0.88 | 0.349 |
| Family history (yes) | 14 (13.1%) | 6 (9.7%) | 8 (17.8%) | ||
| smoke (no) | 63 (58.9%) | 39 (62.9%) | 24 (53.3%) | 0.63 | 0.427 |
| smoke (yes) | 44 (41.1%) | 23 (37.1%) | 21 (46.7%) | ||
| drink (no) | 59 (55.1%) | 31 (50%) | 28 (62.2%) | 1.12 | 0.29 |
| drink (yes) | 48 (44.9%) | 31 (50%) | 17 (37.8%) | ||
| age (year) | 60.91 ± 10.59 | 56.69 ± 10.48 | 66.71 ± 7.64 | −5.45 | <0.001 |
| height (cm) | 166.32 ± 9.71 | 166.16 ± 9.74 | 166.53 ± 9.76 | −0.19 | 0.846 |
| weight (kg) | 70.8 ± 13.53 | 72.6 ± 14.21 | 68.33 ± 12.25 | 1624.5 | 0.148 |
| BMI | 25.76 ± 5.46 | 26.42 ± 5.54 | 24.85 ± 5.28 | 1614.5 | 0.167 |
| Neutrophil (109/L) | 4.53 ± 1.9 | 4.52 ± 1.94 | 4.56 ± 1.86 | 1367.5 | 0.865 |
| lymphocyte (109/L) | 2.41 ± 0.97 | 2.4 ± 0.97 | 2.43 ± 0.98 | 1353.5 | 0.796 |
| NLR | 2.28 ± 1.59 | 2.26 ± 1.59 | 2.3 ± 1.59 | 1386 | 0.957 |
| Platelet (109/L) | 198.56 ± 58.29 | 200.11 ± 60.19 | 196.42 ± 56.15 | 1427.5 | 0.84 |
| PLR | 98.14 ± 53.25 | 99.52 ± 54.76 | 96.22 ± 51.64 | 1414 | 0.907 |
| Hemoglobin (g/L) | 130.76 ± 20.63 | 133.26 ± 20.87 | 127.31 ± 20.02 | 1631 | 0.137 |
| Albumin (g/L) | 48.19 ± 7.44 | 48.65 ± 7.47 | 47.56 ± 7.43 | 1507.5 | 0.479 |
| HALP | 84.34 ± 51.67 | 86.52 ± 53.25 | 81.34 ± 49.84 | 1465 | 0.661 |
| LMR | 7.65 ± 7.86 | 7.54 ± 7.7 | 7.8 ± 8.16 | 1354.5 | 0.801 |
| PAR | 4.21 ± 1.41 | 4.23 ± 1.5 | 4.2 ± 1.28 | 0.09 | 0.93 |
| CEA (ng/mL) Normal range [0–5] | 2.64 ± 1.45 | 2.48 ± 1.41 | 2.86 ± 1.48 | 1167 | 0.151 |
| CA19.9 (IU/mL) Normal range [0–37] | 20.38 ± 11.61 | 20.75 ± 11.36 | 19.86 ± 12.04 | 1454 | 0.712 |
| CA72.4 (IU/mL) Normal range [0–6.7] | 3.35 ± 2.11 | 3.65 ± 2.08 | 3.77 ± 1.92 | 65.5 | 0.081 |
| PT (s) | 12.01 ± 1.12 | 12.15 ± 1.12 | 11.81 ± 1.12 | 1639 | 0.124 |
| AMC (109/L) | 0.49 ± 0.24 | 0.49 ± 0.24 | 0.49 ± 0.25 | 1405 | 0.952 |
| RDW | 13.24 ± 1.14 | 13.33 ± 1.17 | 13.13 ± 1.09 | 1543.5 | 0.35 |
| PNI | 48.2 ± 7.44 | 48.66 ± 7.48 | 47.57 ± 7.43 | 1510 | 0.47 |
| SII | 443.9 ± 313.54 | 445.89 ± 298.81 | 441.17 ± 336.22 | 1413 | 0.912 |
| SIRI | 1.07 ± 0.88 | 1.07 ± 0.92 | 1.08 ± 0.82 | 1370 | 0.877 |
| GNRI | 119.66 ± 15.18 | 121.57 ± 15.31 | 117.04 ± 14.76 | 1.54 | 0.128 |
| Atrophy range | 3.27 ± 1.32 | 2.53 ± 0.86 | 4.29 ± 1.16 | 342.5 | <0.001 |
| MLRrange | 1.82 ± 1.58 | 1.02 ± 1.29 | 2.93 ± 1.23 | 438 | <0.001 |
| Eradication time (year) | 4.02 ± 3.13 | 3.55 ± 3.07 | 4.67 ± 3.13 | 1097.5 | 0.057 |
| Model | Test AUC | PR AUC | Accuracy | Sensitivity | Specificity | PPV | NPV |
|---|---|---|---|---|---|---|---|
| CatBoost | 0.754 | 0.539 | 0.704 | 0.722 | 0.692 | 0.619 | 0.782 |
| SVC (Poly) | 0.754 | 0.569 | 0.659 | 0.5 | 0.769 | 0.6 | 0.689 |
| LightGBM | 0.741 | 0.534 | 0.659 | 0.722 | 0.615 | 0.565 | 0.761 |
| Bagging | 0.739 | 0.616 | 0.704 | 0.666 | 0.730 | 0.631 | 0.76 |
| AdaBoost | 0.737 | 0.619 | 0.704 | 0.666 | 0.730 | 0.631 | 0.76 |
| Random Forest | 0.731 | 0.508 | 0.704 | 0.666 | 0.730 | 0.631 | 0.76 |
| Extra Trees | 0.725 | 0.527 | 0.613 | 0.5 | 0.692 | 0.529 | 0.666 |
| QDA | 0.722 | 0.588 | 0.636 | 0.333 | 0.846 | 0.6 | 0.647 |
| Gradient Boosting | 0.720 | 0.518 | 0.659 | 0.611 | 0.692 | 0.578 | 0.72 |
| SVC (RBF) | 0.715 | 0.523 | 0.681 | 0.611 | 0.730 | 0.611 | 0.730 |
| Gaussian NB | 0.700 | 0.582 | 0.590 | 0.5 | 0.653 | 0.5 | 0.653 |
| Ridge Classifier | 0.698 | 0.502 | 0.590 | 0.5 | 0.653 | 0.5 | 0.653 |
| LDA | 0.698 | 0.502 | 0.613 | 0.611 | 0.615 | 0.523 | 0.695 |
| Bernoulli NB | 0.694 | 0.567 | 0.590 | 0.555 | 0.615 | 0.5 | 0.666 |
| KNN (k = 3) | 0.693 | 0.560 | 0.704 | 0.666 | 0.730 | 0.631 | 0.76 |
| KNN (k = 5) | 0.686 | 0.540 | 0.681 | 0.666 | 0.692 | 0.6 | 0.75 |
| Logistic Regression | 0.681 | 0.539 | 0.590 | 0.5 | 0.653 | 0.5 | 0.653 |
| MLP | 0.664 | 0.479 | 0.613 | 0.555 | 0.653 | 0.526 | 0.68 |
| SGD Classifier | 0.662 | 0.613 | 0.568 | 0.5 | 0.615 | 0.473 | 0.64 |
| Decision Tree | 0.632 | 0.660 | 0.636 | 0.611 | 0.653 | 0.55 | 0.708 |
| Linear SVC | 0.632 | 0.512 | 0.590 | 0.611 | 0.576 | 0.5 | 0.681 |
| Dataset | Model | AUC | AUC 95% CI Lower | AUC 95% CI Upper | Sensitivity | Specificity | PPV | NPV | Accuracy |
|---|---|---|---|---|---|---|---|---|---|
| Internal training | EGCM | 0.943 | 0.900 | 0.987 | 0.888 | 0.919 | 0.888 | 0.919 | 0.906 |
| NLR | 0.503 | 0.408 | 0.597 | 0 | 1 | 0 | 0.579 | 0.579 | |
| PNI | 0.541 | 0.446 | 0.635 | 0 | 1 | 0 | 0.579 | 0.579 | |
| PLR | 0.506 | 0.412 | 0.601 | 0 | 1 | 0 | 0.579 | 0.579 | |
| SII | 0.506 | 0.411 | 0.601 | 0 | 1 | 0 | 0.579 | 0.579 | |
| SIRI | 0.508 | 0.414 | 0.603 | 0 | 1 | 0 | 0.579 | 0.579 | |
| GNRI | 0.597 | 0.504 | 0.690 | 0.155 | 0.887 | 0.5 | 0.591 | 0.579 | |
| HALP | 0.525 | 0.430 | 0.619 | 0 | 1 | 0 | 0.579 | 0.579 | |
| LMR | 0.514 | 0.419 | 0.609 | 0 | 1 | 0 | 0.579 | 0.579 | |
| PAR | 0.486 | 0.391 | 0.580 | 0 | 1 | 0 | 0.579 | 0.579 | |
| Internal Test | EGCM | 0.743 | 0.614 | 0.872 | 0.555 | 0.692 | 0.555 | 0.692 | 0.636 |
| NLR | 0.521 | 0.373 | 0.668 | 0 | 1 | 0 | 0.590 | 0.590 | |
| PNI | 0.626 | 0.483 | 0.769 | 0 | 1 | 0 | 0.590 | 0.590 | |
| PLR | 0.478 | 0.331 | 0.626 | 0 | 1 | 0 | 0.590 | 0.590 | |
| SII | 0.472 | 0.324 | 0.619 | 0 | 1 | 0 | 0.590 | 0.590 | |
| SIRI | 0.613 | 0.469 | 0.757 | 0 | 1 | 0 | 0.590 | 0.590 | |
| GNRI | 0.559 | 0.413 | 0.706 | 0.222 | 0.846 | 0.5 | 0.611 | 0.590 | |
| HALP | 0.529 | 0.382 | 0.677 | 0 | 1 | 0 | 0.590 | 0.590 | |
| LMR | 0.401 | 0.256 | 0.546 | 0 | 1 | 0 | 0.590 | 0.590 | |
| PAR | 0.427 | 0.281 | 0.573 | 0 | 1 | 0 | 0.590 | 0.590 | |
| External Test | EGCM | 0.905 | 0.832 | 0.977 | 0.76 | 0.894 | 0.826 | 0.85 | 0.841 |
| NLR | 0.5 | 0.376 | 0.623 | 0 | 1 | 0 | 0.603 | 0.603 | |
| PNI | 0.502 | 0.378 | 0.625 | 0 | 1 | 0 | 0.603 | 0.603 | |
| PLR | 0.543 | 0.420 | 0.666 | 0 | 1 | 0 | 0.603 | 0.603 | |
| SII | 0.530 | 0.407 | 0.653 | 0 | 1 | 0 | 0.603 | 0.603 | |
| SIRI | 0.528 | 0.405 | 0.651 | 0 | 1 | 0 | 0.603 | 0.603 | |
| GNRI | 0.57 | 0.447 | 0.692 | 0.28 | 0.868 | 0.583 | 0.647 | 0.634 | |
| HALP | 0.486 | 0.362 | 0.609 | 0 | 1 | 0 | 0.603 | 0.603 | |
| LMR | 0.516 | 0.393 | 0.640 | 0 | 1 | 0 | 0.603 | 0.603 | |
| PAR | 0.517 | 0.393 | 0.640 | 0 | 1 | 0 | 0.603 | 0.603 |
| Model | Brier_Train | HL_p_Train | Brier_Test | HL_p_Test | Brier_External | HL_p_External |
|---|---|---|---|---|---|---|
| EGCM | 0.001 | 0.999 | 0.002 | 0.261 | 0.038 | 0.285 |
| NLR | 0.025 | 0.580 | 0.125 | <0.001 | 0.118 | <0.001 |
| PNI | 0.019 | 0.679 | 0.254 | <0.001 | 0.124 | <0.001 |
| PLR | 0.039 | 0.318 | 0.185 | <0.001 | 0.119 | <0.001 |
| SII | 0.027 | 0.500 | 0.325 | <0.001 | 0.113 | <0.001 |
| SIRI | 0.042 | 0.208 | 0.410 | <0.001 | 0.124 | <0.001 |
| GNRI | 0.060 | 0.071 | 0.318 | <0.001 | 0.117 | <0.001 |
| HALP | 0.026 | 0.574 | 0.408 | <0.001 | 0.116 | <0.001 |
| LMR | 0.020 | 0.724 | 0.461 | <0.001 | 0.123 | <0.001 |
| PAR | 0.067 | 0.133 | 0.303 | <0.001 | 0.126 | <0.001 |
| Dataset | Model | NRI | NRI_p | IDI | IDI_p | Event_NRI | Nonevent_NRI | Event_IDI | Nonevent_IDI |
|---|---|---|---|---|---|---|---|---|---|
| Internal training | NLR | −0.808 | 0 | −0.593 | 0 | −0.888 | 0.0806 | −0.343 | −0.249 |
| PNI | −0.808 | 0 | −0.588 | 0 | −0.888 | 0.0806 | −0.340 | −0.247 | |
| PLR | −0.808 | 0 | −0.592 | 0 | −0.888 | 0.0806 | −0.343 | −0.249 | |
| SII | −0.808 | 0 | −0.593 | 0 | −0.888 | 0.0806 | −0.343 | −0.249 | |
| SIRI | −0.808 | 0 | −0.593 | 0 | −0.888 | 0.0806 | −0.343 | −0.249 | |
| GNRI | −0.765 | 0 | −0.571 | 0 | −0.733 | −0.032 | −0.331 | −0.240 | |
| HALP | −0.808 | 0 | −0.590 | 0 | −0.888 | 0.0806 | −0.342 | −0.248 | |
| LMR | −0.808 | 0 | −0.592 | 0 | −0.888 | 0.0806 | −0.343 | −0.249 | |
| PAR | −0.808 | 0 | −0.593 | 0 | −0.888 | 0.0806 | −0.343 | −0.249 | |
| Internal test | NLR | −0.247 | 0.0768 | −0.262 | 0.0082 | −0.555 | 0.3077 | −0.144 | −0.117 |
| PNI | −0.247 | 0.0768 | −0.245 | 0.0171 | −0.555 | 0.3077 | −0.136 | −0.109 | |
| PLR | −0.247 | 0.0768 | −0.263 | 0.0082 | −0.555 | 0.3077 | −0.149 | −0.114 | |
| SII | −0.247 | 0.0768 | −0.263 | 0.0079 | −0.555 | 0.3077 | −0.147 | −0.115 | |
| SIRI | −0.247 | 0.0768 | −0.261 | 0.0083 | −0.555 | 0.3077 | −0.145 | −0.116 | |
| GNRI | −0.179 | 0.0881 | −0.243 | 0.0251 | −0.333 | 0.1538 | −0.130 | −0.113 | |
| HALP | −0.247 | 0.0768 | −0.257 | 0.0097 | −0.555 | 0.3077 | −0.143 | −0.113 | |
| LMR | −0.247 | 0.0768 | −0.263 | 0.0079 | −0.555 | 0.3077 | −0.147 | −0.116 | |
| PAR | −0.247 | 0.0768 | −0.263 | 0.0077 | −0.555 | 0.3077 | −0.146 | −0.117 | |
| External test | NLR | −0.654 | 0 | −0.480 | 0 | −0.76 | 0.1053 | −0.231 | −0.249 |
| PNI | −0.654 | 0 | −0.479 | 0 | −0.76 | 0.1053 | −0.228 | −0.250 | |
| PLR | −0.654 | 0 | −0.477 | 0 | −0.76 | 0.1053 | −0.231 | −0.246 | |
| SII | −0.654 | 0 | −0.479 | 0 | −0.76 | 0.1053 | −0.231 | −0.248 | |
| SIRI | −0.654 | 0 | −0.480 | 0 | −0.76 | 0.1053 | −0.231 | −0.249 | |
| GNRI | −0.506 | 0 | −0.460 | 0 | −0.48 | −0.026 | −0.217 | −0.242 | |
| HALP | −0.654 | 0 | −0.478 | 0 | −0.76 | 0.1053 | −0.228 | −0.250 | |
| LMR | −0.654 | 0 | −0.482 | 0 | −0.76 | 0.1053 | −0.232 | −0.249 | |
| PAR | −0.654 | 0 | −0.479 | 0 | −0.76 | 0.1053 | −0.231 | −0.248 |
Disclaimer/Publisher’s Note: The statements, opinions and data contained in all publications are solely those of the individual author(s) and contributor(s) and not of MDPI and/or the editor(s). MDPI and/or the editor(s) disclaim responsibility for any injury to people or property resulting from any ideas, methods, instructions or products referred to in the content. |
© 2025 by the authors. Licensee MDPI, Basel, Switzerland. This article is an open access article distributed under the terms and conditions of the Creative Commons Attribution (CC BY) license (https://creativecommons.org/licenses/by/4.0/).
Share and Cite
Lin, W.; Zhang, G.; Chen, H.; Huang, W.; Xu, G.; Zheng, Y.; Gao, C.; Zheng, J.; Li, D.; Wang, W. Development and Validation of the Early Gastric Carcinoma Prediction Model in Post-Eradication Patients with Intestinal Metaplasia. Cancers 2025, 17, 2158. https://doi.org/10.3390/cancers17132158
Lin W, Zhang G, Chen H, Huang W, Xu G, Zheng Y, Gao C, Zheng J, Li D, Wang W. Development and Validation of the Early Gastric Carcinoma Prediction Model in Post-Eradication Patients with Intestinal Metaplasia. Cancers. 2025; 17(13):2158. https://doi.org/10.3390/cancers17132158
Chicago/Turabian StyleLin, Wulian, Guanpo Zhang, Hong Chen, Weidong Huang, Guilin Xu, Yunmeng Zheng, Chao Gao, Jin Zheng, Dazhou Li, and Wen Wang. 2025. "Development and Validation of the Early Gastric Carcinoma Prediction Model in Post-Eradication Patients with Intestinal Metaplasia" Cancers 17, no. 13: 2158. https://doi.org/10.3390/cancers17132158
APA StyleLin, W., Zhang, G., Chen, H., Huang, W., Xu, G., Zheng, Y., Gao, C., Zheng, J., Li, D., & Wang, W. (2025). Development and Validation of the Early Gastric Carcinoma Prediction Model in Post-Eradication Patients with Intestinal Metaplasia. Cancers, 17(13), 2158. https://doi.org/10.3390/cancers17132158