1. Introduction
Gastric carcinoma is a significant global health concern, with various etiological factors contributing to its development. Among these, Epstein–Barr virus (EBV) infection has been identified as a key factor in a subset of gastric cancers, referred to as EBV-associated gastric carcinoma (EBVaGC) [
1]. EBVaGC exhibits distinct molecular and clinical features, including unique immune evasion mechanisms and altered signaling pathways. Epstein–Barr virus is a ubiquitous herpesvirus that infects over 90% of the world’s population and establishes a lifelong latent infection within the host [
2]. EBV is primarily transmitted through saliva and typically infects B lymphocytes and epithelial cells. Infected cells can harbor the virus in a latent state, during which the viral genome persists as an episome within the nucleus of the host cell, expressing a limited set of viral proteins that contribute to oncogenesis and immune evasion [
3]. The latency-associated proteins, including EBV nuclear antigen 1 (EBNA1), latent membrane proteins (LMPs), and Epstein–Barr-encoded small RNAs (EBERs), are crucial for maintaining viral persistence and promoting cell proliferation [
4].
A notable feature of EBVaGC is the expression of
EBNA1, which is critical for the maintenance of the viral genome within infected cells. EBNA1 is known for its strong antigenicity, which can elicit immune responses, although the virus employs various strategies to evade immune detection [
5]. Androgens, including dihydrotestosterone (DHT), play crucial roles in various physiological processes and have been implicated in the regulation of immune responses [
6]. Androgen signaling occurs through the androgen receptor (AR), a type of nuclear receptor that, upon binding to androgens, translocates to the nucleus and influences gene expression [
7]. The AR-DHT signaling pathway is pivotal in numerous biological processes, including the development and maintenance of male characteristics, the regulation of libido, and the modulation of muscle mass and bone density [
8]. Additionally, AR-DHT signaling has been shown to influence cell proliferation, differentiation, and apoptosis, thereby playing a significant role in various cancers, including prostate [
9] and gastric cancers.
Recent studies have suggested that DHT can modulate immune function by influencing signaling pathways within target cells, including the NF-κB pathway [
10,
11]. NF-κB is a key regulator of immune and inflammatory responses, controlling the expression of various genes involved in immune responses, cell proliferation, and survival [
10]. This makes NF-κB a critical player in cancer progression and immune system interactions.
In this study, we investigate the effect of DHT on the expression of MHC class I-related chain A (
MICA) in SNU719 cells, a human gastric cancer cell line derived from EBV-associated gastric carcinoma. MICA is a stress-induced ligand that is recognized by the NKG2D receptor on natural killer (NK) and CD8
+ T cells [
12]. NKG2D is an activating receptor that plays a crucial role in the immune system’s ability to detect and eliminate stressed, transformed, or infected cells [
13]. The interaction between MICA and NKG2D triggers the cytotoxic activity of these immune cells, enhancing their ability to target and destroy tumor cells.
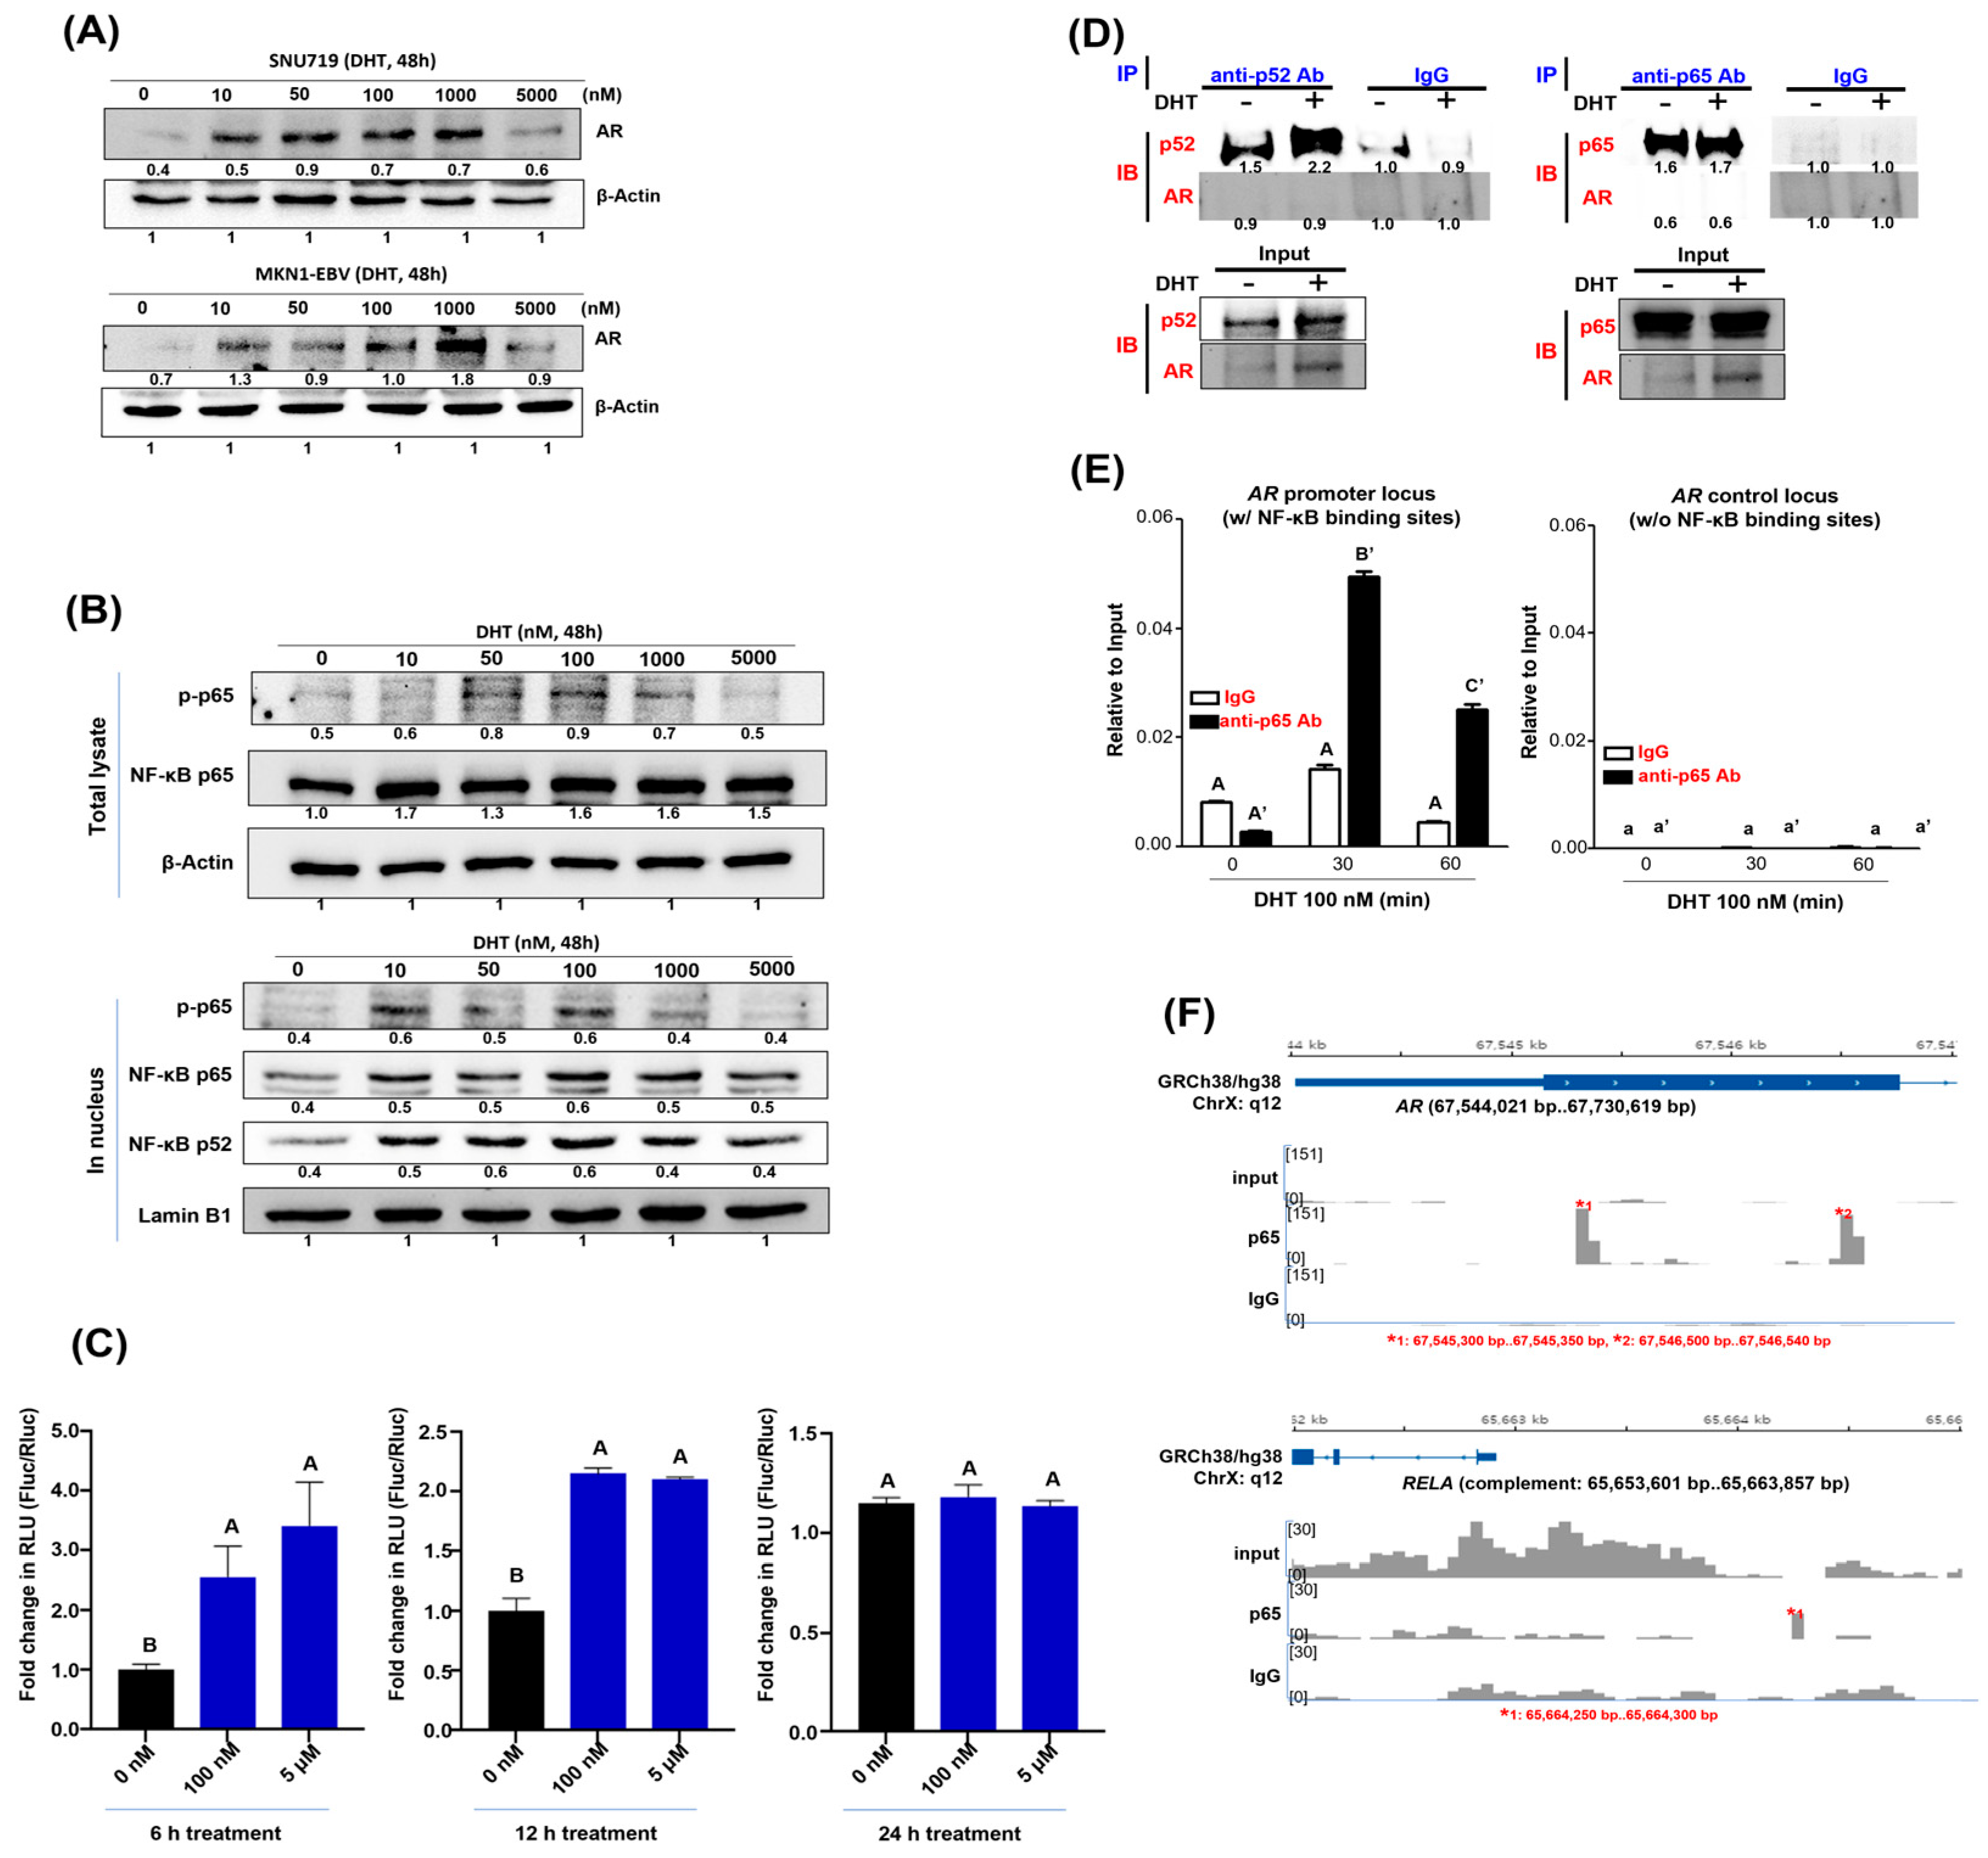
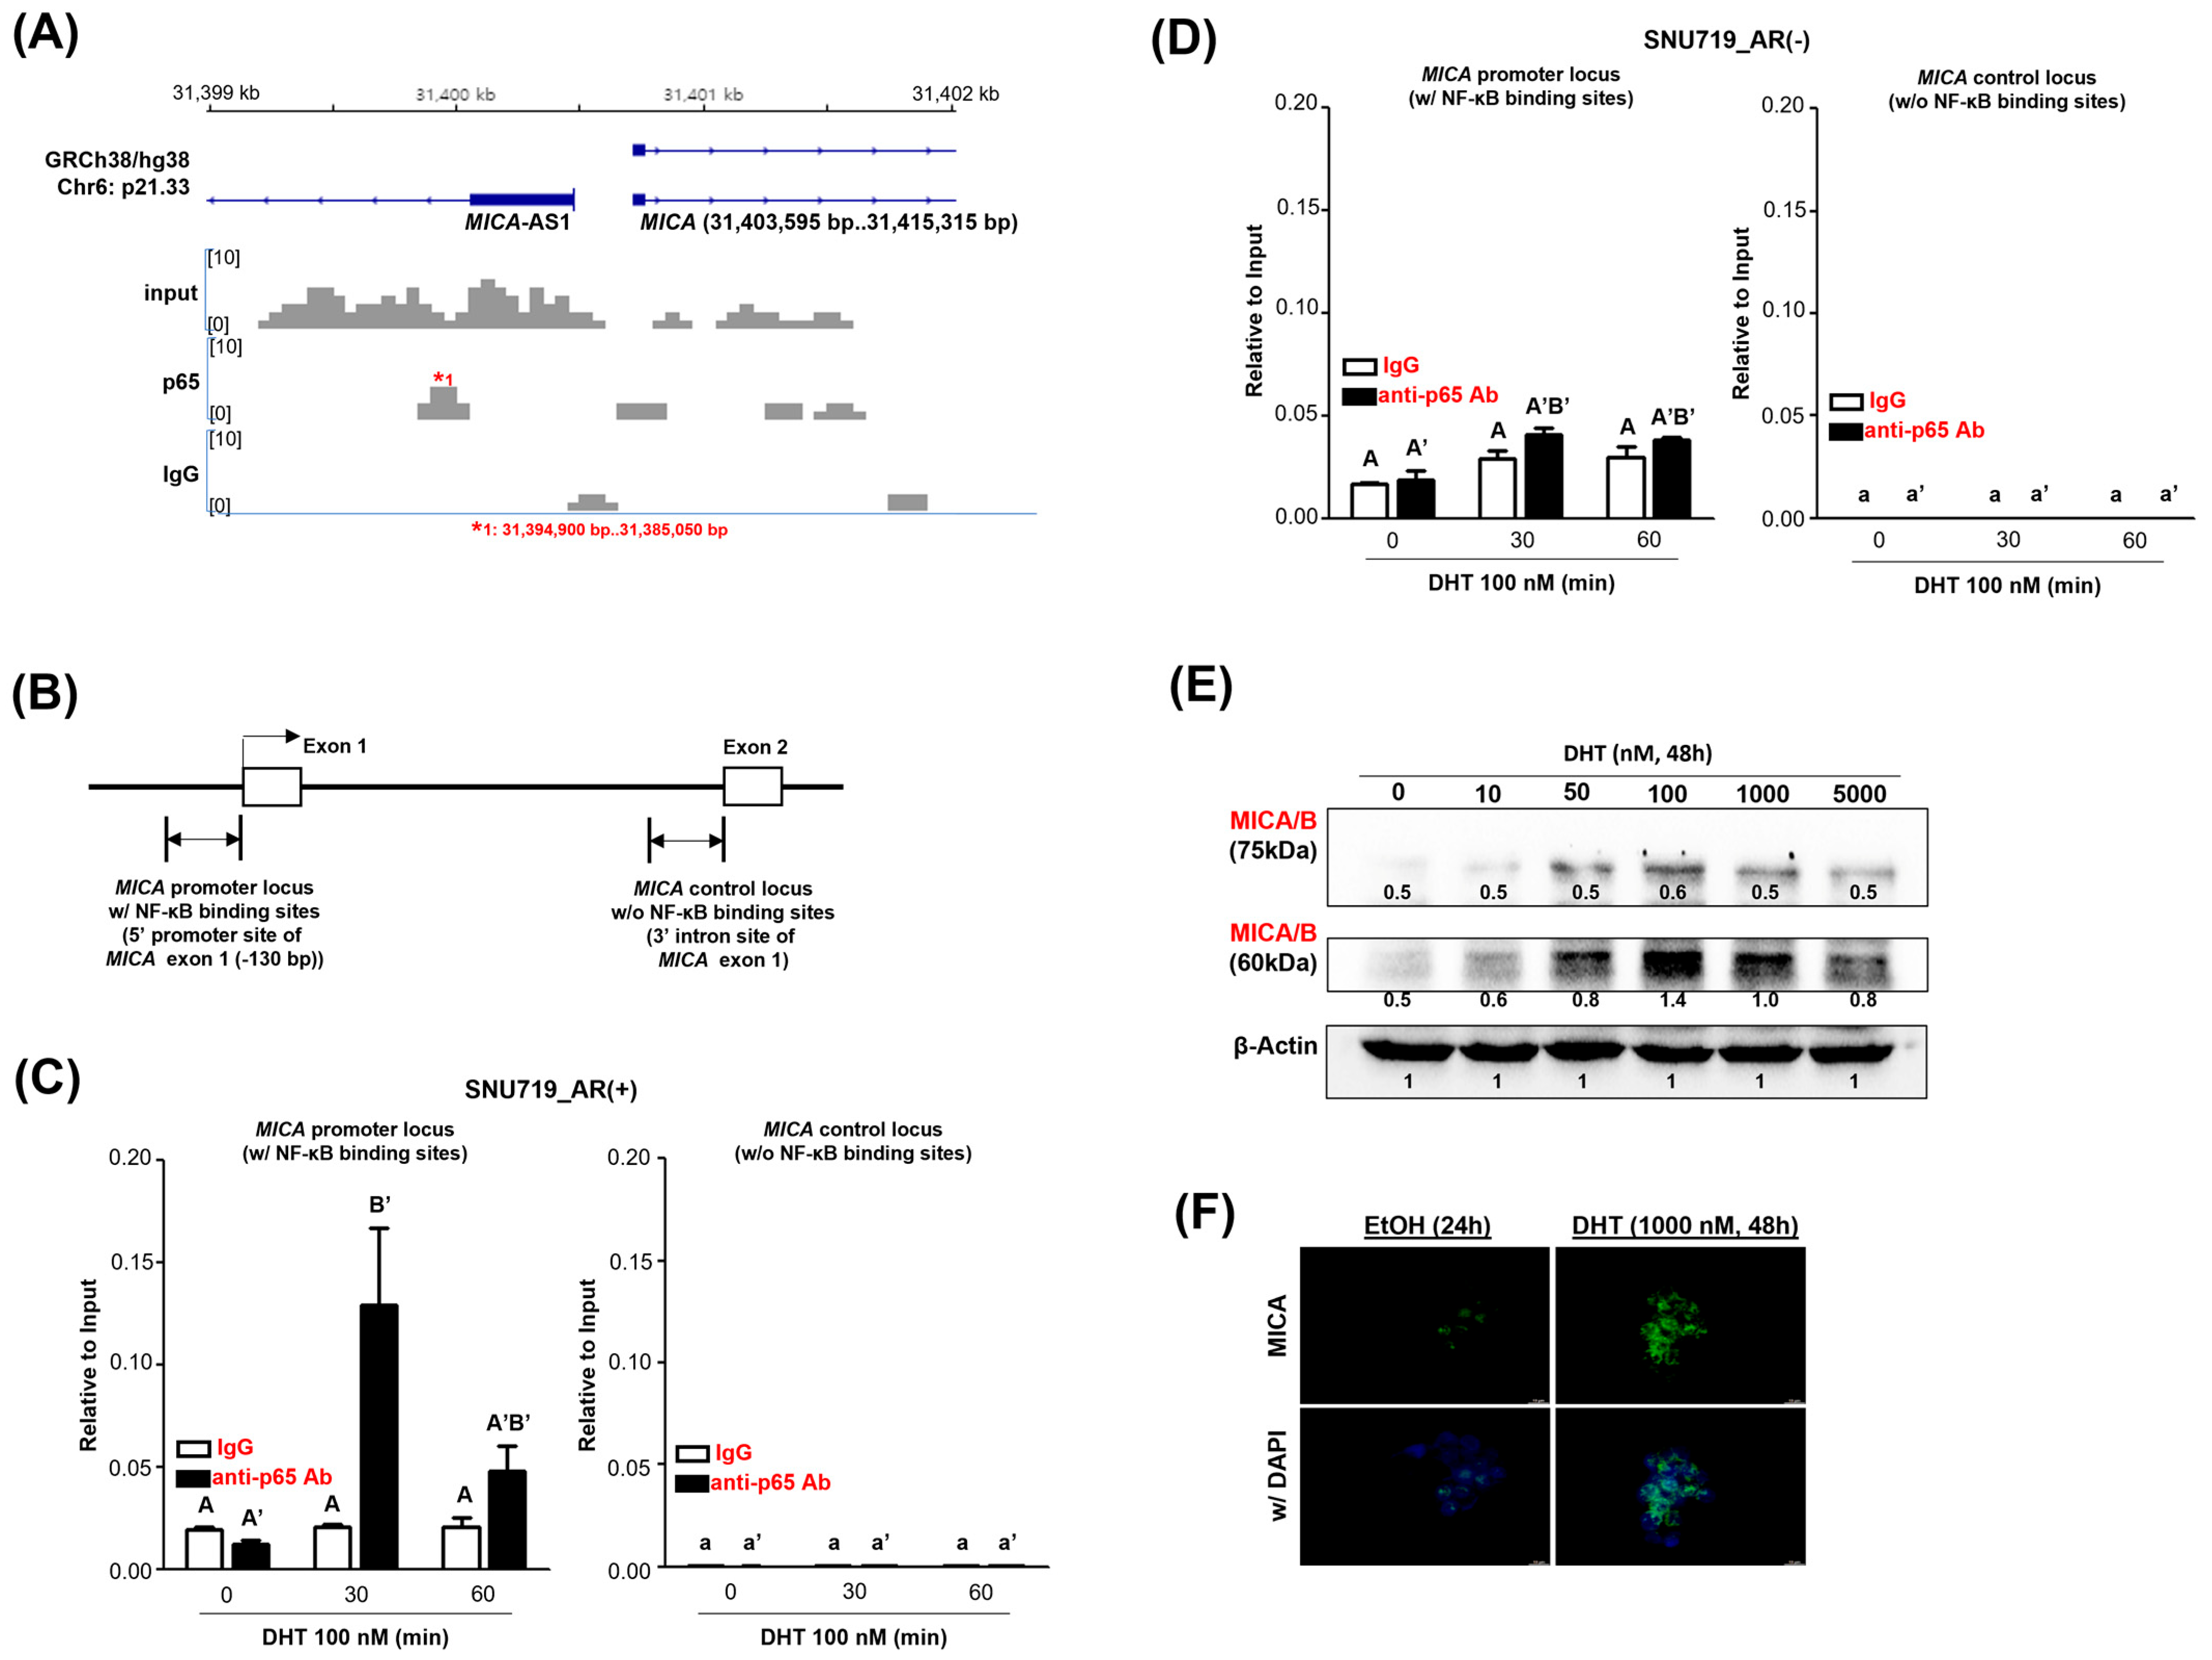
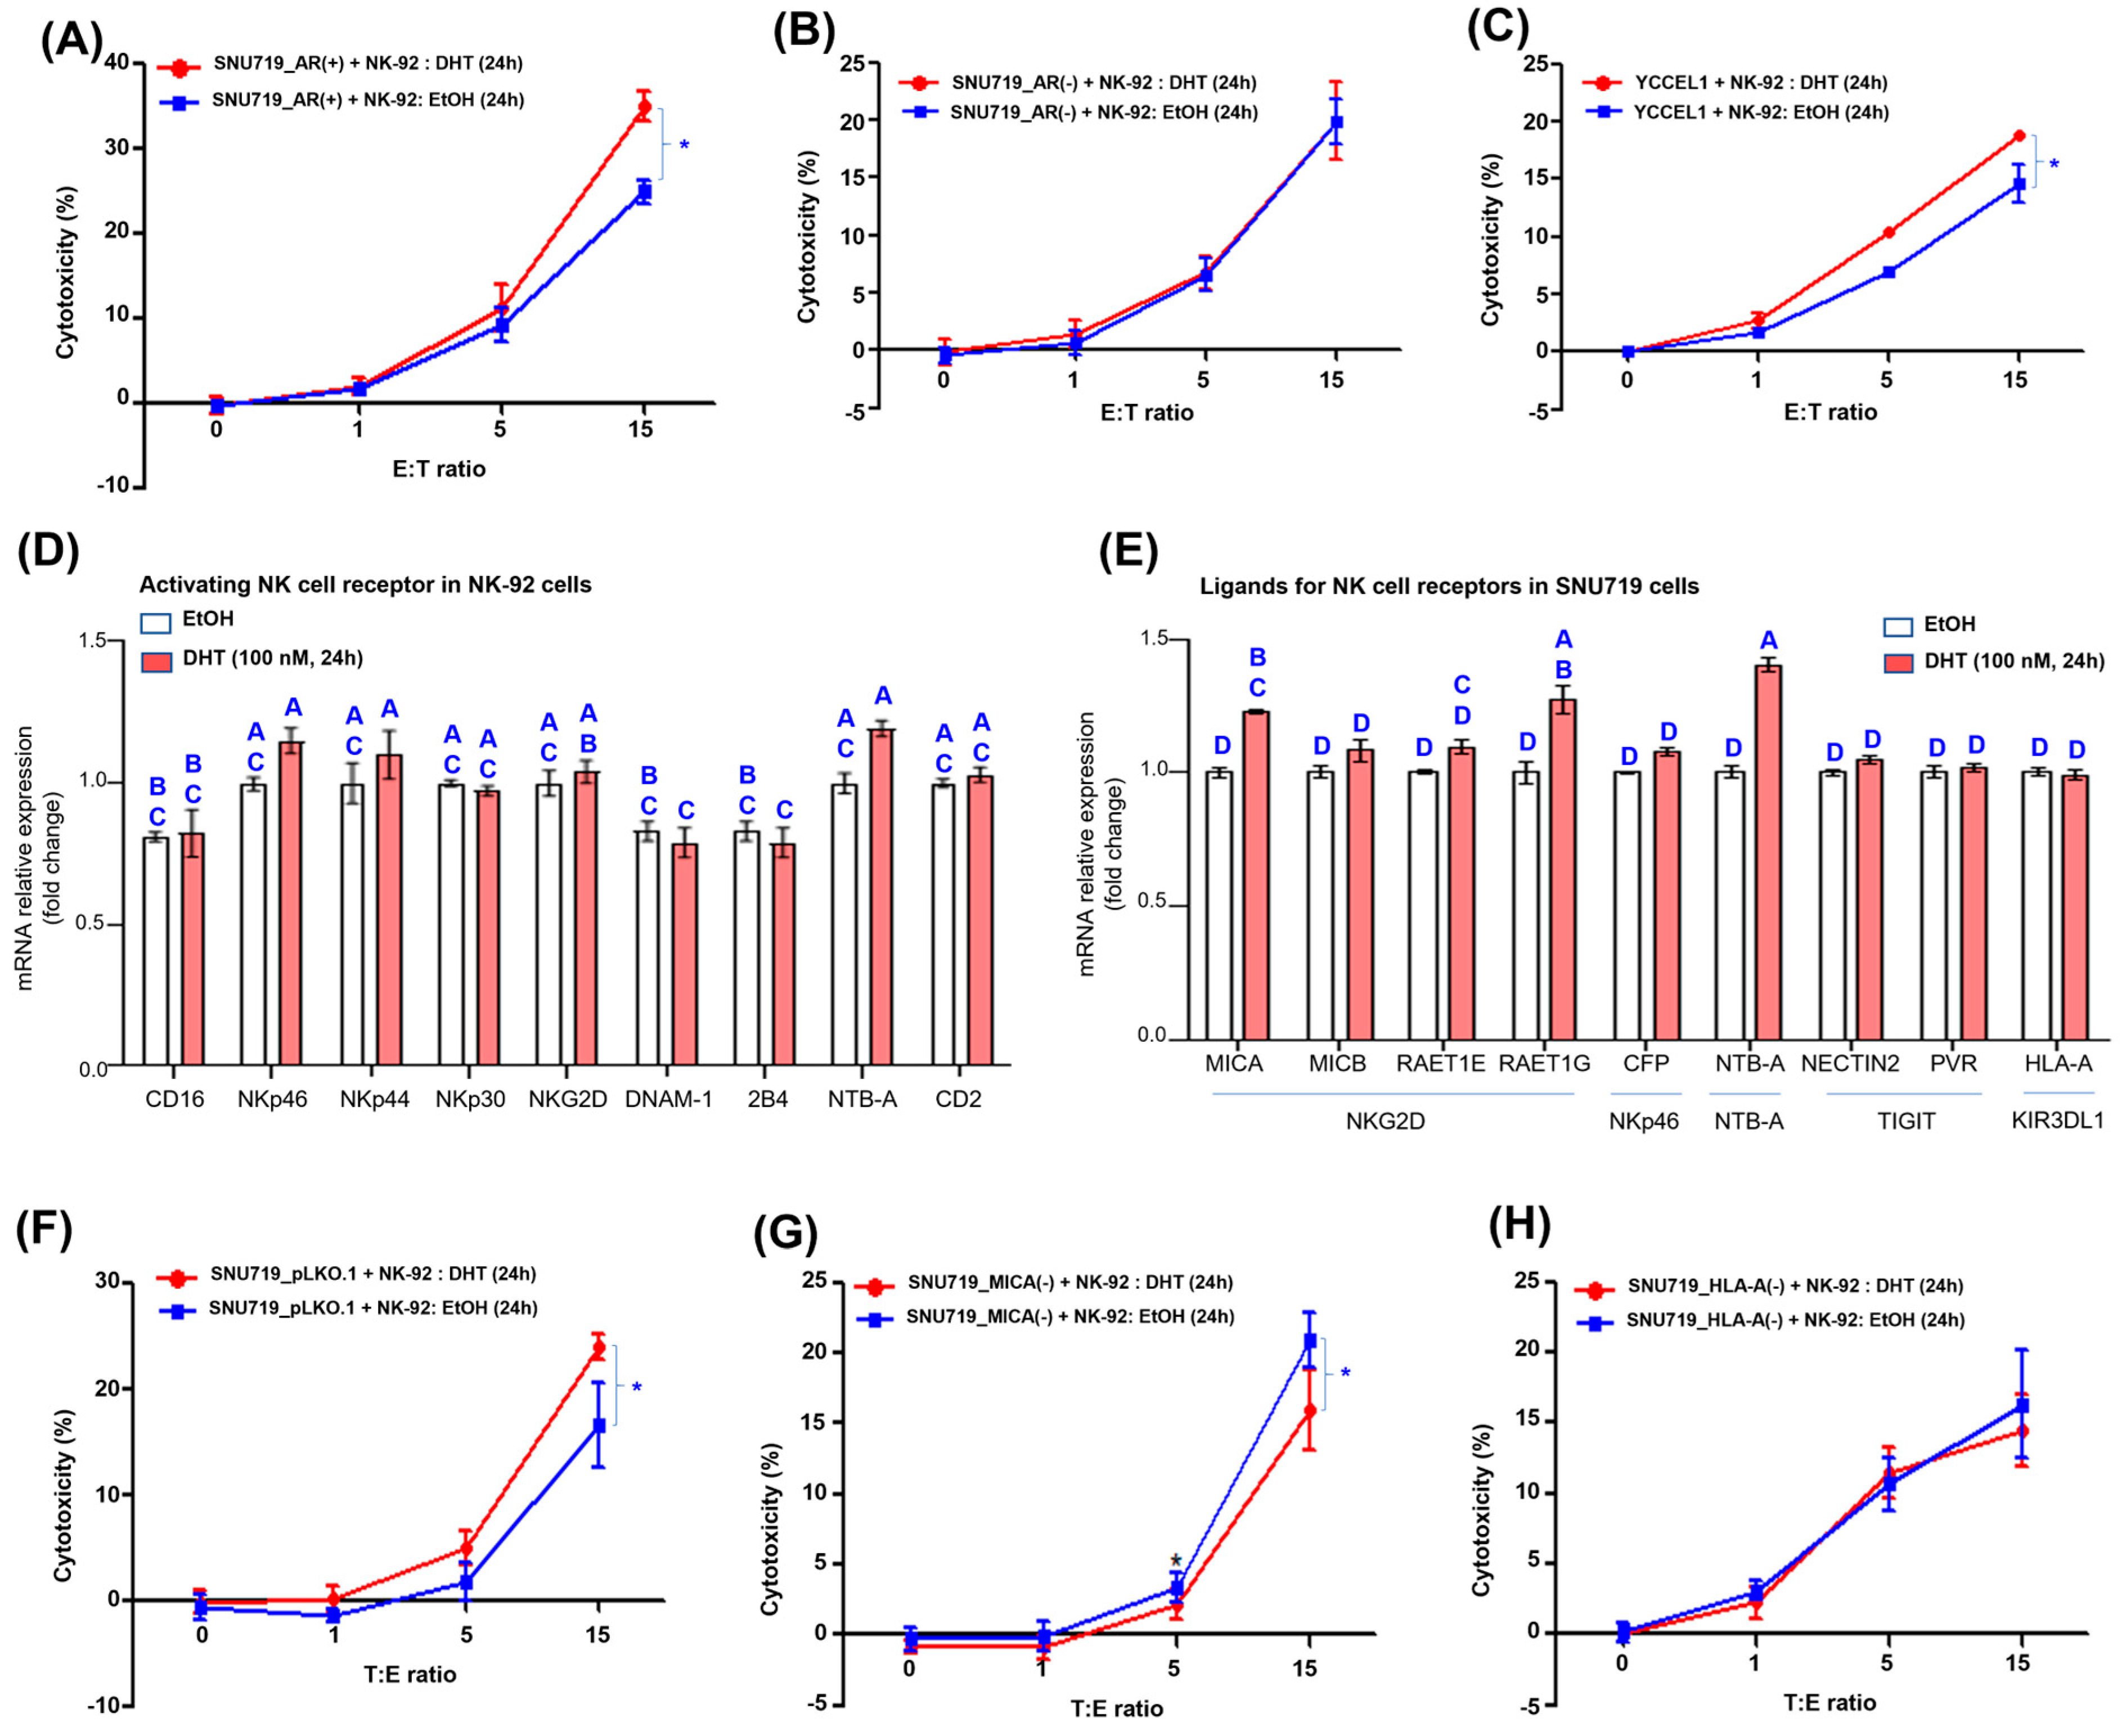
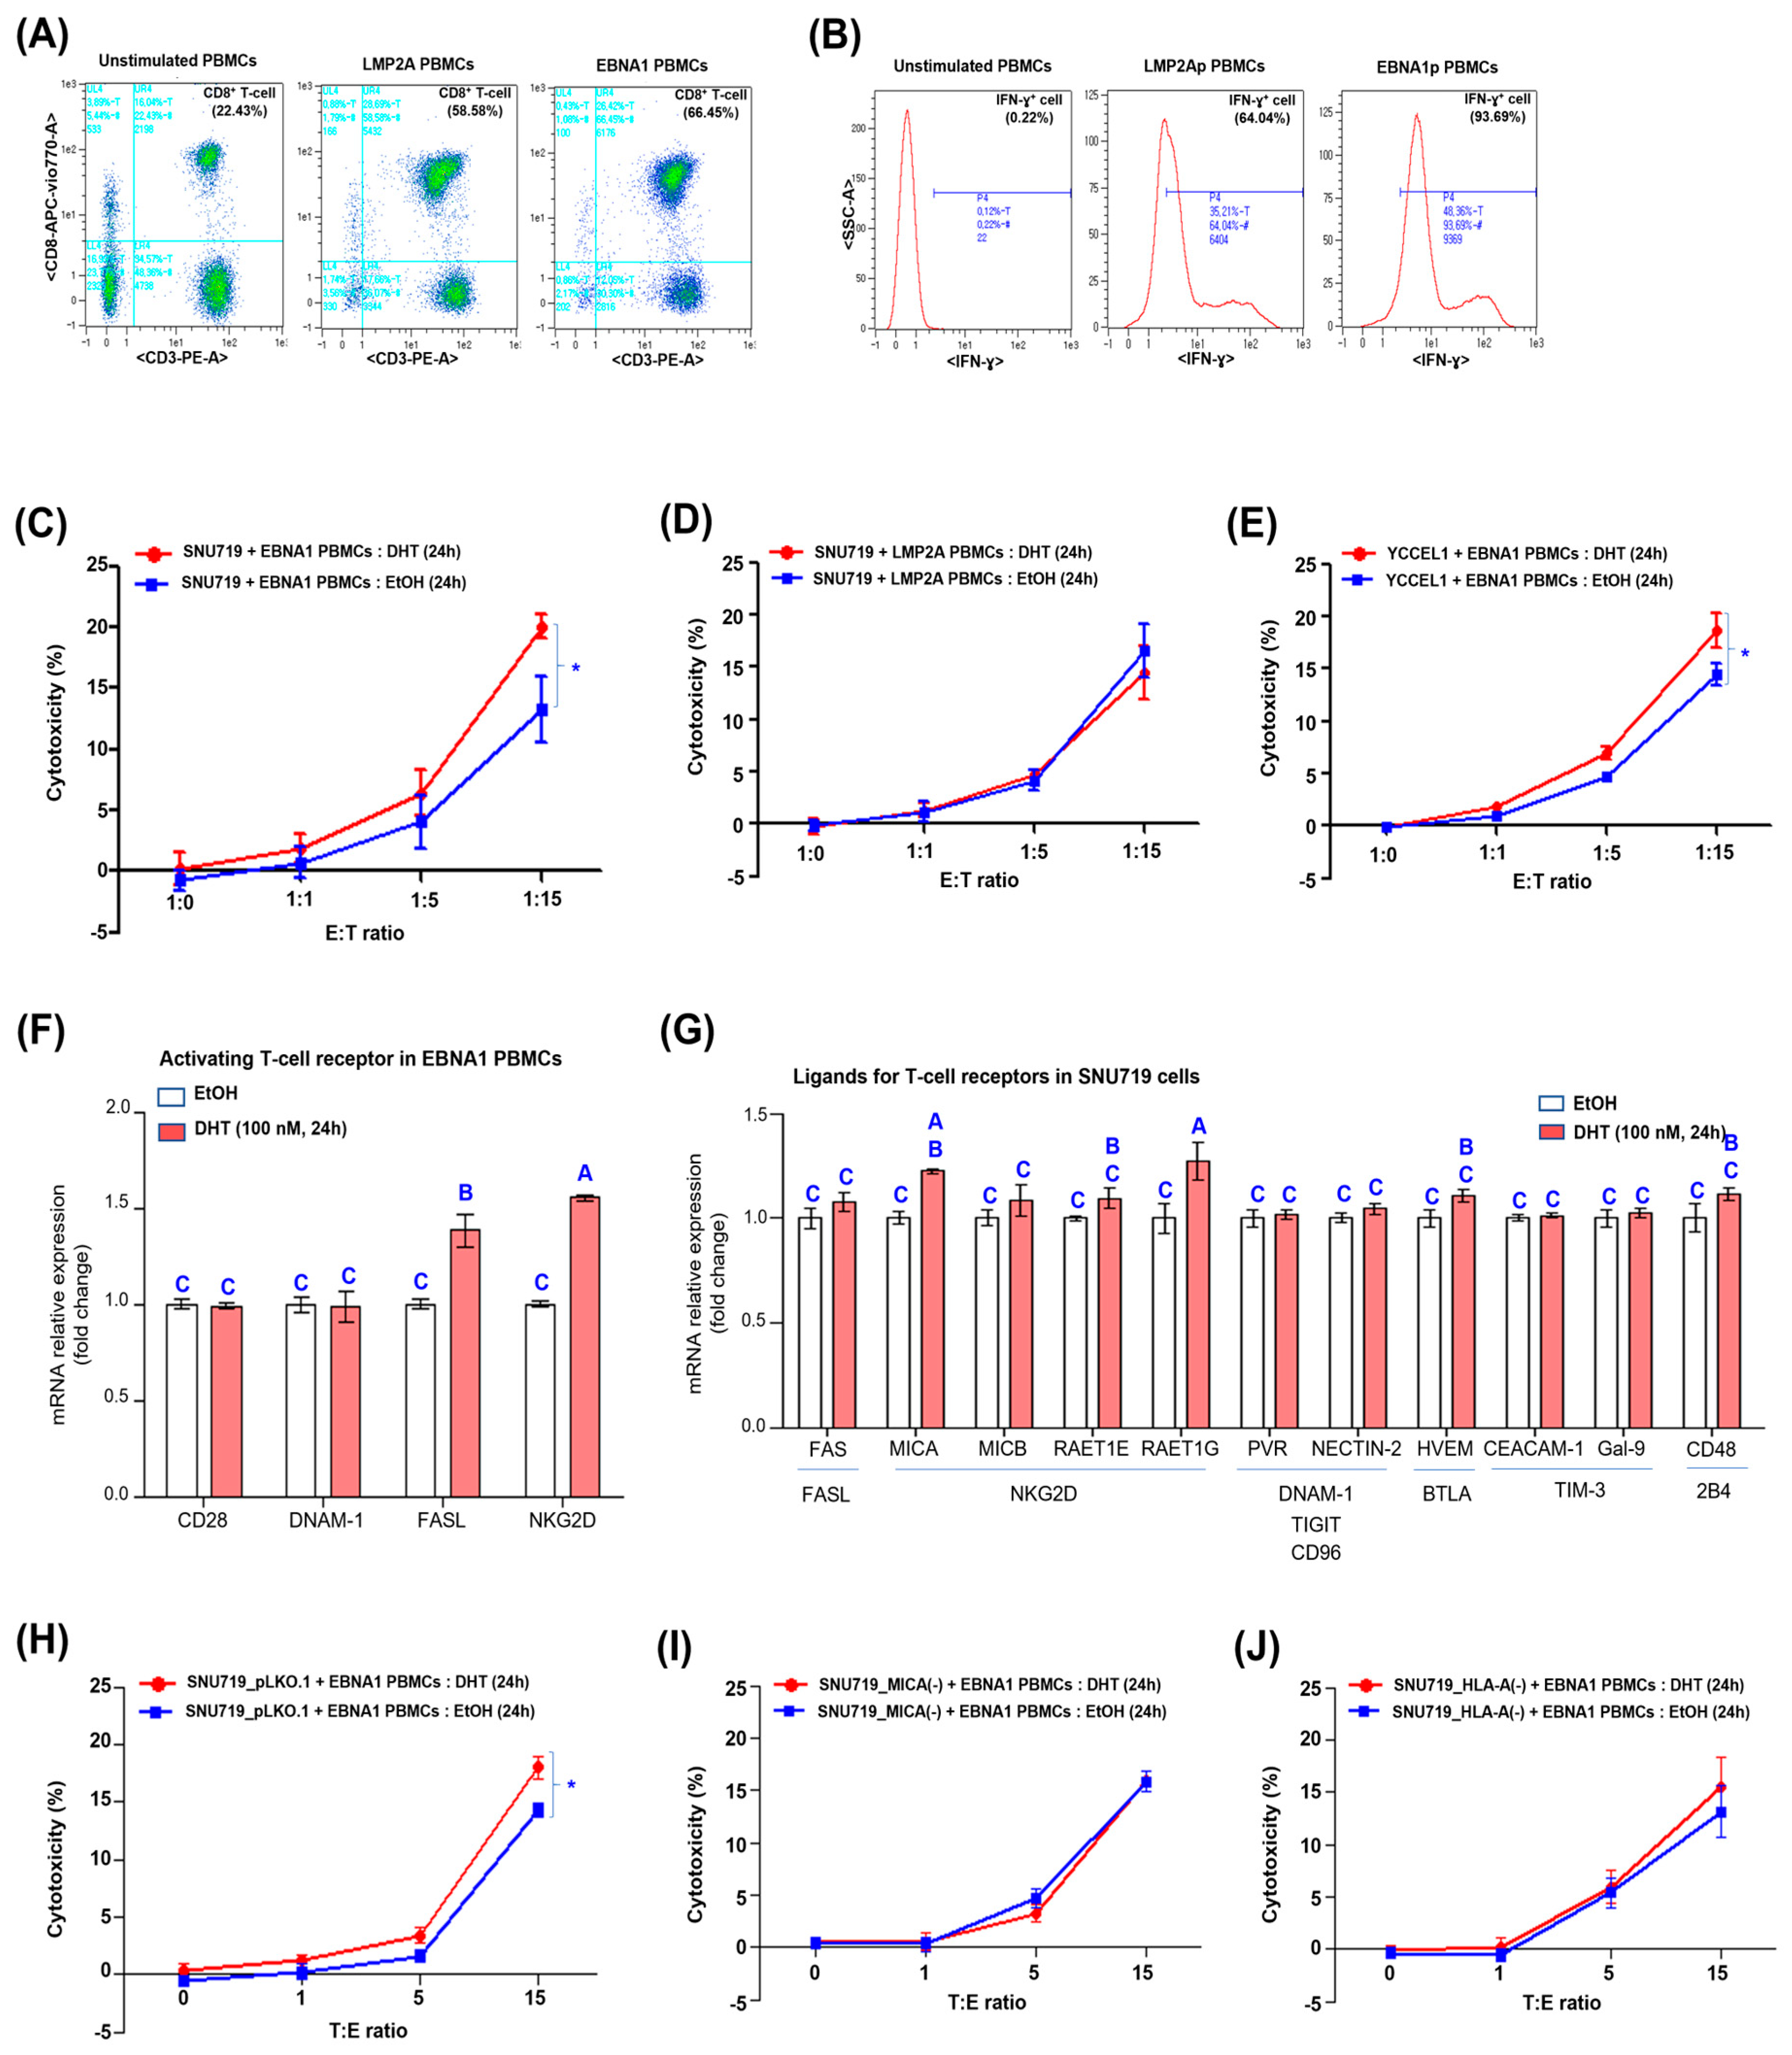
Our findings demonstrate that treatment with DHT leads to the upregulation of NF-κB, mediated by androgen receptor signaling, which in turn increases the expression of MICA in SNU719 cells. This increase in MICA expression enhances the ability of NK and CD8+ T cells to identify and attack SNU719 cells, making the tumor cells more vulnerable to immune-mediated cytotoxicity.
Understanding the mechanisms by which DHT influences MICA expression and the subsequent immune response in the context of EBVaGC can provide valuable insights into potential therapeutic strategies for enhancing anti-tumor immunity. This study aims to elucidate the role of DHT in modulating tumor cell susceptibility to immune-mediated cytotoxicity, particularly through the AR and NF-κB pathways, and to explore the potential implications for cancer treatment in EBVaGC. Moreover, we consider the role of EBNA1 antigenicity in shaping the immune landscape of EBVaGC, further underscoring the importance of immune modulation in treatment approaches.
2. Materials and Methods
2.1. Cells and Reagents
SNU719 and YCCEL1 gastric carcinoma cell lines (EBVaGC) were maintained in RPMI 1640 medium (HyClone, GE Healthcare, Pittsburgh, PA, USA) supplemented with 10% fetal bovine serum (HyClone), 1% antibiotic–antimycotic solution (Gibco, Thermo Fisher Scientific, Waltham, MA, USA), and 1% GlutaMAX (Gibco) for enhanced growth and viability. HEK293T cells were cultured in DME medium (HyClone) supplemented with 10% fetal bovine serum (HyClone), 1% antibiotics/antimycotics (Gibco), and 1% GlutaMAX (Gibco). NK-92 cells were obtained as a gift from Dr. Cho at Duksung Women’s University and cultured in alpha minimum essential medium (Gibco) supplemented with rIL-2 (100–200 U/mL, 589102, BioLegend, San Diego, CA, USA), 0.19 mM 2-mercaptoethanol, 10% fetal bovine serum (HyClone), and 1% penicillin–streptomycin (Gibco). Peripheral blood mononuclear cells (PBMCs) were isolated from whole blood obtained from healthy donors by Ficoll–Paque density gradient centrifugation and used to generate anti-CD3 antibody (Ab, OKT3, 317326, BioLegend)-activated PBMCs and EBV-specific PBMCs. OKT3-activated PBMCs were generated from PBMCs (1 × 10⁶ cells/mL) using OKT3 (100 ng/mL) and cultured in a humidified incubator at 37 °C under 5% CO2 in RPMI-1640 medium supplemented with 10% heat-inactivated human AB serum (Sigma-Aldrich, Burlington, MA, USA), 1% penicillin–streptomycin, IL-2 (20 IU/mL), IL-7 (20 ng/mL, 207-IL-010, R&D Systems), and IL-15 (20 ng/mL, 247-ILB-005, R&D Systems) for seven days. The study protocol was approved by Kyungpook National University (Daegu, Republic of Korea), and the blood donors provided written informed consent (permit number, 2022-02-036). All cells were cultured at 37 °C under 5% CO2 and 95% humidity.
2.2. ChIP-qPCR Assay
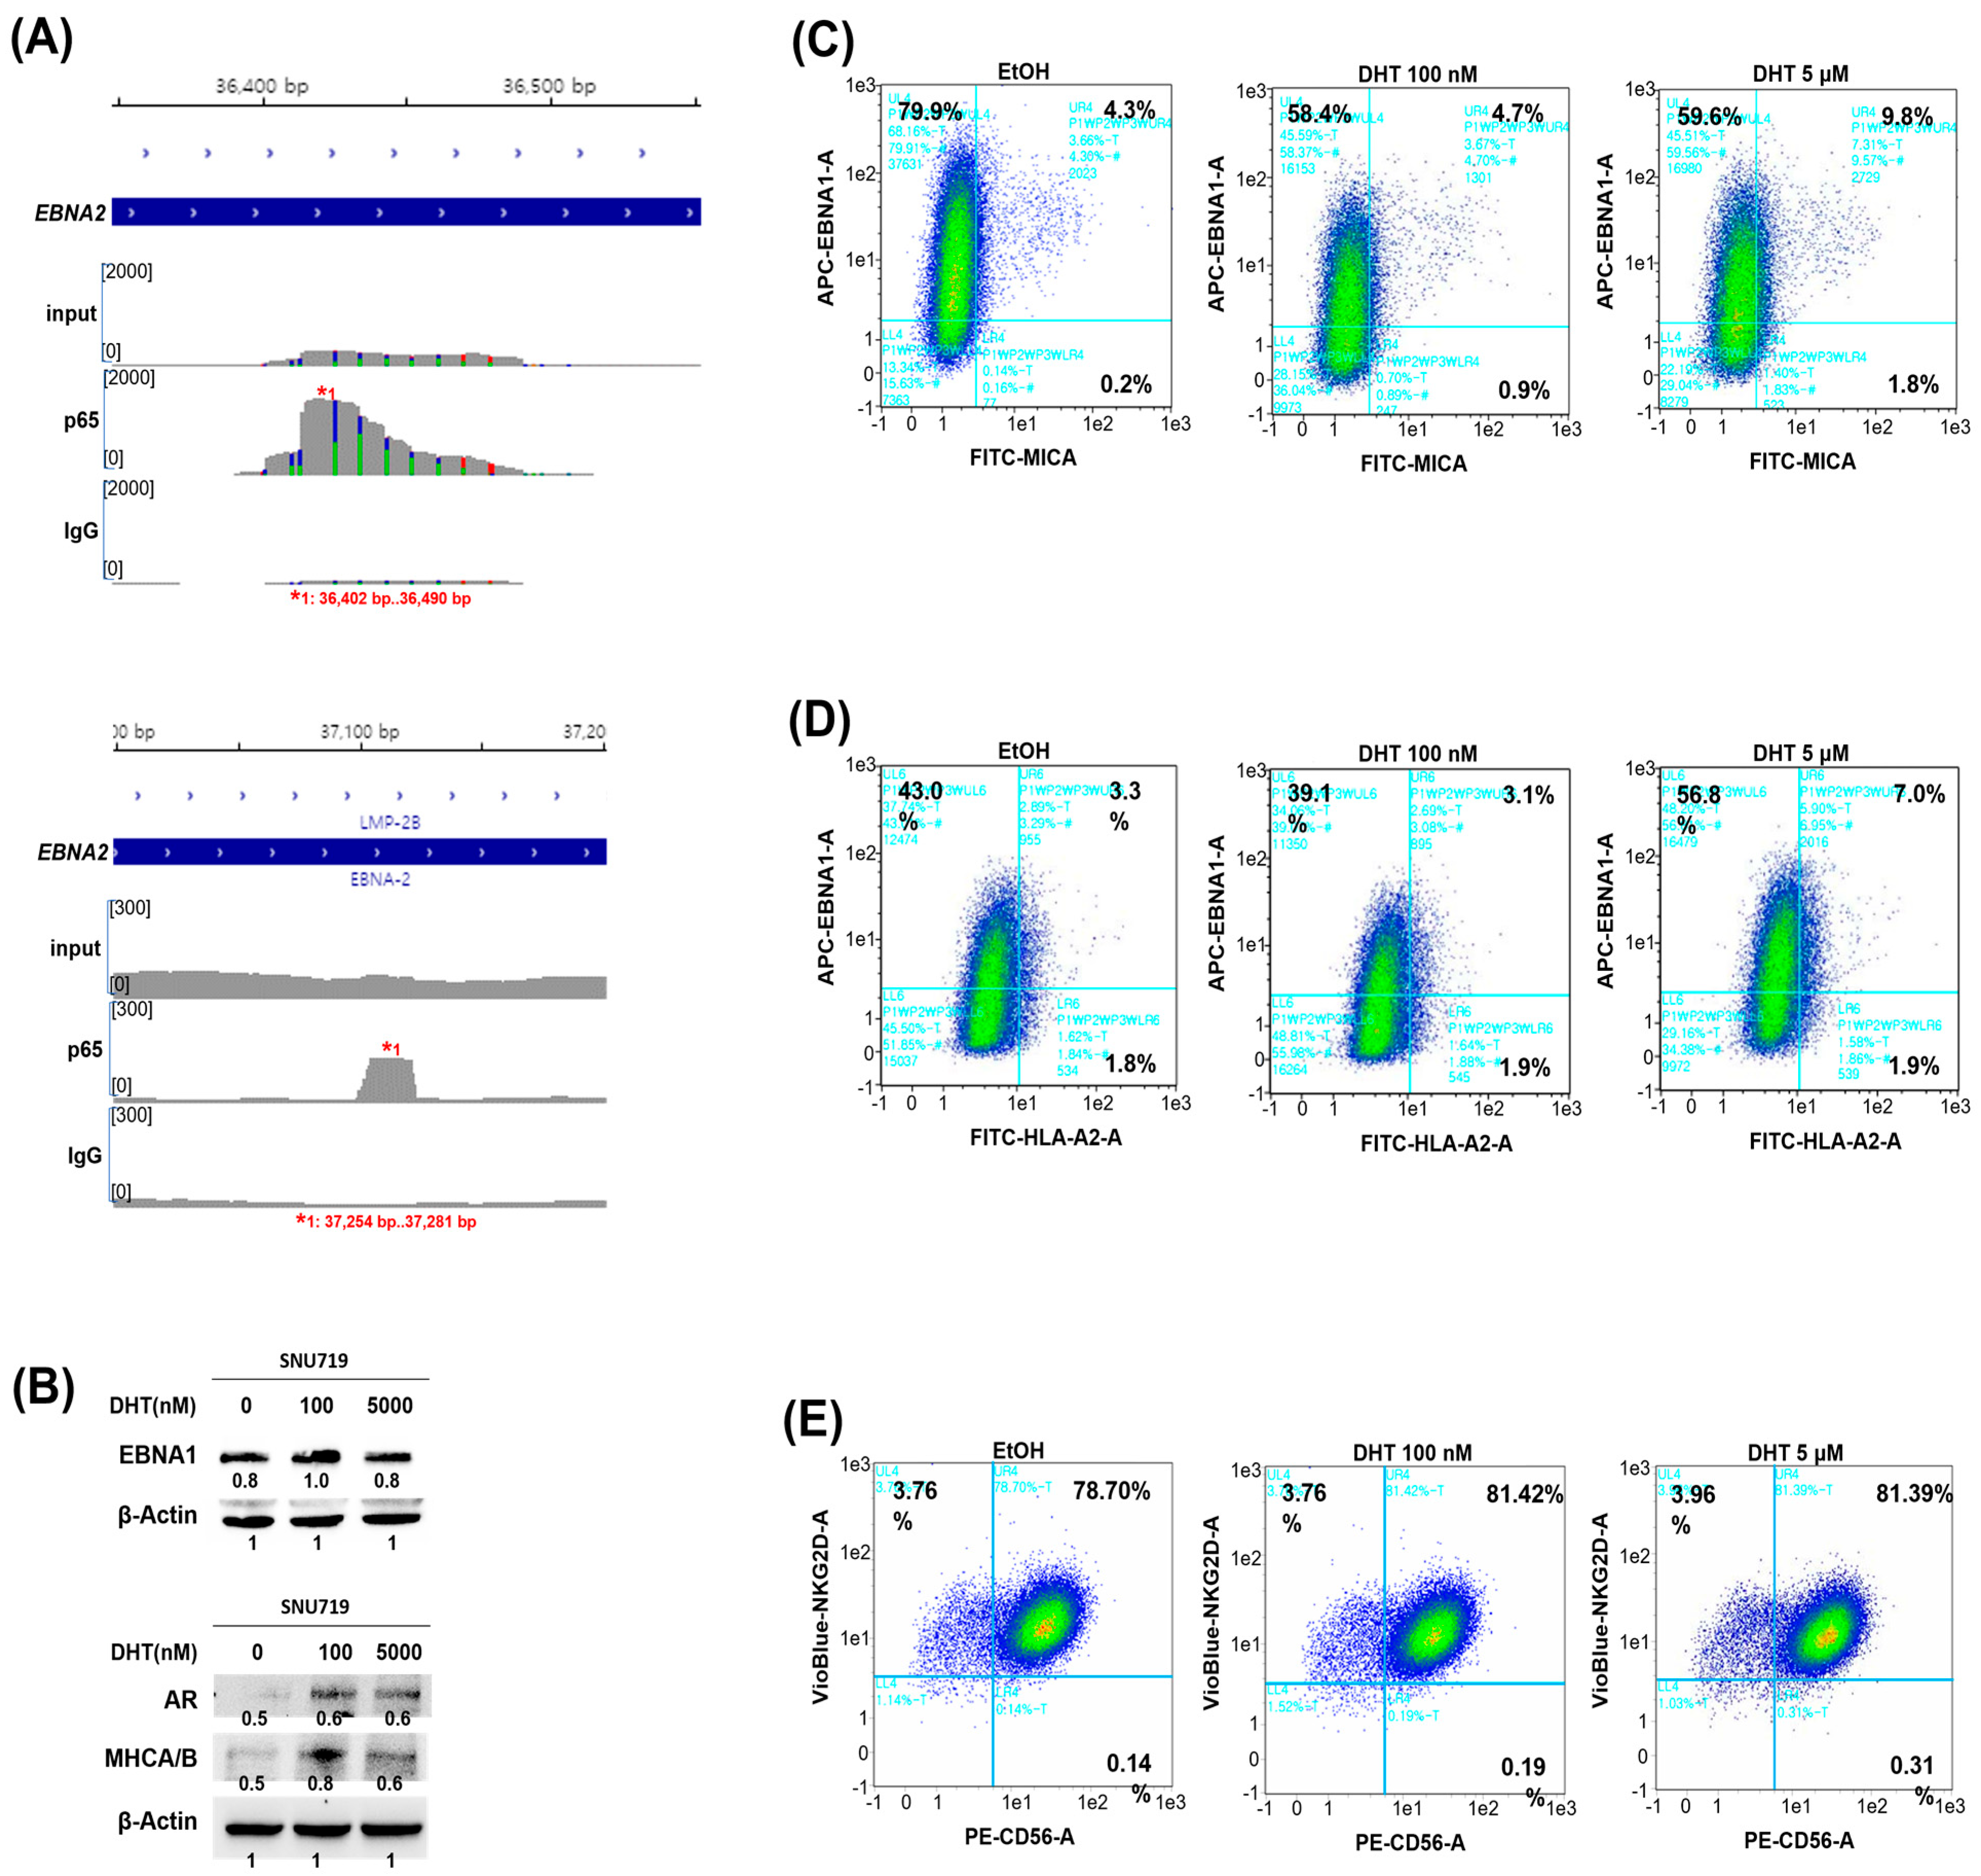
The ChIP-seq assay was performed against the NF-κB p65 (p65) protein using SNU719 cells (3 × 10⁷ cells/sample) treated with 100 nM DHT for 0, 0.5, and 1 h, followed by formaldehyde crosslinking. The resultant SNU719 cell lysates were sonicated to obtain DNA fragments of approximately 100–500 bp length. Immunoprecipitation was performed using 2.5 μg of either rabbit anti-p65 antibody (Ab) (Cell Signaling Technology, Danvers, MA, USA) or control rabbit IgG Ab (GeneTex, Irvine, CA, USA), followed by overnight incubation with Ab-coated Dynabeads protein A/G (Invitrogen, Carlsbad, CA, USA). The incubated beads were washed five times with ChIP-seq wash buffer (50 mM HEPES [pH 7.5], 500 mM LiCl, 1 mM EDTA, 1% NP-40, 0.7% Na deoxycholate, and 1× protease inhibitors) and then washed once with 50 mM NaCl in TE buffer. Immunoprecipitated DNA was eluted using ChIP-seq elution buffer (50 mM Tris–HCl [pH 8], 10 mM EDTA, and 1% sodium dodecyl sulfate [SDS]), reverse-crosslinked at 65 °C, treated with RNase A (0.2 mg/mL) and proteinase K (0.2 mg/mL), purified with phenol and chloroform, and subjected to quantitative polymerase chain reaction (qPCR) validation using the ChIP assay. The ChIP samples were used to determine the p65 enrichment through a qPCR assay. The p65 enrichment was investigated for the AR exon 1 region (chrX: 67,545,300~67,545,350 bp) and MICA promoter region (Chr6: 31,394,900~31,385,050 bp), respectively. Information on the primer sequences used in the ChIP assay was to be submitted upon request.
2.3. ChIP-Seq Assay
Among the above p65 ChIP samples, the sample treated with 100 nM DHT for 30 min showed the strong p65 enrichment on the SNU719 genome. Therefore, this 30 min-treated p65 ChIP sample was analyzed by a next-generation sequencing (NGS) assay to identify the genome-wide locus where the p65 protein is enriched. As a control, IgG ChIP samples were also analyzed by NGS assay to identify non-selective enrichment. The validated ChIP samples were further isolated by agarose gel purification, ligated to primers, and subjected to Illumina-based sequencing using the manufacturer’s protocol (Illumina, San Diego, CA, USA) for ChIP-seq analysis. ChIP-seq reads were mapped to the EBV wild-type reference genome (NC 007605) using Bowtie software (version 2.3.4.1). The MAC2 tool was used for peak calling [
12].
2.4. AR Depletion by CRISPR/Cas9 Genome Editing
The CRISPR/Cas9 system was used to generate SNU719 cells with the depletion of
AR. The sgRNA sequence was designed using the web tool of the Centre for Organismal Studies Heidelberg (COS): CCTop (
https://crispr.cos.uni-heidelberg.de/) accessed on 1 February 2021. The following sgRNA sequence was utilized to target the AR gene: 5′-CACCgTGCACTTCCATCCTTGAGCTCA-3′. The sgRNA targeting human AR (NC_000023.11) was designed and inserted into the LentiCRISPRv2 vector (catalog number 52961, Addgene, Watertown, MA, USA). HEK293T cells were then cotransfected with the LentiCRISPRv2 or LentiCRISPRv2-AR sgRNA plasmid, along with lentiviral packaging plasmids (psPAX2 and pMD2.G), using TurboFect Transfection Reagent (R0531, Thermo Fisher Scientific), and incubated for 72 h.
The viral supernatants were collected, filtered, and used to infect SNU719 cells for 24 h. Afterward, the supernatants were replaced with fresh RPMI medium, and the cells were treated with 0.5 μg/mL puromycin every 2 to 3 days. Knockout efficiency was validated by analyzing protein expression. The resulting SNU719 cells with AR depletion were designated as SNU719_AR(−) cells (
Supplementary Figure S1A,B). SNU719 cells transfected with a lentivirus containing only the LentiCRISPRv2 vector were named SNU719_AR(+) cells.
2.5. Depletion of MICA and HLA-A Transcripts Using the shRNA Gene Knockdown System
The shRNA lentiviral system was used to create SNU719 cells with the depletion of the MHC class I chain-related protein A (
MICA) transcript or
HLA-A transcript. The shRNA sequence was designed through a web tool based on the shRNA design algorithm (
https://portals.broadinstitute.org/gpp/public/seq/search) accessed on 1 August 2021. The sequence used to knockdown
MICA was 5′-GGCCATGAACGTCAGGAATTT-3′, and the sequence used to knockdown
HLA-A was 5′-CTCCCACTCCATGAGGTATTT-3′. An shRNA targeting human
MICA and an shRNA targeting human
HLA-A were designed and cloned into the pLKO.1 vector (catalog number 8453, Addgene). The resultant pLKO.1 vectors were named pLKO.1-MICA shRNA and pLKO.1-HLA-A shRNA vectors, respectively. The pLKO.1 vector, pLKO.1-MICA shRNA vector, and pLKO.1-HLA-A shRNA vector were cotransfected with lentiviral packaging plasmids (psPAX2 and pMD2.G) into HEK293T cells for 36 h using Lipofectamine 2000 transfection reagent (11668019, Invitrogen). The viral supernatant was harvested, filtered, and then used to infect SNU719 cells for 24 h at an MOI of 1. The viral supernatant was then replaced with fresh RPMI medium, and infected cells were selected by treatment with 1.5 µg/mL puromycin every 2 to 3 days.
The knockdown efficiency of MICA was assessed using reverse-transcription qPCR (RT-qPCR) and Western blot analysis, which confirmed significantly reduced levels of mRNA and protein expression, respectively (
Supplementary Figure S1C,D). Similarly, the knockdown efficiency of HLA-A was confirmed using the same methods, showing decreased HLA-A expression (
Supplementary Figure S1E,F).
The resultant SNU719 cells with the depletion of MICA and HLA-A transcripts were named SNU719_MICA(−) and SNU719_HLA-A(−) cells, respectively. SNU719 cells infected with a lentivirus and packaged only with the pLKO.1 vector as a control group were named SNU719_pLKO.1 cells.
2.6. DHT Treatment
DHT (#A8380, Sigma-Aldrich) was dissolved in ethanol and treated at various concentrations, such as 100 nM and 5 μM. Ethanol was treated as a negative control at a concentration of 0.1%. Phenol red-free RPMI-1640 medium (Gibco) supplemented with 5% charcoal-stripped FBS (CS-FBS, Gibco), 1% antibiotic–antimycotic, and 1% GlutaMAX was named androgen-free medium and used for in vitro DHT treatment. EBVaGC cell lines were transferred to androgen-free medium after attachment and stabilized for 72 h. After 72 h, the cells were plated in an appropriate quantity according to the experiment and cultured in fresh androgen-free medium for 24 h with either DHT or ethanol (EtOH) treatment. Immune cells, such as PBMCs and NK-92 cells, were plated without prior stabilization in an appropriate quantity according to the experiment and cultured in androgen-free medium for 24 h with either DHT or EtOH.
2.7. Lactate Dehydrogenase (LDH) Release-Based Cytotoxicity Test
The cytotoxicities of effector cells, such as NK-92 cells and EBV peptide-stimulated PBMCs (EBNA1 PBMCs and LMP2A PBMCs), against target cells, such as SNU719 and YECCL1 cells, were analyzed using the CyQUANT™ LDH Cytotoxicity Assay Kit (#C20300, Invitrogen), according to the manufacturer’s protocol. The target cells were plated at 5 × 10³ cells/well in a 96-well plate and incubated overnight at 37 °C under humidity. The next day, effector cells were added at various ratios to the tumor cells (1:0, 1:1, 1:5, and 1:15 target cell/effector cell ratio [T:E]). After 4 or 24 h of coculture, the mixture was centrifuged at 250× g for 5 min at room temperature. Then, a 50 μL aliquot of the medium was used for the LDH released-based cytotoxicity assay using the LDH Cytotoxicity Assay Kit (Invitrogen). Experimental LDH release was corrected by subtracting the LDH amount spontaneously released in the cells at the corresponding dilutions. The percentage of cytotoxicity was calculated as follows: % Cytotoxicity = (Experimental value − Effector cell spontaneous control − Target cell spontaneous control)/(Target cell maximum control − Target cell spontaneous control) × 100. The coculture of SNU719 target cells and NK-92 effector cells for 24 h induced up to 15% cytotoxicity depending on T:E. The cytotoxicity induced at each T:E could be partially observed using an optical microscope.
2.8. Western Blot Analysis
Western blot assay was performed to identify molecular events related to immune response and signal transduction in DHT-treated SNU719 cells. SNU719 cells were treated with DHT at various concentrations for 48 h, and total protein was harvested from treated cells as described in the previous protocol. Briefly, 5 × 10⁶ cells were lysed with 200 μL radioimmunoprecipitation assay (RIPA) lysis buffer supplemented with protease inhibitors (PI, Sigma) and phenylmethylsulfonyl fluoride (PMSF, Sigma) and further fractionated using a Biolutor sonicator (Cosmobio, Tokyo, Japan) set to 30 s on/off pulses for 5 min. Proteins in cell lysates were measured by BCA assay: proteins were separated by 10% SDS-polyacrylamide gel electrophoresis and transferred to 0.45 μm polyvinylidene fluoride membranes (Millipore). The membrane was probed with antibodies (Abs) against cellular proteins. For the primary detection of target proteins on the membrane, anti-AR Ab (Cell Signaling Technology), anti-p-p65 Ab (Cell Signaling Technology), anti-p65 Ab (Cell Signaling Technology), anti-lamin B1 Ab (Cell Signaling Technology), anti-MICA/B Ab (Cell Signaling Technology) and anti-beta-actin Ab (Santa Cruz Biotechnology, Dallas, TX, USA) were used.
To detect the primary antibodies, goat anti-mouse IgG-HRP and goat anti-rabbit IgG-HRP (both from Genetex) were employed as secondary antibodies. The antibody-bound proteins were visualized using an enhanced chemiluminescence (ECL) detection reagent (Bio-Rad, Hercules, CA, USA). Each Western blot analysis was performed in triplicate, and representative results of this analysis were analyzed using ImageJ 1.54g.
2.9. RT-qPCR Assay
To confirm the knockdown efficiencies of AR and MICA and the effects of DHT on the SNU719 cell transcriptome, real-time RT-qPCR assays were performed.
Total RNA was extracted from the cells using the RNeasy Mini Kit (Qiagen, Germantown, MD, USA). The isolated RNA was then reverse transcribed into cDNA with SuperScript III Reverse Transcriptase (Invitrogen).
The resulting cDNA was diluted in nuclease-free water and utilized for analyzing cellular gene expression via real-time qPCR (LightCycler 96, Roche, Basel, Switzerland). Actin mRNA levels were measured in each sample as an internal control. To ensure accuracy, RT-qPCR was also conducted on RNA samples without reverse transcription, serving as a negative control for each reaction.
The gene primer set for real-time qPCR was as follows: MICA, forward: CGG GGA TCC ATG GAA GTG CAG TTA GGG CT and reverse: CCG CTC GAG TCA CTG GGT GTG GAA ATA GA; AR, forward: GGA TGG AAG TGC AGT TAG GG and reverse: GAG GTG CTG CGC TCG CGG. Upon request, we can provide information about the primer sets used in RT-qPCR to detect transcripts of other cellular and EBV genes.
2.10. Generation of EBV-Specific PBMCs
PBMCs were obtained from donors (Kyungpook National University Chilgok Hospital IRB# 2022-02-036 IRB# 2022-02-036). PBMCs were stimulated with peptide pools consisting of 15-mers with 11 overlapping amino acids. The EBV EBNA-1 peptide pool (#130-093-613, Miltenyi Biotec, Bergisch Gladbach, Germany) was used to generate EBNA-1-specific PBMCs (named EBNA1 PBMCs), while the EBV LMP2A peptide pool (130-093-615, Miltenyi Biotec) was used to generate LMP2A-specific PBMCs (named LMP2A PBMCs). The lyophilized peptide pools were dissolved in ultrapure water (UPW) and kept at −80 °C for storage. To generate these EBV-specific PBMCs, PBMCs (1 × 10⁶ cells/mL) were cultured in a humidified incubator at 37 °C with 5% CO2 in RPMI-1640 medium supplemented with 10% heat-inactivated human AB serum, 1% penicillin–streptomycin, IL-2 (20 IU/mL), IL-4 (1000 IU/mL, 204-IL-010, Miltenyi Biotec), IL-7 (20 ng/mL), IL-15 (20 ng/mL), granulocyte macrophage colony-stimulating factor (GM-CSF, 1000 IU/mL, 215-GM-010, Miltenyi Biotec), and each peptide pool (5 ng/peptide/mL) for 14–17 days.
2.11. Co-Immunoprecipitation (Co-IP) Assay
Co-IP and Western blot assay was performed according to a previously described protocol [
13]. To analyze the interaction between NF-κB subunits and AR proteins, SNU719 cells were treated with 100 nM DHT for 48 h. The cells were lysed in RIPA lysis buffer (25 mM Tris–HCl [pH 7.6], 150 mM NaCl, 2% Nonidet P-40, 1% sodium deoxycholate, 10% SDS, and protease inhibitors) on ice for 30 min, and the cell debris was cleared by centrifugation at 10,000×
g at 4 °C. The resulting supernatants were co-immunoprecipitated with anti-p65 Ab (Cell Signaling Technology) or anti-NF-κB2 p100/52 Ab (Cell Signaling Technology) at 4 °C overnight; rabbit IgG was used as a negative control. The immunocomplexes were collected using Dynabeads Protein G (Invitrogen) at 4 °C overnight and washed thrice with ice-cold lysis buffer. The immunoprecipitates were eluted with Laemmli sample buffer, and the samples were analyzed by Western blot analysis.
2.12. NF-κB Activity Assay
To analyze the promoter binding activity of NF-κB, SNU719 cells were transfected with the pSI-Check2-hRluc-NFκB-firefly reporter plasmid (catalog number 106979, Addgene) using Lipofectamine. Forty-eight hours post-transfection, the SNU719 cells were exposed to DHT for either an additional 6 or 24 h.
Luciferase activity, indicative of NF-κB binding activity, was measured using the Dual-Luciferase Reporter Assay System (Promega, Madison, WI, USA) according to the manufacturer’s instructions. Relative luciferase activity was calculated by normalizing firefly luciferase activity to renilla luciferase activity.
2.13. Cytokine Array Assay
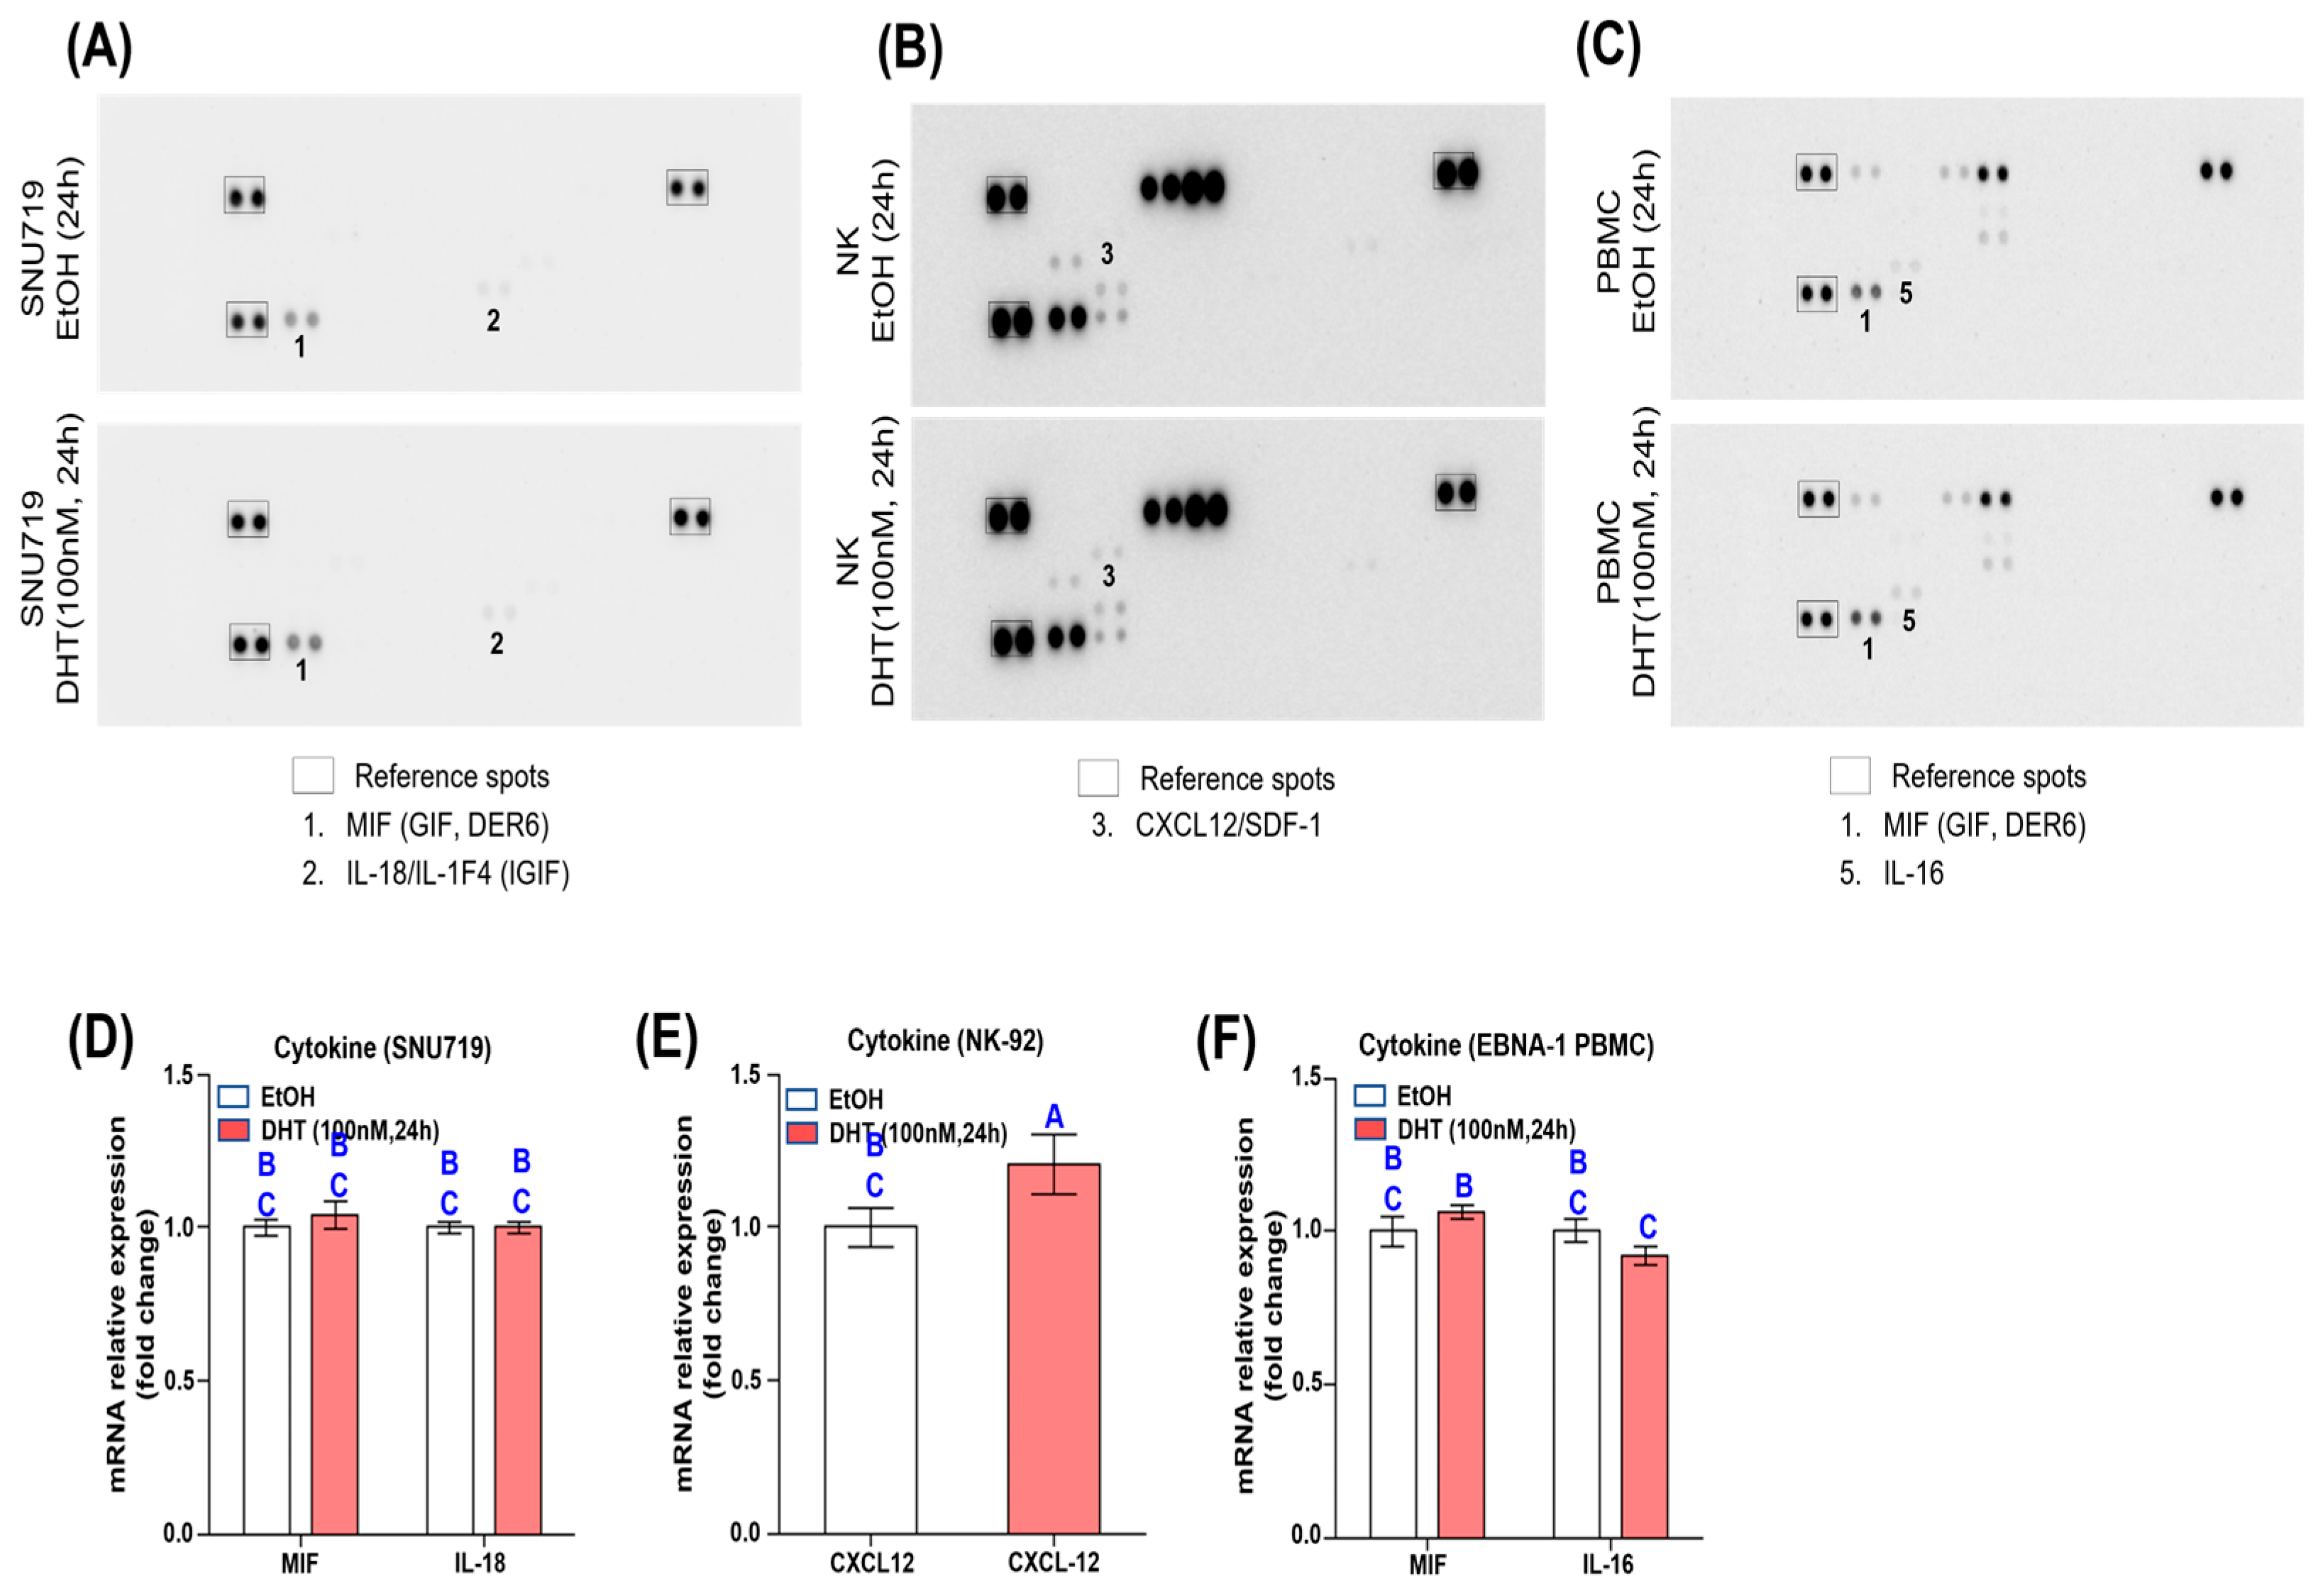
PBMCs, SNU719 cells and NK-92 cells were treated 100 nM DHT for 24 h. Mediums were collected, and cell debris was removed by centrifugation at 3000 rpm for 5 min. The supernatant was analyzed with a Proteome Profiler Human Cytokine Array kit (R&D Systems, Minneapolis, MN, USA) according to the manufacturer’s instructions.
2.14. Immunofluorescence Assay (IFA)
For the immunofluorescence assay (IFA), SNU719 cells were cultured on coverslips in 24-well plates and treated with 1000 nM DHT for 48 h. Cells were fixed with 4% paraformaldehyde for 20 min and permeabilized with 0.25% Triton X-100 in PBS for 15 min. Blocking was performed with 1% BSA in PBS containing 0.1% Tween 20 for 30 min. The samples were then incubated with a MICA antibody (1:40) overnight at 4 °C. After washing the coverslips three times in PBS, they were treated with Alexa-488 (Thermo Fisher Scientific) for 1 h at room temperature to detect MICA. Following three washes with PBT (PBS containing 0.5% Triton X-100), coverslips were mounted using DAPI (SouthernBiotech, Birmingham, AL, USA) and analyzed via immunofluorescence confocal microscopy.
2.15. FACs Analysis
To observe the expression of HLA-A2 and EBNA1 upon DHT treatment in SNU719, we performed FACS analysis. SNU719 cells treated with 500 nM and 5 uM of DHT for 48 h were trypsinized to isolate single cells and washed with FACS buffer (Dulbecco’s phosphate-buffered saline [DPBS] containing 0.1% bovine serum antigen [BSA], 2 mM ethylene-diamine-tetraacetic acid [EDTA]). Next, cells were blocked with 1% BSA for 10 min at room temperature (to prevent non-specific binding). Cells were then treated with 10 μg/mL FITC mouse anti-human HLA-A2 antibody (clone BB7.2, BD Biosciences, Franklin Lakes, NJ, USA, #551285), 1 μg/mL EBV-EBNA-1 antibody (clone 1EB12, Santa Cruz Biotechnology, #sc-81581 AF647) and 10 μg/mL MICA antibody (clone 2C10, Santa Cruz Biotechnology, #sc-23870 PE) for 30 min at 4 °C. Cell analysis was performed using a MACS Quant Analyzer 10 (Milteny Biotec, Bergisch Gladbach, Germany), with unstained cells used for negative controls.
2.16. Statistical Analysis
All experiments were performed at least three times to ensure the reproducibility of results. Statistical analyses were conducted using the Prism software package (GraphPad Prism 10.3.0, San Diego, CA, USA). Two-tailed Student’s t-tests (Microsoft, Redmond, WA, USA) were employed to assess differences between two groups, while one-way analysis of variance (ANOVA) followed by Tukey’s multiple comparison test was used for comparisons among three or more groups. Statistically significant differences identified by the two-tailed Student’s t-test are indicated by asterisks (*), and significant differences from one-way ANOVA and Tukey’s test are represented by different uppercase or lowercase letters.
4. Discussion
The role of male hormones, particularly dihydrotestosterone (DHT), in the progression and treatment of Epstein–Barr virus-associated gastric carcinoma (EBVaGC) has been underexplored compared to other cancers. Our study provides new insights into how DHT modulates the immune response against EBVaGC, highlighting its potential therapeutic implications. We observed that DHT significantly increases androgen receptor (AR) expression in EBVaGC cells. The DHT-AR complex activates various signaling pathways, including the upregulation of NF-κB, which is crucial for immune response modulation. This upregulation was associated with an increased expression of MICA protein, a critical ligand for the NKG2D receptor on natural killer (NK) and T cells. Increased MICA levels enhance interaction with the NKG2D receptor, boosting NK- and T-cell cytotoxicity against SNU719 cells—an EBVaGC cell line. This immune activation occurs without a concomitant increase in proinflammatory cytokine gene expression, suggesting a targeted and potentially less-inflammatory immune response.
Previous studies have shown that DHT, along with DHEA and E2, reduces IL-6 expression in human bone-marrow cells and that testosterone replacement in androgen-deficient males decreases IL-10 expression [
26,
27]. These findings suggest that male hormones modulate immune responses by regulating inflammatory cytokines in normal cells, but this modulation does not seem effective in cancer cells. In EBVaGC, no significant changes in cytokine expression were noted after 24 h treatment with 100 nM DHT, despite the sufficient induction of gene expression via NF-κB. This suggests that DHT-AR signaling may contribute more to direct NK- and T-cell activation rather than relying on NF-κB to upregulate inflammatory cytokine genes.
NKG2D, expressed on T and NK cells, transmits activation signals by recognizing NKG2D ligands (NKG2DLs) on tumor cells. Among these ligands, MICA and MICB are well characterized, with MICA more abundantly expressed in tumor cells [
28,
29]. Our analysis revealed that DHT treatment upregulates
MICA and
RAET1G expression in EBVaGC, with a more substantial increase in
MICA. The upregulation of
MICA by DHT counteracts the reduction caused by MICA/B shedding, enhancing NK-cell recognition and suppressing immune escape [
30,
31].
We generated Epstein–Barr virus (EBV)-specific peripheral blood mononuclear cells (PBMCs) targeting EBNA-1 (EBNA1 PBMCs) and LMP2A (LMP2A PBMCs), proteins expressed during the EBV latent phase in EBVaGC [
32]. Notably, DHT treatment only enhanced the cytotoxicity of EBNA1 PBMCs. Given that EBNA-1 is expressed in nearly all EBV latent phases, EBNA-1 peptides could serve as target antigens in most EBV-associated malignancies. Although EBNA-1 interferes with HLA-A presentation [
28], DHT treatment did not upregulate
HLA-A expression in SNU719 cells. However, HLA-A knockdown slightly reduced the DHT-mediated cytotoxicity of EBNA1 PBMCs, suggesting that DHT may partially restore the HLA-A presentation of EBNA-1.
Adoptive cell therapy (ACT) with EBV-specific T cells has been used for over 25 years to treat EBV-associated malignancies [
33], but its application to solid tumors like EBVaGC is challenging due to the immunosuppressive tumor microenvironment (TME) [
34]. Our study confirms that DHT upregulates
MICA in SNU719 cells and
NKG2D in EBNA1 PBMCs and NK-92 cells, enhancing the interaction between MICA and NKG2D and boosting cytotoxicity against SNU719 cells. Combining DHT with immune checkpoint inhibitors, which block PD-1 and PD-L1 [
35], could further enhance this cytotoxicity.
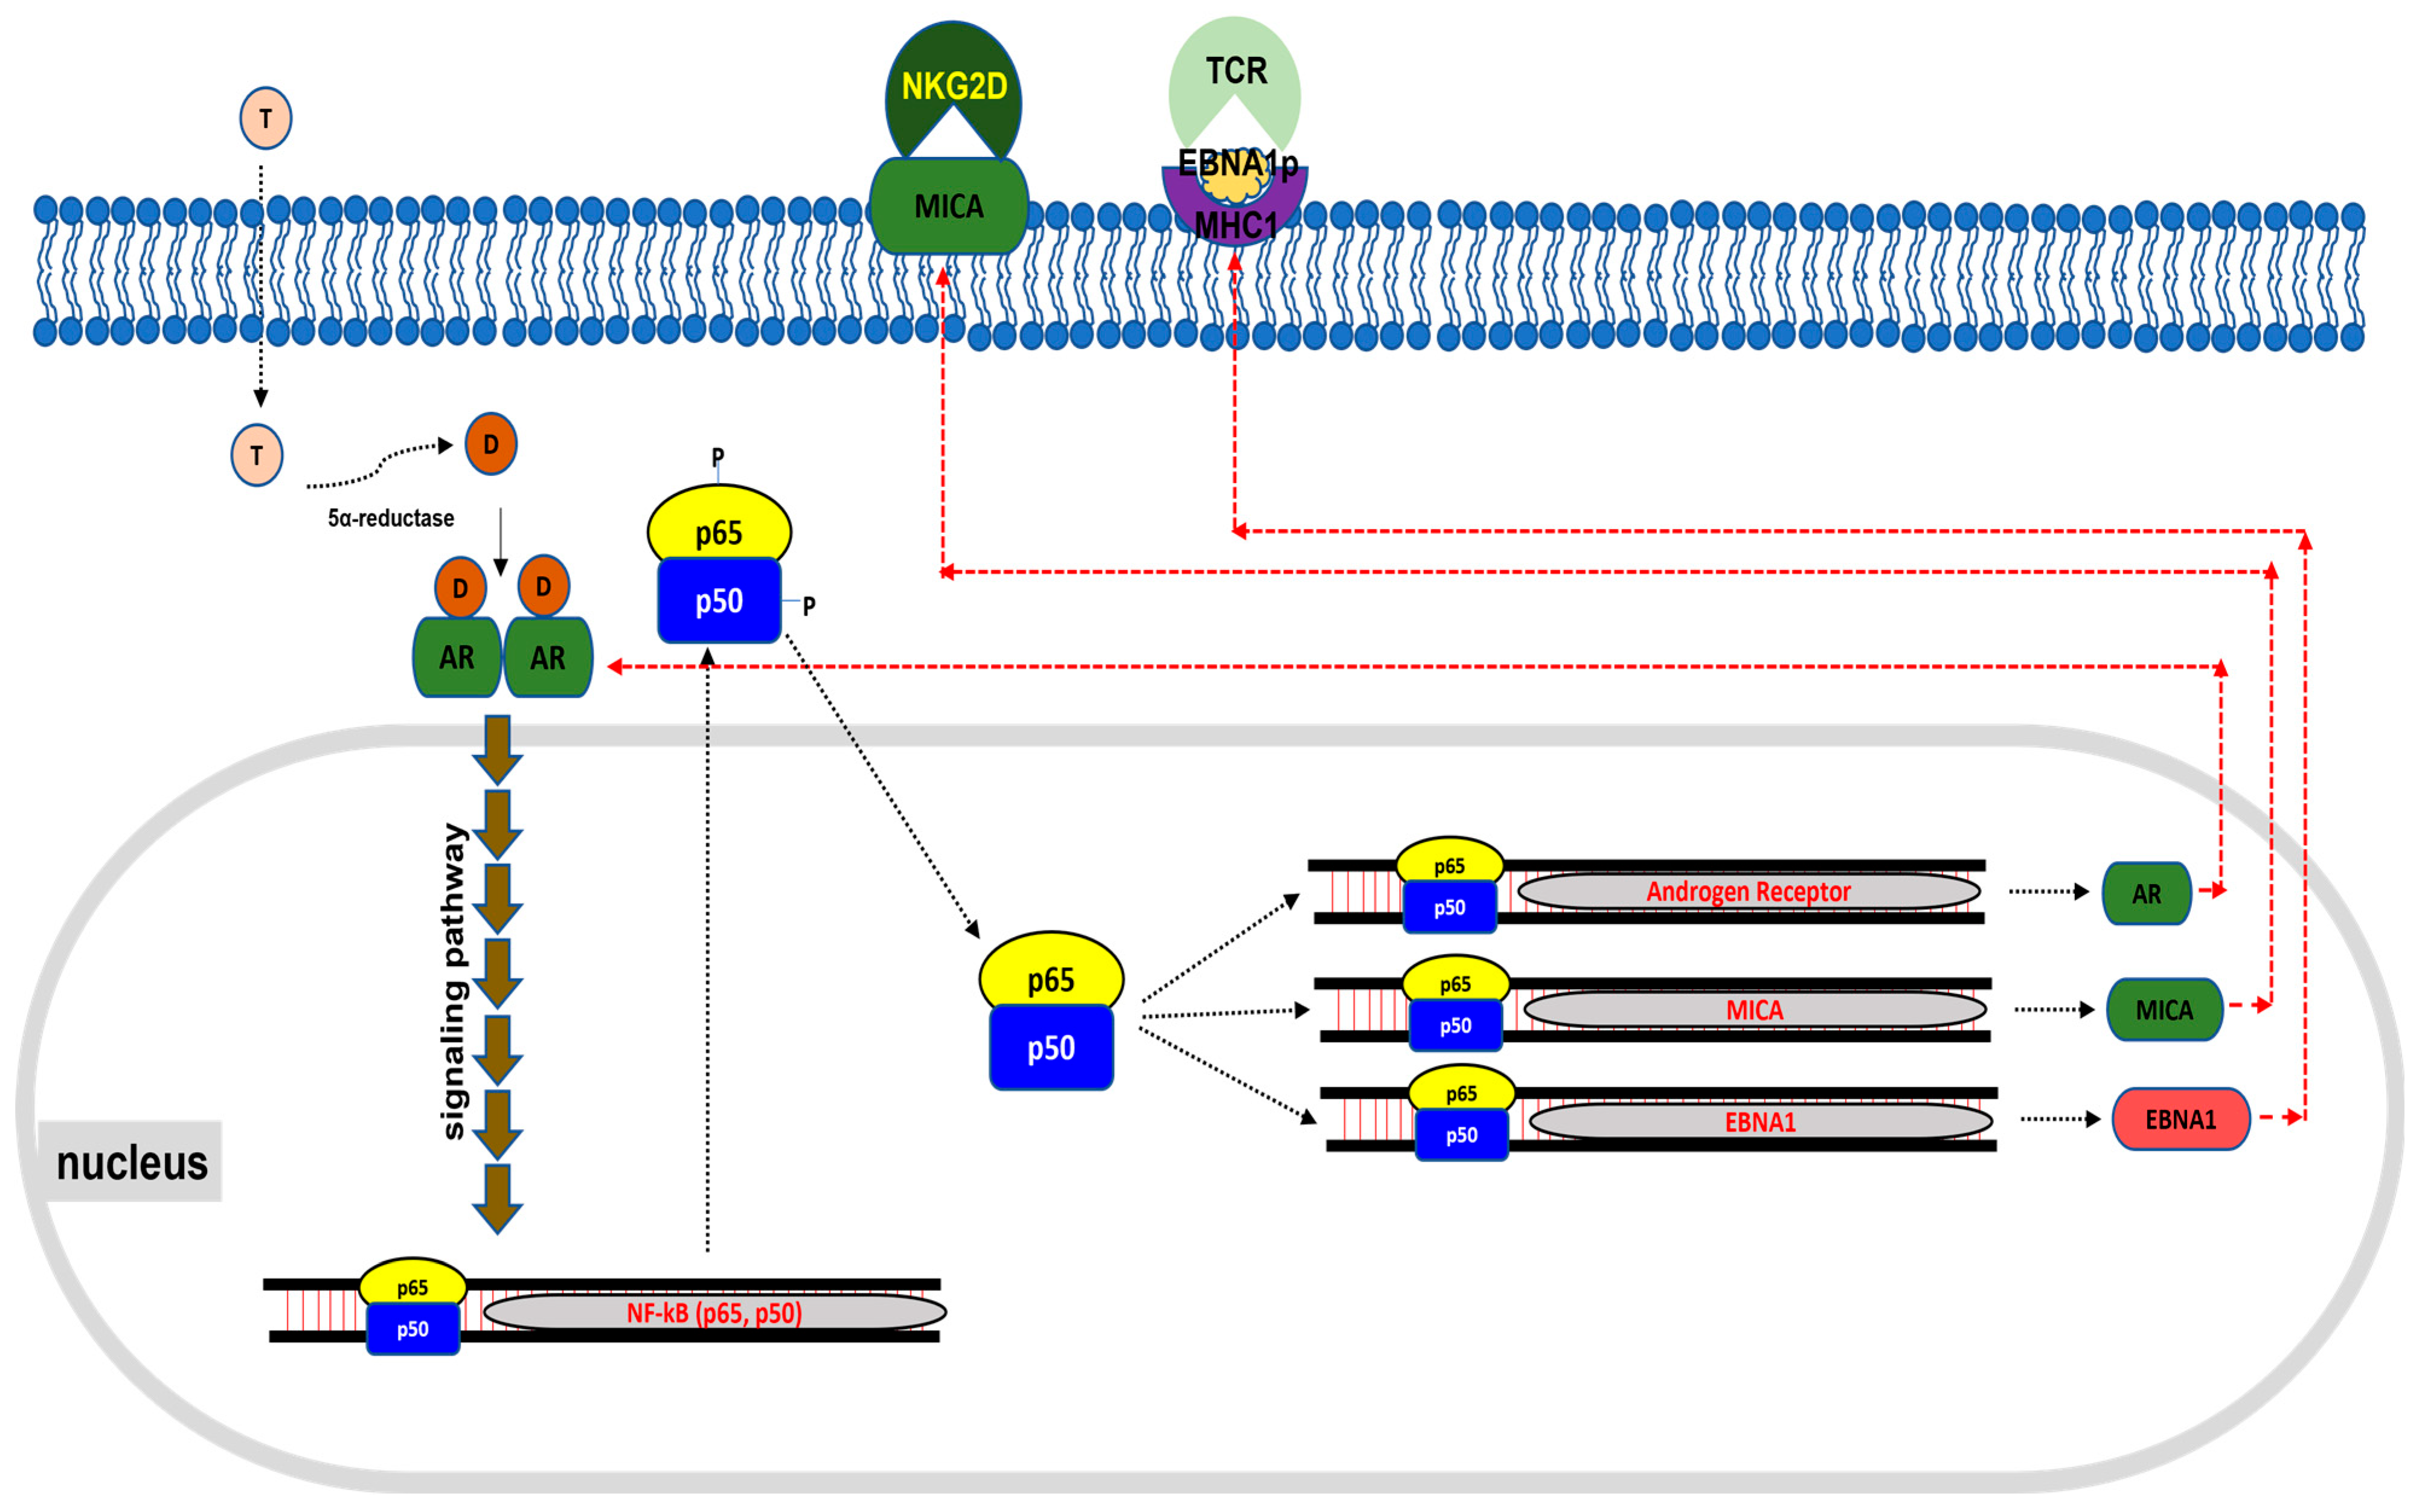
We were unable to successfully conduct planned animal experiments due to challenges with tumorigenesis in humanized mice. Future studies should address these issues. Our findings suggest that the DHT-AR complex activates key signaling pathways that enhance MICA expression and EBNA1 presentation, boosting the immune response against EBVaGC (
Figure 7). Further clinical validation and investigations into the mechanisms underlying the MHC class I presentation of EBNA1 peptides regulated by DHT-AR signaling are warranted. This study is significant as it is the first to demonstrate that male hormones can enhance antitumor immunity against EBVaGC, suggesting new therapeutic strategies. Overall, this study underscores the potential of leveraging DHT to modulate immune responses and improve treatment outcomes for EBVaGC patients.
