
The Tumor Coagulome as a Transcriptional Target and a Potential Effector of Glucocorticoids in Human Cancers
 , ,
, ,  , and
, and 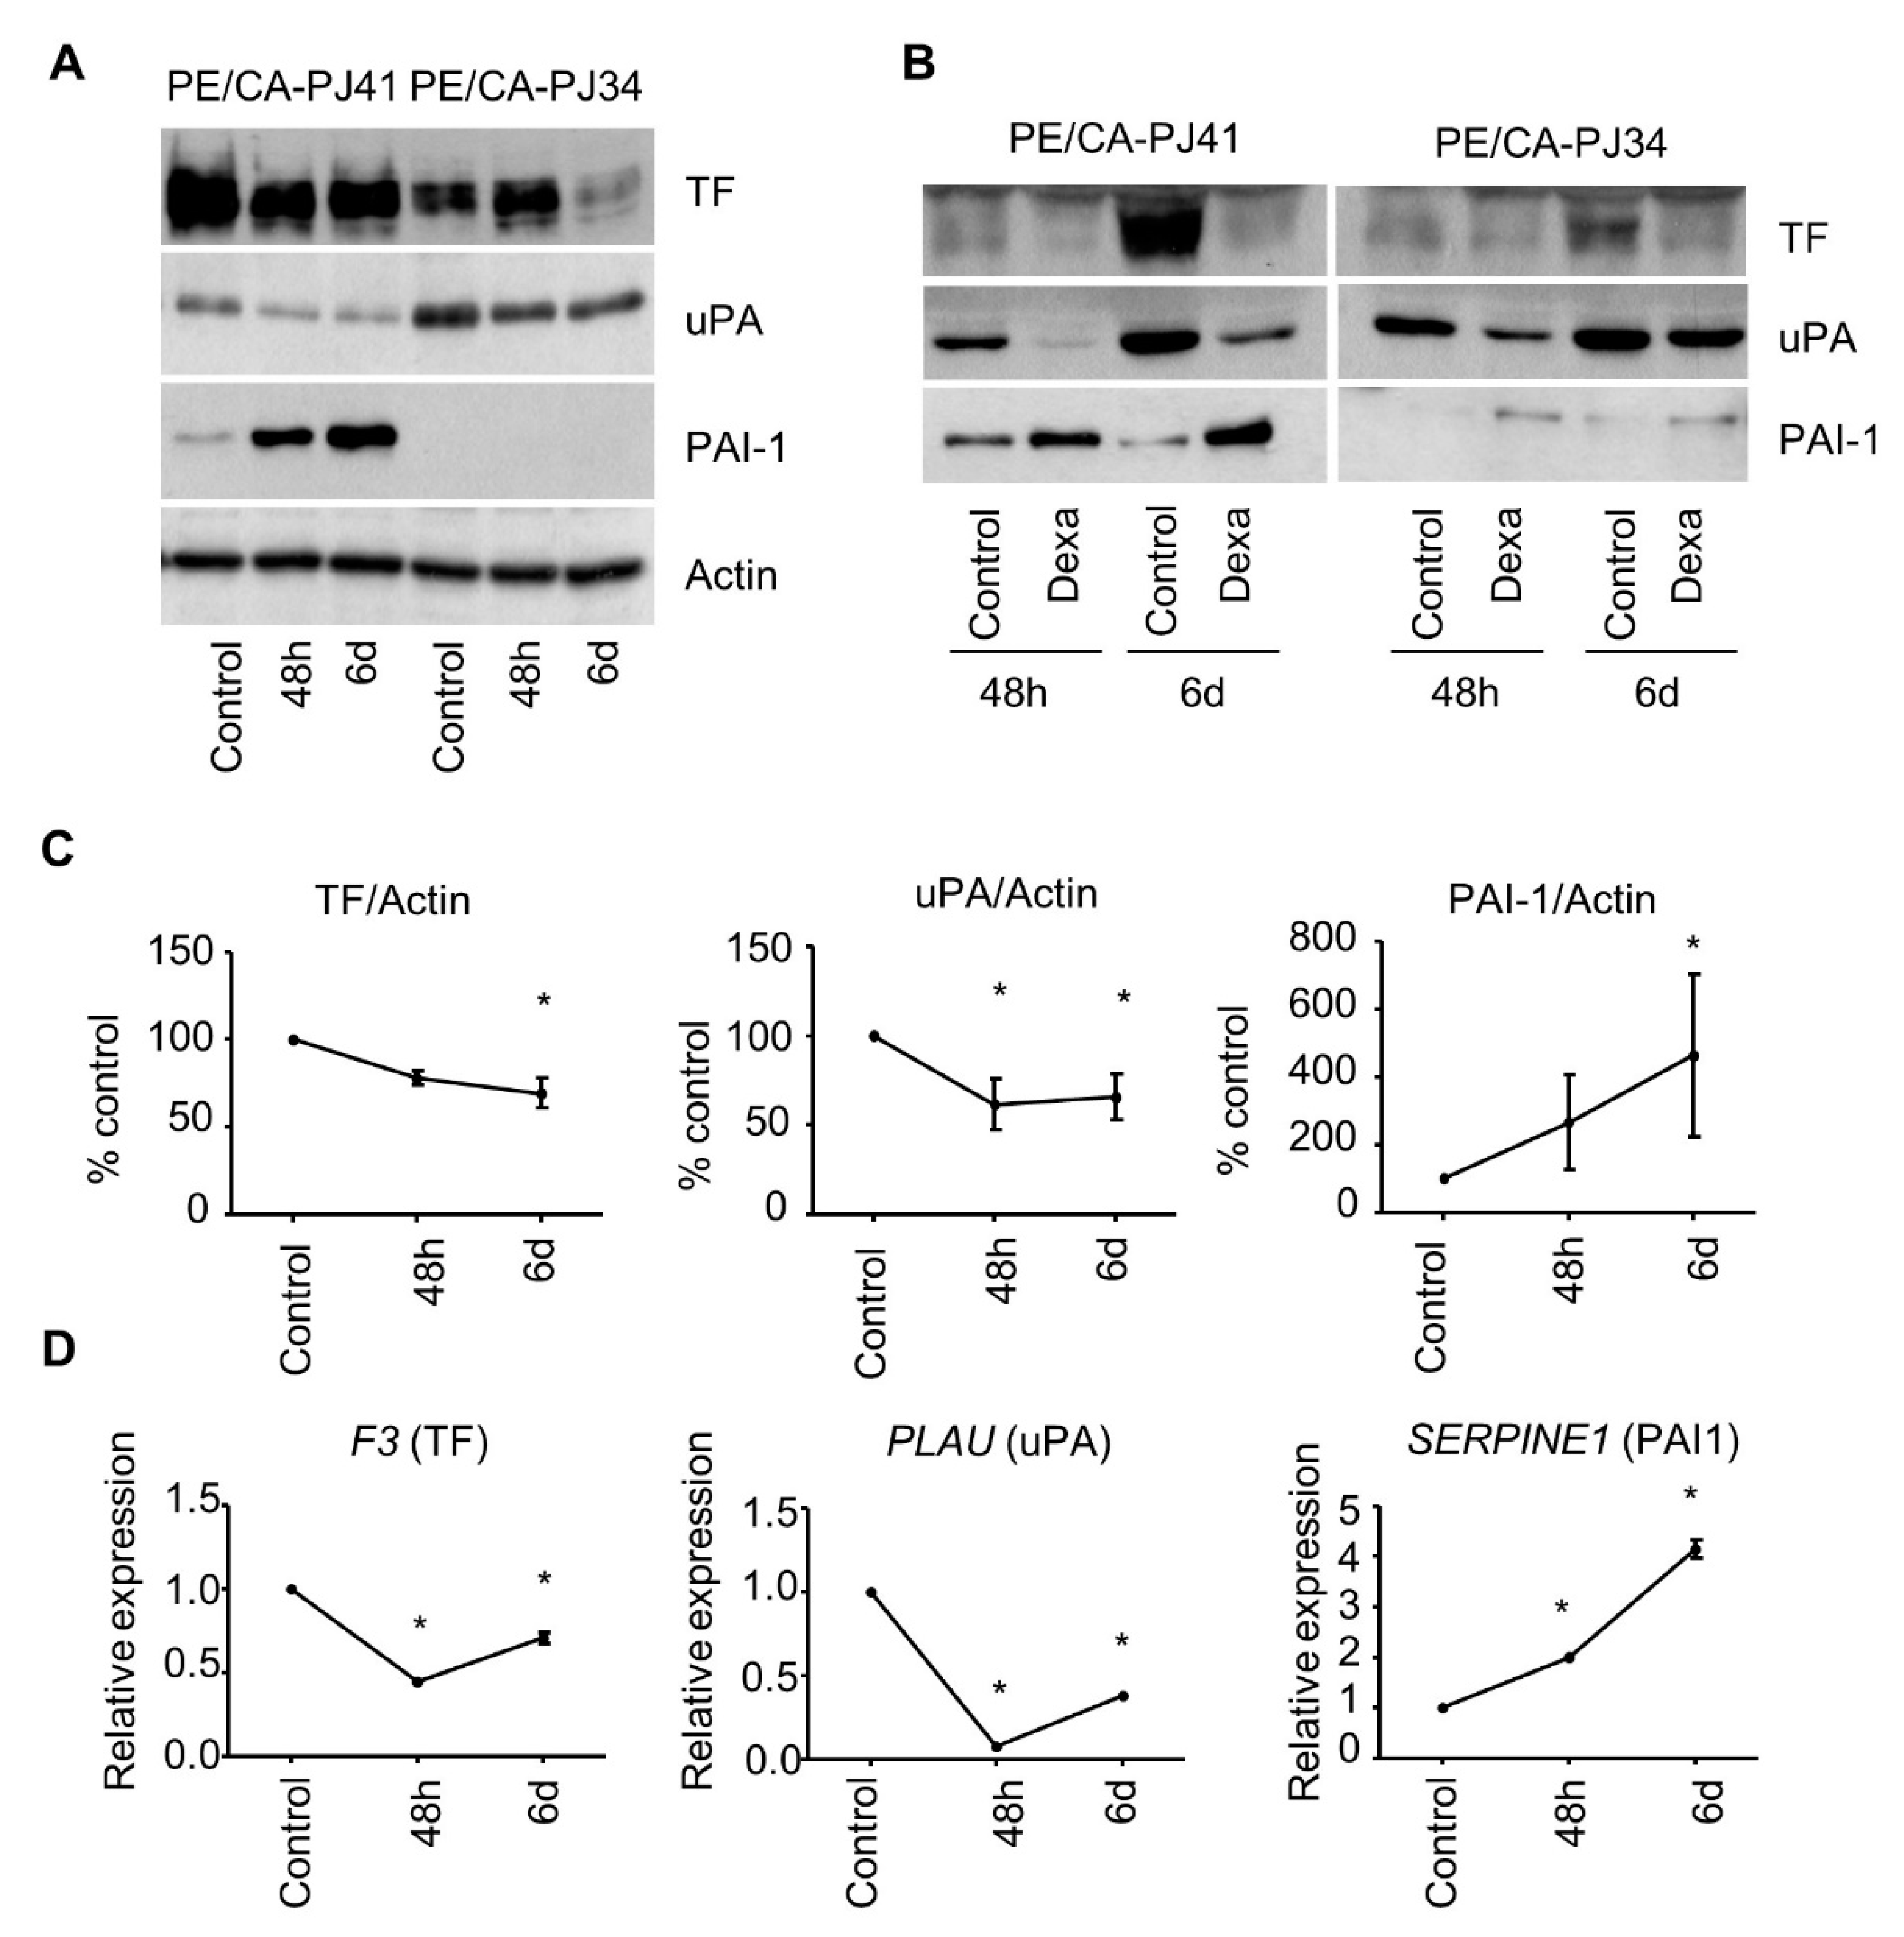
Abstract
Simple Summary
Abstract
1. Introduction
2. Materials and Methods
2.1. Cell Analyses
2.2. Quantitative Polymerase Chain Reaction (QPCR)
2.3. RNA Interference (RNAi)
2.4. RNA-seq Analyses and ChIP-seq Analyses
2.5. NCI-60 Analyses
2.6. Pathway Enrichment Analyses
2.7. Tumor Microenvironment Composition Analyses
2.8. Statistical Analyses
3. Results
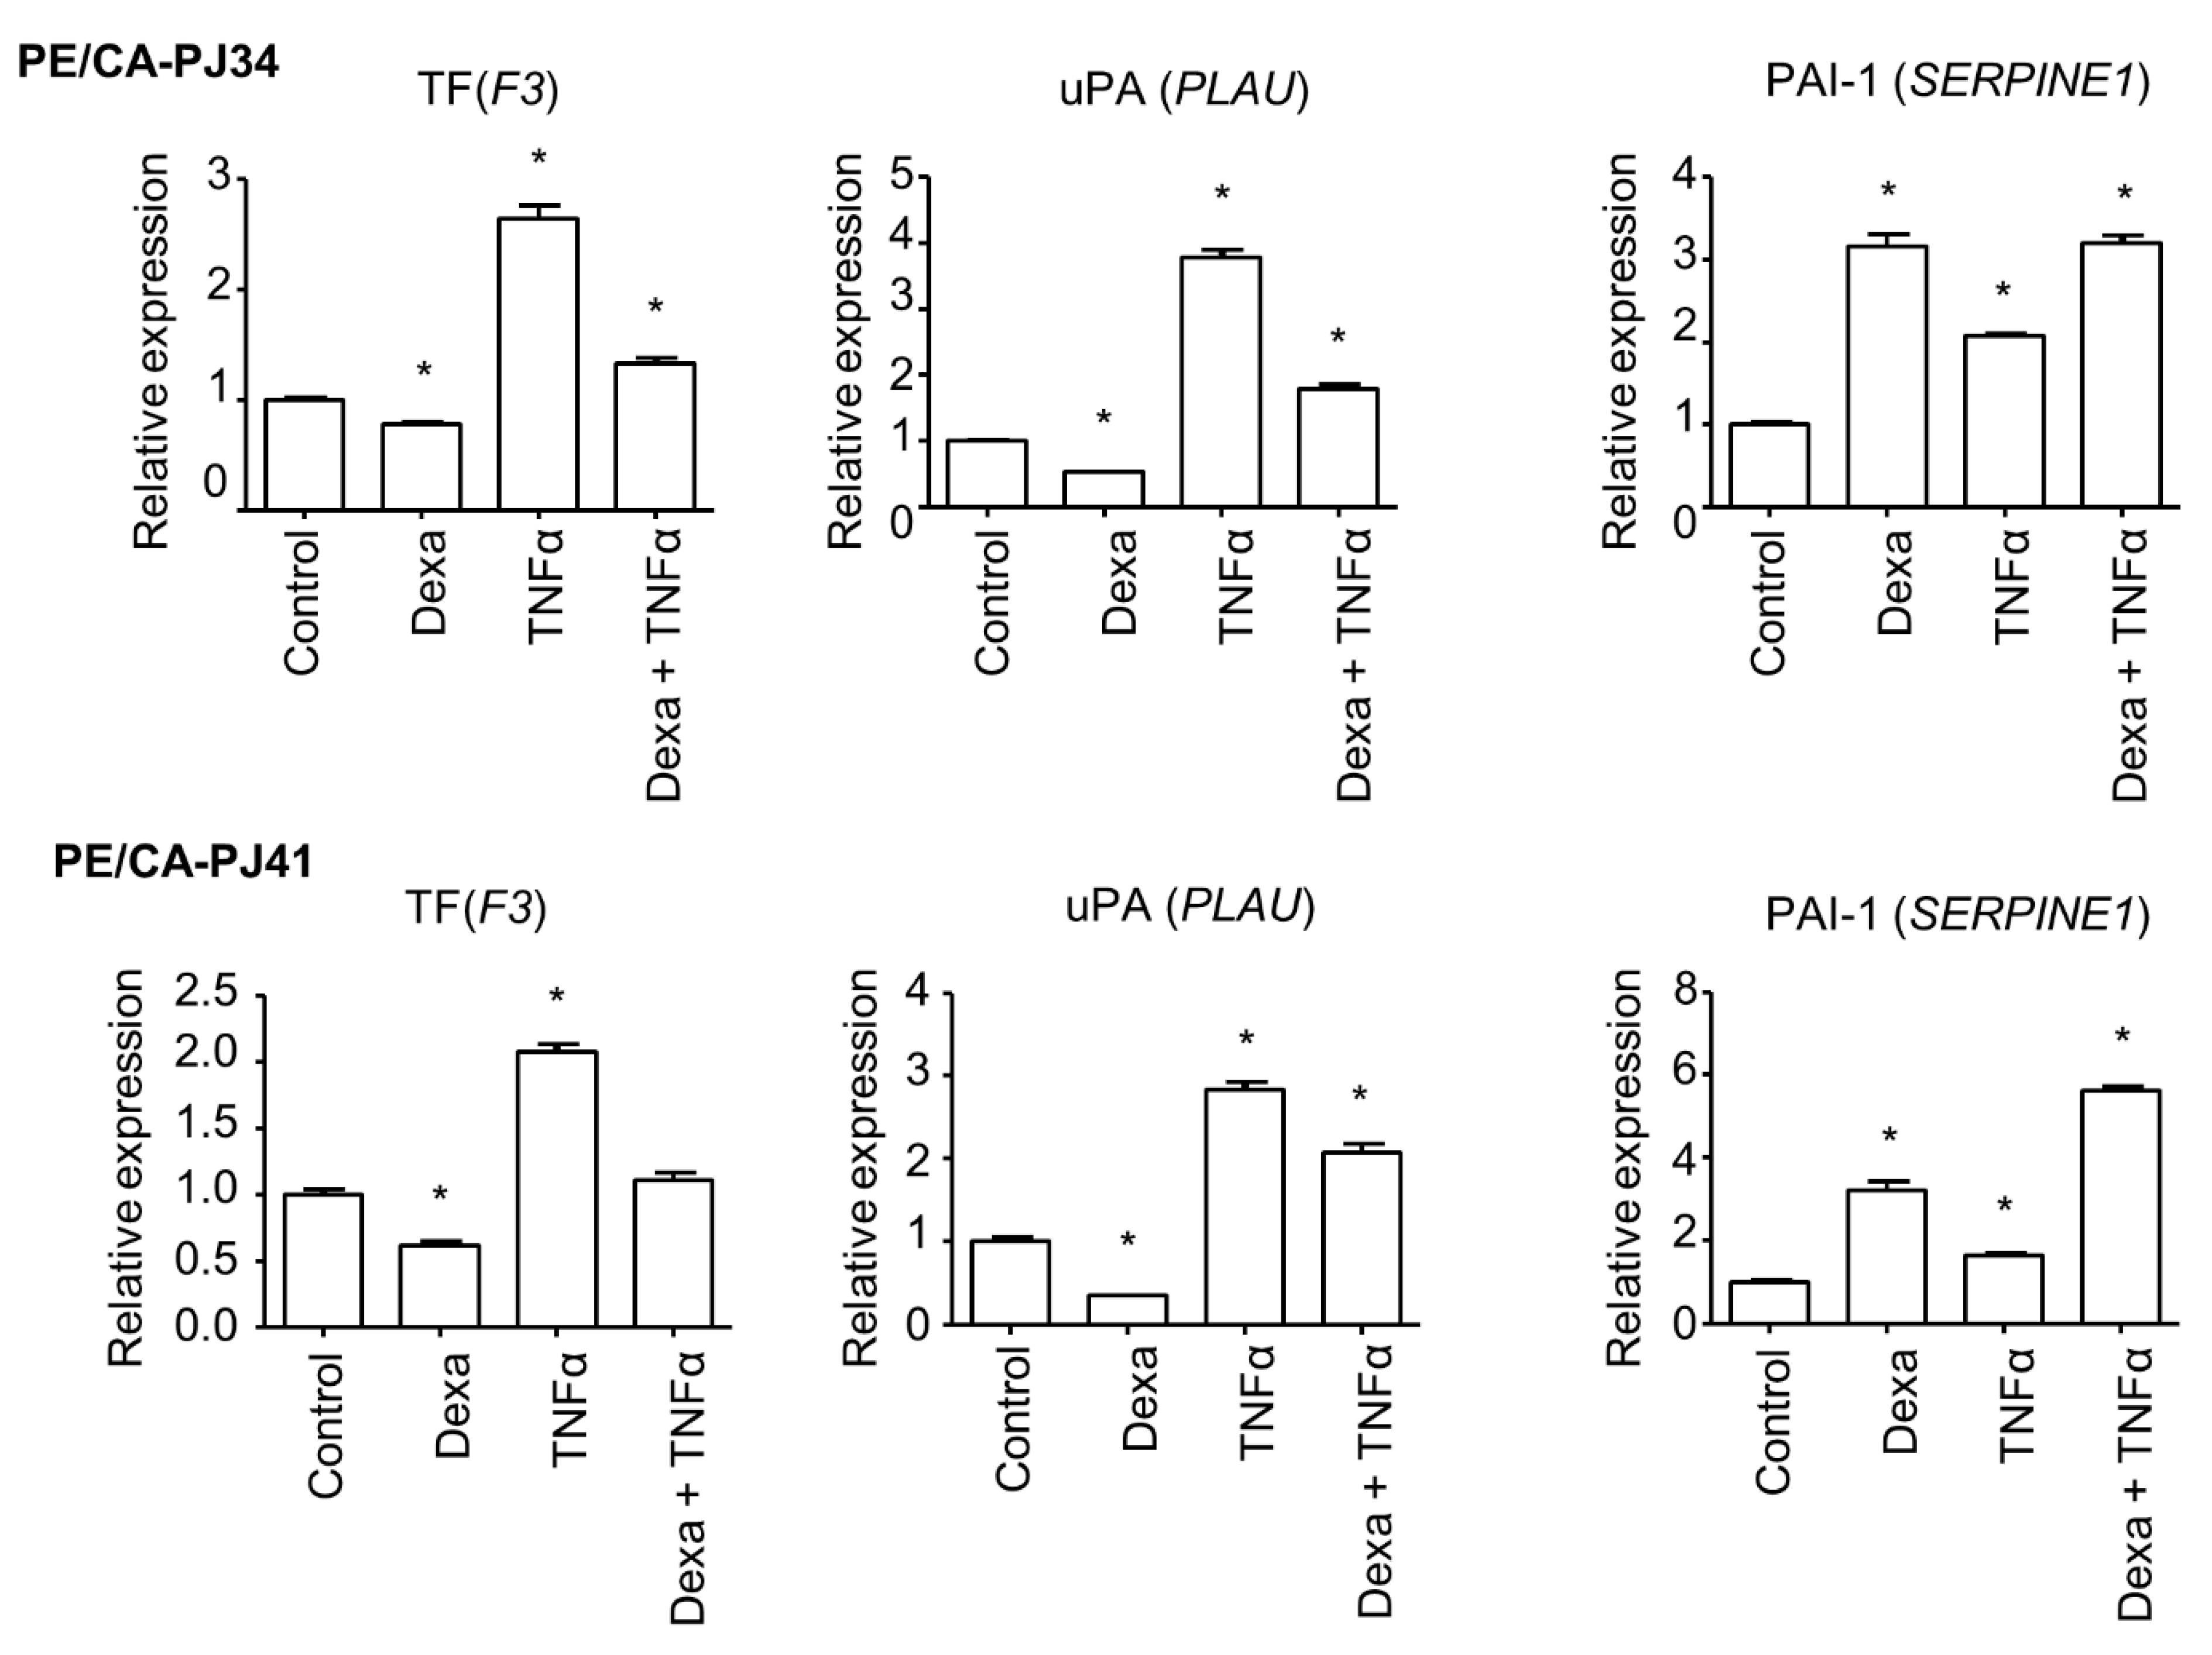
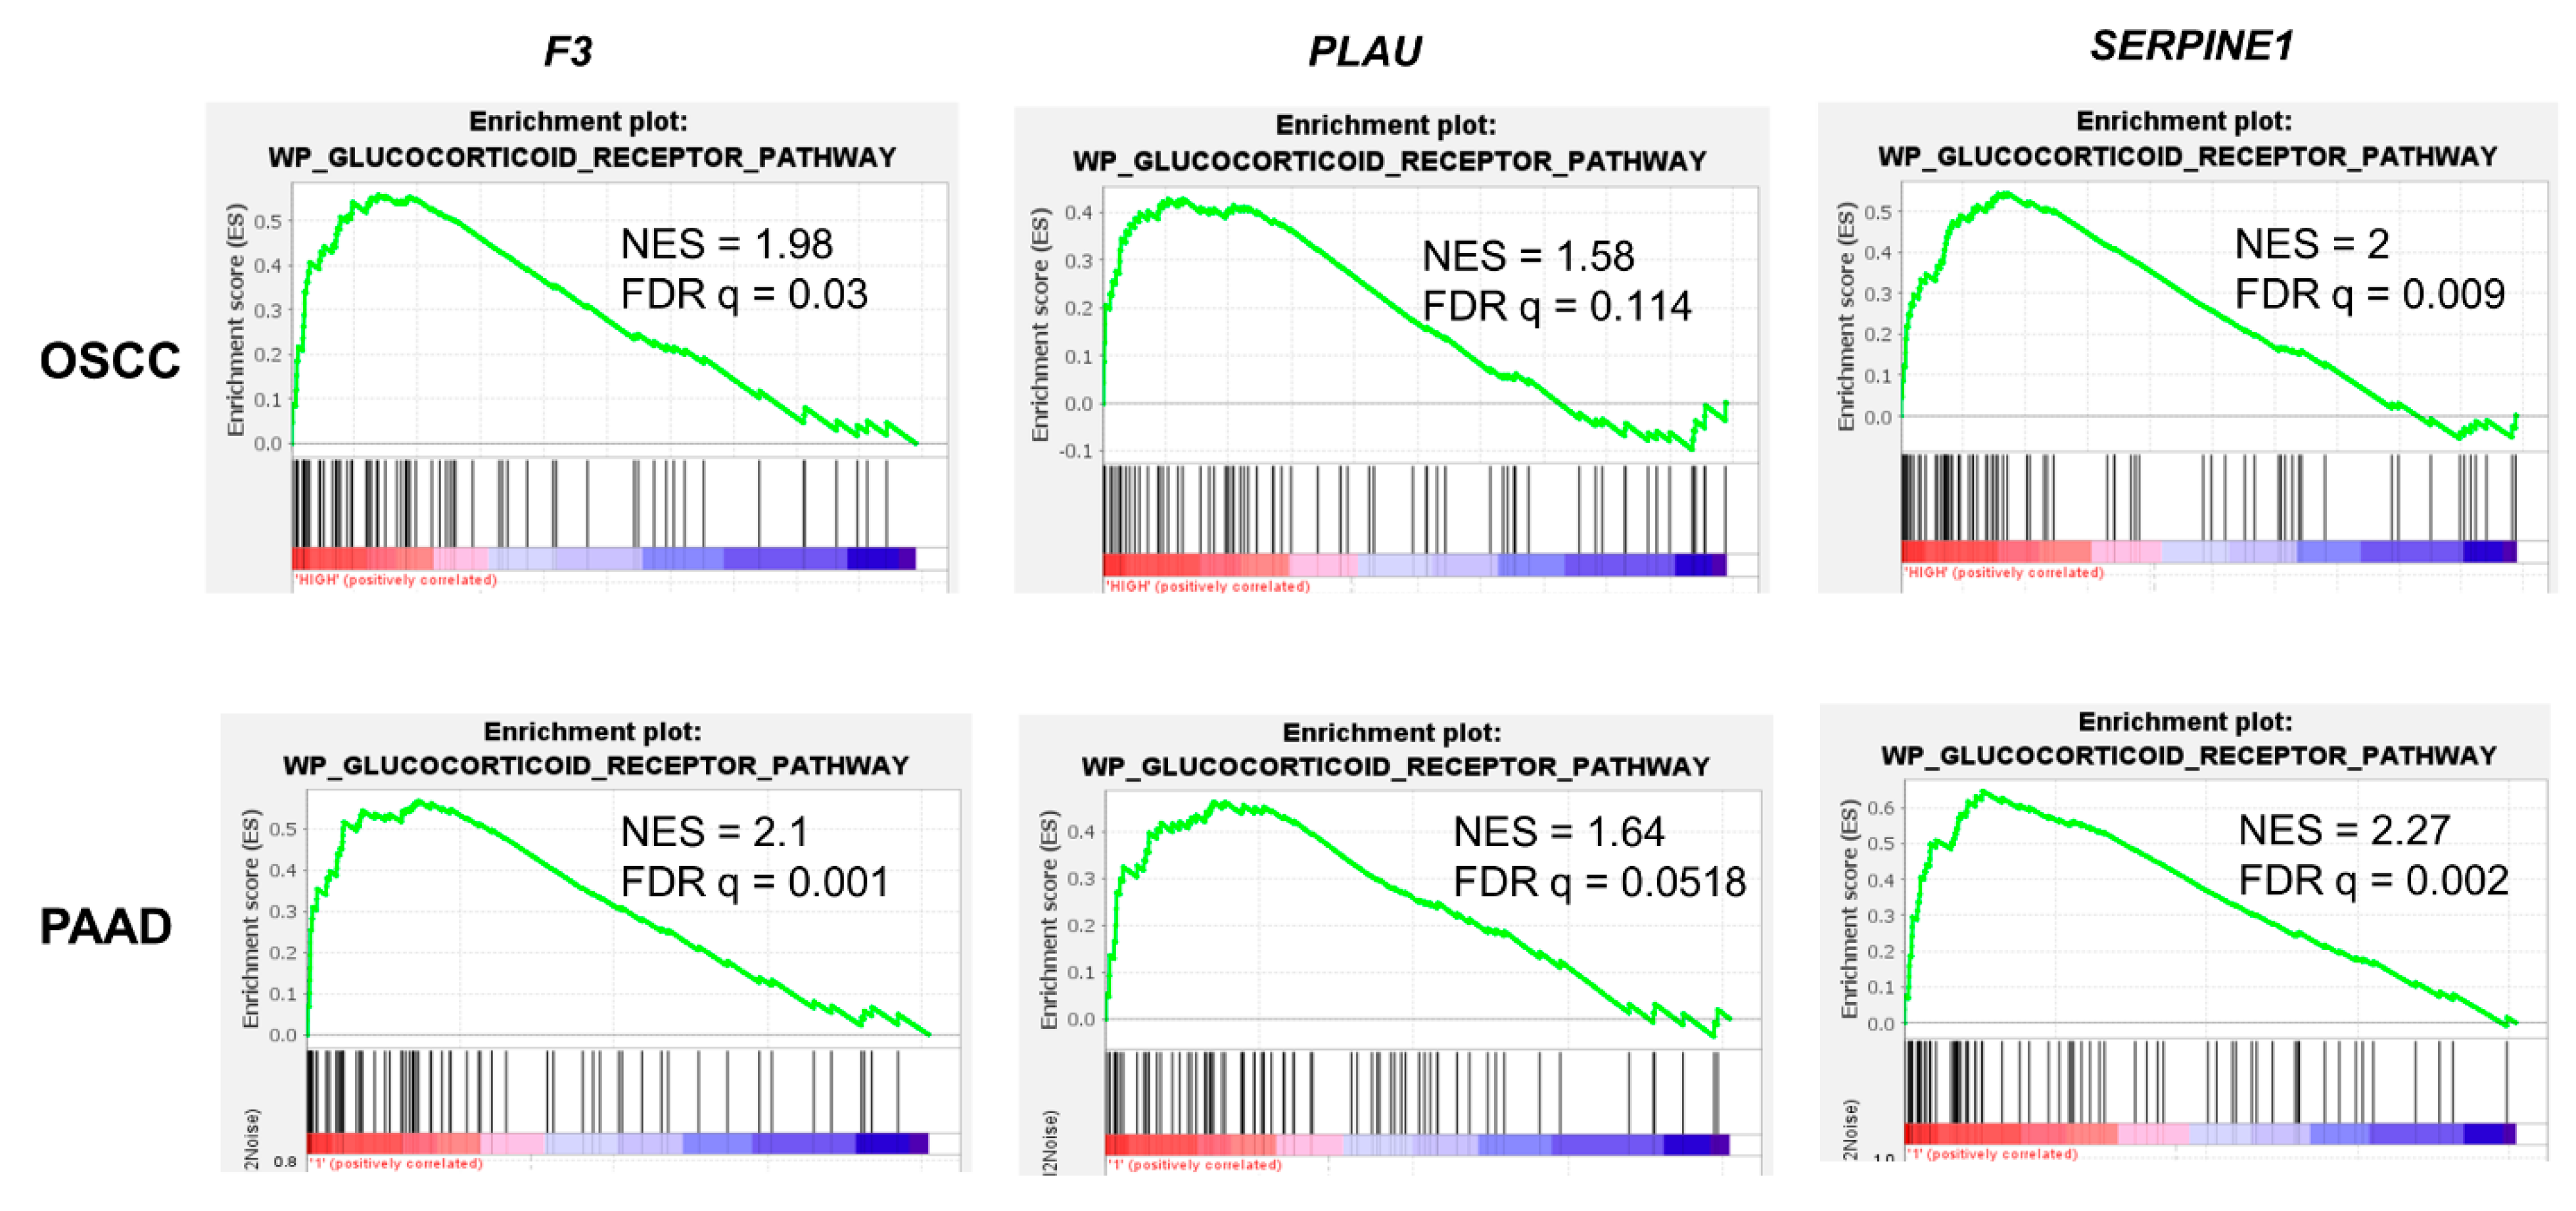
3.1. Transcriptional Regulation of the Coagulome by Glucocorticoids in Cancer Cells
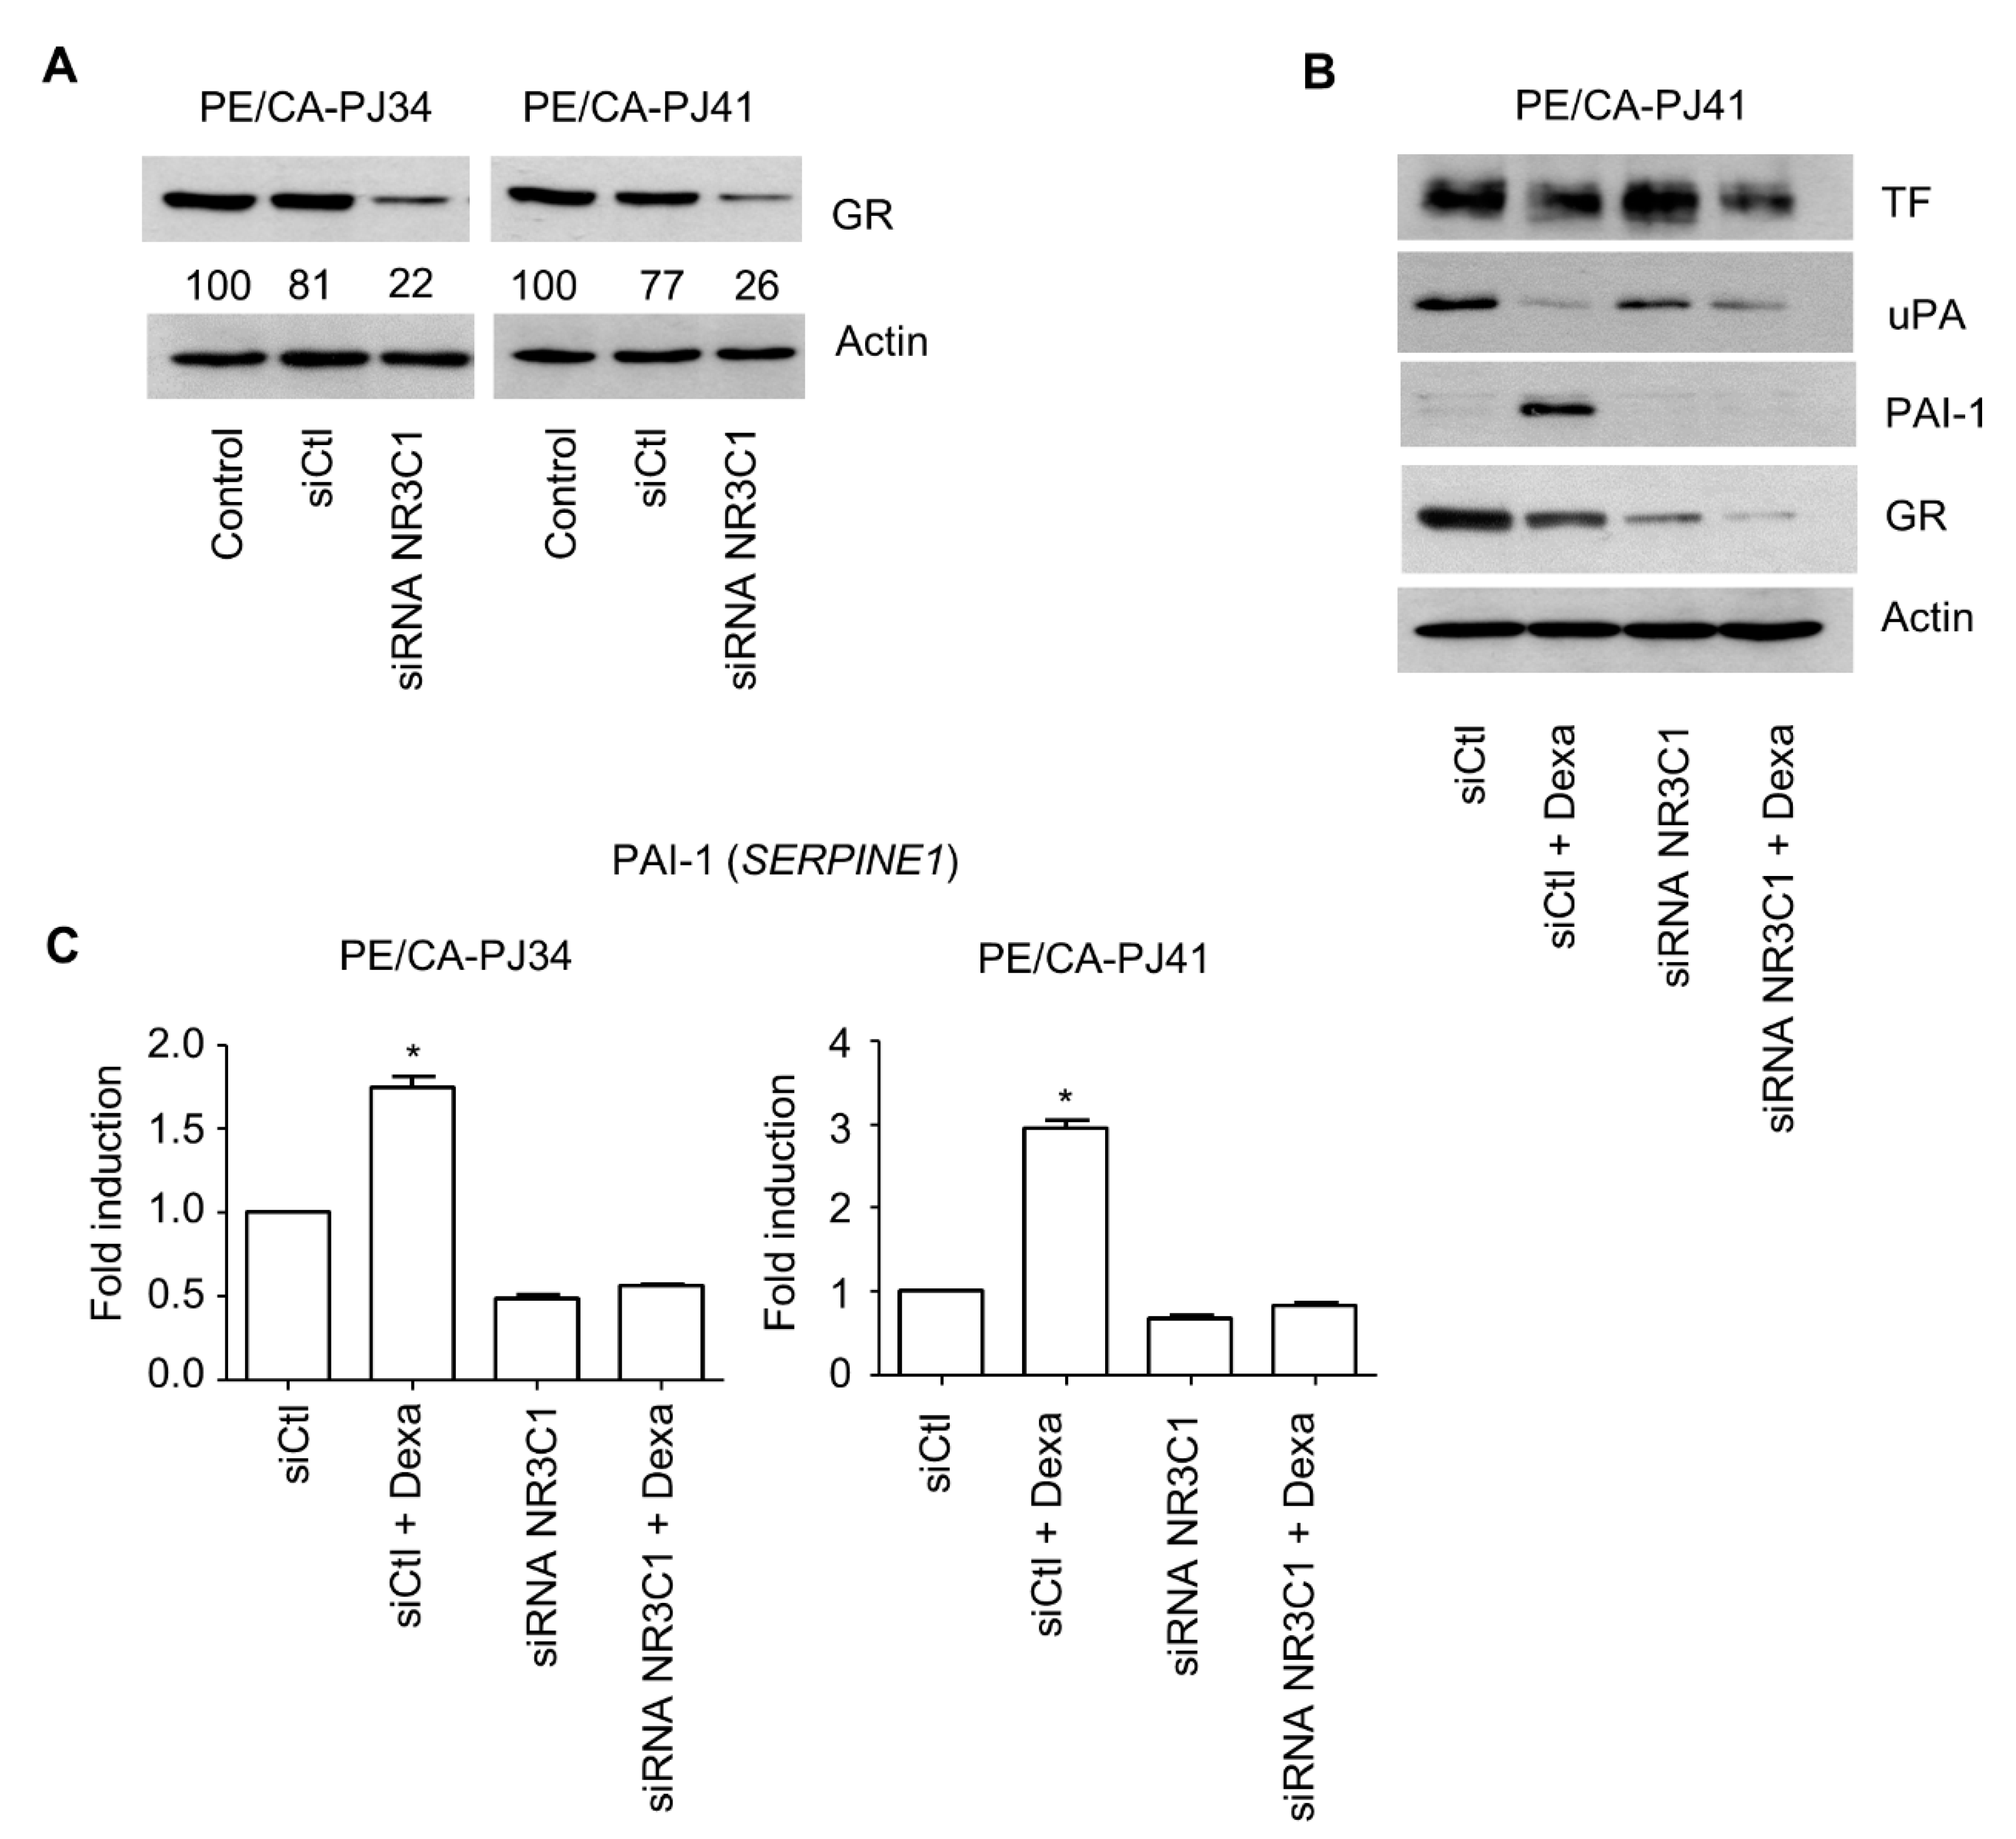
3.2. Role of the GR in the Regulation of PAI-1 Expression
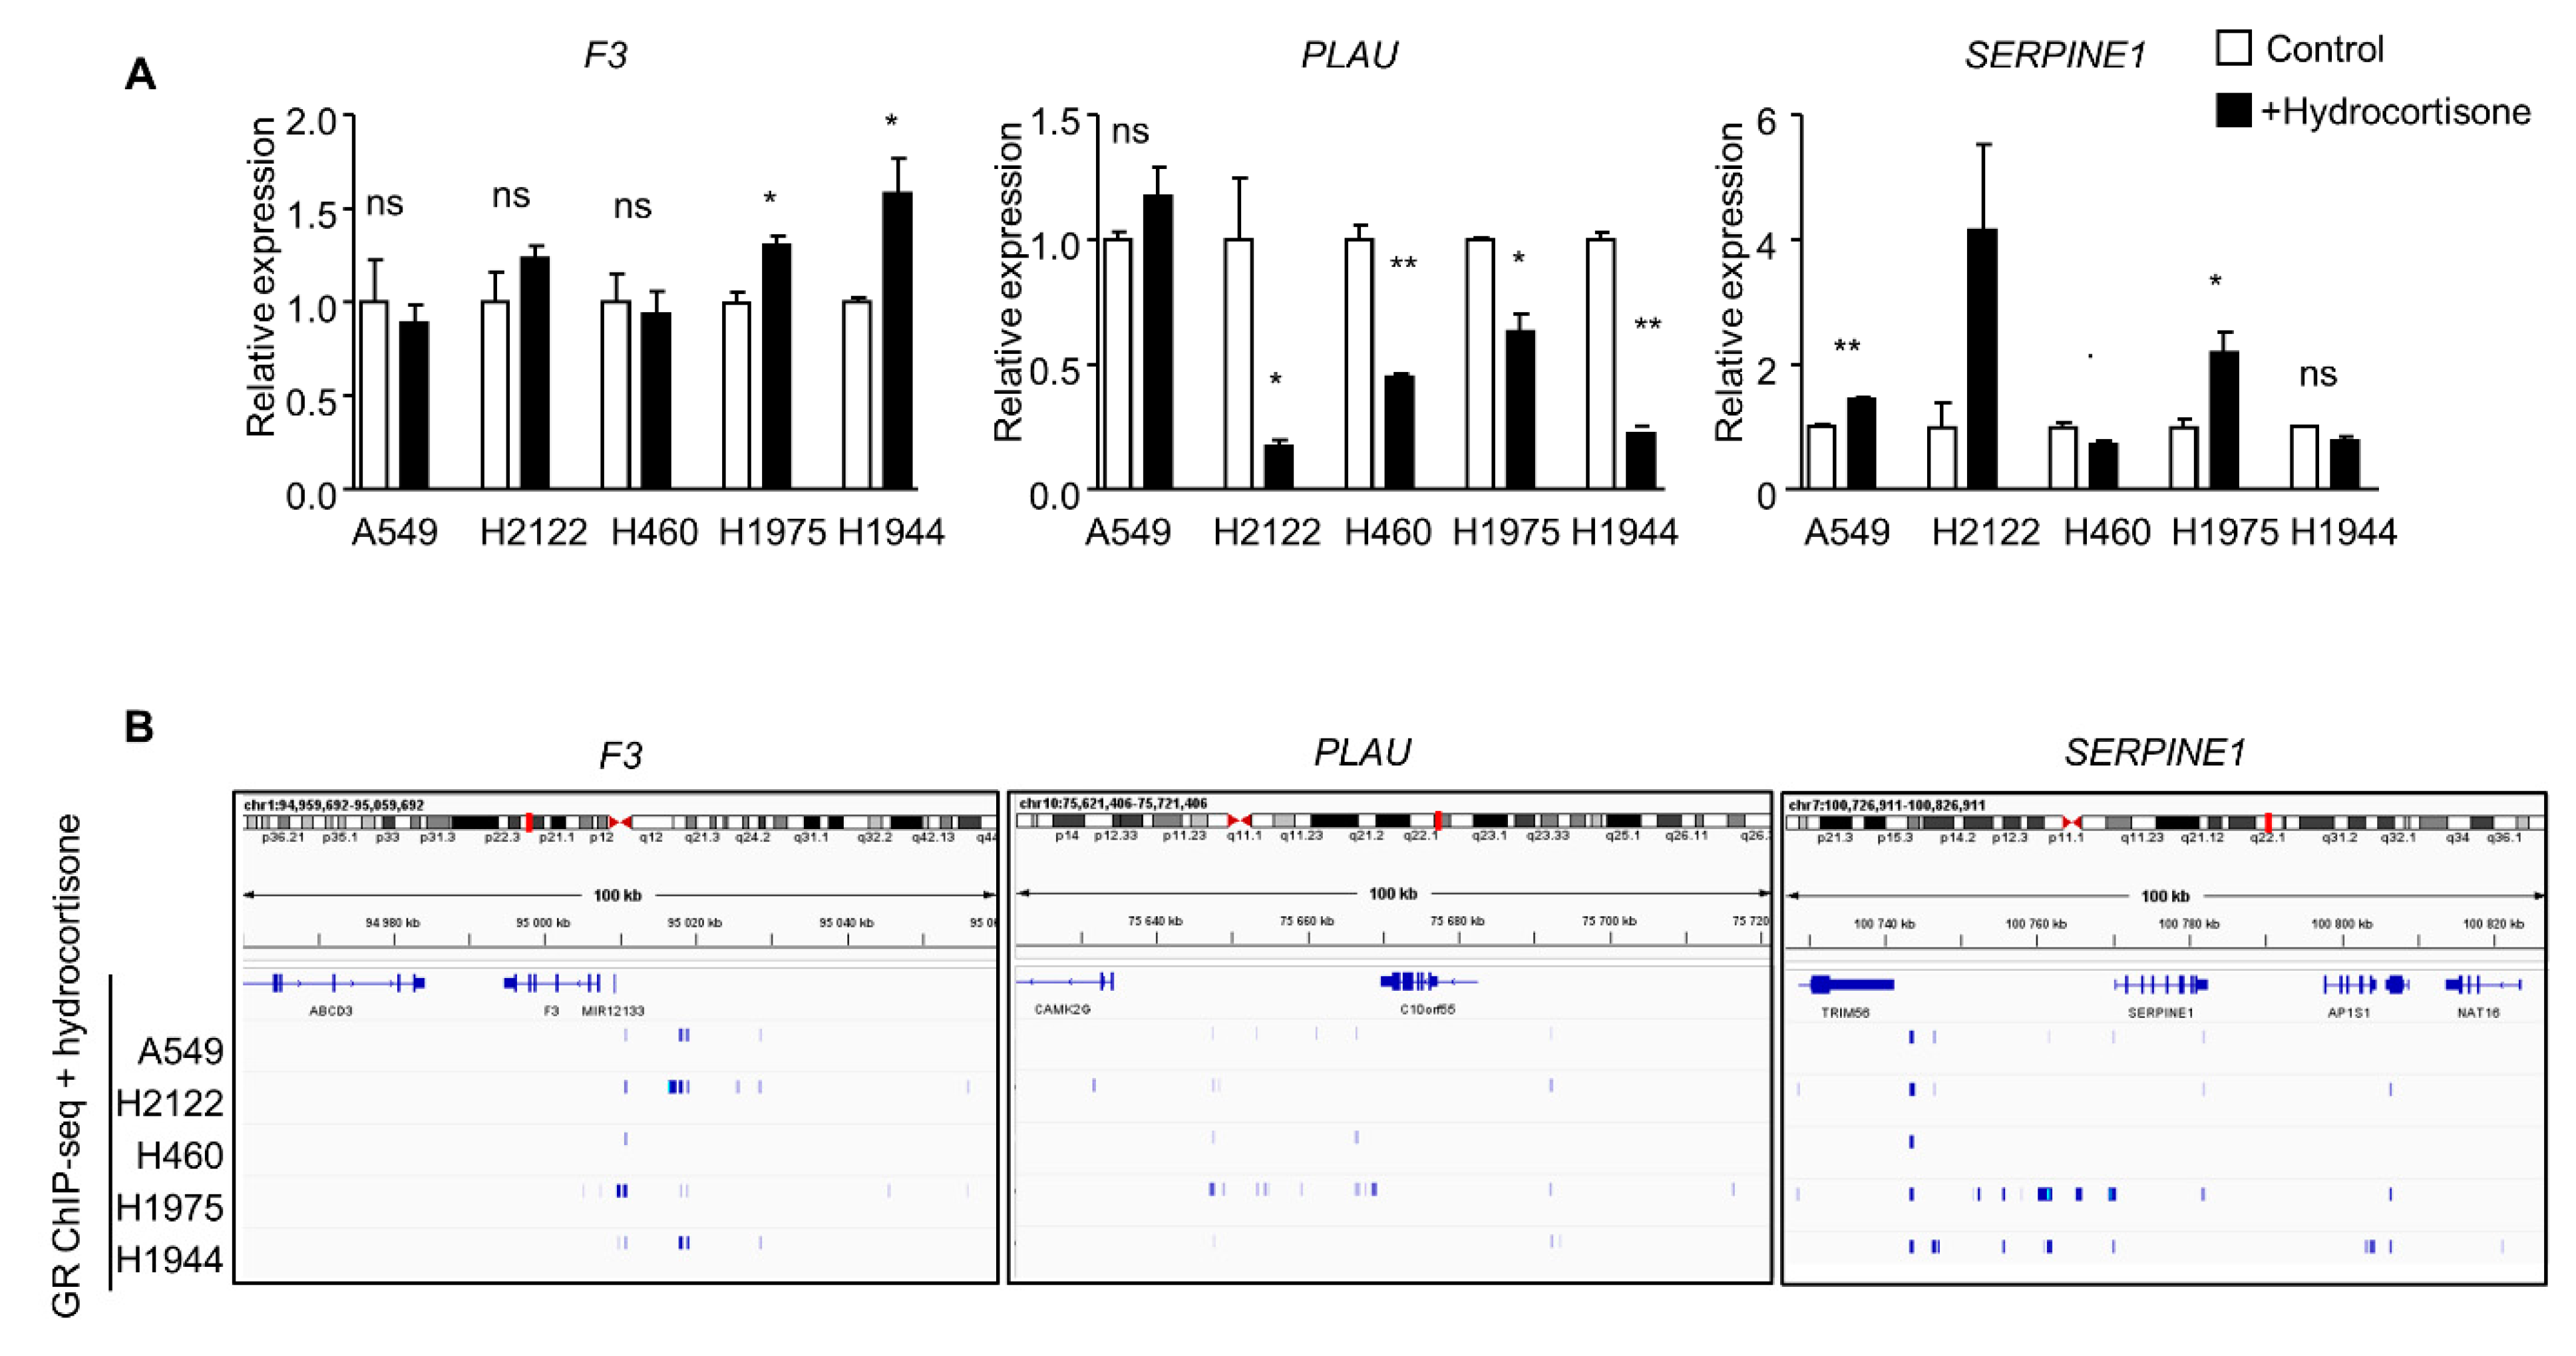
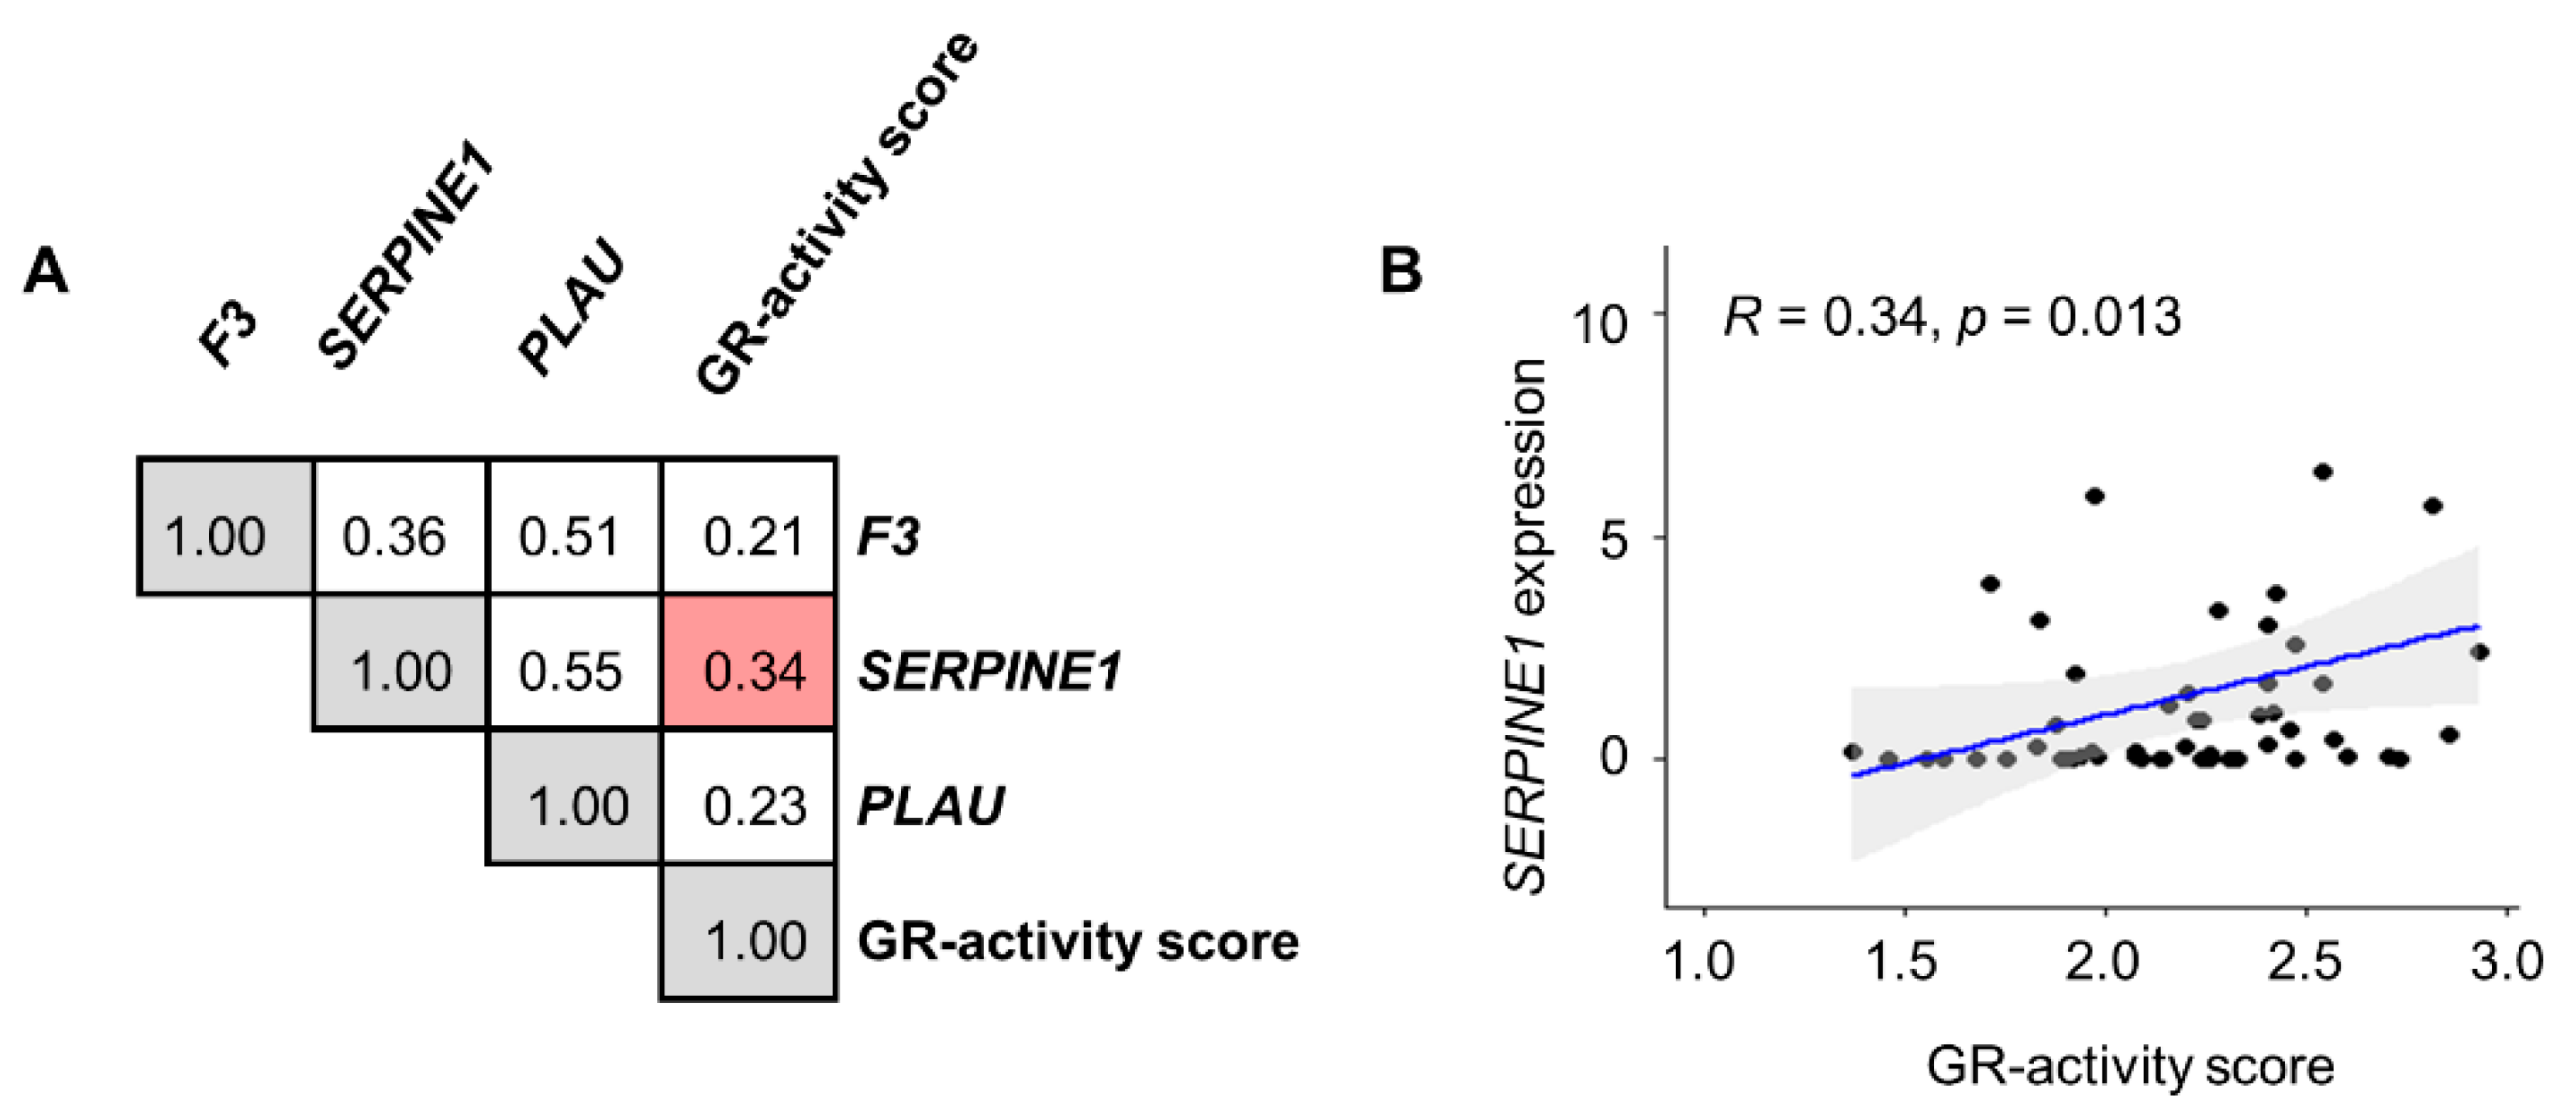
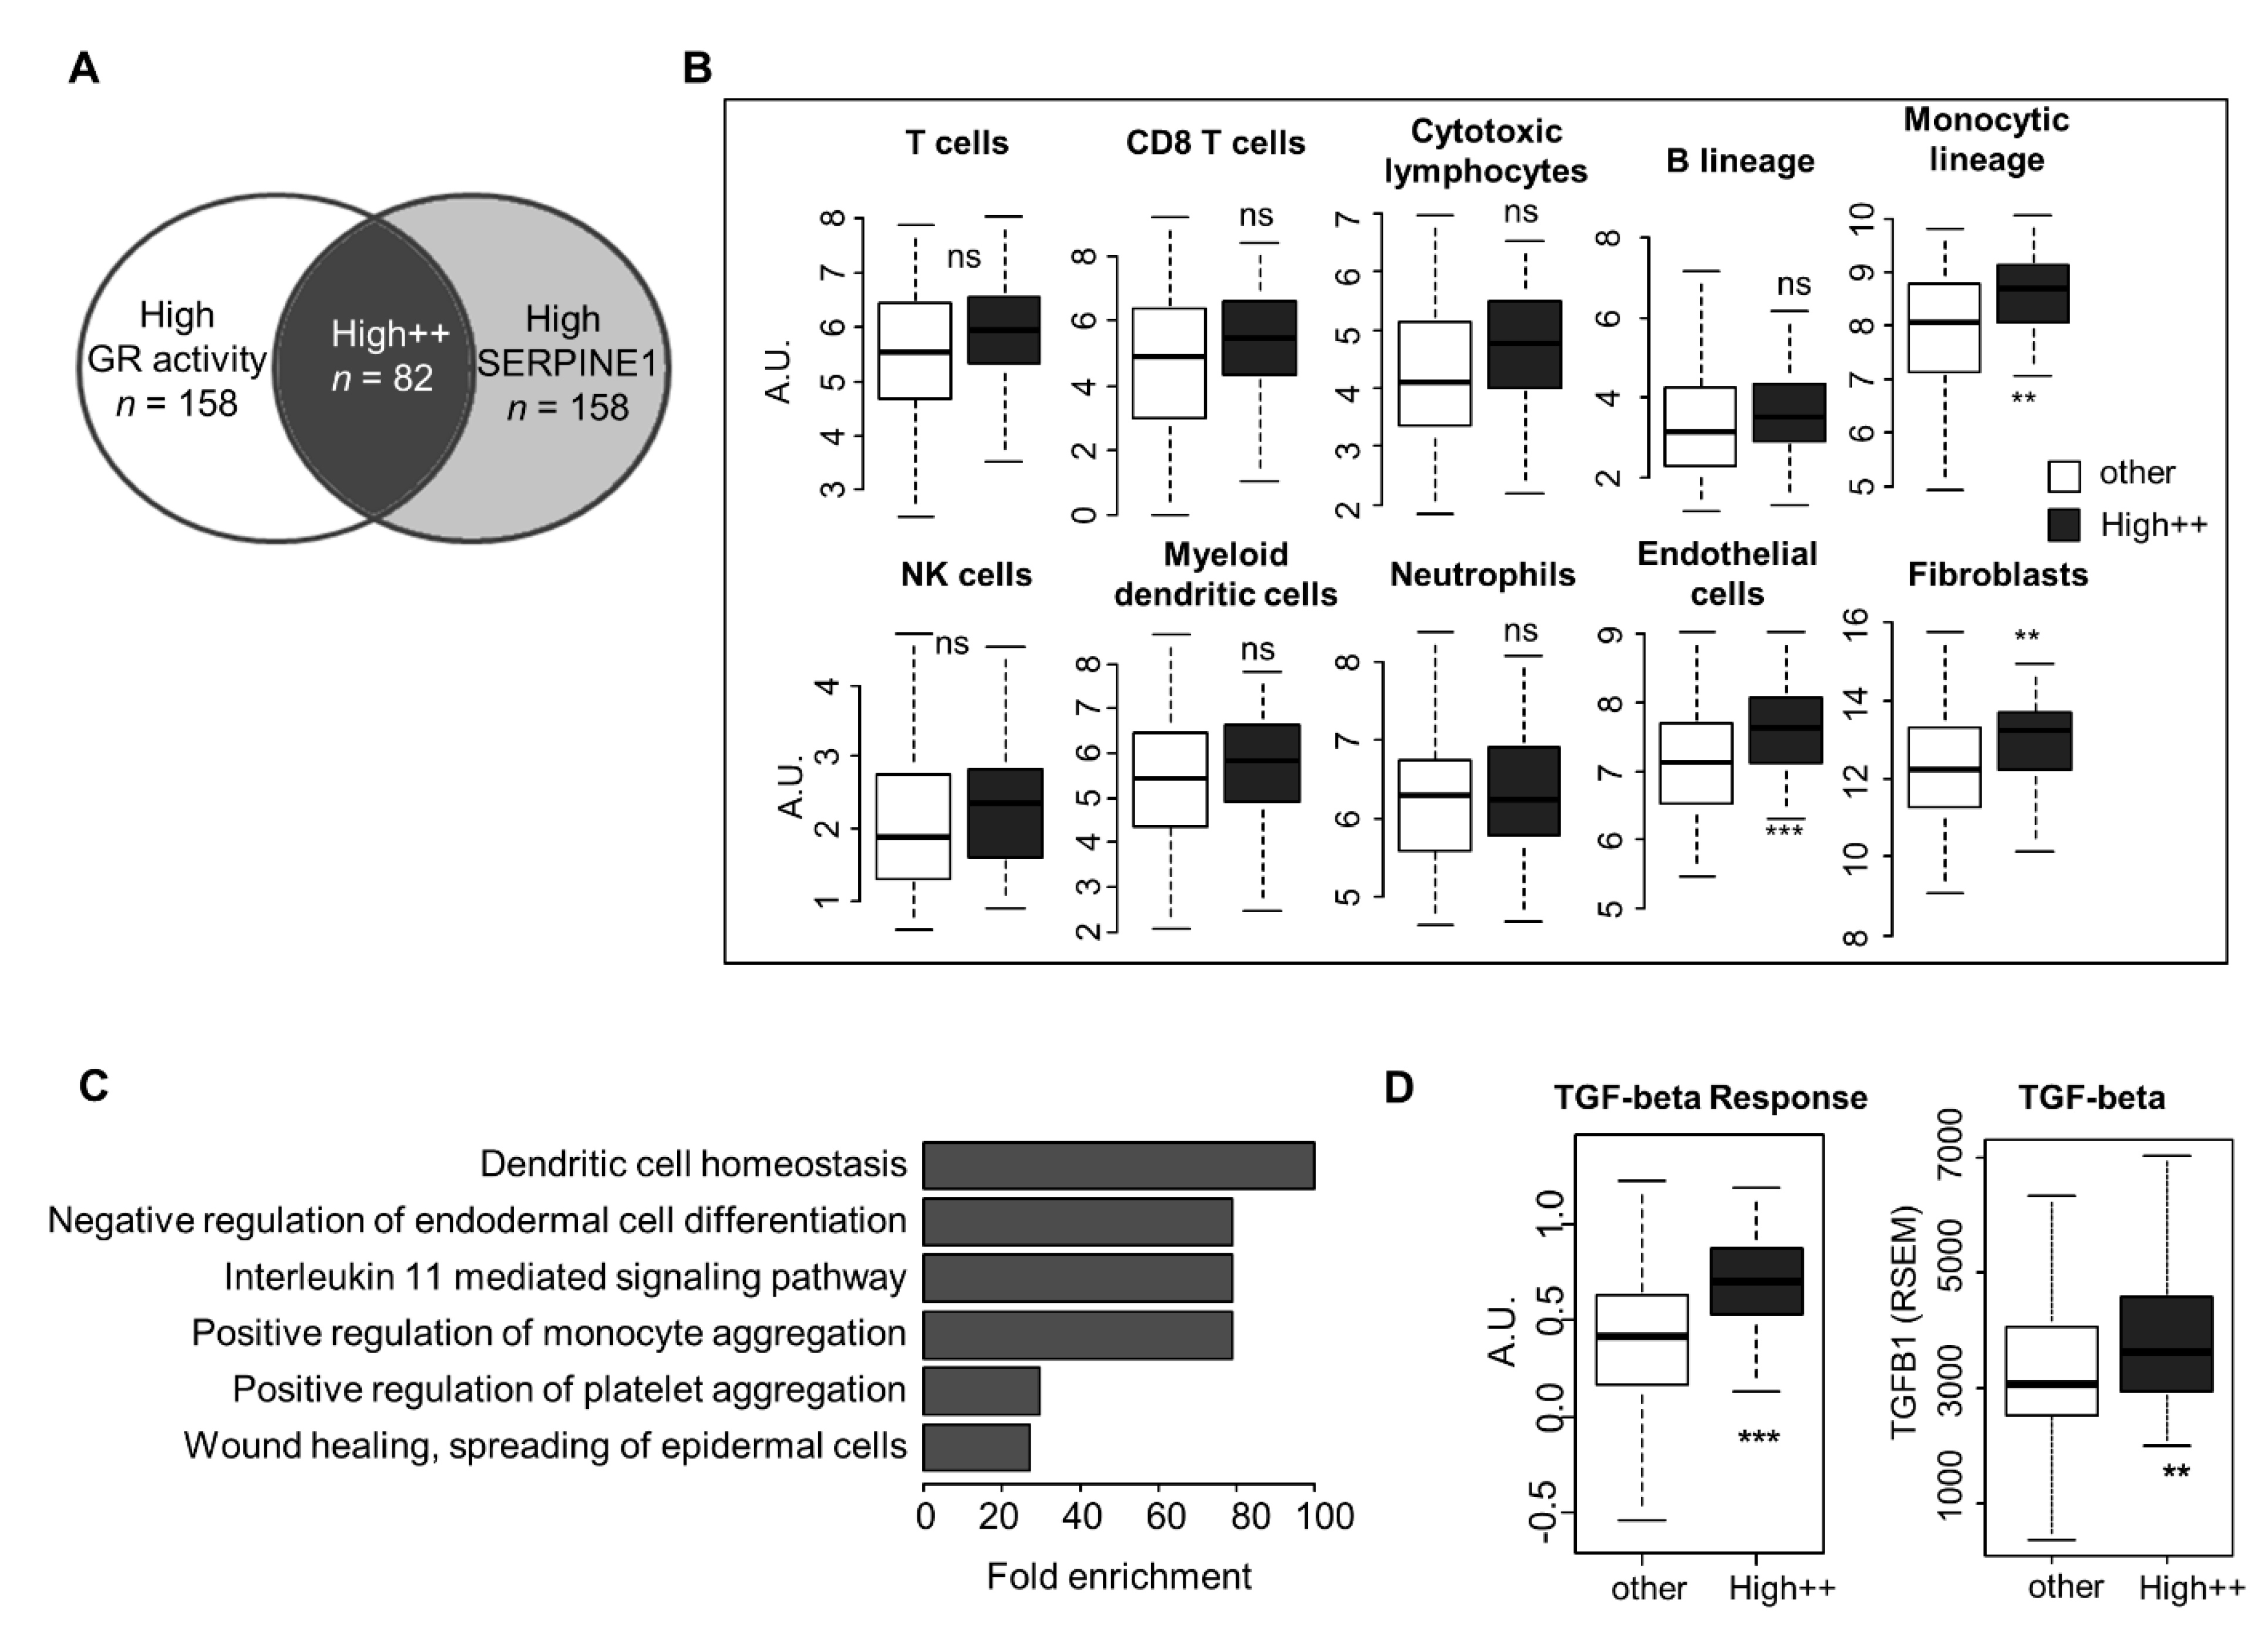
3.3. Transposition to Human Tumors—Microenvironment Characteristics of Tumors with High GR Activity and SERPINE1 Expression
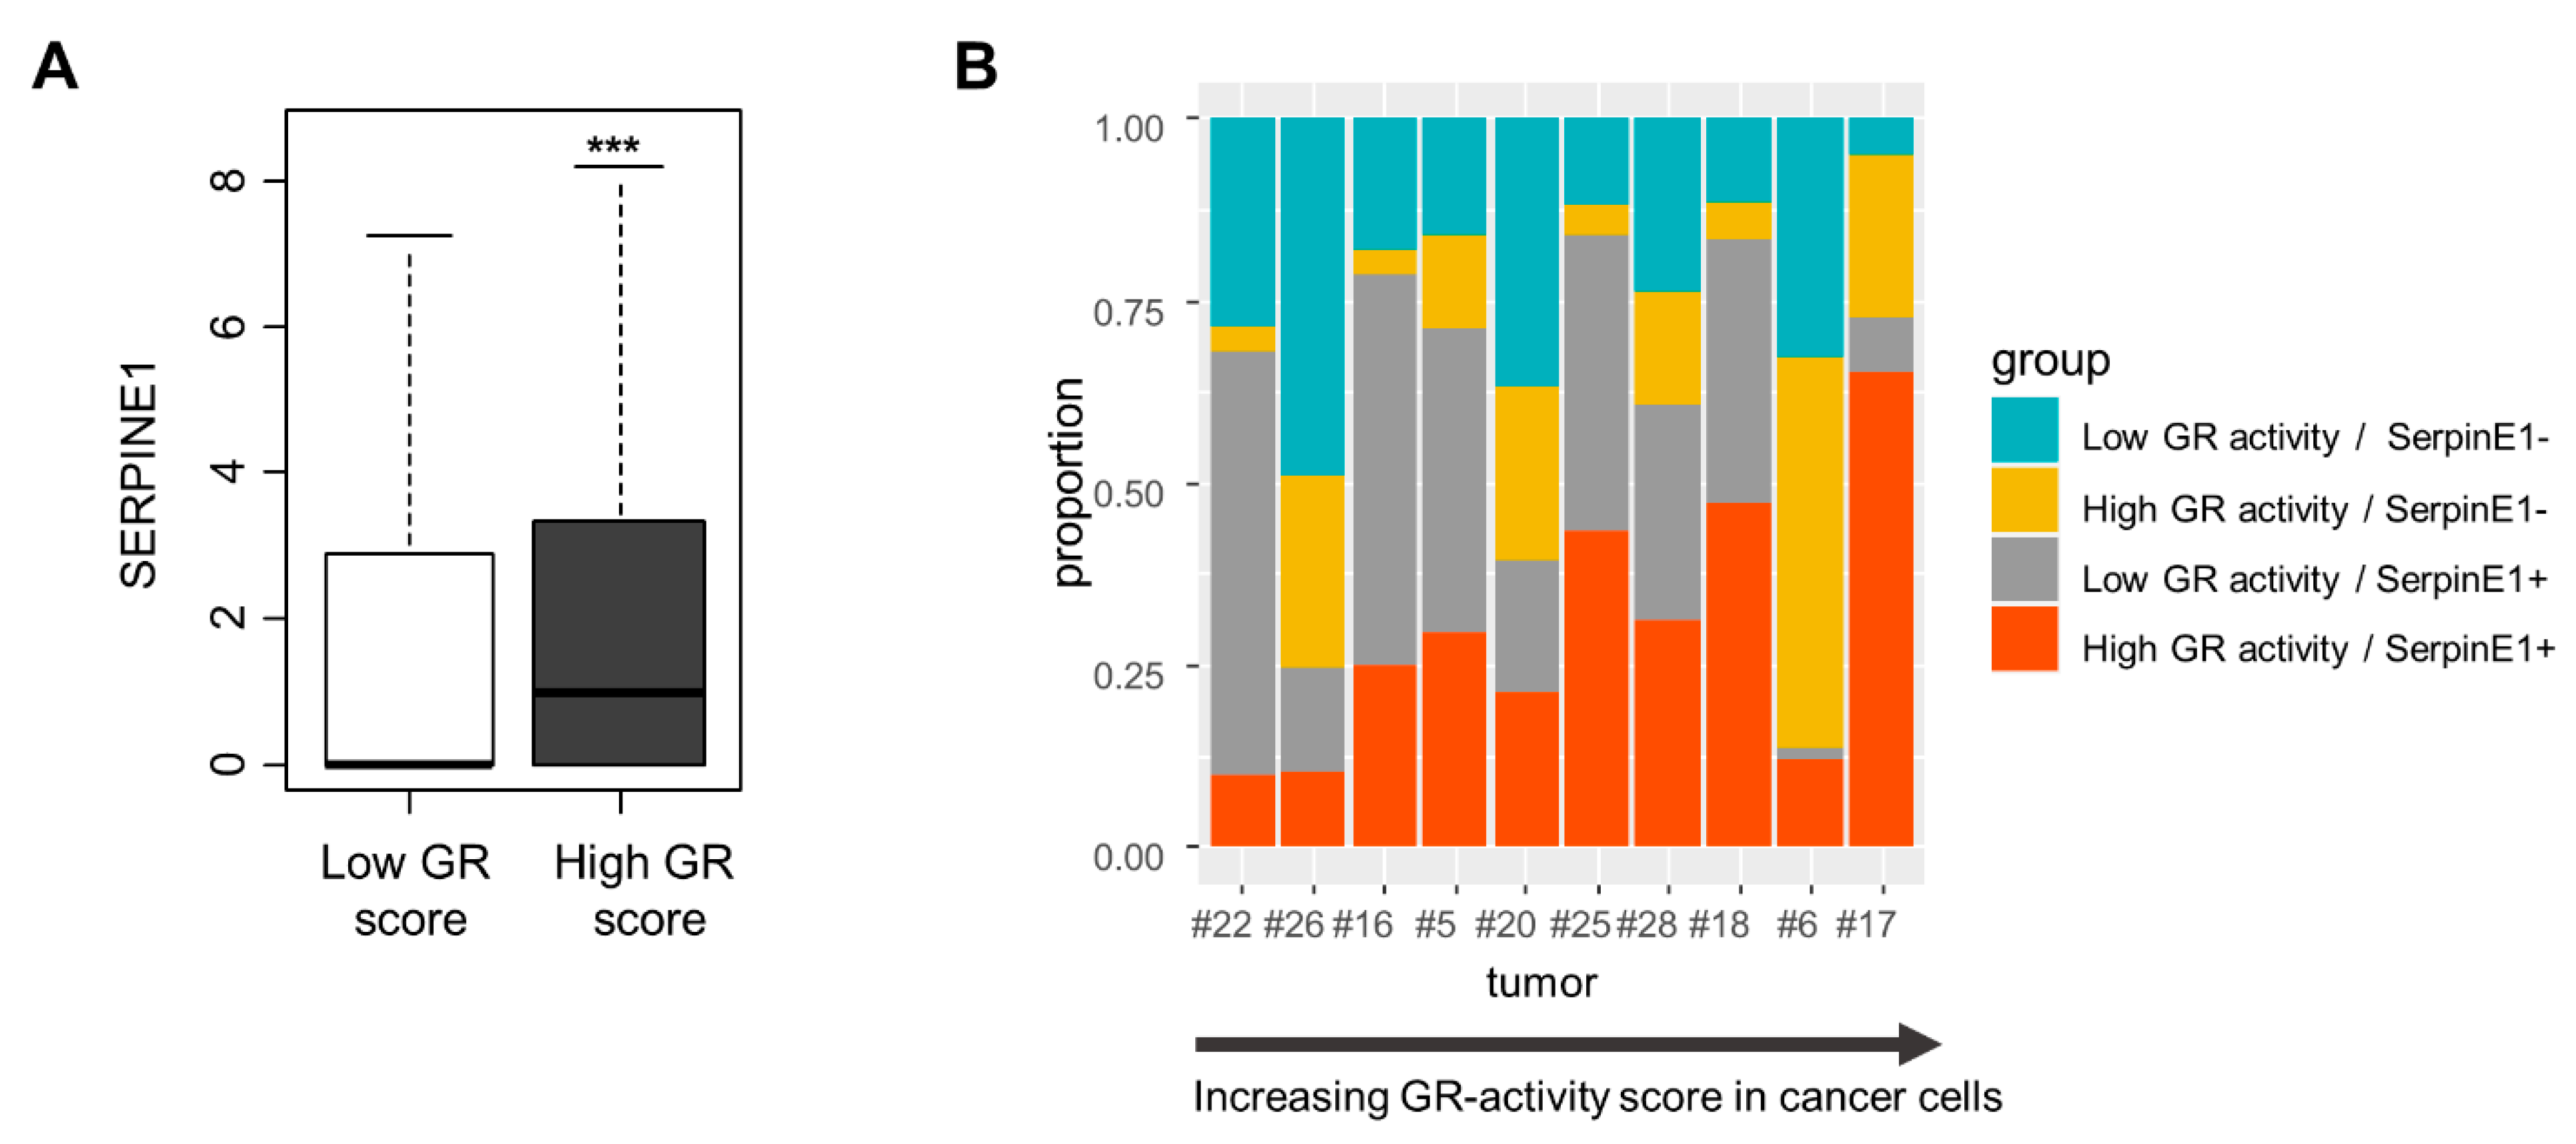
3.4. Single-Cell Analysis of SERPINE1 Regulation by GR
4. Discussion
5. Conclusions
Supplementary Materials
Author Contributions
Funding
Institutional Review Board Statement
Informed Consent Statement
Data Availability Statement
Acknowledgments
Conflicts of Interest
Abbreviations
| ALI | Angiolymphatic invasion; |
| ChIP-seq | Chromatin immunoprecipitation sequencing; |
| DEG | Differentially Expressed Gene; |
| ECS | Extracapsular Spread; |
| FDR | False Discovery Rate; |
| GR | Glucocorticoid Receptor; |
| GO | Gene Ontology; |
| GSEA | Gene Set Enrichment Analysis; |
| OSCC | Oral Squamous Cell Carcinoma; |
| PAAD | Pancreatic Adenocarcinoma; |
| PAI-1 | Plasminogen Activator Inhibitor-1; |
| TCGA | The Cancer Genome Atlas; |
| TGF-β | Transforming Growth Factor-β; |
| TF | Tissue Factor; |
| TME | Tumor Microenvironment; |
| uPA | urokinase-type Plasminogen Activator; |
| VTE | Venous Thromboembolism |
References
- Falanga, A.; Schieppati, F.; Russo, L. Pathophysiology 1. Mechanisms of Thrombosis in Cancer Patients. In Thrombosis and Hemostasis in Cancer; Soff, G., Ed.; Cancer Treatment and Research; Springer International Publishing: Cham, Switzerland, 2019; Volume 179, pp. 11–36. ISBN 978-3-030-20314-6. [Google Scholar]
- Farge, D.; Frere, C.; Connors, J.M.; Ay, C.; Khorana, A.A.; Munoz, A.; Brenner, B.; Kakkar, A.; Rafii, H.; Solymoss, S.; et al. 2019 International Clinical Practice Guidelines for the Treatment and Prophylaxis of Venous Thromboembolism in Patients with Cancer. Lancet Oncol. 2019, 20, e566–e581. [Google Scholar] [CrossRef] [PubMed]
- Khorana, A.A.; Cohen, A.T.; Carrier, M.; Meyer, G.; Pabinger, I.; Kavan, P.; Wells, P. Prevention of Venous Thromboembolism in Ambulatory Patients with Cancer. ESMO Open 2020, 5, e000948. [Google Scholar] [CrossRef]
- Rak, J.; Yu, J.L.; Luyendyk, J.; Mackman, N. Oncogenes, Trousseau Syndrome, and Cancer-Related Changes in the Coagulome of Mice and Humans. Cancer Res. 2006, 66, 10643–10646. [Google Scholar] [CrossRef]
- Galmiche, A.; Rak, J.; Roumenina, L.T.; Saidak, Z. Coagulome and the Tumor Microenvironment: An Actionable Interplay. Trends Cancer 2022, 8, 369–383. [Google Scholar] [CrossRef] [PubMed]
- Lottin, M.; Soudet, S.; Fercot, J.; Racine, F.; Demagny, J.; Bettoni, J.; Chatelain, D.; Sevestre, M.-A.; Mammeri, Y.; Lamuraglia, M.; et al. Molecular Landscape of the Coagulome of Oral Squamous Cell Carcinoma. Cancers 2022, 14, 460. [Google Scholar] [CrossRef]
- Saidak, Z.; Soudet, S.; Lottin, M.; Salle, V.; Sevestre, M.-A.; Clatot, F.; Galmiche, A. A Pan-Cancer Analysis of the Human Tumor Coagulome and Its Link to the Tumor Immune Microenvironment. Cancer Immunol. Immunother. CII 2021, 70, 923–933. [Google Scholar] [CrossRef]
- Anderson, N.M.; Simon, M.C. The Tumor Microenvironment. Curr. Biol. 2020, 30, R921–R925. [Google Scholar] [CrossRef] [PubMed]
- Bauer, A.T.; Gorzelanny, C.; Gebhardt, C.; Pantel, K.; Schneider, S.W. Interplay between Coagulation and Inflammation in Cancer: Limitations and Therapeutic Opportunities. Cancer Treat. Rev. 2022, 102, 102322. [Google Scholar] [CrossRef] [PubMed]
- Chow, L.Q.M. Head and Neck Cancer. N. Engl. J. Med. 2020, 382, 60–72. [Google Scholar] [CrossRef]
- Haen, P.; Mege, D.; Crescence, L.; Dignat-George, F.; Dubois, C.; Panicot-Dubois, L. Thrombosis Risk Associated with Head and Neck Cancer: A Review. Int. J. Mol. Sci. 2019, 20, 2838. [Google Scholar] [CrossRef]
- Caruntu, A.; Moraru, L.; Lupu, M.; Taubner, L.; Caruntu, C.; Tanase, C. The Hidden Treasures of Preoperative Blood Assessment in Oral Cancer: A Potential Source of Biomarkers. Cancers 2021, 13, 4475. [Google Scholar] [CrossRef] [PubMed]
- Liang, Y.-J.; Mei, X.-Y.; Zeng, B.; Zhang, S.-E.; Yang, L.; Lao, X.-M.; Liao, G.-Q. Prognostic Role of Preoperative D-Dimer, Fibrinogen and Platelet Levels in Patients with Oral Squamous Cell Carcinoma. BMC Cancer 2021, 21, 122. [Google Scholar] [CrossRef] [PubMed]
- Kadmiel, M.; Cidlowski, J.A. Glucocorticoid Receptor Signaling in Health and Disease. Trends Pharmacol. Sci. 2013, 34, 518–530. [Google Scholar] [CrossRef] [PubMed]
- Giles, A.J.; Hutchinson, M.-K.N.D.; Sonnemann, H.M.; Jung, J.; Fecci, P.E.; Ratnam, N.M.; Zhang, W.; Song, H.; Bailey, R.; Davis, D.; et al. Dexamethasone-Induced Immunosuppression: Mechanisms and Implications for Immunotherapy. J. Immunother. Cancer 2018, 6, 51. [Google Scholar] [CrossRef] [PubMed]
- Weikum, E.R.; Knuesel, M.T.; Ortlund, E.A.; Yamamoto, K.R. Glucocorticoid Receptor Control of Transcription: Precision and Plasticity via Allostery. Nat. Rev. Mol. Cell Biol. 2017, 18, 159–174. [Google Scholar] [CrossRef]
- Azher, S.; Azami, O.; Amato, C.; McCullough, M.; Celentano, A.; Cirillo, N. The Non-Conventional Effects of Glucocorticoids in Cancer. J. Cell. Physiol. 2016, 231, 2368–2373. [Google Scholar] [CrossRef] [PubMed]
- Jensen, A.Ø.; Thomsen, H.F.; Engebjerg, M.C.; Olesen, A.B.; Friis, S.; Karagas, M.R.; Sørensen, H.T. Use of Oral Glucocorticoids and Risk of Skin Cancer and Non-Hodgkin’s Lymphoma: A Population-Based Case-Control Study. Br. J. Cancer 2009, 100, 200–205. [Google Scholar] [CrossRef] [PubMed]
- McNamara, K.M.; Kannai, A.; Sasano, H. Possible Roles for Glucocorticoid Signalling in Breast Cancer. Mol. Cell. Endocrinol. 2018, 466, 38–50. [Google Scholar] [CrossRef]
- Abduljabbar, R.; Negm, O.H.; Lai, C.-F.; Jerjees, D.A.; Al-Kaabi, M.; Hamed, M.R.; Tighe, P.J.; Buluwela, L.; Mukherjee, A.; Green, A.R.; et al. Clinical and Biological Significance of Glucocorticoid Receptor (GR) Expression in Breast Cancer. Breast Cancer Res. Treat. 2015, 150, 335–346. [Google Scholar] [CrossRef]
- Arora, V.K.; Schenkein, E.; Murali, R.; Subudhi, S.K.; Wongvipat, J.; Balbas, M.D.; Shah, N.; Cai, L.; Efstathiou, E.; Logothetis, C.; et al. Glucocorticoid Receptor Confers Resistance to Antiandrogens by Bypassing Androgen Receptor Blockade. Cell 2013, 155, 1309–1322. [Google Scholar] [CrossRef]
- Chen, Z.; Lan, X.; Wu, D.; Sunkel, B.; Ye, Z.; Huang, J.; Liu, Z.; Clinton, S.K.; Jin, V.X.; Wang, Q. Ligand-Dependent Genomic Function of Glucocorticoid Receptor in Triple-Negative Breast Cancer. Nat. Commun. 2015, 6, 8323. [Google Scholar] [CrossRef]
- Obradović, M.M.S.; Hamelin, B.; Manevski, N.; Couto, J.P.; Sethi, A.; Coissieux, M.-M.; Münst, S.; Okamoto, R.; Kohler, H.; Schmidt, A.; et al. Glucocorticoids Promote Breast Cancer Metastasis. Nature 2019, 567, 540–544. [Google Scholar] [CrossRef] [PubMed]
- Pan, D.; Kocherginsky, M.; Conzen, S.D. Activation of the Glucocorticoid Receptor Is Associated with Poor Prognosis in Estrogen Receptor-Negative Breast Cancer. Cancer Res. 2011, 71, 6360–6370. [Google Scholar] [CrossRef] [PubMed]
- West, D.C.; Kocherginsky, M.; Tonsing-Carter, E.Y.; Dolcen, D.N.; Hosfield, D.J.; Lastra, R.R.; Sinnwell, J.P.; Thompson, K.J.; Bowie, K.R.; Harkless, R.V.; et al. Discovery of a Glucocorticoid Receptor (GR) Activity Signature Using Selective GR Antagonism in ER-Negative Breast Cancer. Clin. Cancer Res. Off. J. Am. Assoc. Cancer Res. 2018, 24, 3433–3446. [Google Scholar] [CrossRef] [PubMed]
- Pan, C.; Kang, J.; Hwang, J.S.; Li, J.; Boese, A.C.; Wang, X.; Yang, L.; Boggon, T.J.; Chen, G.Z.; Saba, N.F.; et al. Cisplatin-Mediated Activation of Glucocorticoid Receptor Induces Platinum Resistance via MAST1. Nat. Commun. 2021, 12, 4960. [Google Scholar] [CrossRef]
- Prekovic, S.; Schuurman, K.; Mayayo-Peralta, I.; Manjón, A.G.; Buijs, M.; Yavuz, S.; Wellenstein, M.D.; Barrera, A.; Monkhorst, K.; Huber, A.; et al. Glucocorticoid Receptor Triggers a Reversible Drug-Tolerant Dormancy State with Acquired Therapeutic Vulnerabilities in Lung Cancer. Nat. Commun. 2021, 12, 4360. [Google Scholar] [CrossRef]
- Galmiche, A.; Ezzoukhry, Z.; François, C.; Louandre, C.; Sabbagh, C.; Nguyen-Khac, E.; Descamps, V.; Trouillet, N.; Godin, C.; Regimbeau, J.-M.; et al. BAD, a Proapoptotic Member of the BCL2 Family, Is a Potential Therapeutic Target in Hepatocellular Carcinoma. Mol. Cancer Res. MCR 2010, 8, 1116–1125. [Google Scholar] [CrossRef] [PubMed]
- Cerami, E.; Gao, J.; Dogrusoz, U.; Gross, B.E.; Sumer, S.O.; Aksoy, B.A.; Jacobsen, A.; Byrne, C.J.; Heuer, M.L.; Larsson, E.; et al. The CBio Cancer Genomics Portal: An Open Platform for Exploring Multidimensional Cancer Genomics Data: Figure 1. Cancer Discov. 2012, 2, 401–404. [Google Scholar] [CrossRef]
- Gao, J.; Aksoy, B.A.; Dogrusoz, U.; Dresdner, G.; Gross, B.; Sumer, S.O.; Sun, Y.; Jacobsen, A.; Sinha, R.; Larsson, E.; et al. Integrative Analysis of Complex Cancer Genomics and Clinical Profiles Using the CBioPortal. Sci. Signal. 2013, 6, pl1. [Google Scholar] [CrossRef]
- Puram, S.V.; Tirosh, I.; Parikh, A.S.; Patel, A.P.; Yizhak, K.; Gillespie, S.; Rodman, C.; Luo, C.L.; Mroz, E.A.; Emerick, K.S.; et al. Single-Cell Transcriptomic Analysis of Primary and Metastatic Tumor Ecosystems in Head and Neck Cancer. Cell 2017, 171, 1611–1624.e24. [Google Scholar] [CrossRef]
- Reinhold, W.C.; Sunshine, M.; Liu, H.; Varma, S.; Kohn, K.W.; Morris, J.; Doroshow, J.; Pommier, Y. CellMiner: A Web-Based Suite of Genomic and Pharmacologic Tools to Explore Transcript and Drug Patterns in the NCI-60 Cell Line Set. Cancer Res. 2012, 72, 3499–3511. [Google Scholar] [CrossRef]
- Subramanian, A.; Tamayo, P.; Mootha, V.K.; Mukherjee, S.; Ebert, B.L.; Gillette, M.A.; Paulovich, A.; Pomeroy, S.L.; Golub, T.R.; Lander, E.S.; et al. Gene Set Enrichment Analysis: A Knowledge-Based Approach for Interpreting Genome-Wide Expression Profiles. Proc. Natl. Acad. Sci. USA 2005, 102, 15545–15550. [Google Scholar] [CrossRef]
- Mi, H.; Muruganujan, A.; Thomas, P.D. PANTHER in 2013: Modeling the Evolution of Gene Function, and Other Gene Attributes, in the Context of Phylogenetic Trees. Nucleic Acids Res. 2013, 41, D377–D386. [Google Scholar] [CrossRef]
- Becht, E.; Giraldo, N.A.; Lacroix, L.; Buttard, B.; Elarouci, N.; Petitprez, F.; Selves, J.; Laurent-Puig, P.; Sautès-Fridman, C.; Fridman, W.H. Estimating the Population Abundance of Tissue-Infiltrating Immune and Stromal Cell Populations Using Gene Expression. Genome Biol. 2016, 17, 218. [Google Scholar] [CrossRef] [PubMed]
- Thorsson, V.; Gibbs, D.L.; Brown, S.D.; Wolf, D.; Bortone, D.S.; Ou Yang, T.-H.; Porta-Pardo, E.; Gao, G.F.; Plaisier, C.L.; Eddy, J.A.; et al. The Immune Landscape of Cancer. Immunity 2018, 48, 812–830.e14. [Google Scholar] [CrossRef] [PubMed]
- Mayayo-Peralta, I.; Zwart, W.; Prekovic, S. Duality of Glucocorticoid Action in Cancer: Tumor-Suppressor or Oncogene? Endocr. Relat. Cancer 2021, 28, R157–R171. [Google Scholar] [CrossRef] [PubMed]
- Pavón, M.A.; Arroyo-Solera, I.; Céspedes, M.V.; Casanova, I.; León, X.; Mangues, R. UPA/UPAR and SERPINE1 in Head and Neck Cancer: Role in Tumor Resistance, Metastasis, Prognosis and Therapy. Oncotarget 2016, 7, 57351–57366. [Google Scholar] [CrossRef] [PubMed]
- Ma, Y.; Ryu, J.S.; Dulay, A.; Segal, M.; Guller, S. Regulation of Plasminogen Activator Inhibitor (PAI)-1 Expression in a Human Trophoblast Cell Line by Glucocorticoid (GC) and Transforming Growth Factor (TGF)-Beta. Placenta 2002, 23, 727–734. [Google Scholar] [CrossRef]
- Wickert, L.; Chatain, N.; Kruschinsky, K.; Gressner, A.M. Glucocorticoids Activate TGF-Beta Induced PAI-1 and CTGF Expression in Rat Hepatocytes. Comp. Hepatol. 2007, 6, 5. [Google Scholar] [CrossRef]
- Riccio, A.; Lund, L.R.; Sartorio, R.; Lania, A.; Anderasen, P.A.; Danø, K.; Blasi, F. The Regulatory Region of the Human Plasminogen Activator Inhibitor Type-1 (PAI-1) Gene. Nucleic Acids Res. 1988, 16, 2805–2824. [Google Scholar] [CrossRef]
- Bajou, K.; Peng, H.; Laug, W.E.; Maillard, C.; Noel, A.; Foidart, J.M.; Martial, J.A.; DeClerck, Y.A. Plasminogen Activator Inhibitor-1 Protects Endothelial Cells from FasL-Mediated Apoptosis. Cancer Cell 2008, 14, 324–334. [Google Scholar] [CrossRef] [PubMed]
- Kai, K.; Moriyama, M.; Haque, A.S.M.R.; Hattori, T.; Chinju, A.; Hu, C.; Kubota, K.; Miyahara, Y.; Kakizoe-Ishiguro, N.; Kawano, S.; et al. Oral Squamous Cell Carcinoma Contributes to Differentiation of Monocyte-Derived Tumor-Associated Macrophages via PAI-1 and IL-8 Production. Int. J. Mol. Sci. 2021, 22, 9475. [Google Scholar] [CrossRef] [PubMed]
- Kubala, M.H.; Punj, V.; Placencio-Hickok, V.R.; Fang, H.; Fernandez, G.E.; Sposto, R.; DeClerck, Y.A. Plasminogen Activator Inhibitor-1 Promotes the Recruitment and Polarization of Macrophages in Cancer. Cell Rep. 2018, 25, 2177–2191.e7. [Google Scholar] [CrossRef]
- Masuda, T.; Nakashima, T.; Namba, M.; Yamaguchi, K.; Sakamoto, S.; Horimasu, Y.; Miyamoto, S.; Iwamoto, H.; Fujitaka, K.; Miyata, Y.; et al. Inhibition of PAI-1 Limits Chemotherapy Resistance in Lung Cancer through Suppressing Myofibroblast Characteristics of Cancer-Associated Fibroblasts. J. Cell. Mol. Med. 2019, 23, 2984–2994. [Google Scholar] [CrossRef] [PubMed]
- Zou, M.-L.; Teng, Y.-Y.; Chen, Z.-H.; Liu, S.-Y.; Jia, Y.; Zhang, K.-W.; Wu, J.-J.; Yuan, Z.-D.; Tang, X.-Y.; Yu, S.; et al. The UPA System Differentially Alters Fibroblast Fate and Profibrotic Ability in Skin Fibrosis. Front. Immunol. 2022, 13, 845956. [Google Scholar] [CrossRef] [PubMed]
- Okada, K.; Okamoto, T.; Okumoto, K.; Takafuji, Y.; Ishida, M.; Kawao, N.; Matsuo, O.; Kaji, H. PAI-1 Is Involved in Delayed Bone Repair Induced by Glucocorticoids in Mice. Bone 2020, 134, 115310. [Google Scholar] [CrossRef] [PubMed]
- Okada, K.; Kawao, N.; Nakai, D.; Wakabayashi, R.; Horiuchi, Y.; Okumoto, K.; Kurashimo, S.; Takafuji, Y.; Matsuo, O.; Kaji, H. Role of Macrophages and Plasminogen Activator Inhibitor-1 in Delayed Bone Repair Induced by Glucocorticoids in Mice. Int. J. Mol. Sci. 2022, 23, 478. [Google Scholar] [CrossRef]
- Tamura, Y.; Kawao, N.; Shimoide, T.; Okada, K.; Matsuo, O.; Kaji, H. Role of Plasminogen Activator Inhibitor-1 in Glucocorticoid-Induced Muscle Change in Mice. J. Bone Miner. Metab. 2018, 36, 148–156. [Google Scholar] [CrossRef]


Disclaimer/Publisher’s Note: The statements, opinions and data contained in all publications are solely those of the individual author(s) and contributor(s) and not of MDPI and/or the editor(s). MDPI and/or the editor(s) disclaim responsibility for any injury to people or property resulting from any ideas, methods, instructions or products referred to in the content. |
© 2023 by the authors. Licensee MDPI, Basel, Switzerland. This article is an open access article distributed under the terms and conditions of the Creative Commons Attribution (CC BY) license (https://creativecommons.org/licenses/by/4.0/).
Share and Cite
Racine, F.; Louandre, C.; Godin, C.; Chatelain, B.; Prekovic, S.; Zwart, W.; Galmiche, A.; Saidak, Z. The Tumor Coagulome as a Transcriptional Target and a Potential Effector of Glucocorticoids in Human Cancers. Cancers 2023, 15, 1531. https://doi.org/10.3390/cancers15051531
Racine F, Louandre C, Godin C, Chatelain B, Prekovic S, Zwart W, Galmiche A, Saidak Z. The Tumor Coagulome as a Transcriptional Target and a Potential Effector of Glucocorticoids in Human Cancers. Cancers. 2023; 15(5):1531. https://doi.org/10.3390/cancers15051531
Chicago/Turabian StyleRacine, Floriane, Christophe Louandre, Corinne Godin, Baptiste Chatelain, Stefan Prekovic, Wilbert Zwart, Antoine Galmiche, and Zuzana Saidak. 2023. "The Tumor Coagulome as a Transcriptional Target and a Potential Effector of Glucocorticoids in Human Cancers" Cancers 15, no. 5: 1531. https://doi.org/10.3390/cancers15051531
APA StyleRacine, F., Louandre, C., Godin, C., Chatelain, B., Prekovic, S., Zwart, W., Galmiche, A., & Saidak, Z. (2023). The Tumor Coagulome as a Transcriptional Target and a Potential Effector of Glucocorticoids in Human Cancers. Cancers, 15(5), 1531. https://doi.org/10.3390/cancers15051531