

Insulin-like Growth Factor II mRNA-Binding Protein 1 Regulates Pancreatic Cancer Cell Growth through the Surveillance of CDC25A mRNA

 , , ,
, , ,  , and
, and 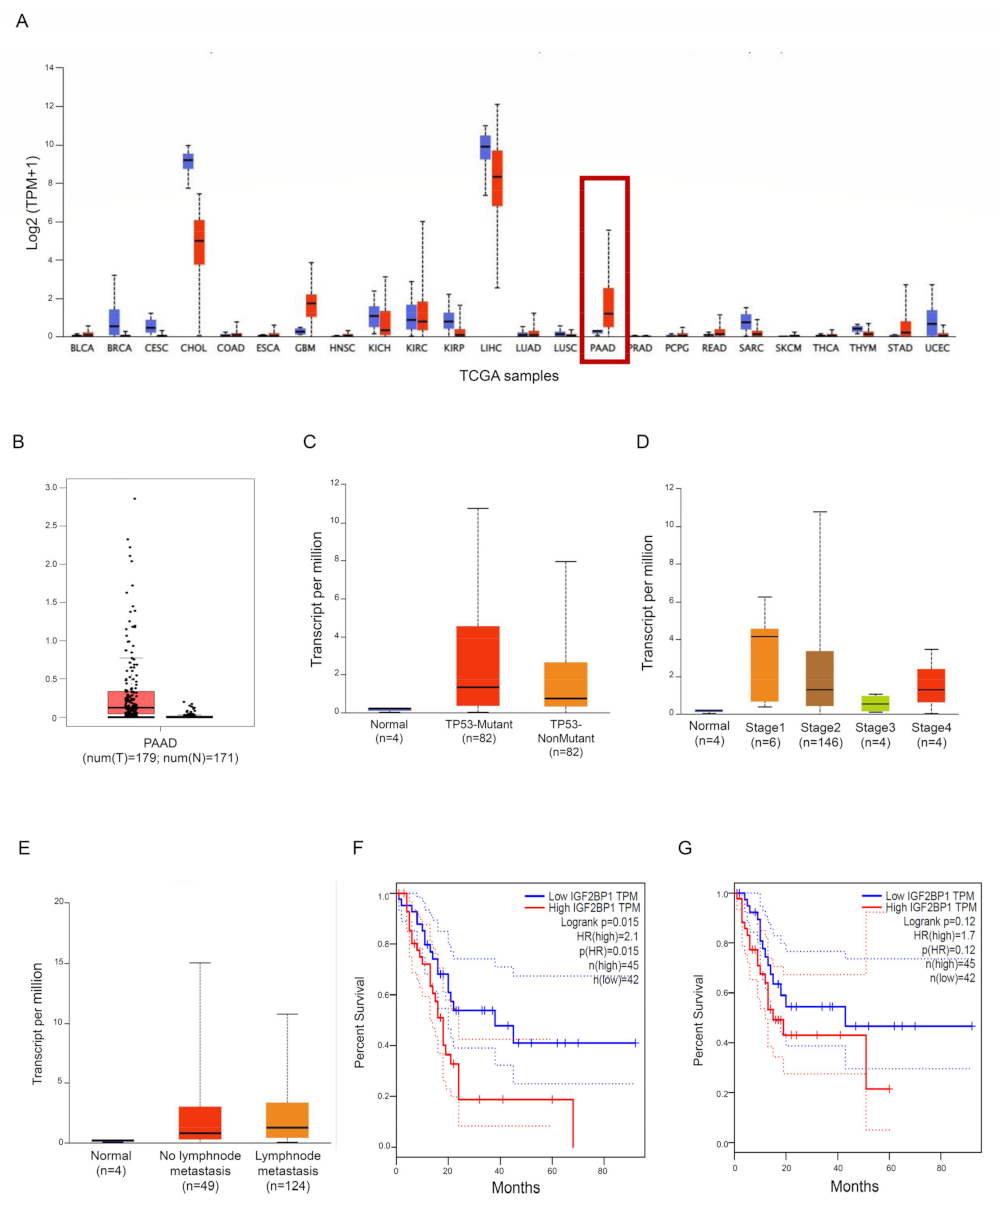
Abstract
:Simple Summary
Abstract
1. Introduction
2. Materials and Methods
2.1. Cell Culture
2.2. 3D Culture
2.3. Protein Extraction and Western Blotting
2.4. Flow Cytometry Analysis
2.5. RNA Immunoprecipitation
2.6. RNA Extraction, Real-Time qPCR
2.7. In Vivo Formation of Panc-1-Derived Tumors
2.8. Statistical Analysis
2.9. Data Availability
3. Results
3.1. IMP1 Is Up-Regulated in Human PDAC and Is Associated with a Poor Prognosis in PDAC Patients
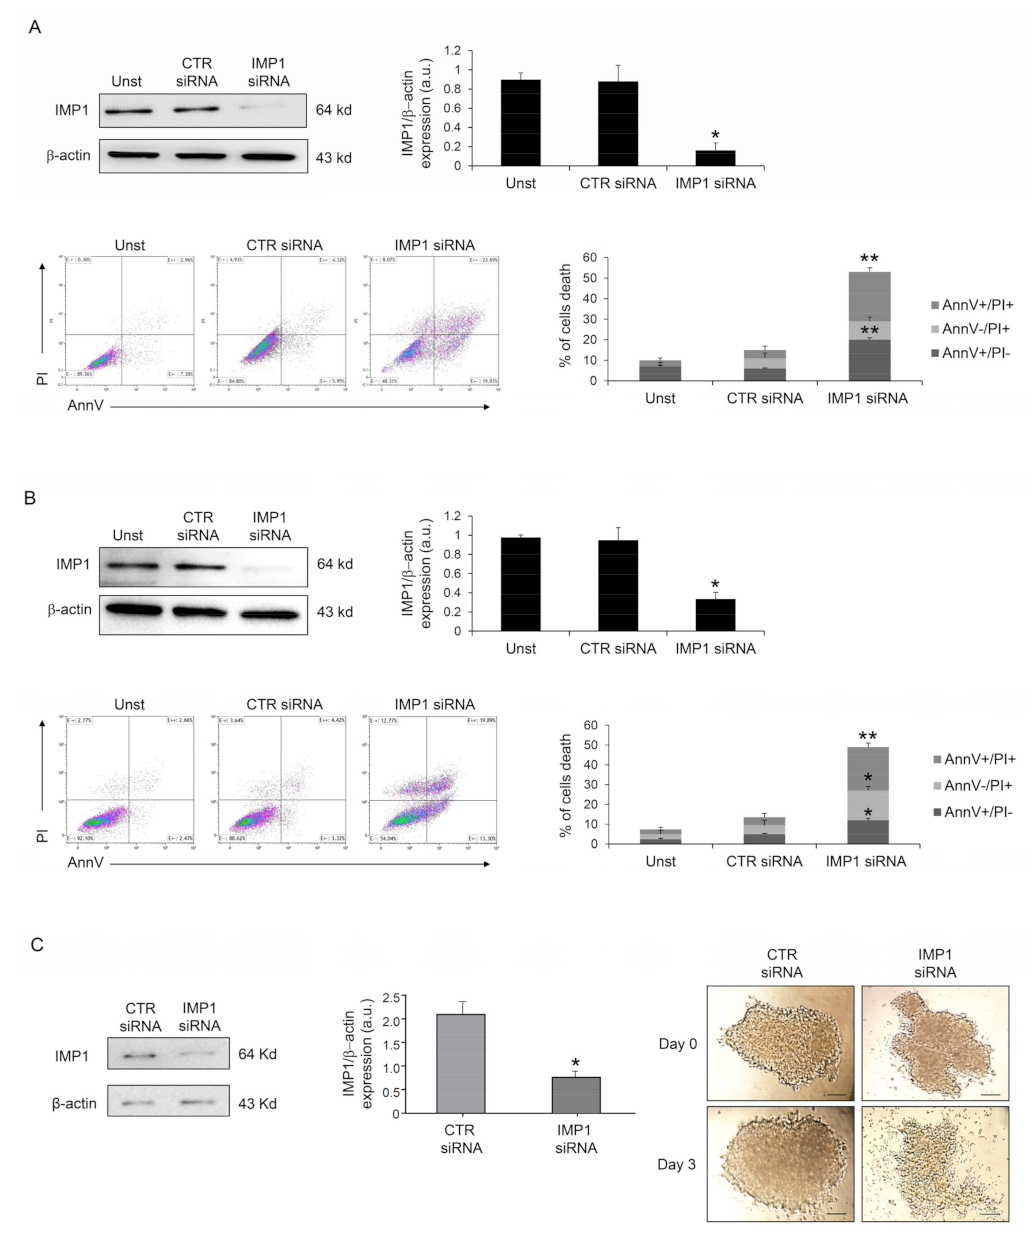
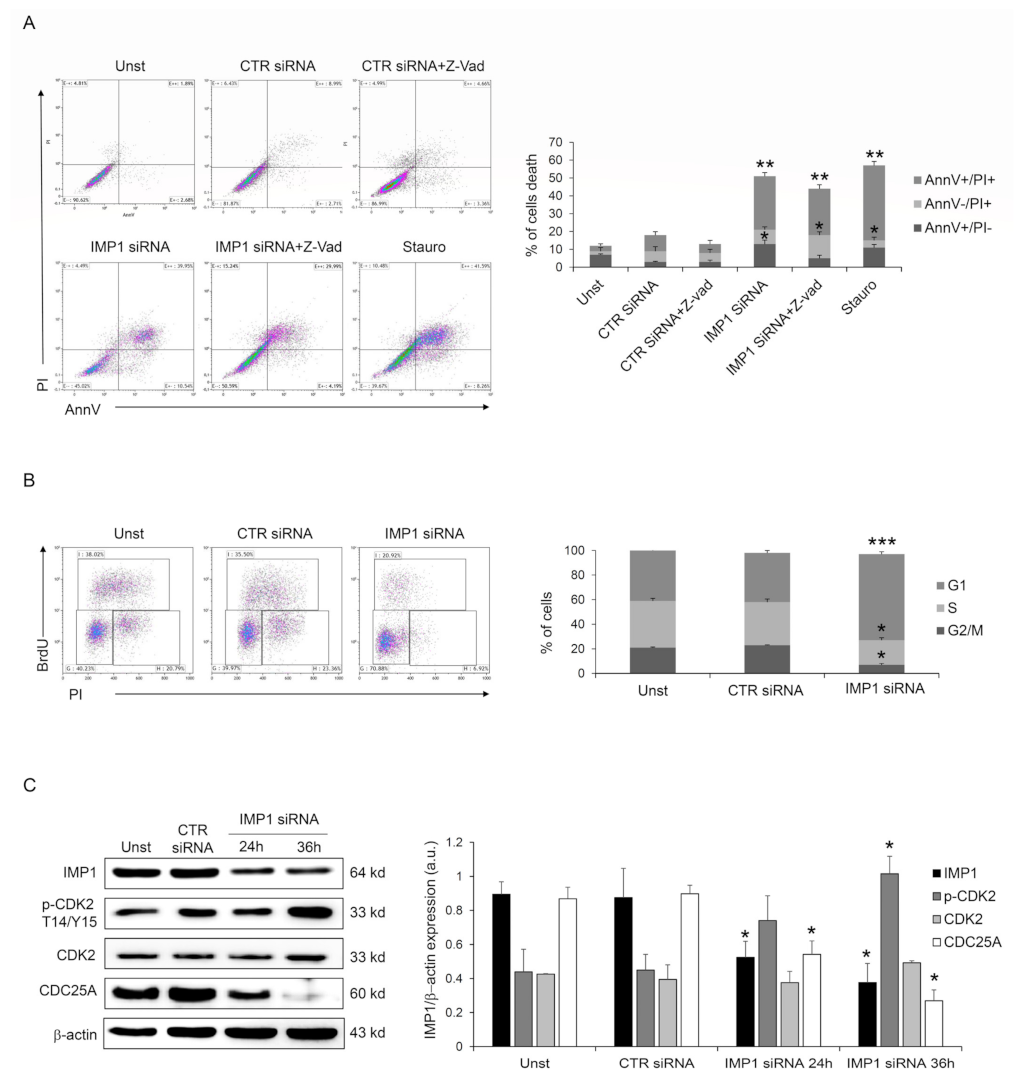
3.2. IMP1 Sustains PDAC Cell Survival and Proliferation
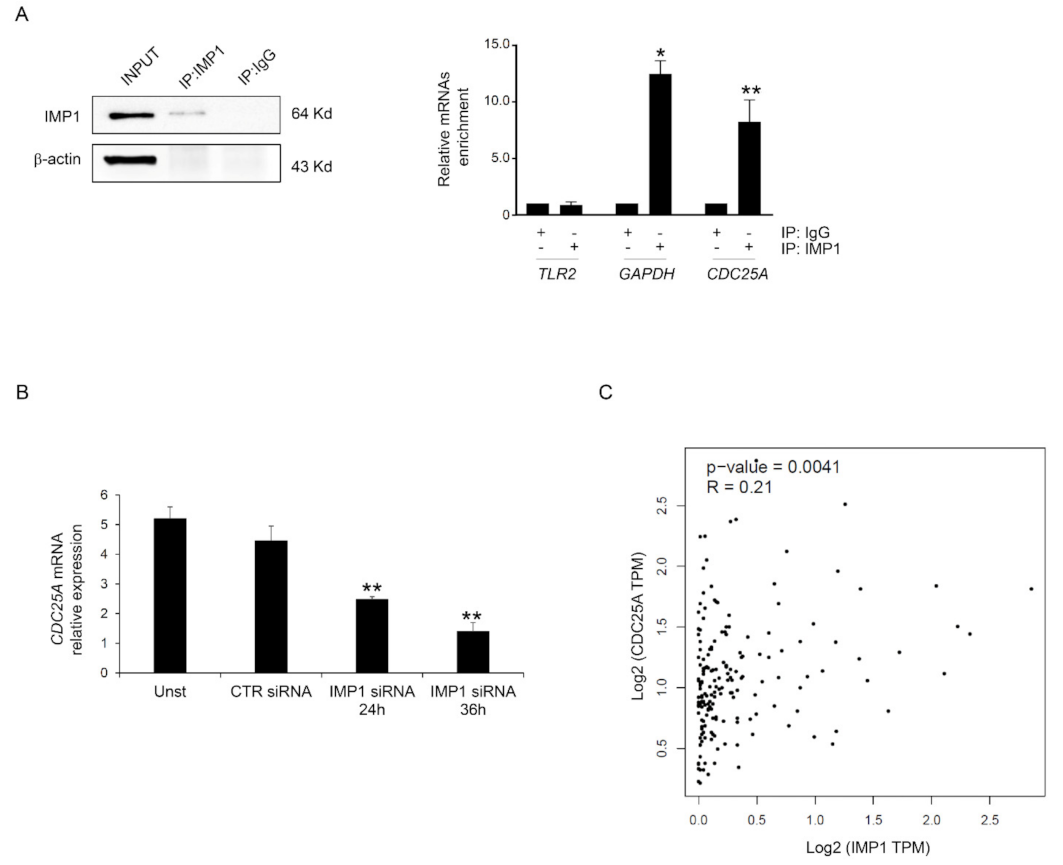
3.3. IMP1 Binds CDC25A mRNA
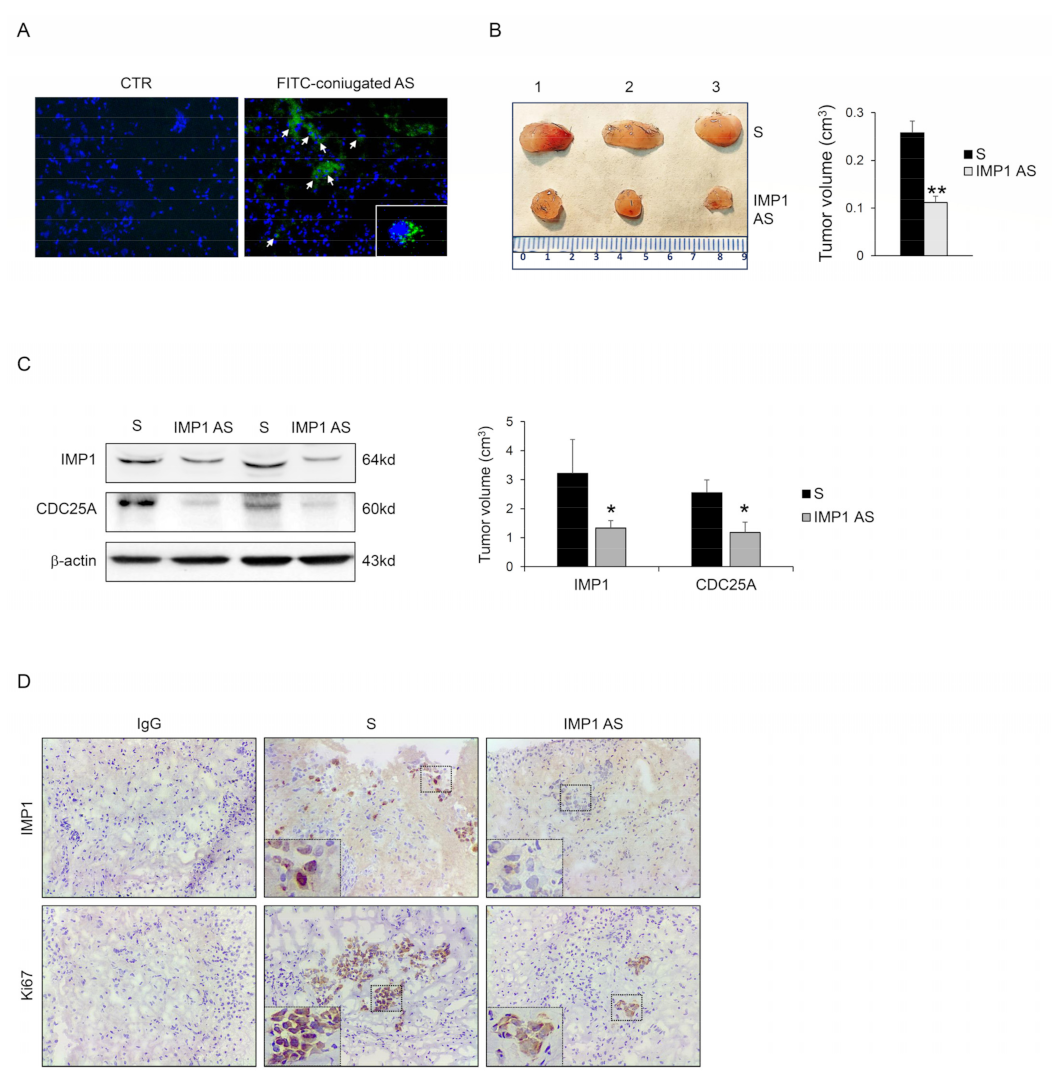
3.4. IMP1 Knockdown Decreases In Vivo Growth of Panc-1-Derived Xenografts
4. Discussion
5. Conclusions
Supplementary Materials
Author Contributions
Funding
Institutional Review Board Statement
Informed Consent Statement
Data Availability Statement
Conflicts of Interests
References
- Miller, K.D.; Siegel, R.L.; Lin, C.C.; Mariotto, A.B.; Kramer, J.L.; Rowland, J.H.; Stein, K.D.; Alteri, R.; Jemal, A. Cancer treatment and survivorship statistics, 2016. CA A Cancer J. Clin. 2016, 66, 271–289. [Google Scholar] [CrossRef] [PubMed]
- Rahib, L.; Smith, B.D.; Aizenberg, R.; Rosenzweig, A.B.; Fleshman, J.M.; Matrisian, L.M. Projecting cancer incidence and deaths to 2030: The unexpected burden of thyroid, liver, and pancreas cancers in the United States. Cancer Res. 2014, 74, 2913–2921. [Google Scholar] [CrossRef]
- McGuigan, A.; Kelly, P.; Turkington, R.C.; Jones, C.; Coleman, H.G.; McCain, R.S. Pancreatic cancer: A review of clinical diagnosis, epidemiology, treatment and outcomes. World J. Gastroenterol. 2018, 24, 4846–4861. [Google Scholar] [CrossRef] [PubMed]
- Wang, S.; Zheng, Y.; Yang, F.; Zhu, L.; Zhu, X.Q.; Wang, Z.F.; Wu, X.L.; Zhou, C.H.; Yan, J.Y.; Hu, B.Y.; et al. The molecular biology of pancreatic adenocarcinoma: Translational challenges and clinical perspectives. Signal. Transduct. Target. 2021, 6, 249. [Google Scholar] [CrossRef]
- Kamisawa, T.; Wood, L.D.; Itoi, T.; Takaori, K. Pancreatic cancer. Lancet 2016, 388, 73–85. [Google Scholar] [CrossRef] [PubMed]
- Moffitt, R.A.; Marayati, R.; Flate, E.L.; Volmar, K.E.; Loeza, S.G.; Hoadley, K.A.; Rashid, N.U.; Williams, L.A.; Eaton, S.C.; Chung, A.H.; et al. Virtual microdissection identifies distinct tumor- and stroma-specific subtypes of pancreatic ductal adenocarcinoma. Nat. Genet. 2015, 47, 1168–1178. [Google Scholar] [CrossRef]
- Collisson, E.A.; Sadanandam, A.; Olson, P.; Gibb, W.J.; Truitt, M.; Gu, S.; Cooc, J.; Weinkle, J.; Kim, G.E.; Jakkula, L.; et al. Subtypes of pancreatic ductal adenocarcinoma and their differing responses to therapy. Nat. Med. 2011, 17, 500–503. [Google Scholar] [CrossRef]
- Bailey, P.; Chang, D.K.; Nones, K.; Johns, A.L.; Patch, A.M.; Gingras, M.C.; Miller, D.K.; Christ, A.N.; Bruxner, T.J.; Quinn, M.C.; et al. Genomic analyses identify molecular subtypes of pancreatic cancer. Nature 2016, 531, 47–52. [Google Scholar] [CrossRef]
- Schwanhausser, B.; Busse, D.; Li, N.; Dittmar, G.; Schuchhardt, J.; Wolf, J.; Chen, W.; Selbach, M. Global quantification of mammalian gene expression control. Nature 2011, 473, 337–342. [Google Scholar] [CrossRef]
- Diederichs, S.; Bartsch, L.; Berkmann, J.C.; Frose, K.; Heitmann, J.; Hoppe, C.; Iggena, D.; Jazmati, D.; Karschnia, P.; Linsenmeier, M.; et al. The dark matter of the cancer genome: Aberrations in regulatory elements, untranslated regions, splice sites, non-coding RNA and synonymous mutations. EMBO Mol. Med. 2016, 8, 442–457. [Google Scholar] [CrossRef]
- Di Grazia, A.; Marafini, I.; Pedini, G.; Di Fusco, D.; Laudisi, F.; Dinallo, V.; Rosina, E.; Stolfi, C.; Franze, E.; Sileri, P.; et al. The Fragile X Mental Retardation Protein Regulates RIPK1 and Colorectal Cancer Resistance to Necroptosis. Cell. Mol. Gastroenterol. Hepatol. 2021, 11, 639–658. [Google Scholar] [CrossRef] [PubMed]
- Di Fusco, D.; Di Grazia, A.; Di Maggio, G.; Segreto, M.T.; Iannucci, A.; Maresca, C.; De Stefano, A.; Sica, G.; Stolfi, C.; Monteleone, G.; et al. A novel tumour enhancer function of Insulin-like growth factor II mRNA-binding protein 3 in colorectal cancer. Cell. Death Dis. 2023, 14, 243. [Google Scholar] [CrossRef]
- Pereira, B.; Billaud, M.; Almeida, R. RNA-Binding Proteins in Cancer: Old Players and New Actors. Trends Cancer 2017, 3, 506–528. [Google Scholar] [CrossRef] [PubMed]
- Glass, M.; Michl, P.; Huttelmaier, A.S. RNA Binding Proteins as Drivers and Therapeutic Target Candidates in Pancreatic Ductal Adenocarcinoma. Int. J. Mol. Sci. 2020, 21, 4190. [Google Scholar] [CrossRef] [PubMed]
- Wan, B.S.; Cheng, M.; Zhang, L. Insulin-like growth factor 2 mRNA-binding protein 1 promotes cell proliferation via activation of AKT and is directly targeted by microRNA-494 in pancreatic cancer. World J. Gastroenterol. 2019, 25, 6063–6076. [Google Scholar] [CrossRef] [PubMed]
- Dahlem, C.; Barghash, A.; Puchas, P.; Haybaeck, J.; Kessler, S.M. The Insulin-Like Growth Factor 2 mRNA Binding Protein IMP2/IGF2BP2 is Overexpressed and Correlates with Poor Survival in Pancreatic Cancer. Int. J. Mol. Sci. 2019, 20, 3204. [Google Scholar] [CrossRef] [PubMed]
- Pasiliao, C.C.; Chang, C.W.; Sutherland, B.W.; Valdez, S.M.; Schaeffer, D.; Yapp, D.T.; Ng, S.S. The involvement of insulin-like growth factor 2 binding protein 3 (IMP3) in pancreatic cancer cell migration, invasion, and adhesion. BMC Cancer 2015, 15, 266. [Google Scholar] [CrossRef] [PubMed]
- Li, T.; Fu, J.; Zeng, Z.; Cohen, D.; Li, J.; Chen, Q.; Li, B.; Liu, X.S. TIMER2.0 for analysis of tumor-infiltrating immune cells. Nucleic Acids Res. 2020, 48, W509–W514. [Google Scholar] [CrossRef]
- Tang, Z.; Li, C.; Kang, B.; Gao, G.; Li, C.; Zhang, Z. GEPIA: A web server for cancer and normal gene expression profiling and interactive analyses. Nucleic Acids Res. 2017, 45, W98–W102. [Google Scholar] [CrossRef]
- Chandrashekar, D.S.; Bashel, B.; Balasubramanya, S.A.H.; Creighton, C.J.; Ponce-Rodriguez, I.; Chakravarthi, B.; Varambally, S. UALCAN: A Portal for Facilitating Tumor Subgroup Gene Expression and Survival Analyses. Neoplasia 2017, 19, 649–658. [Google Scholar] [CrossRef]
- Mahapatra, L.; Andruska, N.; Mao, C.; Le, J.; Shapiro, D.J. A Novel IMP1 Inhibitor, BTYNB, Targets c-Myc and Inhibits Melanoma and Ovarian Cancer Cell Proliferation. Transl. Oncol. 2017, 10, 818–827. [Google Scholar] [CrossRef] [PubMed]
- Shapiro, G.I. Cyclin-dependent kinase pathways as targets for cancer treatment. J. Clin. Oncol. Off. J. Am. Soc. Clin. Oncol. 2006, 24, 1770–1783. [Google Scholar] [CrossRef] [PubMed]
- Kristjansdottir, K.; Rudolph, J. Cdc25 phosphatases and cancer. Chem. Biol. 2004, 11, 1043–1051. [Google Scholar] [CrossRef] [PubMed]
- Zhao, W.; Zhang, S.; Zhu, Y.; Xi, X.; Bao, P.; Ma, Z.; Kapral, T.H.; Chen, S.; Zagrovic, B.; Yang, Y.T.; et al. POSTAR3: An updated platform for exploring post-transcriptional regulation coordinated by RNA-binding proteins. Nucleic Acids Res. 2022, 50, D287–D294. [Google Scholar] [CrossRef] [PubMed]
- Boyerinas, B.; Park, S.M.; Murmann, A.E.; Gwin, K.; Montag, A.G.; Zillhardt, M.; Hua, Y.J.; Lengyel, E.; Peter, M.E. Let-7 modulates acquired resistance of ovarian cancer to Taxanes via IMP-1-mediated stabilization of multidrug resistance 1. Int. J. Cancer 2012, 130, 1787–1797. [Google Scholar] [CrossRef]
- Yang, M.; Yang, S.L.; Herrlinger, S.; Liang, C.; Dzieciatkowska, M.; Hansen, K.C.; Desai, R.; Nagy, A.; Niswander, L.; Moss, E.G.; et al. Lin28 promotes the proliferative capacity of neural progenitor cells in brain development. Development 2015, 142, 1616–1627. [Google Scholar] [CrossRef]
- Wang, Y.; Li, J.; Guo, S.; Ouyang, Y.; Yin, L.; Liu, S.; Zhao, Z.; Yang, J.; Huang, W.; Qin, H.; et al. Lin28B facilitates the progression and metastasis of pancreatic ductal adenocarcinoma. Oncotarget 2017, 8, 60414–60428. [Google Scholar] [CrossRef]
- Patel, K.; Kollory, A.; Takashima, A.; Sarkar, S.; Faller, D.V.; Ghosh, S.K. MicroRNA let-7 downregulates STAT3 phosphorylation in pancreatic cancer cells by increasing SOCS3 expression. Cancer Lett. 2014, 347, 54–64. [Google Scholar] [CrossRef]
- Lunde, B.M.; Moore, C.; Varani, G. RNA-binding proteins: Modular design for efficient function. Nat. Rev. Mol. Cell. Biol. 2007, 8, 479–490. [Google Scholar] [CrossRef]
- Glass, M.; Misiak, D.; Bley, N.; Muller, S.; Hagemann, S.; Busch, B.; Rausch, A.; Huttelmaier, S. IGF2BP1, a Conserved Regulator of RNA Turnover in Cancer. Front. Mol. Biosci. 2021, 8, 632219. [Google Scholar] [CrossRef]
- Okholm, T.L.H.; Sathe, S.; Park, S.S.; Kamstrup, A.B.; Rasmussen, A.M.; Shankar, A.; Chua, Z.M.; Fristrup, N.; Nielsen, M.M.; Vang, S.; et al. Transcriptome-wide profiles of circular RNA and RNA-binding protein interactions reveal effects on circular RNA biogenesis and cancer pathway expression. Genome Med. 2020, 12, 112. [Google Scholar] [CrossRef] [PubMed]
- Sharma, G.; Tran, T.M.; Bansal, I.; Beg, M.S.; Bhardwaj, R.; Bassi, J.; Tan, Y.; Jaiswal, A.K.; Tso, C.; Jain, A.; et al. RNA binding protein IGF2BP1 synergizes with ETV6-RUNX1 to drive oncogenic signaling in B-cell Acute Lymphoblastic Leukemia. J. Exp. Clin. Cancer Res. CR 2023, 42, 231. [Google Scholar] [CrossRef] [PubMed]
- Biegel, J.M.; Dhamdhere, M.; Gao, S.; Gowda, C.P.; Kawasawa, Y.I.; Spiegelman, V.S. Inhibition of the mRNA-Binding Protein IGF2BP1 Suppresses Proliferation and Sensitizes Neuroblastoma Cells to Chemotherapeutic Agents. Front. Oncol. 2021, 11, 608816. [Google Scholar] [CrossRef] [PubMed]


Disclaimer/Publisher’s Note: The statements, opinions and data contained in all publications are solely those of the individual author(s) and contributor(s) and not of MDPI and/or the editor(s). MDPI and/or the editor(s) disclaim responsibility for any injury to people or property resulting from any ideas, methods, instructions or products referred to in the content. |
© 2023 by the authors. Licensee MDPI, Basel, Switzerland. This article is an open access article distributed under the terms and conditions of the Creative Commons Attribution (CC BY) license (https://creativecommons.org/licenses/by/4.0/).
Share and Cite
Di Fusco, D.; Segreto, M.T.; Di Maggio, G.; Iannucci, A.; Maresca, C.; Di Grazia, A.; Colella, M.; Stolfi, C.; Monteleone, G.; Monteleone, I. Insulin-like Growth Factor II mRNA-Binding Protein 1 Regulates Pancreatic Cancer Cell Growth through the Surveillance of CDC25A mRNA. Cancers 2023, 15, 4983. https://doi.org/10.3390/cancers15204983
Di Fusco D, Segreto MT, Di Maggio G, Iannucci A, Maresca C, Di Grazia A, Colella M, Stolfi C, Monteleone G, Monteleone I. Insulin-like Growth Factor II mRNA-Binding Protein 1 Regulates Pancreatic Cancer Cell Growth through the Surveillance of CDC25A mRNA. Cancers. 2023; 15(20):4983. https://doi.org/10.3390/cancers15204983
Chicago/Turabian StyleDi Fusco, Davide, Maria Teresa Segreto, Giulia Di Maggio, Andrea Iannucci, Claudia Maresca, Antonio Di Grazia, Marco Colella, Carmine Stolfi, Giovanni Monteleone, and Ivan Monteleone. 2023. "Insulin-like Growth Factor II mRNA-Binding Protein 1 Regulates Pancreatic Cancer Cell Growth through the Surveillance of CDC25A mRNA" Cancers 15, no. 20: 4983. https://doi.org/10.3390/cancers15204983
APA StyleDi Fusco, D., Segreto, M. T., Di Maggio, G., Iannucci, A., Maresca, C., Di Grazia, A., Colella, M., Stolfi, C., Monteleone, G., & Monteleone, I. (2023). Insulin-like Growth Factor II mRNA-Binding Protein 1 Regulates Pancreatic Cancer Cell Growth through the Surveillance of CDC25A mRNA. Cancers, 15(20), 4983. https://doi.org/10.3390/cancers15204983