
Anticancer Potential of Post-Fermentation Media and Cell Extracts of Probiotic Strains: An In Vitro Study


Abstract
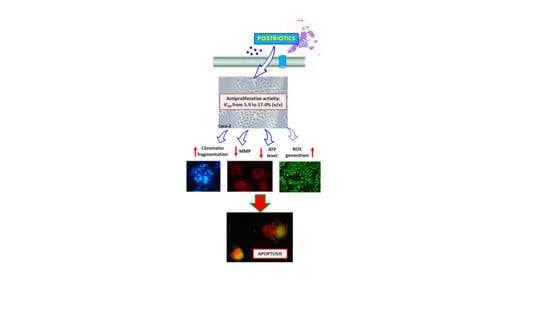
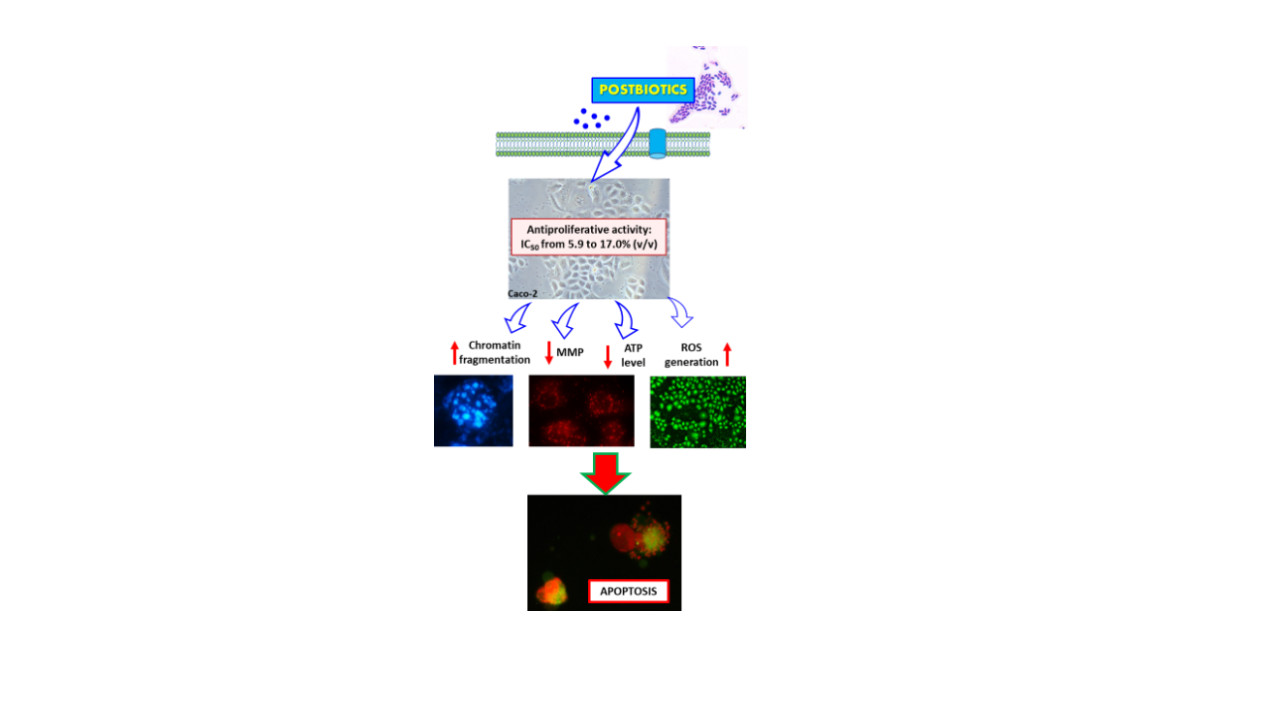
:Simple Summary
Abstract
1. Introduction
- (a)
- Antiproliferative activity—according to many studies, both probiotics and postbiotics demonstrate antiproliferative activity against cancer cell lines [8,9,10,11,12,13,14]. It can manifest through the activity of mitochondrial dehydrogenases. Most likely, the action is based on the cell cycle arrest in the G1 phase, which blocks the cell’s transition to the next phase of the cycle (S), and it is impossible for replication and cell division to occur. Carcinogenesis is arrested in the promotion phase, and the tumour does not continue to grow [15];
- (b)
- Induction of cancer cell apoptosis, or genetically programmed cell death—a mechanism used to control the number of cells in a multicellular organism. During the development of neoplastic tissue, the altered cells become resistant to signals directing them down the path of apoptosis. Research shows that probiotic bacteria and postbiotics may play major roles in regulating the internal and external pathway of apoptosis, which may be a key defence mechanism against colon cancer [10,14,16,17,18,19];
- (c)
- Production of compounds with a cytoprotective effect (antiproliferative and proapoptotic) for the intestinal epithelial cells such as organic acids including short-chain fatty acids (SCFAs) and lactic acid (LA). They can display antiproliferative activity and induce apoptosis in cancer cells [20].
2. Materials and Methods
2.1. Chemicals, Culture Vessels, and Other Materials
2.2. Bacterial Strains: Culture, Propagation, Freezing, and Storage
2.3. PFM and CE Preparation
2.4. Cell Cultures (Caco-2, HeLa, and IEC-6)
2.5. Antiproliferation Assays (MTT)
2.5.1. PFM and CEs of 39 LAB Strains against Caco-2 Cells—Strain Screening
2.5.2. PFM and CEs of Selected LAB against HeLa and Normal IEC-6 Cells
2.5.3. Pure LA and SCFAs against Caco-2 Cells
2.6. Clonogenic Assay
2.7. ROS Generation and H2O2 Level Quantification
2.8. Mitochondrial Membrane Potential (MMP) Measurement
2.9. Measurement of ATP Production
2.10. PS Externalisation and Membrane Permeabilisation
2.11. Detection of Caspases 3/7 and Caspase 9 Activity
2.12. Morphology of Caco-2 Cells
2.12.1. Crystal Violet Staining
2.12.2. DAPI Staining
2.13. LA and SCFA Quantification
2.14. Statistical Analysis
3. Results and Discussion
3.1. Antiproliferative Activity of PFM and CEs
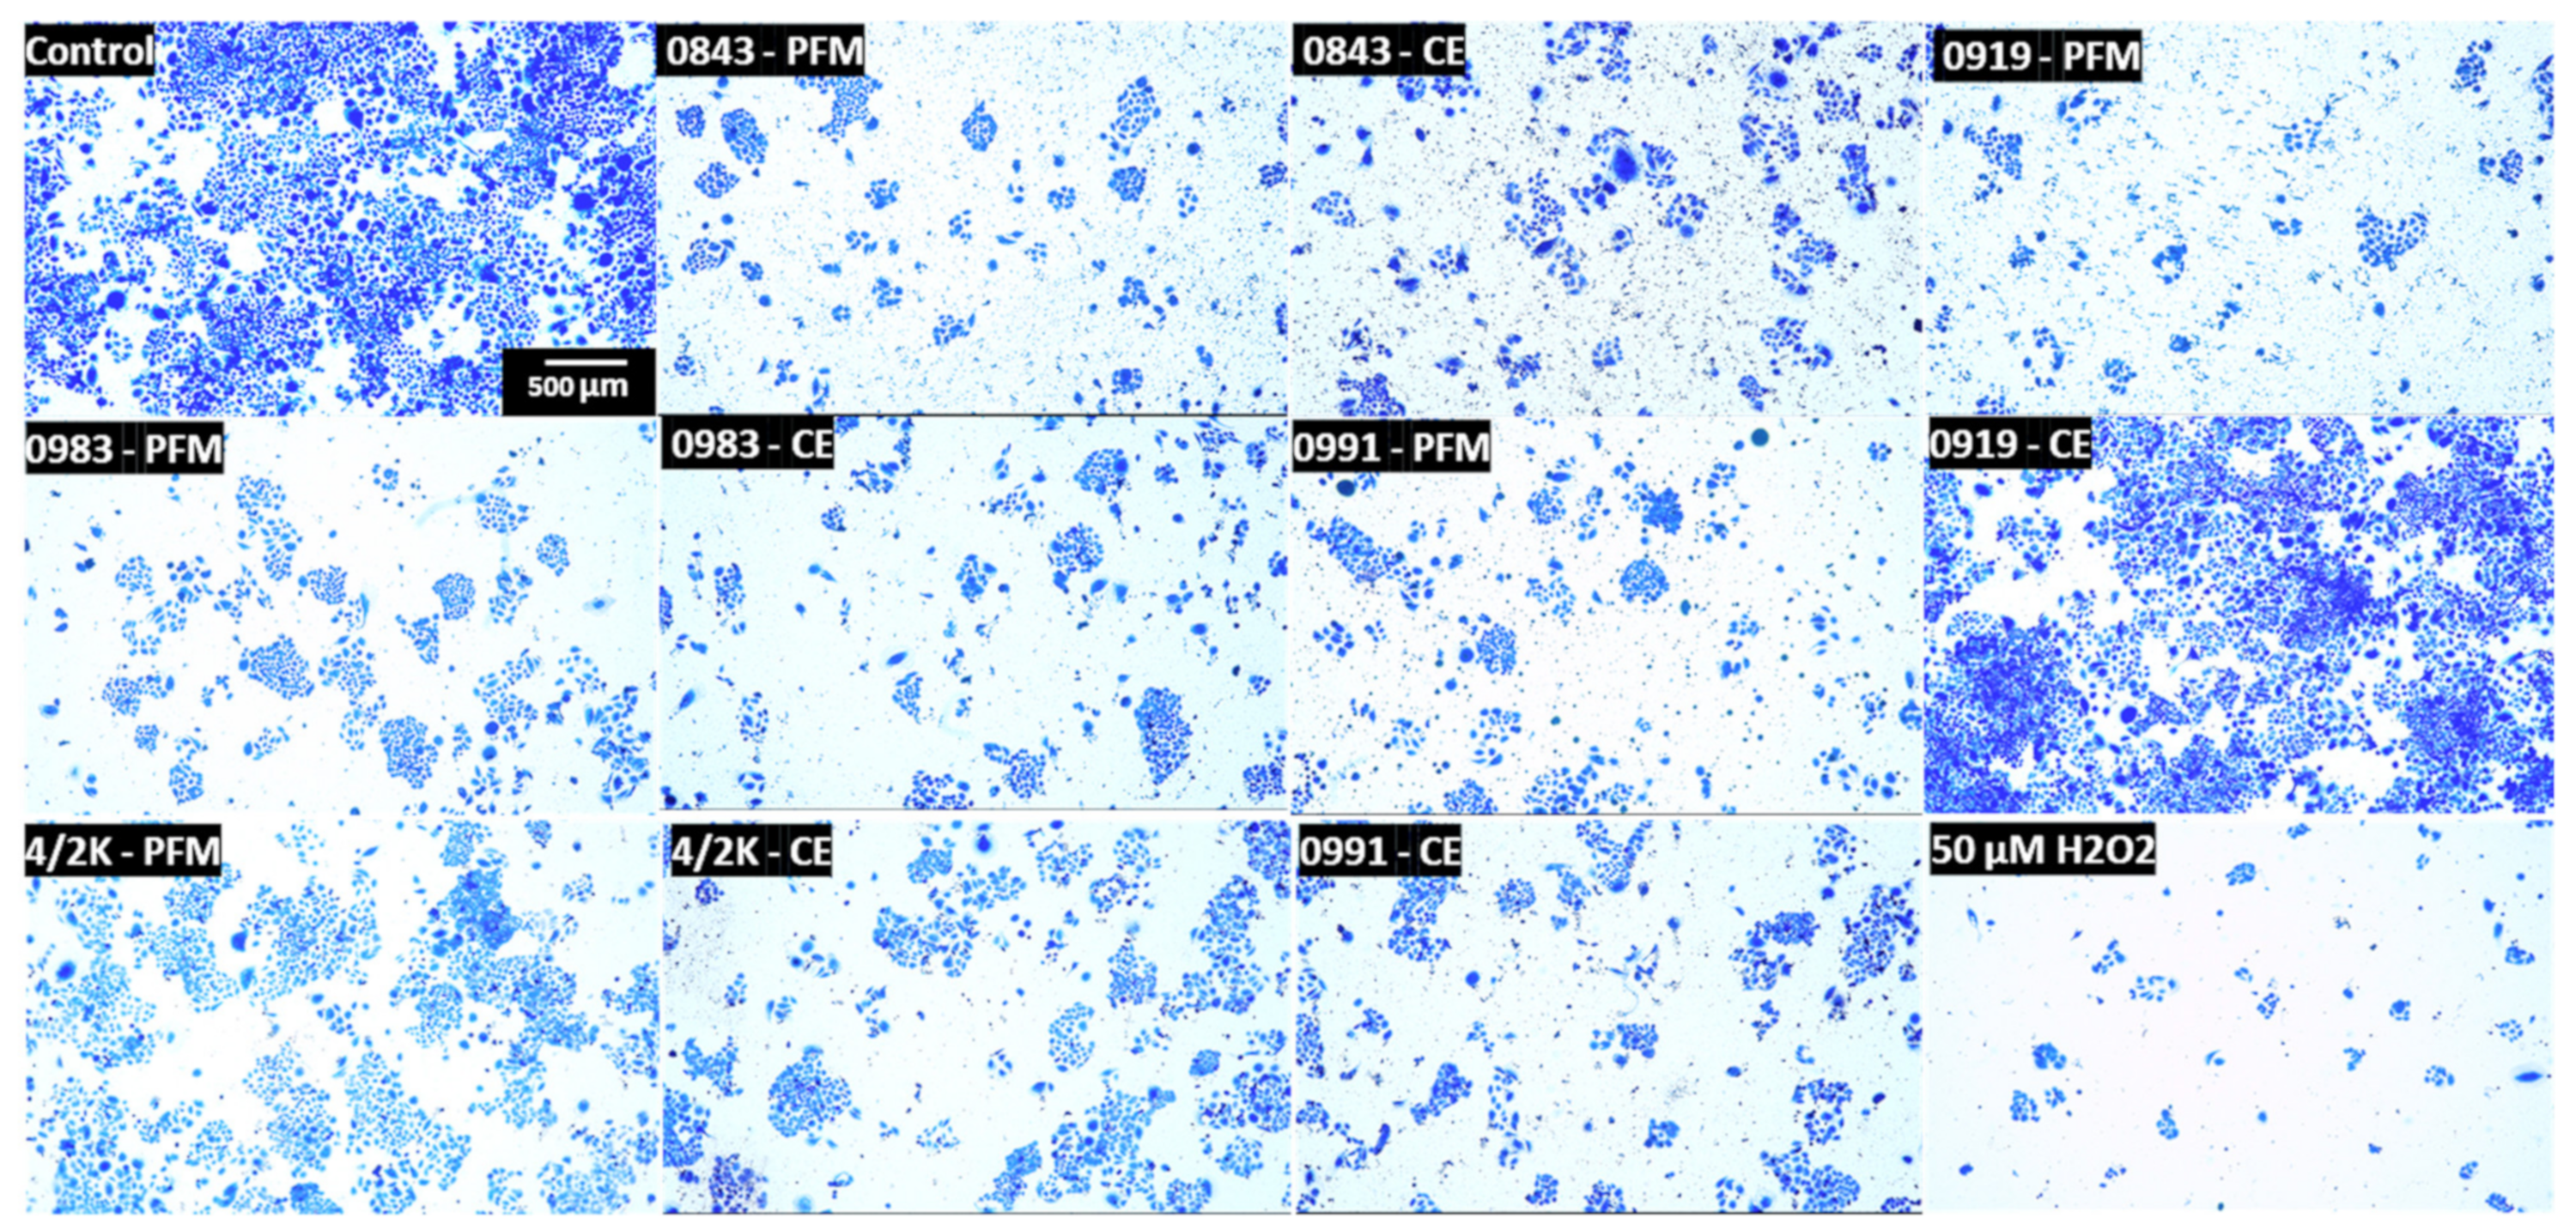
3.2. Effects of PFM and CEs on Caco-2 Colony Formation
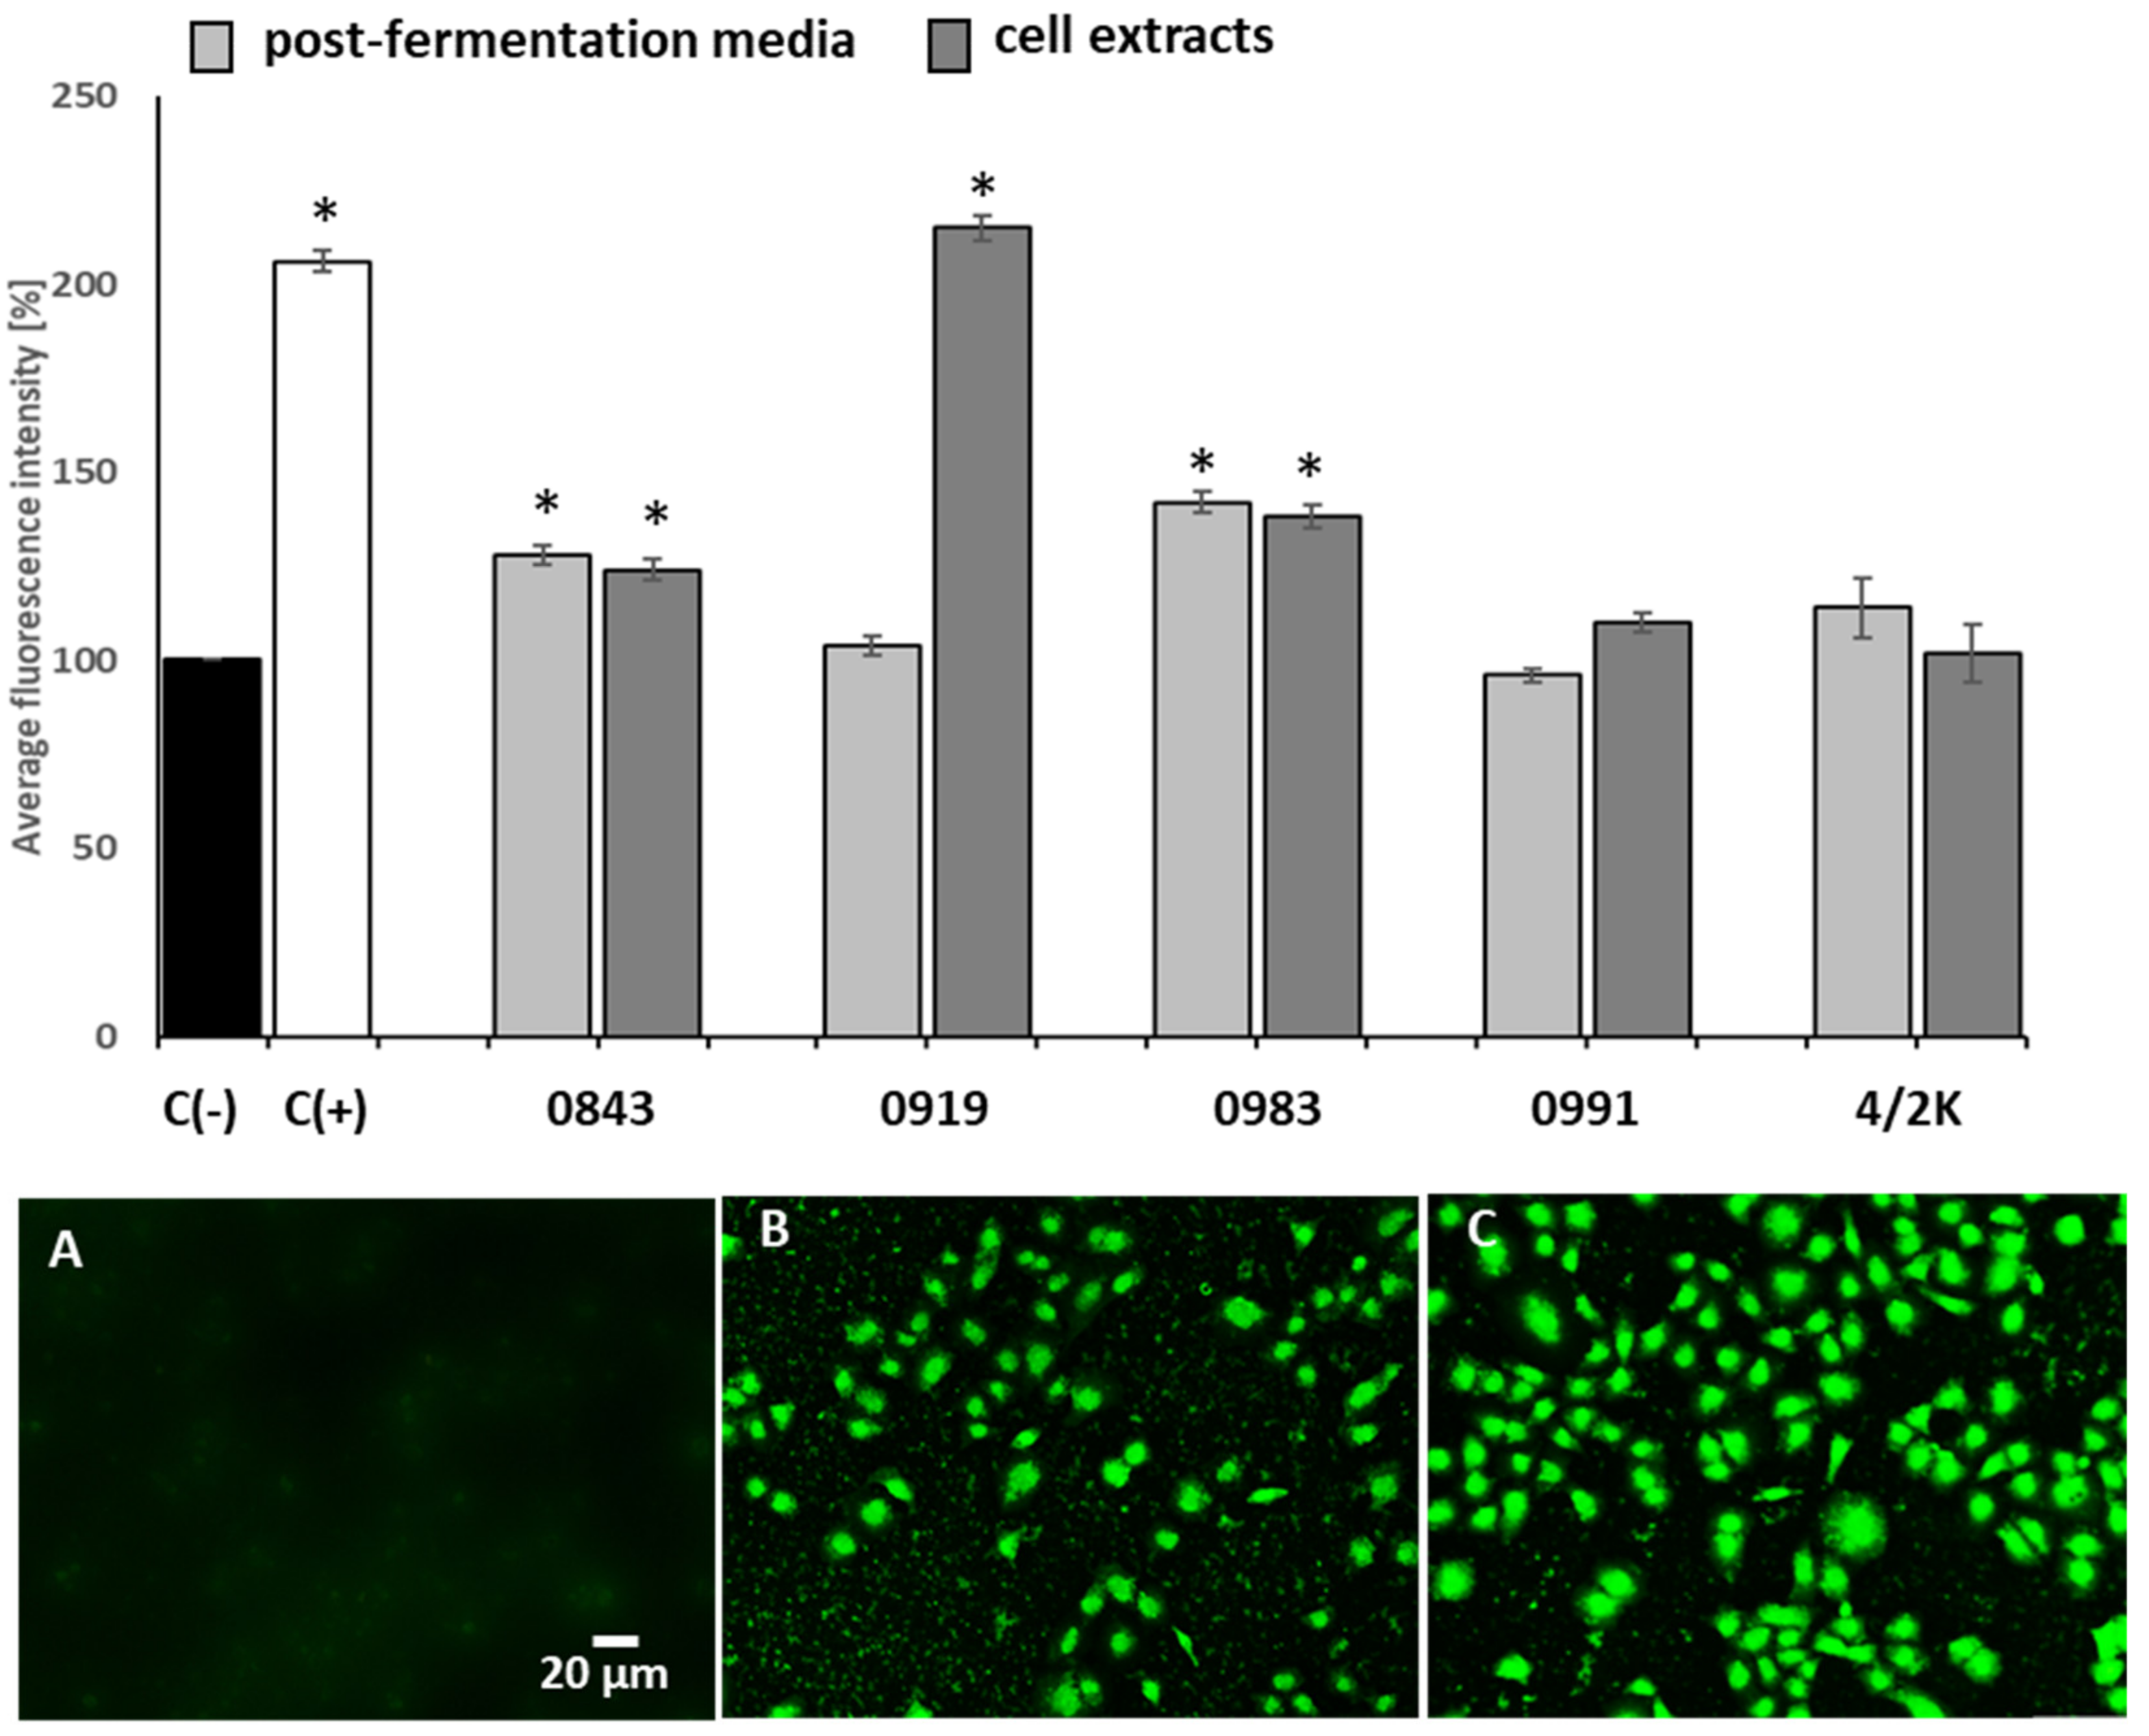
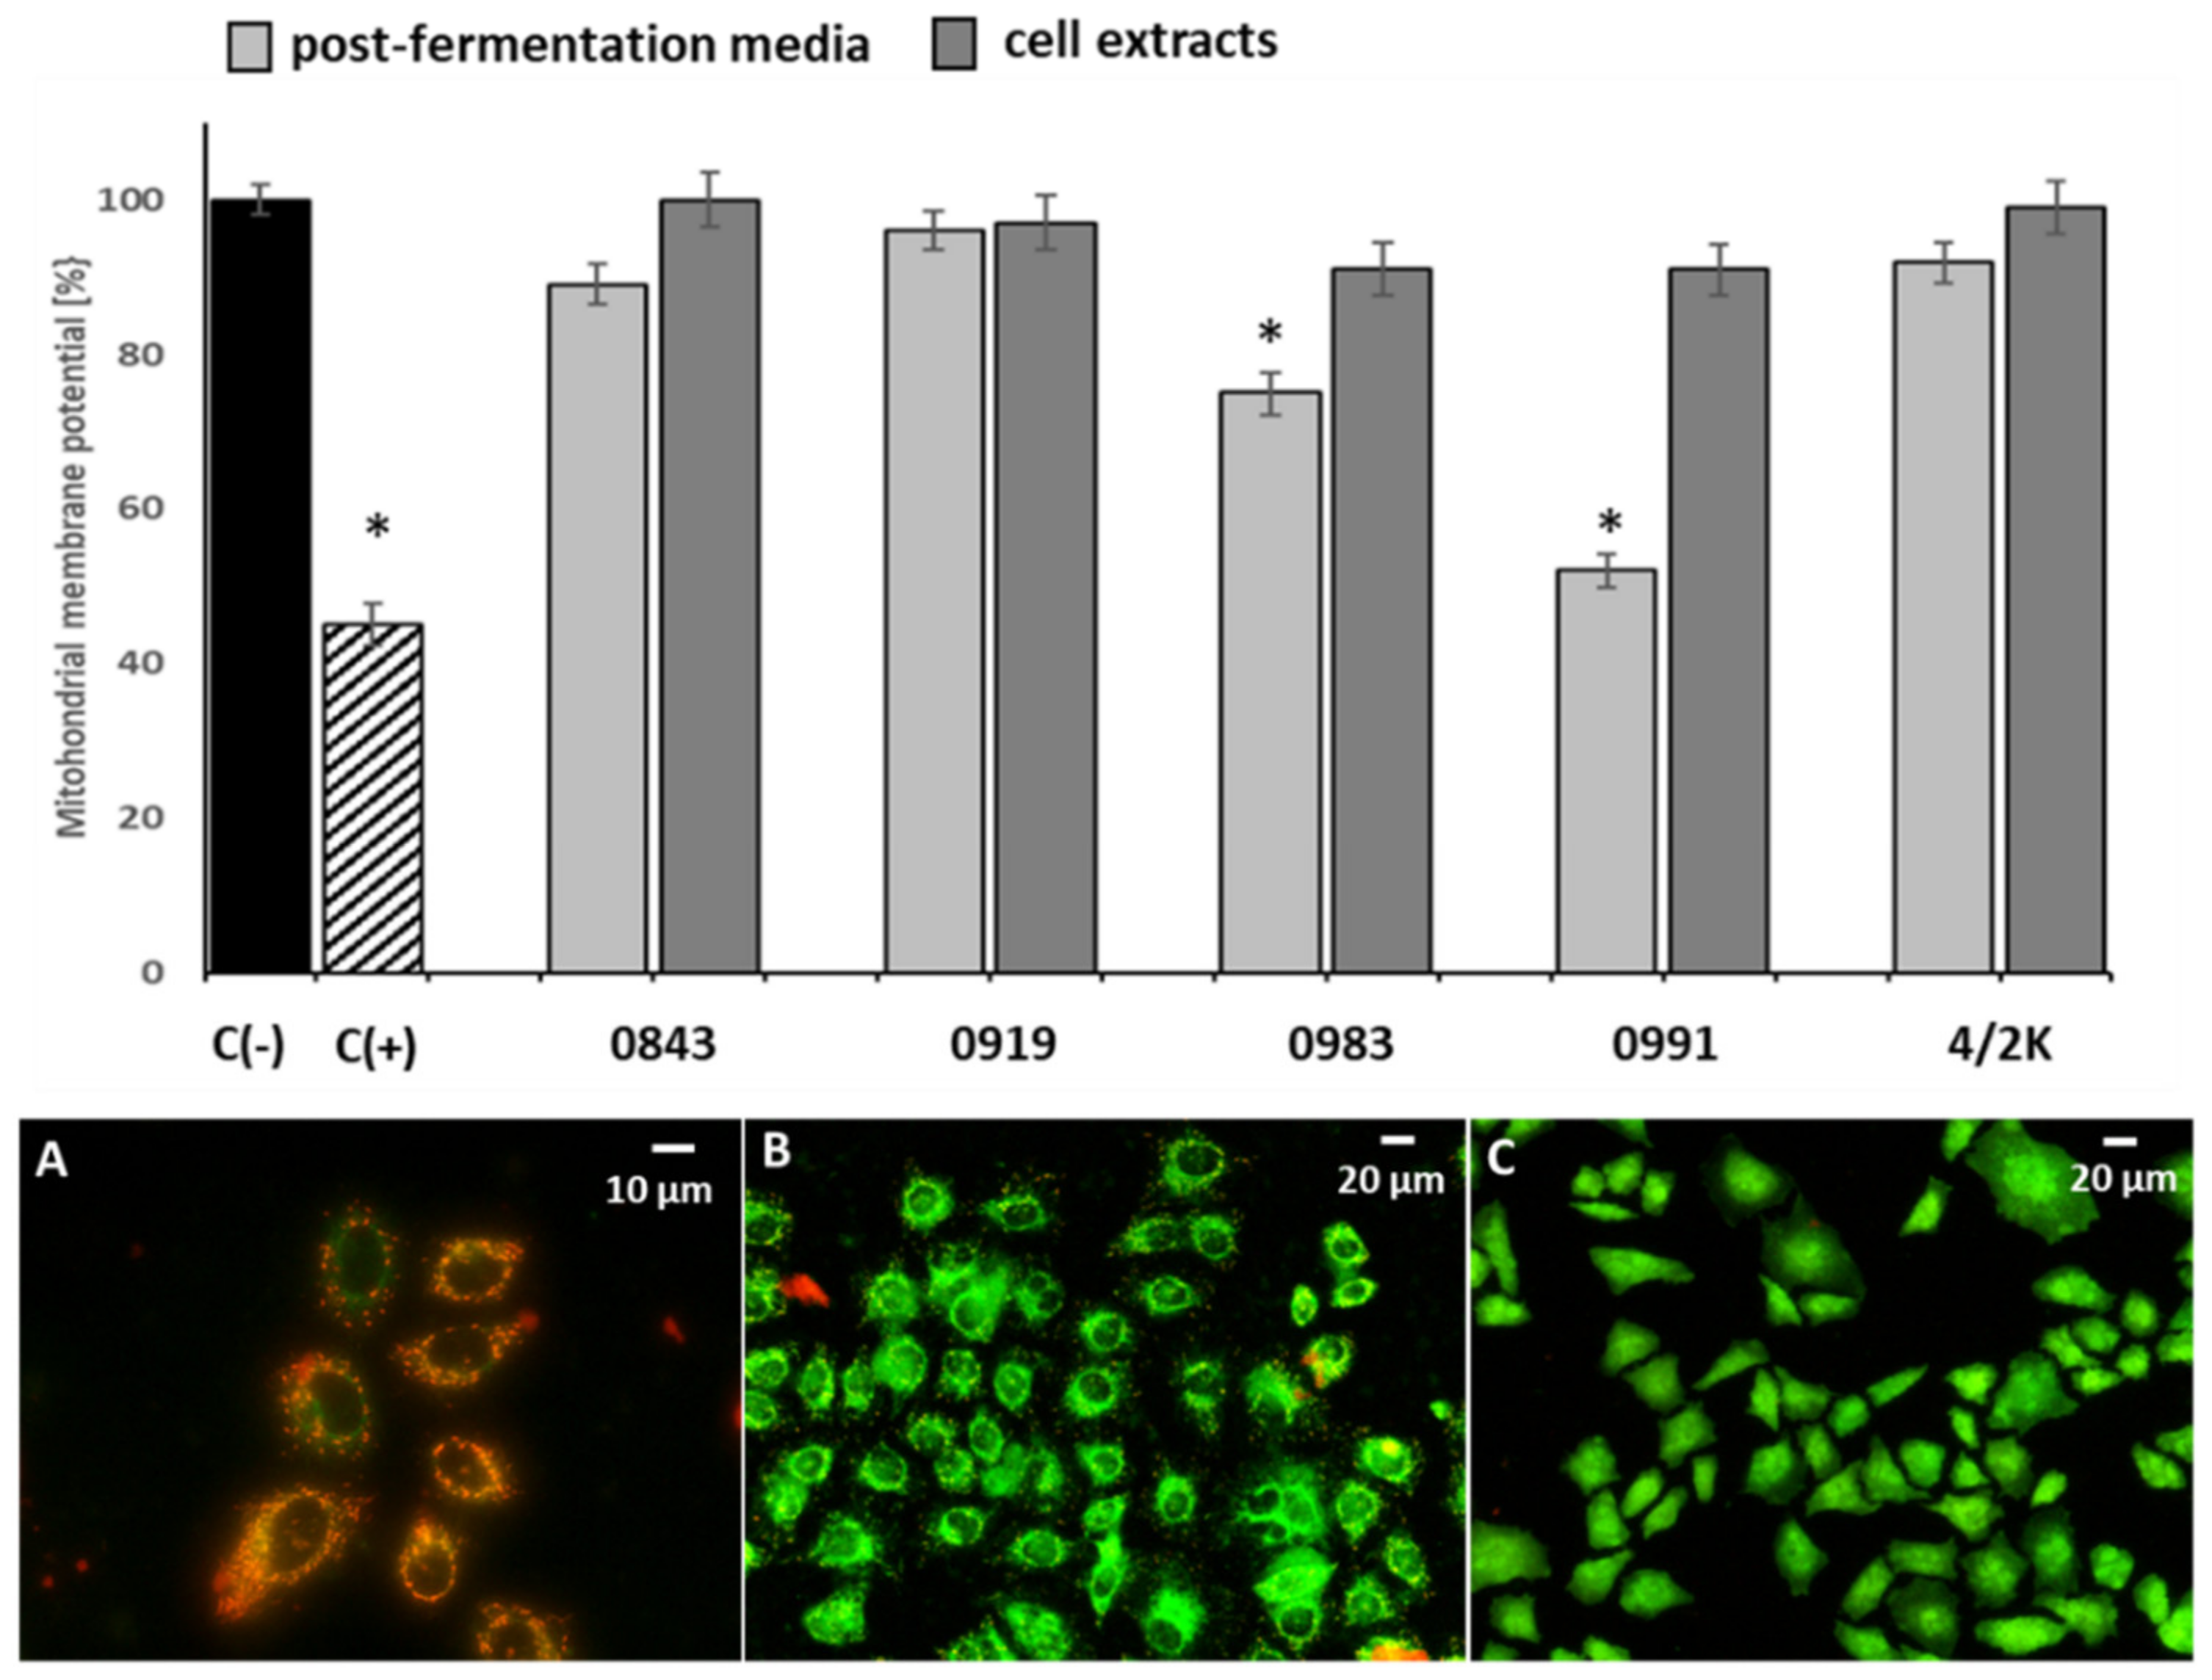
3.3. Effects of PFM and CEs on Oxidative Stress and MMP
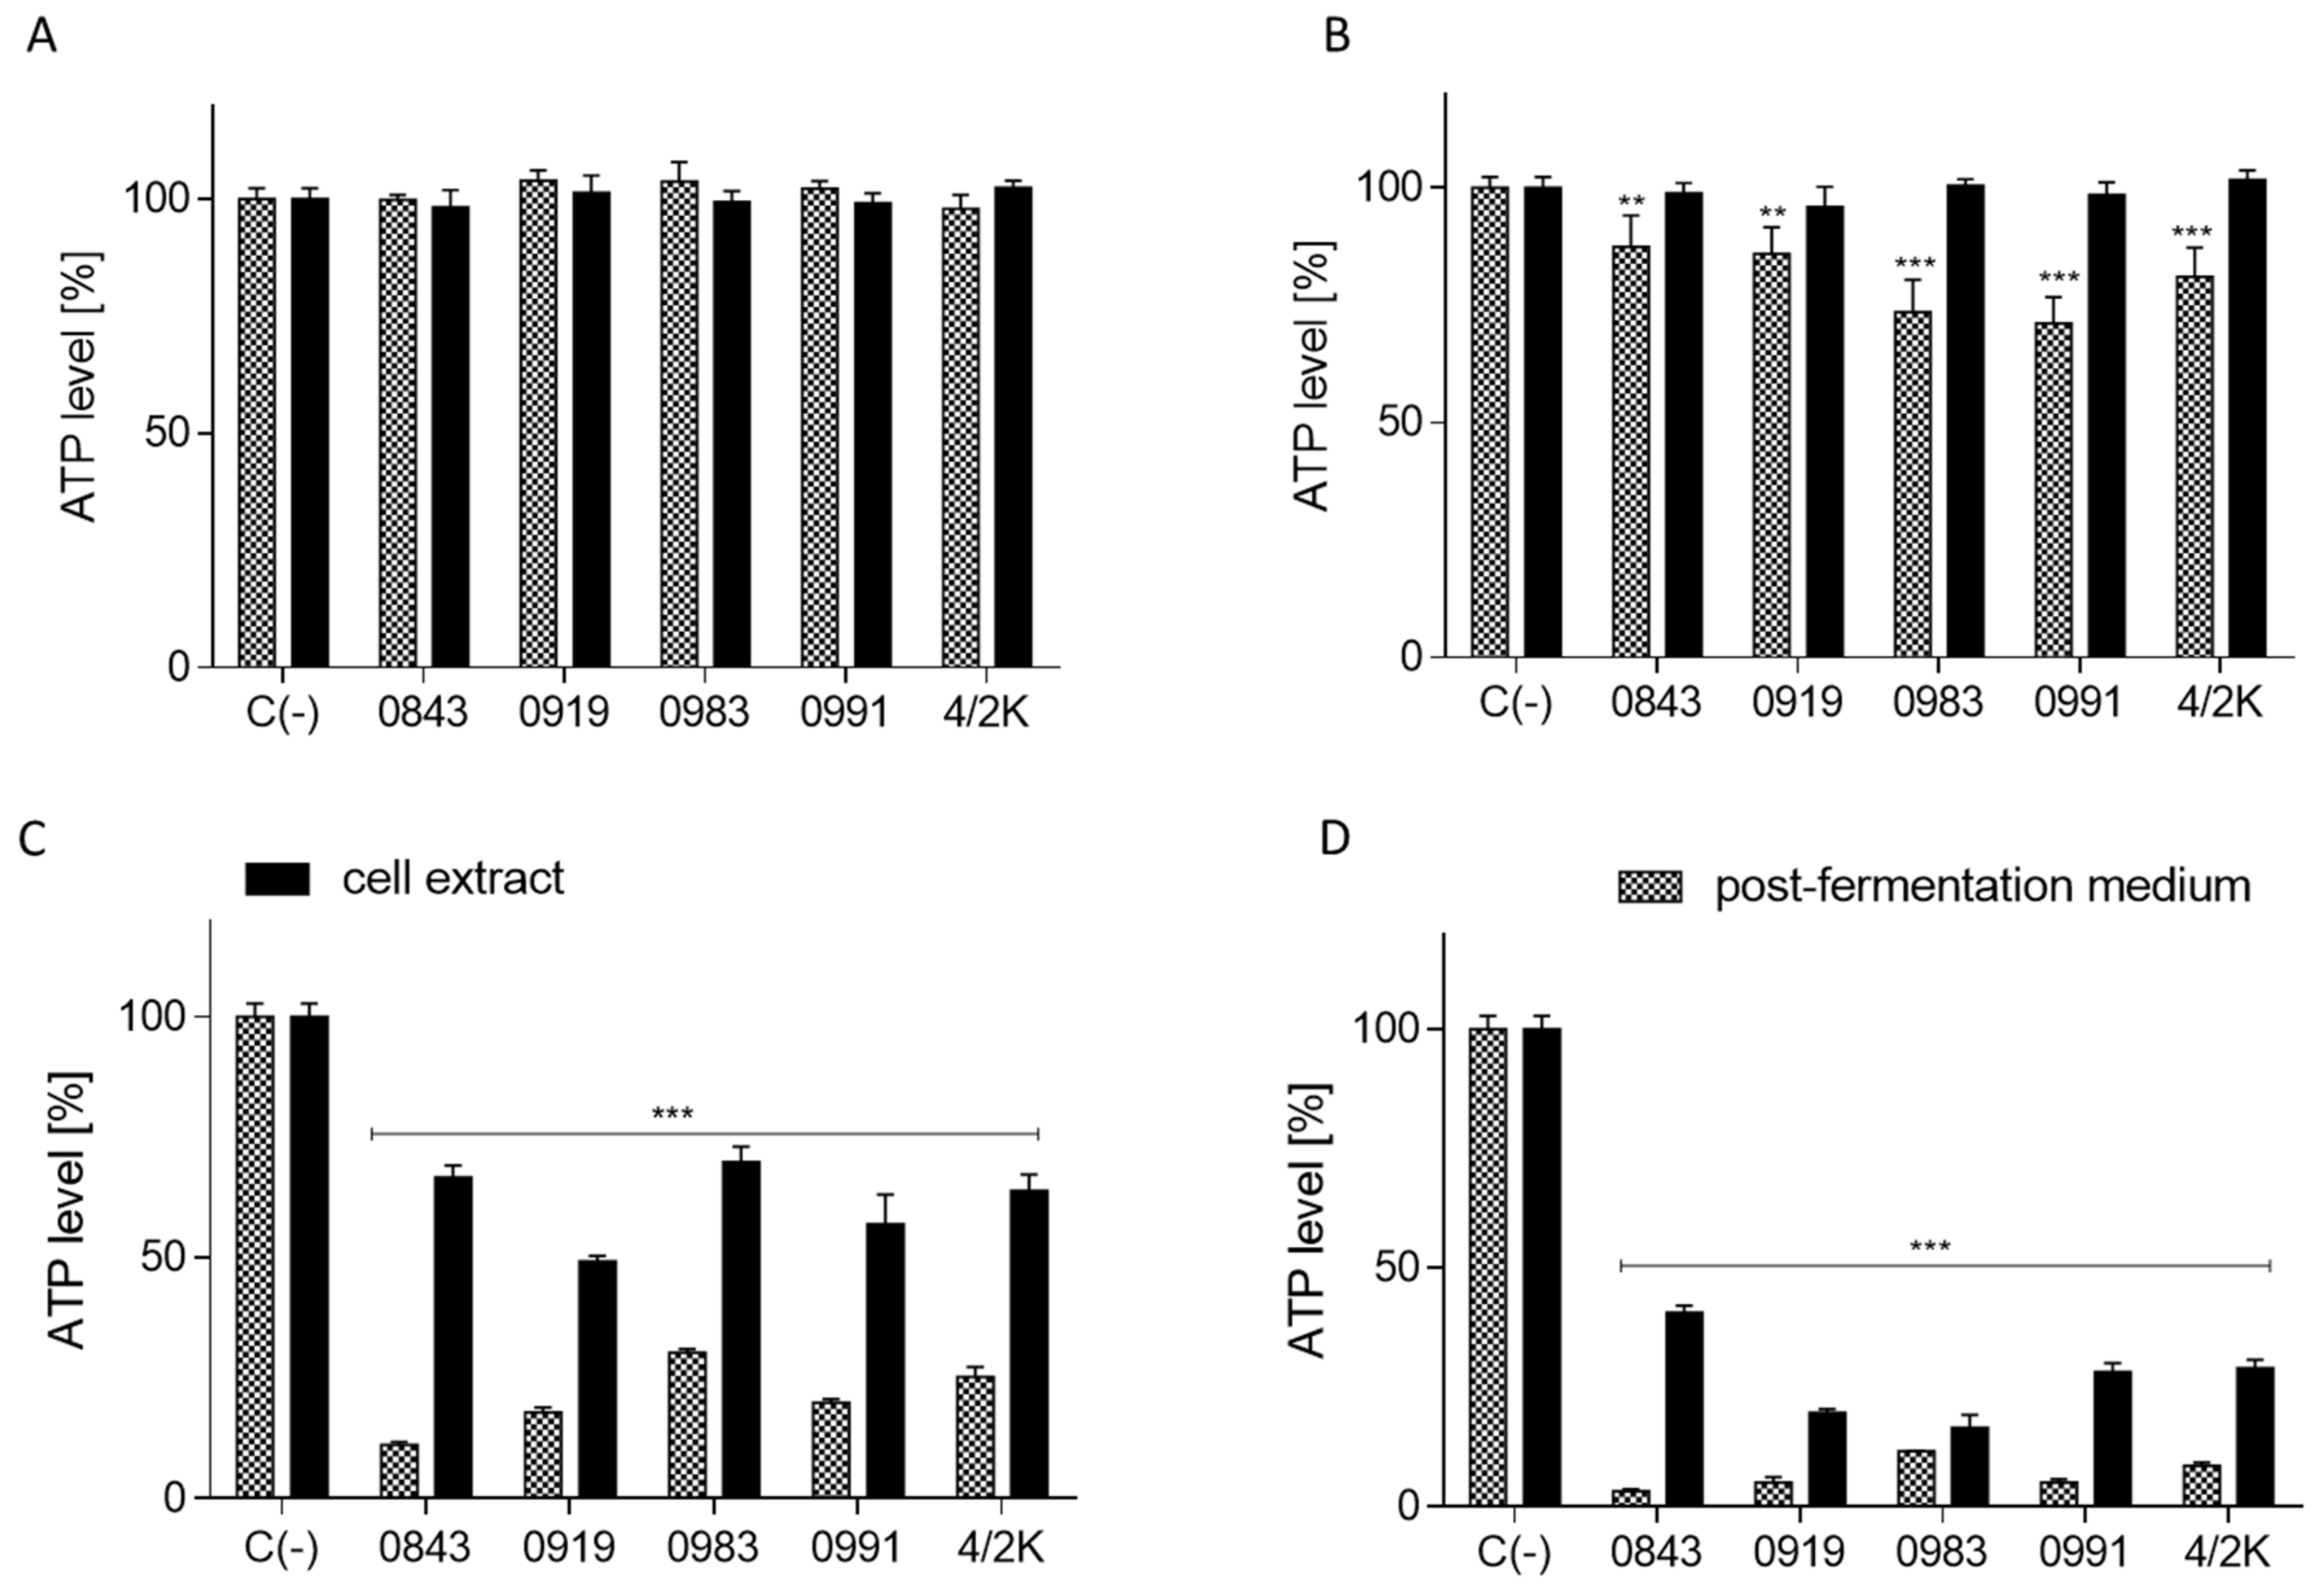
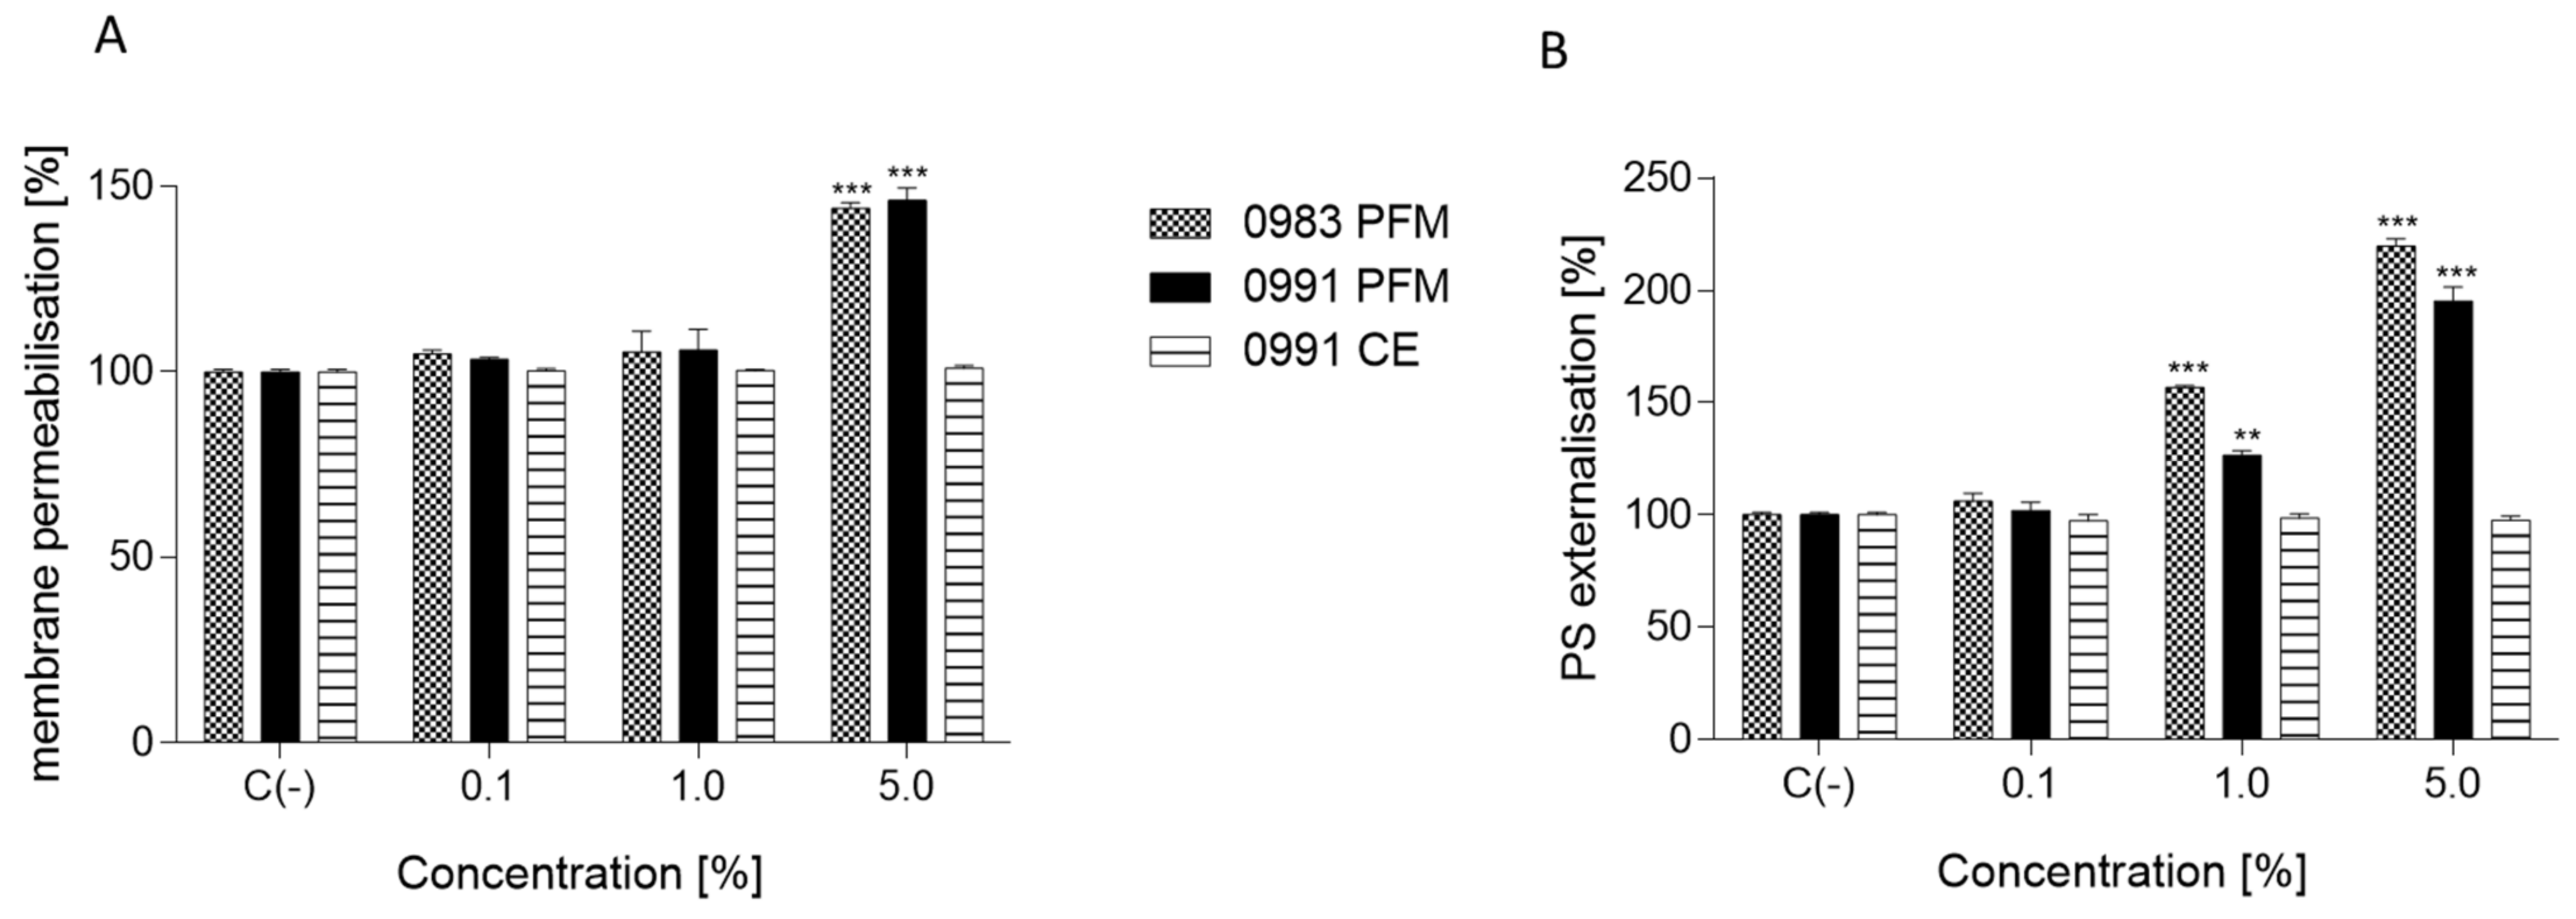
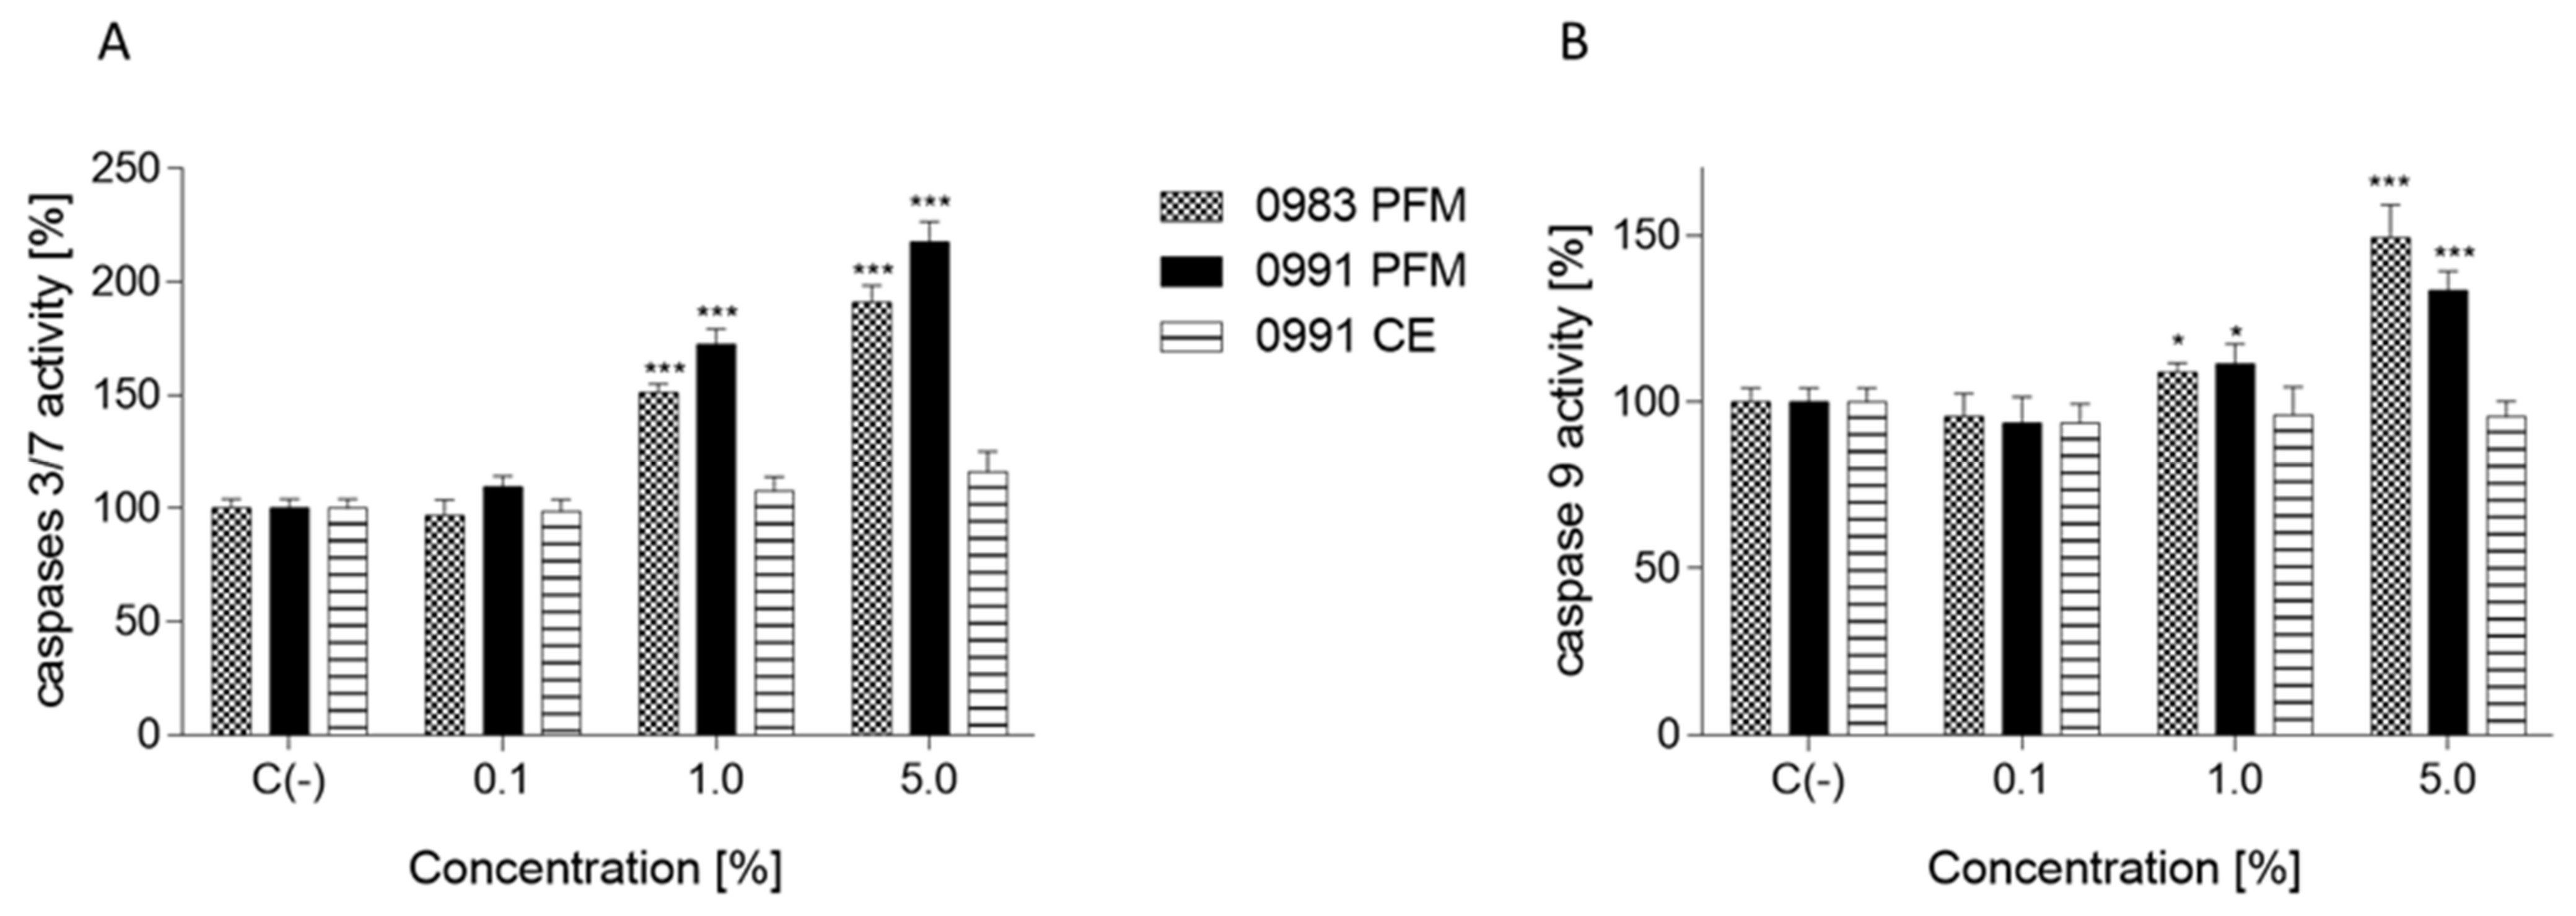
3.4. Effects of PFM and CEs on ATP Production, PS Externalisation, Membrane Permeabilisation, and Cell Death
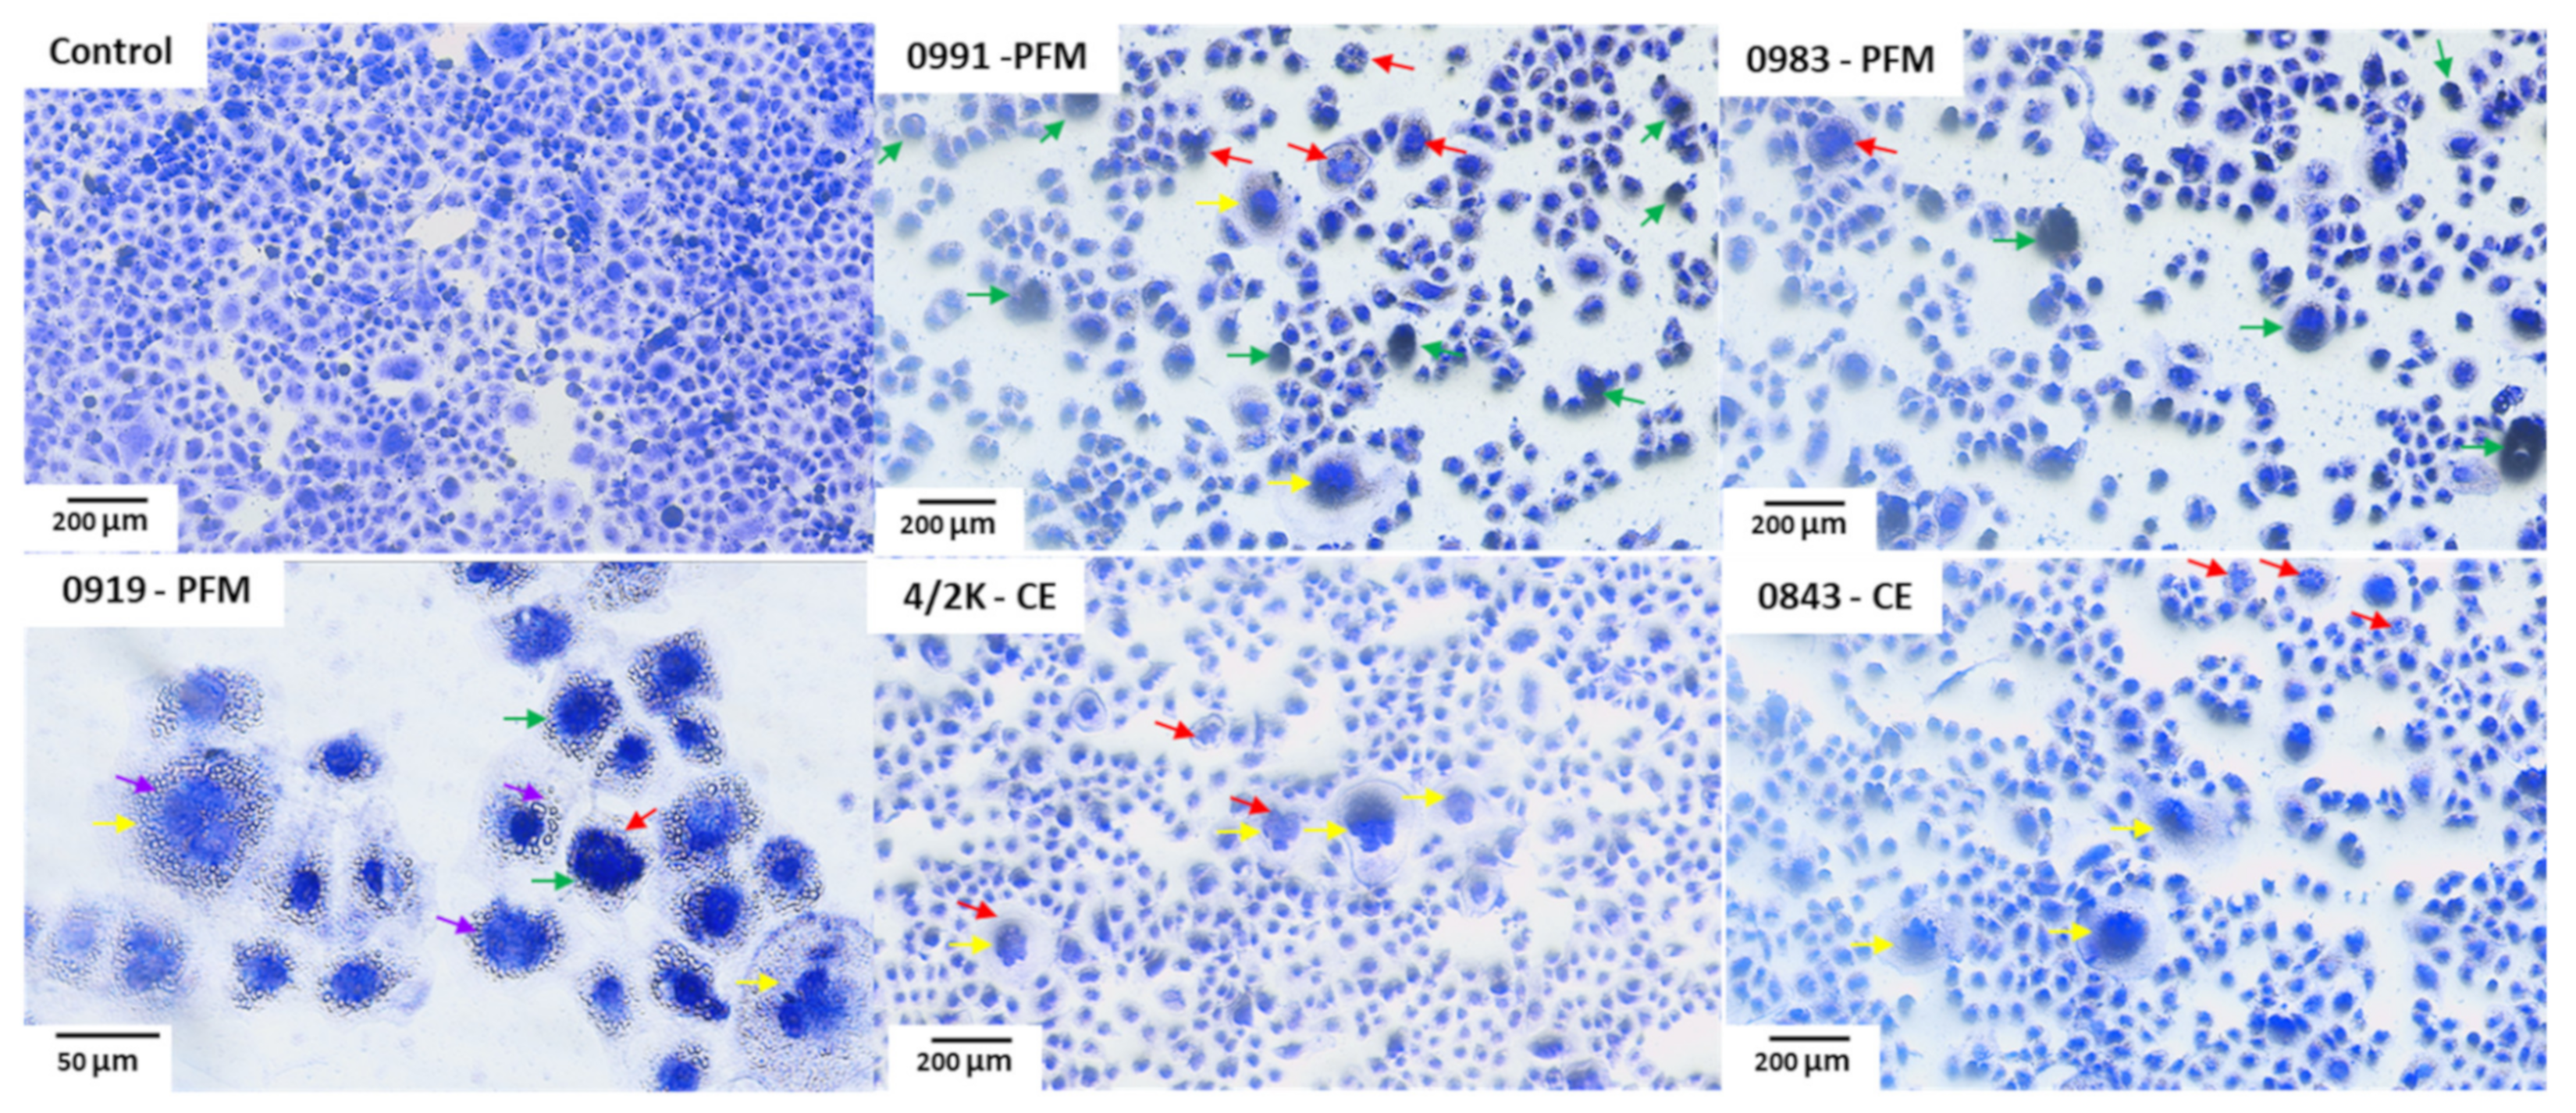
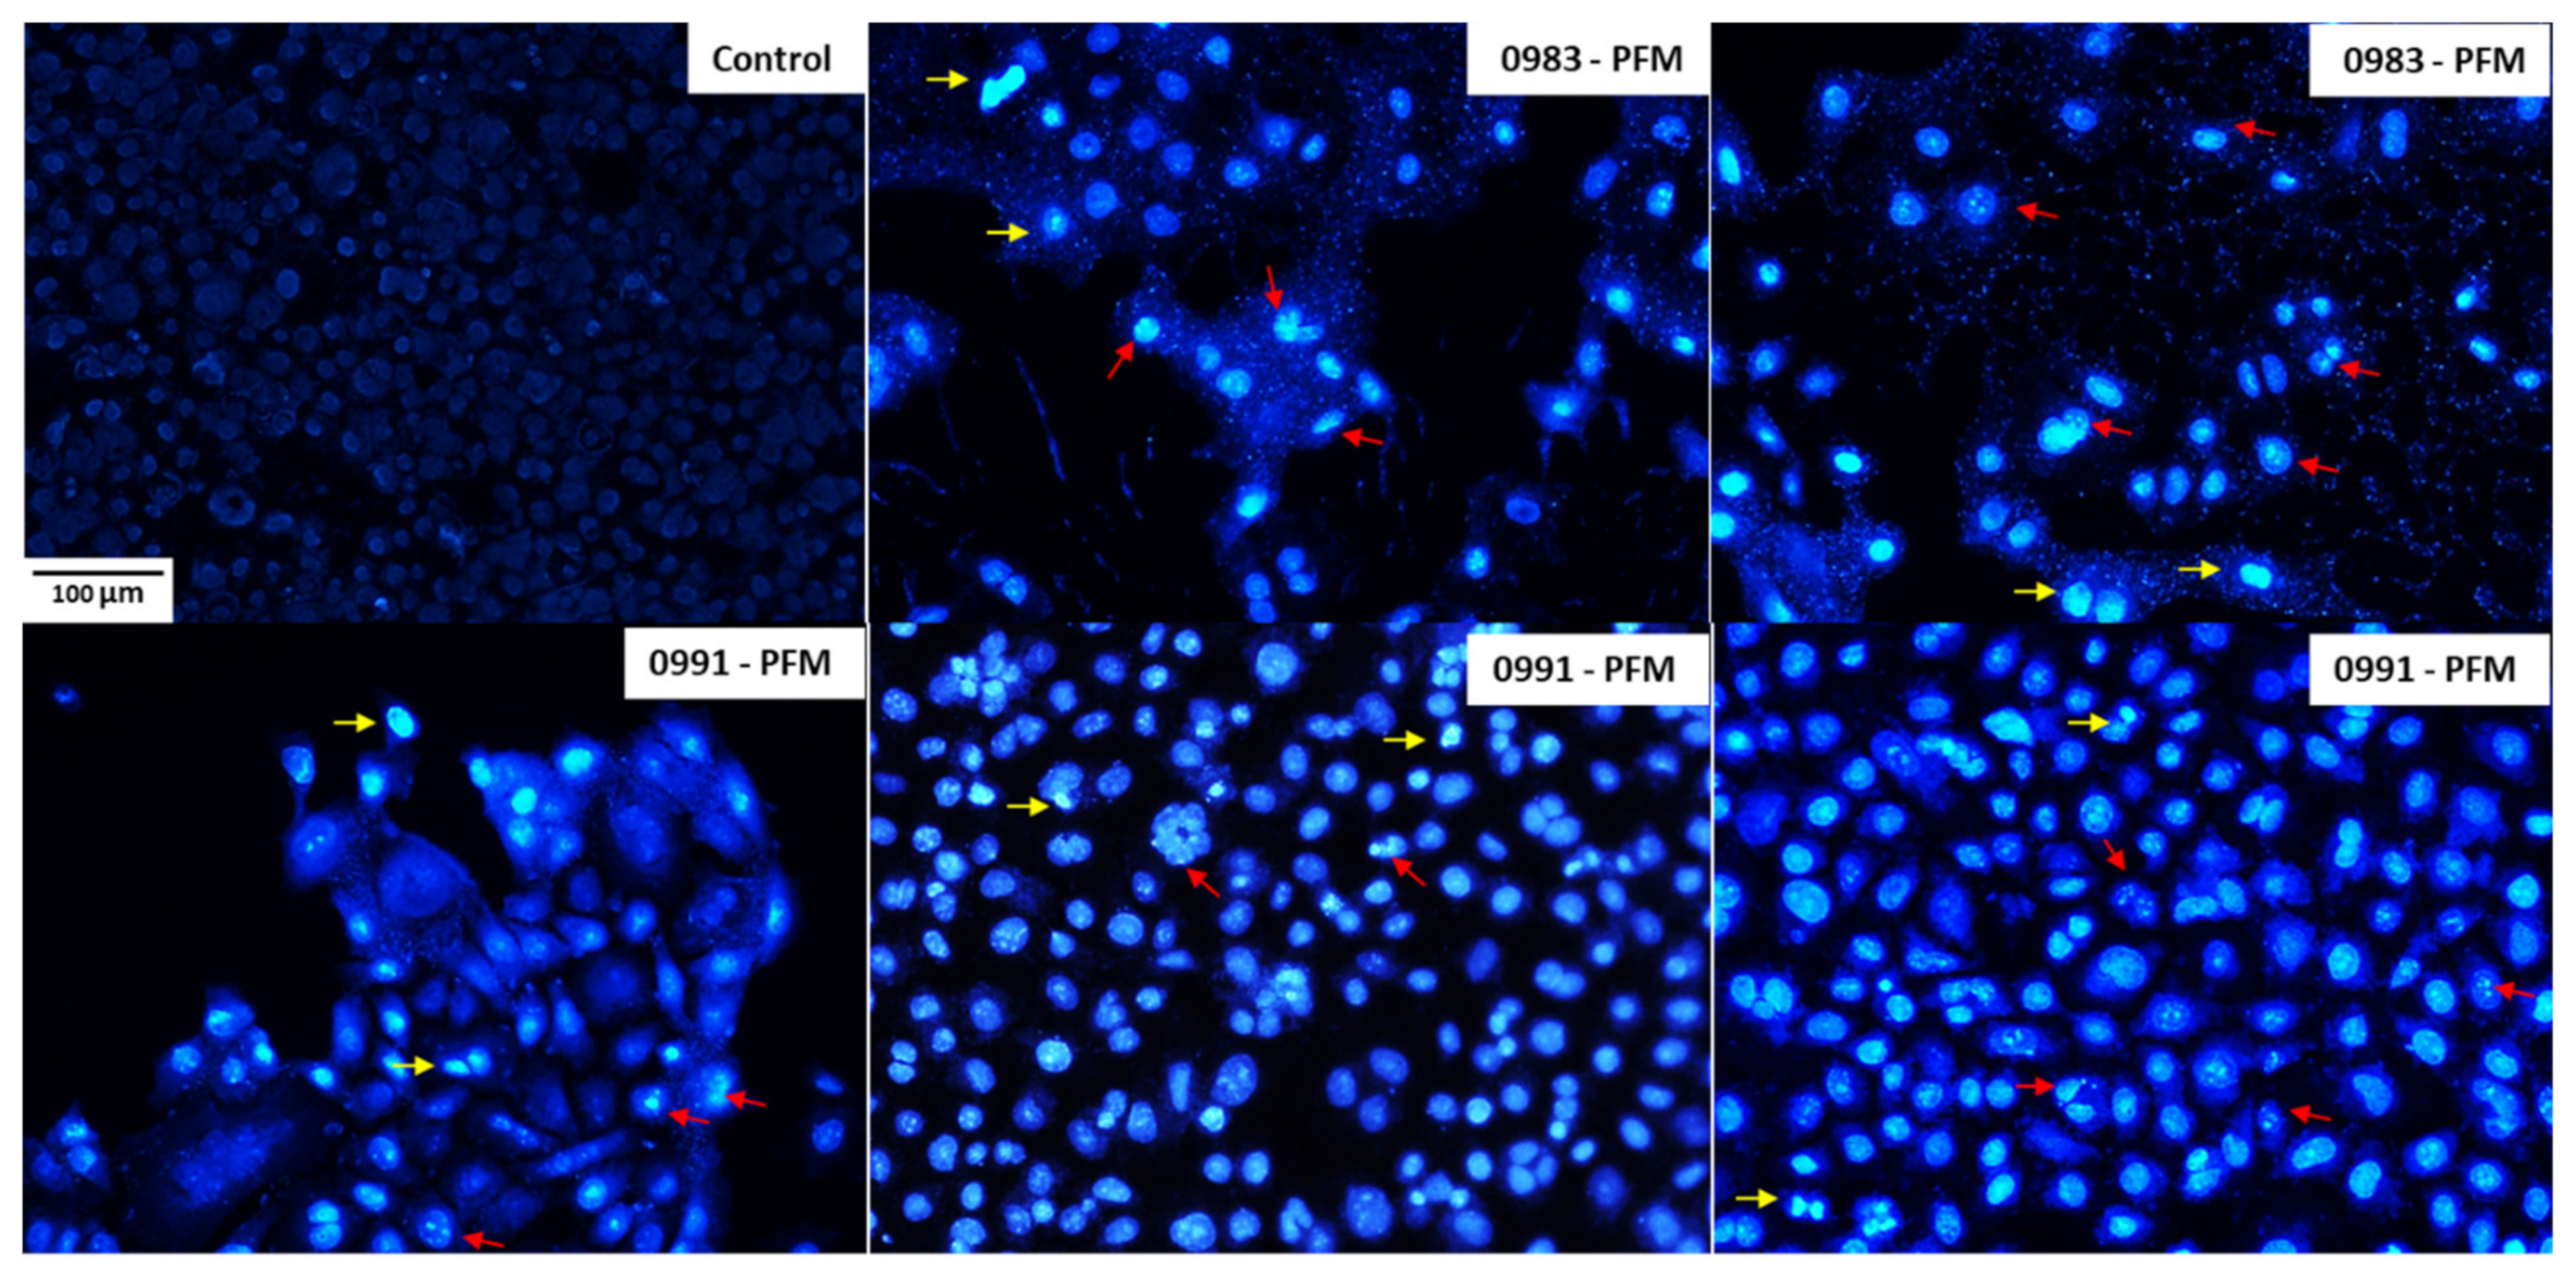
3.5. Effects of PFM and CE Treatment on Cell Monolayer and Cell Morphology
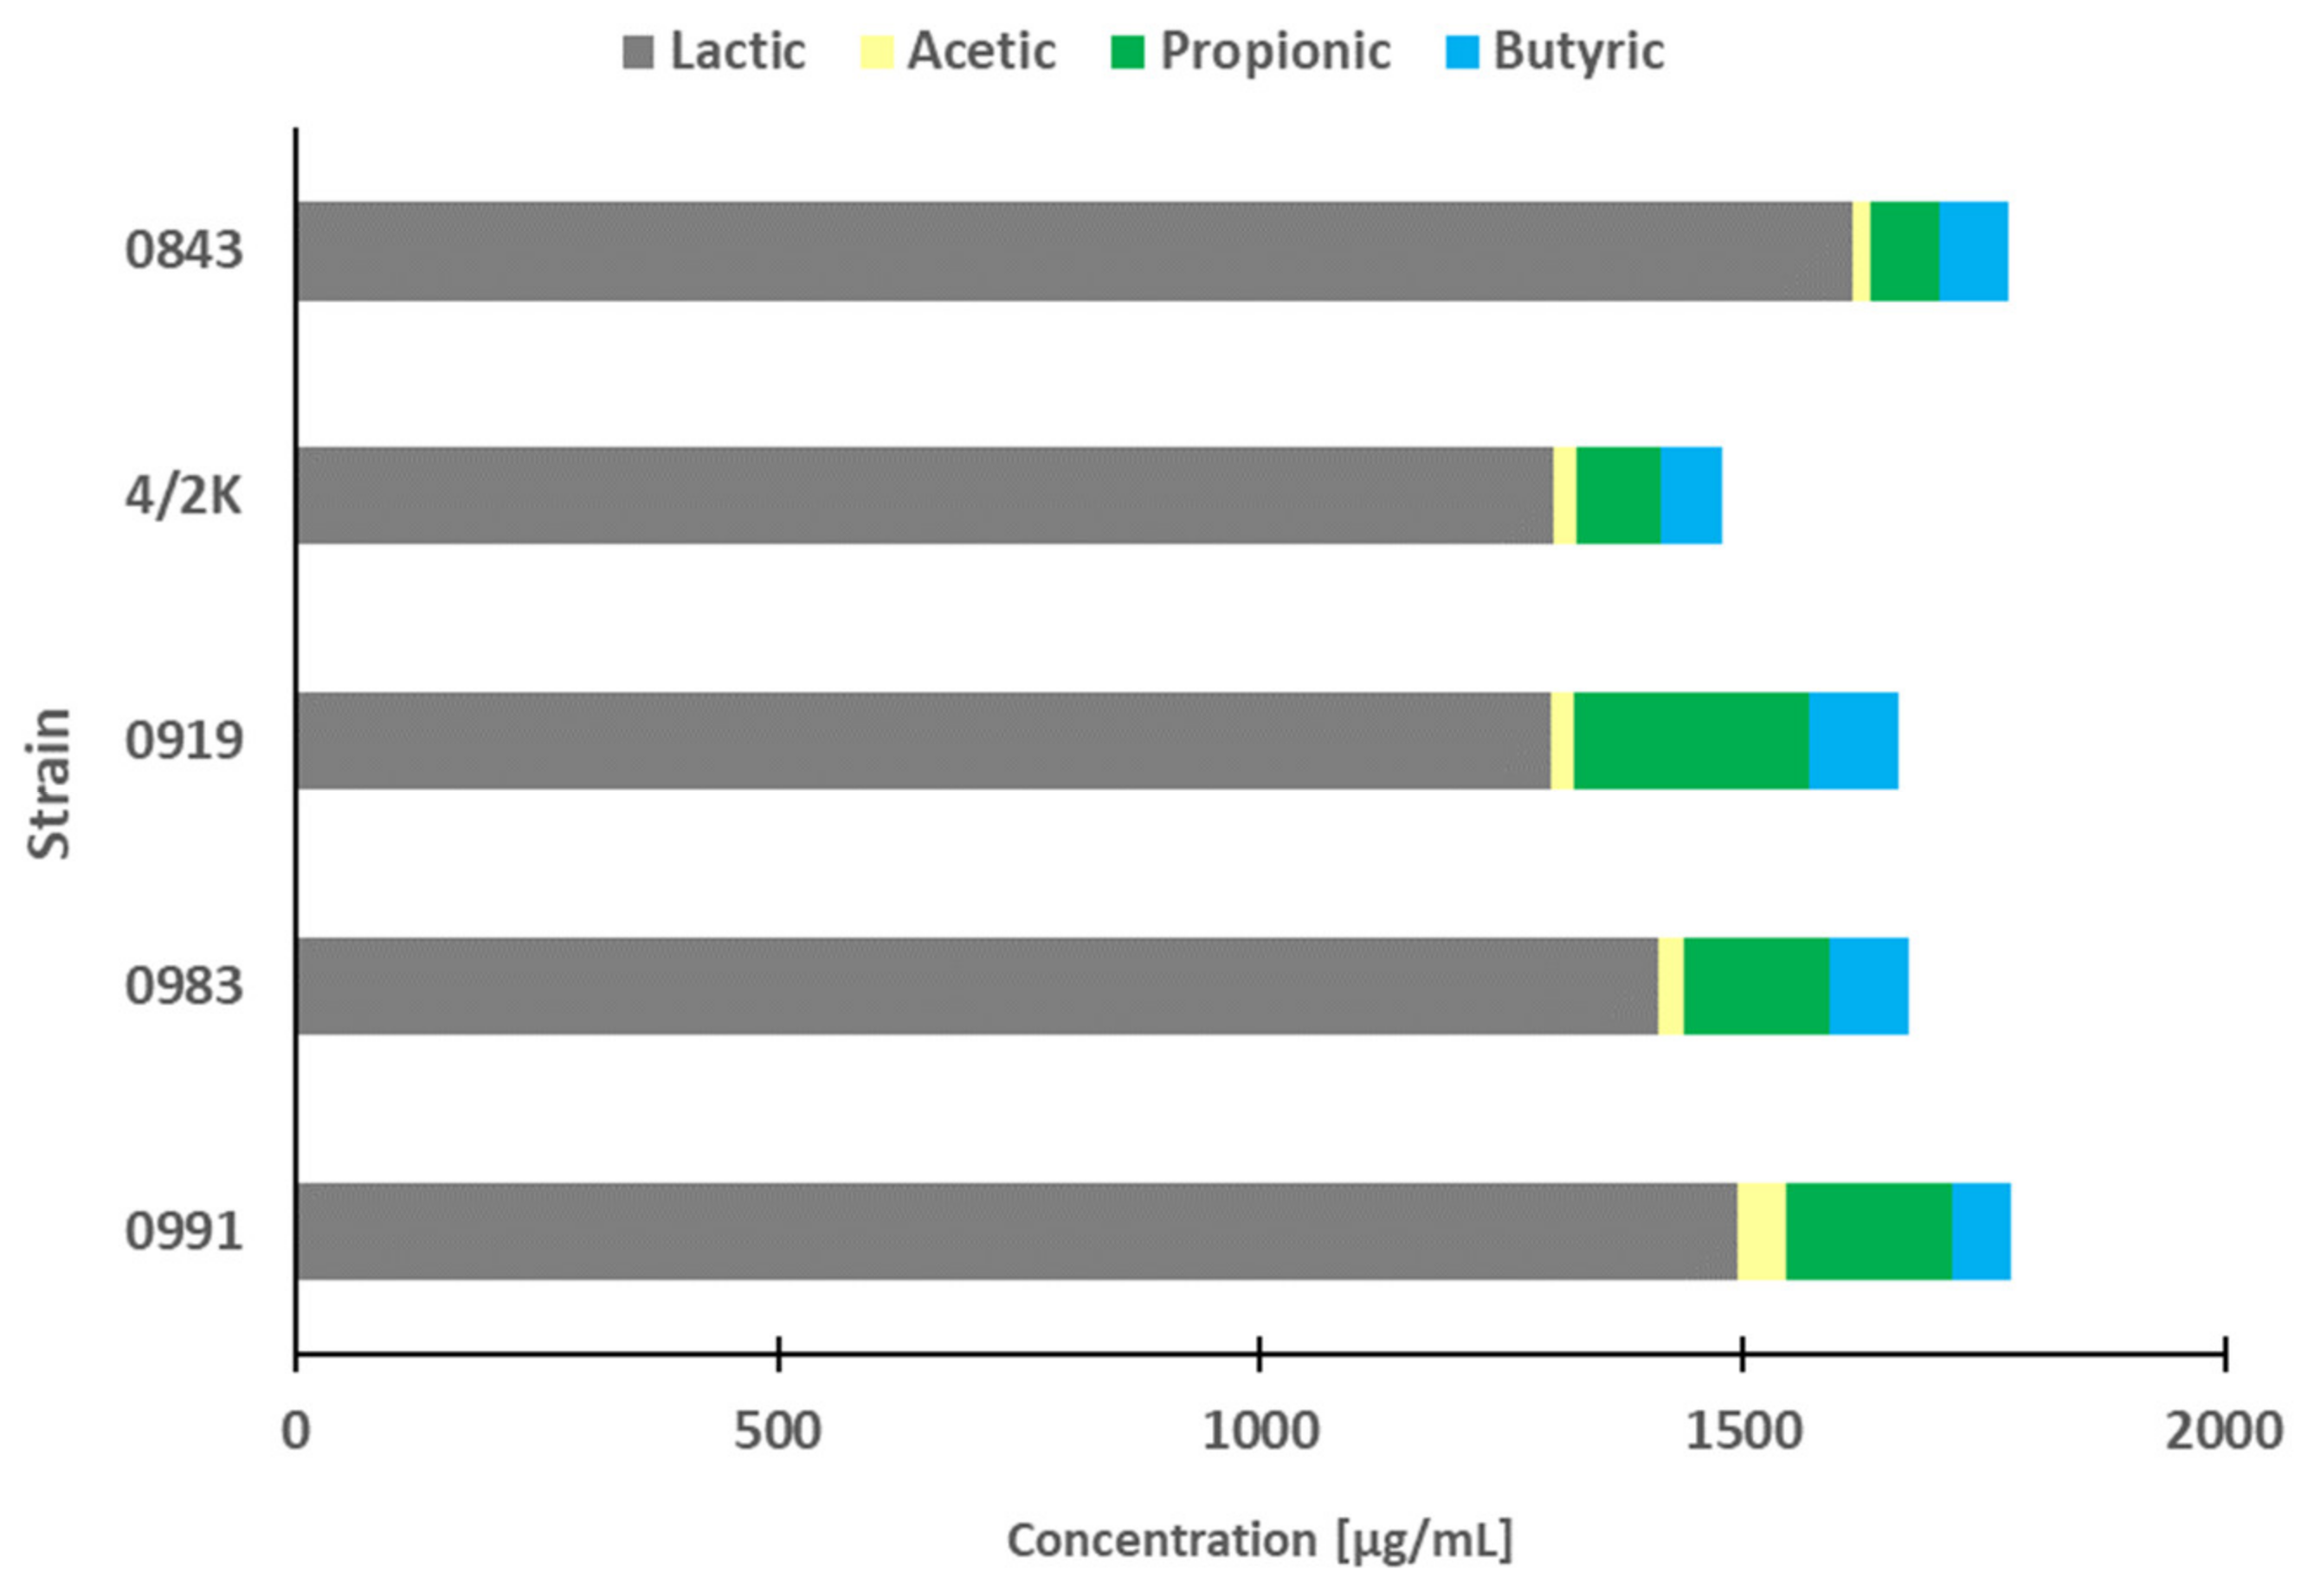
3.6. SCFA and LA Profiles in PFM and Cytotoxic Activity of Pure Acids
4. Conclusions
Author Contributions
Funding
Institutional Review Board Statement
Informed Consent Statement
Data Availability Statement
Acknowledgments
Conflicts of Interest
References
- WHO (World Health Organization). Global Cancer Rates Could Increase by 50% to 15 Million by 2020. Available online: https://www.who.int/news/item/03-04-2003-global-cancer-rates-could-increase-by-50-to-15-million-by-2020 (accessed on 21 February 2020).
- IARC (International Agency on Research on Cancer). Cancer Tomorrow. Available online: https://gco.iarc.fr/tomorrow/en/dataviz/isotype?cancers=8&single_unit=50000&types=1 (accessed on 21 February 2020).
- Thursby, E.; Juge, N. Introduction to the human gut microbiota. Biochem. J. 2017, 474, 1823–1836. [Google Scholar] [CrossRef] [PubMed]
- Allsopp, P.; Rowland, I.R. Potential protective effects of probiotics and prebiotics against colorectal cancer. In Prebiotics and Probiotics Science and Technology; Charalampopoulos, D., Rastall, R.A., Eds.; Springer: Heidelberg, Germany, 2009; pp. 997–1048. [Google Scholar]
- Hill, C.; Guarner, F.; Reid, G.; Gibson, G.R.; Merenstein, D.J.; Pot, B.; Morelli, L.; Canani, R.B.; Flint, H.J.; Salminen, S.; et al. Expert consensus document: The International Scientific Association for Probiotics and Prebiotics consensus statement on the scope and appropriate use of the term probiotic. Nat. Rev. Gastroenterol. Hepatol. 2014, 11, 506–514. [Google Scholar] [CrossRef] [PubMed] [Green Version]
- Salminen, S.; Collado, M.C.; Endo, A.; Hill, C.; Lebeer, S.; Quigley, E.M.M.; Sanders, M.E.; Shamir, R.; Swann, J.R.; Szajewska, H.; et al. The International Scientific Association of Probiotics and Prebiotics (ISAPP) consensus statement on the definition and scope of postbiotics. Nat. Rev. Gastroenterol. Hepatol. 2021, 18, 649–667. [Google Scholar] [CrossRef] [PubMed]
- Nowak, A.; Paliwoda, A.; Błasiak, J. Anti-proliferative, pro-apoptotic and anti-oxidative activity of Lactobacillus and Bifidobacterium strains: A Review of mechanisms and therapeutic perspectives. Crit. Rev. Food Sci. Nutr. 2019, 59, 3456–3467. [Google Scholar] [CrossRef]
- Thirabunyanon, M.; Boonprasom, P.; Niamsup, P. Probiotic potential of lactic acid bacteria isolated from fermented dairy milks on antiproliferation of colon cancer cells. Biotechnol. Lett. 2009, 31, 571–576. [Google Scholar] [CrossRef]
- Awaisheh, S.S.; Maher, O.; Al-Tamimi, H.; Assaf, A.M.; El-Qudah, J.M.; Al-Khaza’leh, J.M.; Rahahleh, R.J. In vitro cytotoxic activity of probiotic bacterial cell extracts against Caco-2 and HRT-18 colorectal cancer cells. Milk Sci. Int. 2016, 69, 27–31. [Google Scholar]
- Tiptiri-Kourpeti, A.; Spyridopoulou, K.; Santarmaki, V.; Aindelis, G.; Tompoulidou, E.; Lamprianidou, E.E.; Saxami, G.; Ypsilantis, P.; Lampri, E.S.; Simopoulos, C.; et al. Lactobacillus casei Exerts Anti-Proliferative Effects Accompanied by Apoptotic Cell Death and Up-Regulation of TRAIL in Colon Carcinoma Cells. PLoS ONE 2016, 11, e0147960. [Google Scholar] [CrossRef]
- Chuah, L.-O.; Foo, H.L.; Loh, T.C.; Mohammed Alitheen, N.B.; Yeap, S.K.; Abdul Mutalib, N.E.; Abdul Rahim, R.; Yusoff, K. Postbiotic metabolites produced by Lactobacillus plantarum strains exert selective cytotoxicity effects on cancer cells. BMC Complement. Altern. Med. 2019, 19, 114. [Google Scholar] [CrossRef] [Green Version]
- Rabiei, M.; Zarrini, G.; Mahdavi, M. Isolation and Characterization of Lactobacillus paracasei ST1 from Region of Azerbaijan “Shoor” Dairy Product and Study of Anticancer and Anti-Proliferation Activities by Supernatant of Strain on HCT116 Colorectal Tumor Cells In Vitro. Jentashapir J. Cell. Mol. Biol. 2020, 11, e107803. [Google Scholar] [CrossRef]
- Faghfoori, Z.; Faghfoori, M.H.; Saber, A.; Izadi, A.; Yari Khosroushahi, A. Anticancer effects of bifidobacteria on colon cancer cell lines. Cancer Cell Int. 2021, 21, 1–12. [Google Scholar] [CrossRef]
- Yue, Y.; Wang, S.; Shi, J.; Xie, Q.; Li, N.; Guan, J.; Evivie, S.E.; Liu, F.; Li, B.; Huo, G. Effects of Lactobacillus acidophilus KLDS1.0901 on Proliferation and Apoptosis of Colon Cancer Cells. Front. Microbiol. 2022, 12, 788040. [Google Scholar] [CrossRef]
- Khoury, N.; El-Hayek, S.; Tarras, O.; El-Sabban, M.; El-Sibai, M.; Rizk, S. Kefir exhibits anti-proliferative and pro-apoptotic effects on colon adenocarcinoma cells with no significant effects on cell migration and invasion. Int. J. Oncol. 2014, 45, 2117–2127. [Google Scholar] [CrossRef]
- Orlando, A.; Refolo, M.G.; Messa, C.; Amati, L.; Lavermicocca, P.; Guerra, V.; Russo, F. Antiproliferative and proapoptotic effects of viable or heat-killed Lactobacillus paracasei IMPC2.1 and Lactobacillus rhamnosus GG in HGC-27 gastric and DLD-1 colon cell lines. Nutr. Cancer 2012, 64, 1103–1111. [Google Scholar] [CrossRef]
- Nami, Y.; Abdullah, N.; Haghshenas, B.; Radiah, D.; Rosli, R.; Khosroushahi, A.Y. Assessment of probiotic potential and anticancer activity of newly isolated vaginal bacterium Lactobacillus plantarum 5BL. Microbiol. Immunol. 2014, 58, 492–502. [Google Scholar] [CrossRef]
- Kahouli, I.; Malhotra, M.; Alaoui-Jamali, M.; Prakash, S. In-vitro characterization of the anti-cancer activity of the probiotic bacterium Lactobacillus fermentum NCIMB 5221 and potential against colorectal cancer. J. Cancer Sci. Ther. 2015, 7, 224–235. [Google Scholar]
- Riaz Rajoka, M.S.; Zhao, H.; Lu, Y.; Lian, Z.; Li, N.; Hussain, N.; Shao, D.; Jin, M.; Li, Q.; Shi, J. Anticancer potential against cervix cancer (HeLa) cell line of probiotic Lactobacillus casei and Lactobacillus paracasei strains isolated from human breast milk. Food Funct. 2018, 9, 2705–2715. [Google Scholar] [CrossRef]
- Kumar, K.S.; Sastry, N.; Polaki, H.; Mishra, V. Colon cancer prevention through probiotics: An overview. J. Cancer Sci. Ther. 2015, 7, 81–92. [Google Scholar]
- Nowak, A.; Kuberski, S.; Libudzisz, Z. Probiotic lactic acid bacteria detoxify N-nitrosodimethylamine. Food Addit. Contam. Part A 2014, 31, 1678–1687. [Google Scholar] [CrossRef]
- Nowak, A.; Czyżowska, A.; Stańczyk, M. Protective activity of probiotic bacteria against 2-amino-3-methyl-3H-imidazo [4,5-f]quinoline (IQ) and 2-amino-1-methyl-6-phenyl-1H-imidazo[4,5-b]pyridine (PhIP)—An in vitro study. Food Addit. Contam. Part A 2015, 32, 1927–1938. [Google Scholar] [CrossRef]
- Nowak, A.; Śliżewska, K.; Otlewska, A. Antigenotoxic activity of lactic acid bacteria, prebiotics, and products of their fermentation against selected mutagens. Regul. Toxicol. Pharmacol. 2015, 73, 938–946. [Google Scholar] [CrossRef]
- Biomed. Latopic. Available online: https://www.biomed.pl/en/produkt/latopic (accessed on 7 February 2022).
- Nowak, A.; Zakłos-Szyda, M.; Żyżelewicz, D.; Koszucka, A.; Motyl, I. Acrylamide Decreases Cell Viability, and Provides Oxidative Stress, DNA Damage, and Apoptosis in Human Colon Adenocarcinoma Cell Line Caco-2. Molecules 2020, 25, 368. [Google Scholar] [CrossRef] [Green Version]
- OECD. Guidelines for the Testing of Chemicals, Section 4. Test No. 442D: In Vitro Skin Sensitisation are-nrf2 Luciferase Test Method. Available online: https://ntp.niehs.nih.gov/iccvam/suppdocs/feddocs/oecd/oecd-tg442d-508.pdf (accessed on 7 February 2022).
- Chen, P.; You, Q.; Li, X.; Chang, Q.; Zhang, Y.; Zheng, B.; Hu, X.; Zeng, H. Polysaccharide fractions from Fortunell margarita affect proliferation of Bifidobacterium adolescentis ATCC 15703 and undergo structural changes following fermentation. Int. J. Biol. Macromol. 2019, 123, 1070–1078. [Google Scholar] [CrossRef]
- Shukla, R.; Iliev, I.; Goyal, A. Leuconostoc mesenteroides NRRL B-1149 as probiotic and its dextran with anticancer properties. J. BioSci. Biotech. 2014, 3, 79–87. [Google Scholar]
- Sadeghi-Aliabadi, H.; Mohammadi, F.; Fazeli, H.; Mirlohi, M. Effects of Lactobacillus plantarum A7 with probiotic potential on colon cancer and normal cells proliferation in comparison with a commercial strain. Iran J. Basic. Med. Sci. 2014, 17, 815–819. [Google Scholar]
- Chen, Z.-Y.; Hsieh, Y.-M.; Huang, C.-C.; Tsai, C.-C. Inhibitory Effects of Probiotic Lactobacillus on the Growth of Human Colonic Carcinoma Cell Line HT-29. Molecules 2017, 22, 107. [Google Scholar] [CrossRef]
- Arian, S.; Kaboosi, H.; Heshmatipour, Z.; Khazaei Koohpar, Z.; Pyravii Ghadikolaii, F. Anti-Proliferative Effects of Two New Lactobacillus Strains of Human Origin on Caco-2 Cell Line. Iran. Red Crescent Med. J. 2019, 21, e84683. [Google Scholar] [CrossRef]
- Baghbani-Arani, F.; Asgary, V.; Hashemi, A. Cell-free extracts of Lactobacillus acidophilus and Lactobacillus delbrueckii display antiproliferative and antioxidant activities against HT-29 cell line. Nutr. Cancer 2020, 72, 1390–1399. [Google Scholar] [CrossRef]
- Guo, Y.; Zhang, T.; Gao, J.; Jiang, X.; Tao, M.; Zeng, X.; Wu, Z.; Pan, D. Lactobacillus acidophilus CICC 6074 inhibits growth and induces apoptosis in colorectal cancer cells in vitro and in HT-29 cells induced-mouse model. J. Funct. Foods 2020, 75, 104290. [Google Scholar] [CrossRef]
- Dehghani, N.; Tafvizi, F.; Jafari, P. Cell cycle arrest and anti-cancer potential of probiotic Lactobacillus rhamnosus against HT-29 cancer cells. Bioimpacts 2021, 11, 245–252. [Google Scholar] [CrossRef]
- Nouri, Z.; Karami, F.; Neyazi, N.; Modarressi, M.H.; Karimi, R.; Khorramizadeh, M.R.; Taheri, B.; Motevaseli, E. Dual Anti-Metastatic and Anti-Proliferative Activity Assessment of Two Probiotics on HeLa and HT-29 Cell Lines. Cell J. 2016, 18, 127–134. [Google Scholar] [CrossRef] [PubMed]
- Saxami, G.; Karapetsasa, A.; Lamprianidou, E.; Kotsianidis, I.; Chlichlia, A.; Tassouc, C.; Zoumpourlis, V.; Galanis, A. Two potential probiotic Lactobacillus strains isolated from olive microbiota exhibit adhesion and anti-proliferative effects in cancer cell lines. J. Func. Foods 2016, 24, 461–471. [Google Scholar] [CrossRef]
- Shokryazdan, P.; Jahromi, M.F.; Bashokouh, F.; Idrus, Z.; Liang, J.B. Antiproliferation effects and antioxidant activity of two new Lactobacillus strains. Braz. J. Food Technol. 2018, 21, e2016064. [Google Scholar] [CrossRef] [Green Version]
- Yue, Y.-C.; Yang, B.-Y.; Lu, J.; Zhang, S.-W.; Liu, L.; Nassar, K.; Xu, X.-X.; Pang, X.-J.; Lv, J.-P. Metabolite secretions of Lactobacillus plantarum YYC-3 may inhibit colon cancer cell metastasis by suppressing the VEGF-MMP2/9 signaling pathway. Microb. Cell Fact. 2020, 19, 213. [Google Scholar] [CrossRef]
- Srikham, K.; Daengprok, W.; Niamsup, P.; Thirabunyanon, M. Characterization of Streptococcus salivarius as New Probiotics Derived from Human Breast Milk and Their Potential on Proliferative Inhibition of Liver and Breast Cancer Cells and Antioxidant Activity. Front. Microbiol. 2021, 12, 797445. [Google Scholar] [CrossRef]
- Haghshenas, B.; Abdullah, N.; Nami, Y.; Radiah, D.; Rosli, R.; Khosroushahi, A.Y. Different effects of two newly-isolated probiotic Lactobacillus plantarum 15HN and Lactococcus lactis subsp. lactis 44Lac strains from traditional dairy products on cancer cell lines. Anaerobe 2014, 30, 51–59. [Google Scholar] [CrossRef]
- Wan, Y.; Xin, Y.; Zhang, C.; Wu, D.; Ding, D.; Tang, L.; Owusu, L.; Bai, J.; Li, W. Fermentation supernatants of Lactobacillus delbrueckii inhibit growth of human colon cancer cells and induce apoptosis through a caspase 3-dependent pathway. Oncol. Lett. 2014, 7, 1738–1742. [Google Scholar] [CrossRef] [Green Version]
- Jafari-Nasab, T.; Khaleghi, M.; Farsinejad, A.; Khorrami, S. Probiotic potential and anticancer properties of Pediococcus sp. isolated from traditional dairy products. Biotechnol. Rep. 2021, 29, e00593. [Google Scholar] [CrossRef]
- Soltan Dallal, M.M.; Mojarrad, M.; Baghbani, F.; Raoofian, R.; Mardaneh, J.; Salehipour, Z. Effects of probiotic Lactobacillus acidophilus and Lactobacillus casei on colorectal tumor cells activity (CaCo-2). Arch. Iran. Med. 2015, 18, 167–172. [Google Scholar]
- Choi, S.S.; Kim, Y.; Han, K.S.; You, S.; Oh, S.; Kim, S.H. Effects of Lactobacillus strains on cancer cell proliferation and oxidative stress in vitro. Lett. Appl. Microbiol. 2006, 42, 452–458. [Google Scholar] [CrossRef]
- Haghshenas, B.; Nami, Y.; Haghshenas, M.; Abdullah, N.; Rosli, R.; Radiah, D.; Khosroushahi, A.Y. Bioactivity characterization of Lactobacillus strains isolated from dairy products. MicrobiologyOpen 2015, 4, 803–813. [Google Scholar] [CrossRef]
- Shehata, M.G.; Abu-Serie, M.M.; Abd El-Aziz, N.M.; El-Sohaimy, S.A. In vitro Assessment of Antioxidant, Antimicrobial and Anticancer Properties of Lactic Acid Bacteria. Int. J. Pharmacol. 2019, 15, 651–663. [Google Scholar] [CrossRef] [Green Version]
- Kong, Y.; Olejar, K.J.; On, S.L.W.; Chelikani, V. The Potential of Lactobacillus spp. for Modulating Oxidative Stress in the Gastrointestinal Tract. Antioxidants 2020, 9, 610. [Google Scholar] [CrossRef]
- El-Adawi, H.I.; Khalil, M.A.; El-sheekh, M.; El-Deeb, N.; Hussein, M.Z. Cytotoxicity assay and antioxidant activities of the lactic acid bacterial strains. African J. Microbiol. Res. 2012, 6, 1700–1712. [Google Scholar]
- Ghoneum, M.; Felo, N. Selective induction of apoptosis in human gastric cancer cells by Lactobacillus kefiri (PFT), a novel kefir product. Oncol. Rep. 2015, 34, 1659–1666. [Google Scholar] [CrossRef] [Green Version]
- Xu, C.; Xia, Y.; Huang, L.; Chen, H.; Zhang, X.; Yao, Q. Role of gut probiotic microbiota in the apoptosis of gastrointestinal cancer. Oxid Commun. 2016, 39, 214–222. [Google Scholar]
- Altonsy, M.O.; Andrews, S.C.; Tuohy, K.M. Differential induction of apoptosis in human colonic carcinoma cells (Caco-2) by Atopobium, and commensal, probiotic and enteropathogenic bacteria: Mediation by the mitochondrial pathway. Int. J. Food Microbiol. 2010, 137, 190–203. [Google Scholar] [CrossRef]
- Den Besten, G.; van Eunen, K.; Groen, A.K.; Venema, K.; Reijngoud, D.-J.; Bakker, B.M. The role of short-chain fatty acids in the interplay between diet, gut microbiota, and host energy metabolism. J. Lipid Res. 2013, 54, 2325–2340. [Google Scholar] [CrossRef] [Green Version]
- Topping, D.L.; Clifton, P.M. Short-Chain Fatty Acids and Human Colonic Function: Roles of Resistant Starch and Nonstarch Polysaccharides. Physiol. Rev. 2001, 81, 1031–1064. [Google Scholar] [CrossRef]
- Mirzaei, R.; Afaghi, A.; Babakhani, S.; Sohrabi, M.R.; Hosseini-Fard, S.R.; Babolhavaeji, K.; Akbari, S.K.A.; Yousefimashouf, R.; Karampoor, S. Role of microbiota-derived short-chain fatty acids in cancer development and prevention. Biomed. Pharmacother. 2021, 139, 111619. [Google Scholar] [CrossRef]
- Pham, C.-H.; Lee, J.-E.; Yu, J.; Lee, S.-H.; Yu, K.-R.; Hong, J.; Cho, N.; Kim, S.; Kang, D.; Lee, S.; et al. Anticancer Effects of Propionic Acid Inducing Cell Death in Cervical Cancer Cells. Molecules 2021, 26, 4951. [Google Scholar] [CrossRef]


| Strain | Cytotoxicity (%) ± SD | |||||||
|---|---|---|---|---|---|---|---|---|
| PFM Concentration (%) | CE Concentration (%) | |||||||
| 1 | 5 | 10 | 20 | 1 | 5 | 10 | 20 | |
| Lactiplantibacillus plantarum 0981 | 3.9 ± 2.4 | 3.0 ± 2.5 | 23.4 ± 0.9 * | 21.9 ± 1.6 * | 3.8 ± 3.2 | 10.4 ± 1.9 | 27.0 ± 3.3 * | 36.4 ± 3.9 * |
| Lactiplantibacillus plantarum 0982 | −2.6 ± 1.9 | 0.6 ± 1.3 | 1.2 ± 2.3 | 14.2 ± 3.5 | 13.3 ± 3.4 | 22.7 ± 3.3 * | 21.0 ± 1.7 * | 27.6 ± 1.5 * |
| Lactiplantibacillus plantarum 0989 | 1.9 ± 3.2 | 7.1 ± 2.6 | 10.7 ± 0.0 | 2.6 ± 0.8 | 0.3 ± 2.1 | 8.6 ± 3.0 | 30.5 ± 4.8 * | 35.4 ± 1.7 * |
| Lactiplantibacillus plantarum 0990 | −12.8 ± 2.1 | 2.0 ± 5.3 | 9.3 ± 2.9 | 25.2 ± 2.5 * | 10.0 ± 1.6 | 17.8 ± 2.5 * | 27.3 ± 3.3 * | 37.8 ± 4.0 * |
| Lactiplantibacillus plantarum 0991 | 9.3 ± 0.1 | 16.7 ± 0.2 * | 23.5 ± 0.7 * | 61.5 ± 0.2 * | 14.2 ± 2.7 | 26.6 ± 2.4 * | 36.5 ± 0.5 * | 45.9 ± 0.6 * |
| Lactiplantibacillus plantarum 0995 | 9.8 ± 0.3 | 44.1 ± 0.5 * | 56.6 ± 0.9 * | 63.2 ± 0.3 * | 17.1 ± 0.0 * | 23.7 ± 1.1 * | 24.2 ± 0.8 * | 25.7 ± 1.9 * |
| Lactiplantibacillus plantarum 0996 | 4.1 ± 1.1 | 64.0 ± 0.6 * | 60.6 ± 0.4 * | 64.0 ± 0.5 * | 1.7 ± 2.7 | 20.0 ± 0.7 * | 17.4 ± 0.7 * | 26.7 ± 2.3 * |
| Levilactobacillus brevis 0983 | 34.6 ± 0.6 * | 35.6 ± 0.8 * | 55.8 ± 0.4 * | 71.2 ± 0.1 * | 4.0 ± 2.5 | 29.0 ± 3.4 * | 38.5 ± 4.0 * | 36.5 ± 0.5 * |
| Levilactobacillus brevis 0984 | 12.5 ± 0.4 | 11.8 ± 0.6 | 12.0 ± 0.8 | 19.4 ± 1.0 * | 2.6 ± 3.5 | 1.8 ± 0.2 | 28.3 ± 2.3 * | 28.0 ± 2.3 * |
| Levilactobacillus brevis 0912 | −16.7 ± 2.1 | 32.6 ± 1.5 * | 70.1 ± 1.0 * | 77.8 ± 0.8 * | 18.9 ± 2.6 * | 17.7 ± 4.9 * | 19,3 ± 1.2 * | 18.9 ± 1.3 * |
| Levilactobacillus brevis 0950 | 2.8 ± 0.8 | 16.7 ± 0.1 * | 12.9 ± 0.1 | 29.2 ± 0.2 * | −1.24 ± 2.6 | 11.5 ± 2.5 | 12.1 ± 0.5 | 28.9 ± 1.2 * |
| Lacticaseibacillus paracasei 0985 | −0.47 ± 0.0 | 26.9 ± 0.9 * | 35.2 ± 0.7 * | 44.4 ± 0.9 * | 16.1 ± 0.9 * | 39.2 ± 0.8 * | 39.1 ± 1.3 * | 46.5 ± 3.5 * |
| Lacticaseibacillus paracasei 0913 | 1.5 ± 3.5 | −2.3 ± 0.4 | 39.0 ± 2.4 * | 41.0 ± 2.0 * | 9.7 ± 2.0 | 18.7 ± 2.1 * | 31.2 ± 1.9 * | 28.1 ± 1.7 * |
| Lacticaseibacillus paracasei 0993 | −10.7 ± 0.7 | 23.9 ± 0.2 * | 20.9 ± 1.3 * | 38.4 ± 0.3 * | 16.9 ± 2.9 * | 21.5 ± 2.9 * | 31.2 ± 2.0 * | 29.6 ± 1.7 * |
| Lactobacillus delbrueckii 0851 | 28.1 ± 0.4 * | 35.0 ± 0.2 * | 41.8 ± 0.7 * | 42.6 ± 0.6 * | 13.0 ± 1.1 | 19.9 ± 1.2 * | 22.6 ± 2.2 * | 35.1 ± 2.1 * |
| Lactobacillus delbrueckii 0987 | −10.4 ± 2.3 | 2.8 ± 2.6 | −3.7 ± 0.4 | 22.8 ± 1.4 * | 17.4 ± 4.1 * | 21.1 ± 3.5 * | 21.8 ± 4.0 * | 27.8 ± 0.7 * |
| Leuconostoc mesenteroides 0986 | 20.0 ± 0.5 * | 21.4 ± 1.0 * | 26.3 ± 0.0 * | 48.4 ± 1.6 * | −0.3 ± 0.1 | 24.7 ± 1.7 * | 30.2 ± 2.9 * | 31.3 ± 0.9 * |
| Leuconostoc mesenteroides 0994 | 3.9 ± 3.6 | 14.7 ± 1.1 | 14.2 ± 3.0 | 56.8 ± 1.6 * | −1.5 ± 4.3 | 4.8 ± 3.0 | 16.1 ± 1.6 * | 17.5 ± 1.7 * |
| Lacticaseibacillus rhamnosus 0900 | −14.7 ± 1.2 | −4.9 ± 2.1 | 4.3 ± 6.1 | 39.2 ± 2.2 * | 7.2 ± 4.0 | 18.0 ± 3.8 * | 17.2 ± 0.4 * | 18.2 ± 3.0 * |
| Lacticaseibacillus rhamnosus 0902 | 15.8 ± 1.1 * | 33.8 ± 1.1 * | 33.0 ± 0.9 * | 49.7 ± 1.4 * | 18.1 ± 2.2 * | 18.7 ± 1.8 * | 19.6 ± 1.6 * | 21.5 ± 3.1 * |
| Lacticaseibacillus rhamnosus 0908 | 6.9 ± 3.8 | 6.5 ± 0.9 | 14.8 ± 5.4 | 14.1 ± 3.2 | −4.3 ± 0.0 | 11.5 ± 1.4 | 10.4 ± 3.7 | 14.5 ± 0.8 |
| Lacticaseibacillus rhamnosus 0997 | −13.7 ± 0.2 | −9.7 ± 1.6 | 13.3 ± 2.9 | 13.7 ± 2.7 | 18.4 ± 1.6 * | 31.2 ± 0.4 * | 29.0 ± 1.2 * | 29.1 ± 0.8 * |
| Lacticaseibacillus rhamnosus GG | 2.0 ± 1.2 | −1.2 ± 2.6 | 14.7 ± 2.4 | 33.6 ± 0.6 * | 32.6 ± 1.3 * | 47.1 ± 3.0 * | 46.0 ± 1.4 * | 58.4 ± 1.6 * |
| Limosilactobacillus mucosae 0988 | −6.1 ± 2.1 | 15.4 ± 2.7 * | 28.8 ± 1.6 * | 20.1 ± 4.2 * | 28.7 ± 2.0 * | 31.6 ± 0.8 * | 39.5 ± 2.2 * | 44.2 ± 0.6 * |
| Lacticaseibacillus casei 0903 | 12.9 ± 1.9 | 27.4 ± 0.7 * | 28.3 ± 0.9 * | 40.0 ± 0.9 * | −5.0 ± 1.0 | 3.5 ± 3.9 | 13.9 ± 3.9 | 31.1 ± 2.3 * |
| Lacticaseibacillus casei 0919 | 33.0 ± 0.2 * | 40.4 ± 1.6 * | 49.9 ± 1.5 * | 64.4 ± 0.5 * | 6.1 ± 1.4 | 10.1 ± 3.5 | 30.9 ± 1.0 * | 39.5 ± 1.2 * |
| Lacticaseibacillus casei 0924 | 26.6 ± 0.4 * | 22.5 ± 1.1 * | 23.9 ± 0.9 * | 40.8 ± 1.2 * | 34.8 ± 2.6 * | 41.9 ± 2.5 * | 40.7 ± 3.5 * | 46.7 ± 3.8 * |
| Lacticaseibacillus casei DN 114-001 | 13.8 ± 1.3 | 31.2 ± 1.0 * | 29.8 ± 0.3 * | 32.1 ± 1.1 * | −2.6 ± 0.0 | 5.6 ± 2.1 | 4.2 ± 2.0 | 3.8 ± 2.9 |
| Lacticaseibacillus casei Shirota | 11.0 ± 0.6 | 30.4 ± 2.3 * | 32.7 ± 2.1 * | 33.8 ± 1.4 * | 4.8 ± 0.9 | 34.5 ± 3.1 * | 36.7 ± 2.2 * | 33.8 ± 2.8 * |
| Lactobacillus acidophilus 0839 | 7.5 ± 1.8 | 9.4 ± 2.3 | 23.0 ± 1.7 * | 46.4 ± 1.2 * | 15.7 ± 1.6 * | 43.2 ± 1.5 * | 43.1 ± 0.4 * | 45.7 ± 1.7 * |
| Lactobacillus acidophilus 0925 | 7.7 ± 0.8 | 16.6 ± 1.4 * | 21.4 ± 1.9 * | 43.9 ± 1.6 * | 6.8 ± 3.4 | 7.6 ± 0.9 | 8.2 ± 2.4 | 19.9 ± 1.1 * |
| Lactobacillus acidophilus 0937 | 23.6 ± 0.5 * | 25.0 ± 1.0 * | 22.8 ± 2.1 * | 58.6 ± 2.1 * | 2.5 ± 3.3 | 15.2 ± 6.8 * | 16.2 ± 1.5 * | 28.7 ± 2.9 * |
| Lactobacillus acidophilus 0946 | 4.4 ± 1.3 | 3.3 ± 0.9 | 18.7 ± 0.7 * | 40.4 ± 1.6 * | −0.4 ± 1.0 | 25.5 ± 2.6 * | 27.7 ± 2.4 * | 45.4 ± 1.8 * |
| Lactobacillus helveticus Z/1 | 18.9 ± 2.2 * | 13.0 ± 0.3 | 24.5 ± 0.5 * | 10.7 ± 0.7 | 4.3 ± 2.0 | 24.5 ± 2.1 * | 27.3 ± 0.7 * | 32.8 ± 2.1 * |
| Amylolactobacillus amylophilus 0843 | 41.4 ± 0.8 * | 46.6 ± 0.9 * | 65.5 ± 1.5 * | 66.7 ± 1.4 * | 31.4 ± 2.8 * | 30.3 ± 0.6 * | 30.5 ± 1.0 * | 38.3 ± 1.4 * |
| Secundilactobacillus similis 04/2 | 18.8 ± 0.6 * | 19.6 ± 0.9 * | 40.7 ± 1.1 * | 46.2 ± 1.9 * | 27.4 ± 2.8 * | 33.5 ± 4.5 * | 44.8 ± 1.2 * | 47.8 ± 2.7 * |
| Lentilactobacillus diolivorans 04/1 | 3.5 ± 2.4 | −0.7 ± 0.2 | 25.1 ± 0.6 * | 25.5 ± 2.3 * | 2.8 ± 3.1 | 4.9 ± 0.2 | 6.5 ± 1.9 | 17.3 ± 1.0 * |
| Pediococcus parvulus 02/1 | 3.4 ± 1.9 | 23.2 ± 2.1 * | 29.4 ± 1.8 * | 42.1 ± 0.6 * | 18.1 ± 1.4 * | 16.7 ± 0.9 * | 21.4 ± 1.8 * | 25.8 ± 1.5 * |
| Pediococcus parvulus 4/2K | 3.0 ± 0.8 | 30.2 ± 0.7 * | 52.6 ± 0.8 * | 70.5 ± 1.0 * | 29.0 ± 1.1 * | 32.8 ± 2.3 * | 39.4 ± 1.4 * | 58.3 ± 2.0 * |
| Bifidobacterium breve animalis Bb-12 | 9.2 ± 0.3 | 45.8 ± 1.6 * | 55.9 ± 1.3 * | 59.7 ± 1.2 * | 16.5 ± 2.3 * | 24.4 ± 3.1 * | 28.5 ± 1.9 * | 51.3 ± 0.9 * |
| Strain | Cytotoxicity (%) ± SD | |||||||
|---|---|---|---|---|---|---|---|---|
| PFM Concentration (%) (v/v) | CE Concentration (%) (v/v) | |||||||
| 1 | 5 | 10 | 20 | 1 | 5 | 10 | 20 | |
| HeLa | ||||||||
| Lactiplantibacillus plantarum 0991 | 10.1 ± 0.0 | 14.1 ± 0.9 | 41.4 ± 0.2 * | 97.6 ± 0.2 * | −2.4 ± 1.6 | 0.1 ± 0.7 | −2.7 ± 0.2 | 15.7 ± 3.5 * |
| Levilactobacillus brevis 0983 | 9.8 ± 0.6 | 22.7 ± 0.3 * | 42.2 ± 0.8 * | 98.9 ± 0.1 * | −3.3 ± 0.2 | −1.8 ± 0.2 | 4.7 ± 3.7 | 26.5 ± 2.9 * |
| Lacticaseibacillus casei 0919 | 27.6 ± 0.8 * | 31.5 ± 0.4 * | 46.8 ± 0.5 * | 98.9 ± 0.1 * | −3.3 ± 0.2 | −1.7 ± 0.0 | 8.2 ± 1.4 | 13.3 ± 0.8 |
| Pediococcus parvulus 4/2K | 11.7 ± 1.1 | 28.3 ± 1.0 * | 43.8 ± 0.7 * | 97.9 ± 0.3 * | 21.6 ± 0.2 * | 21.9 ± 0.3 * | 28.3 ± 1.7 * | 28.6 ± 1.1 * |
| Amylolactobacillus amylophilus 0843 | 5.5 ± 0.4 | 37.9 ± 1.1 * | 56.1 ± 0.7 * | 99.2 ± 0.1 * | −3.8 ± 0.1 | −0.5 ± 0.1 | −2.0 ± 0.2 | −0.1 ± 0.8 |
| IEC-6 | ||||||||
| Lactiplantibacillus plantarum 0991 | −0.7 ± 1.2 | 10.1 ± 1.7 | 78.3 ± 0.1 * | 96.9 ± 0.2 * | 2.6 ± 0.6 | 20 ± 0.1 * | 25.5 ± 0.6 * | 41.0 ± 0.5 * |
| Levilactobacillus brevis 0983 | −2.5 ± 0.2 | 7.8 ± 0.7 | 80.0 ± 0.0 * | 96.1 ± 0.2 * | −0.7 ± 1.4 | 20.0 ± 0.4 * | 20.7 ± 0.4 * | 33.5 ± 0.7 * |
| Lacticaseibacillus casei 0919 | 8.9 ± 0.2 | 19.4 ± 1.1 * | 79.6 ± 0.1 * | 98.3 ± 0.1 * | 3.0 ± 0.4 | 7.9 ± 1.1 | 20.0 ± 0.5 * | 19.0 ± 0.6 * |
| Pediococcus parvulus 4/2K | 5.9 ± 1.5 | 16.0 ± 1.2 * | 76.8 ± 0.3 * | 97.3 ± 0.1 * | 23.1 ± 0.1 * | 20.7 ± 0.4 * | 24.9 ± 0.5 * | 30.8 ± 0.1 * |
| Amylolactobacillus amylophilus 0843 | 0.2 ± 1.0 | 43.9 ± 0.6 * | 80.0 ± 0.0 * | 99.6 ± 0.1 * | 2.5 ± 1.3 | 6.2 ± 1.0 | 24.5 ± 0.2 * | 37.9 ± 0.3 * |
| Strain | IC50 (%) (v/v) | ||
|---|---|---|---|
| Caco-2 | HeLa | IEC-6 | |
| Lactiplantibacillus plantarum 0991 | 17.0 | 11.5 | 7.9 |
| Levilactobacillus brevis 0983 | 8.6 | 11.4 | 7.8 |
| Lacticaseibacillus casei 0919 | 10.1 | 10.6 | 7.1 |
| Pediococcus parvulus 4/2K | 8.5 | 11.1 | 7.4 |
| Amylolactobacillus amylophilus 0843 | 5.9 | 9.0 | 5.8 |
| Strain | H2O2 (µM) | |
|---|---|---|
| PFM | CE | |
| Lactiplantibacillus plantarum 0991 | 4.0 ± 2.4 | 8.8 ± 2.1 * |
| Levilactobacillus brevis 0983 | 7.3 ± 2.2 * | 10.3 ± 1.4 * |
| Lacticaseibacillus casei 0919 | 6.9 ± 2.8 * | 18.6 ± 2.7 * |
| Pediococcus parvulus 4/2K | 2.8 ± 1.9 | 10.1 ± 2.3 * |
| Amylolactobacillus amylophilus 0843 | 17.1 ± 2.9 * | 15.8 ± 2.3 * |
Publisher’s Note: MDPI stays neutral with regard to jurisdictional claims in published maps and institutional affiliations. |
© 2022 by the authors. Licensee MDPI, Basel, Switzerland. This article is an open access article distributed under the terms and conditions of the Creative Commons Attribution (CC BY) license (https://creativecommons.org/licenses/by/4.0/).
Share and Cite
Nowak, A.; Zakłos-Szyda, M.; Rosicka-Kaczmarek, J.; Motyl, I. Anticancer Potential of Post-Fermentation Media and Cell Extracts of Probiotic Strains: An In Vitro Study. Cancers 2022, 14, 1853. https://doi.org/10.3390/cancers14071853
Nowak A, Zakłos-Szyda M, Rosicka-Kaczmarek J, Motyl I. Anticancer Potential of Post-Fermentation Media and Cell Extracts of Probiotic Strains: An In Vitro Study. Cancers. 2022; 14(7):1853. https://doi.org/10.3390/cancers14071853
Chicago/Turabian StyleNowak, Adriana, Małgorzata Zakłos-Szyda, Justyna Rosicka-Kaczmarek, and Ilona Motyl. 2022. "Anticancer Potential of Post-Fermentation Media and Cell Extracts of Probiotic Strains: An In Vitro Study" Cancers 14, no. 7: 1853. https://doi.org/10.3390/cancers14071853
APA StyleNowak, A., Zakłos-Szyda, M., Rosicka-Kaczmarek, J., & Motyl, I. (2022). Anticancer Potential of Post-Fermentation Media and Cell Extracts of Probiotic Strains: An In Vitro Study. Cancers, 14(7), 1853. https://doi.org/10.3390/cancers14071853