
Ras Pathway Activation and MEKi Resistance Scores Predict the Efficiency of MEKi and SRCi Combination to Induce Apoptosis in Colorectal Cancer

Abstract
:Simple Summary
Abstract
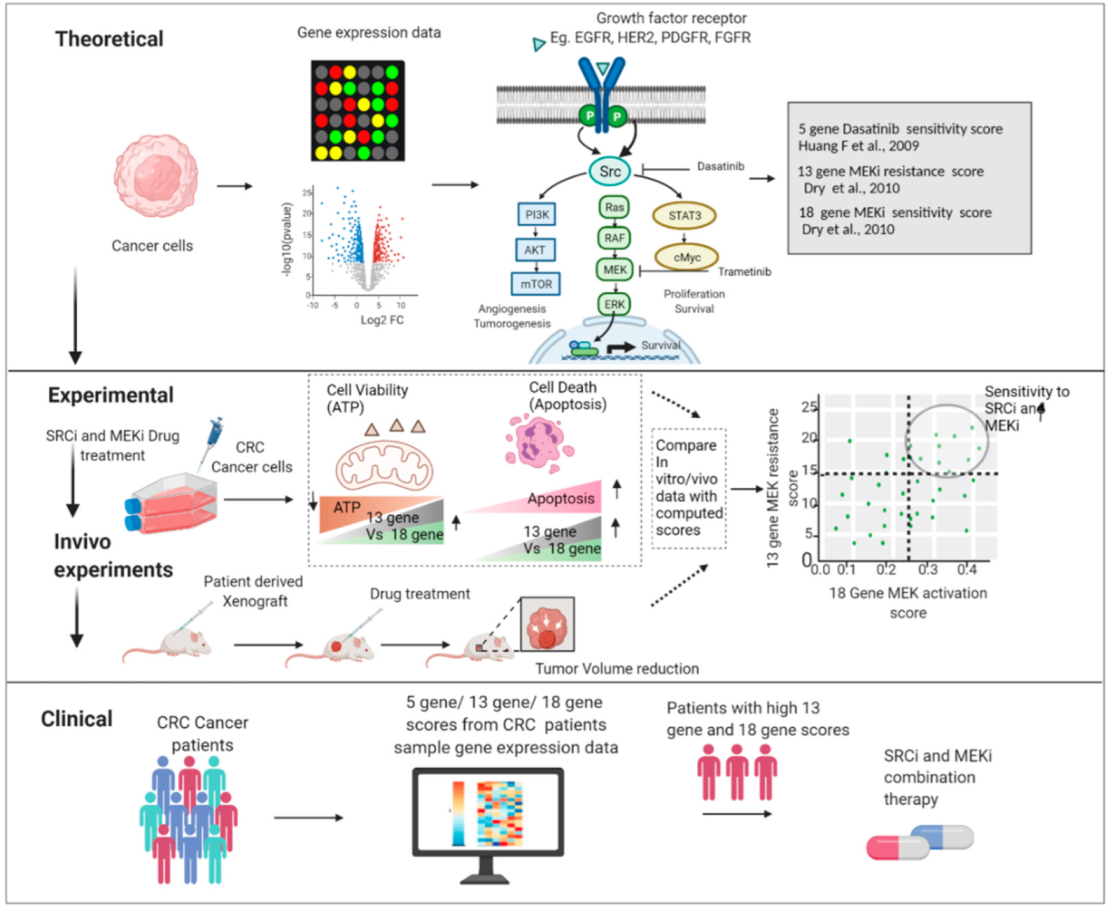
1. Introduction
2. Materials and Methods
2.1. Cell Culture
2.2. Immunoblotting
2.3. Cell Viability Assays
2.4. Inhibitors and Apoptosis Assay
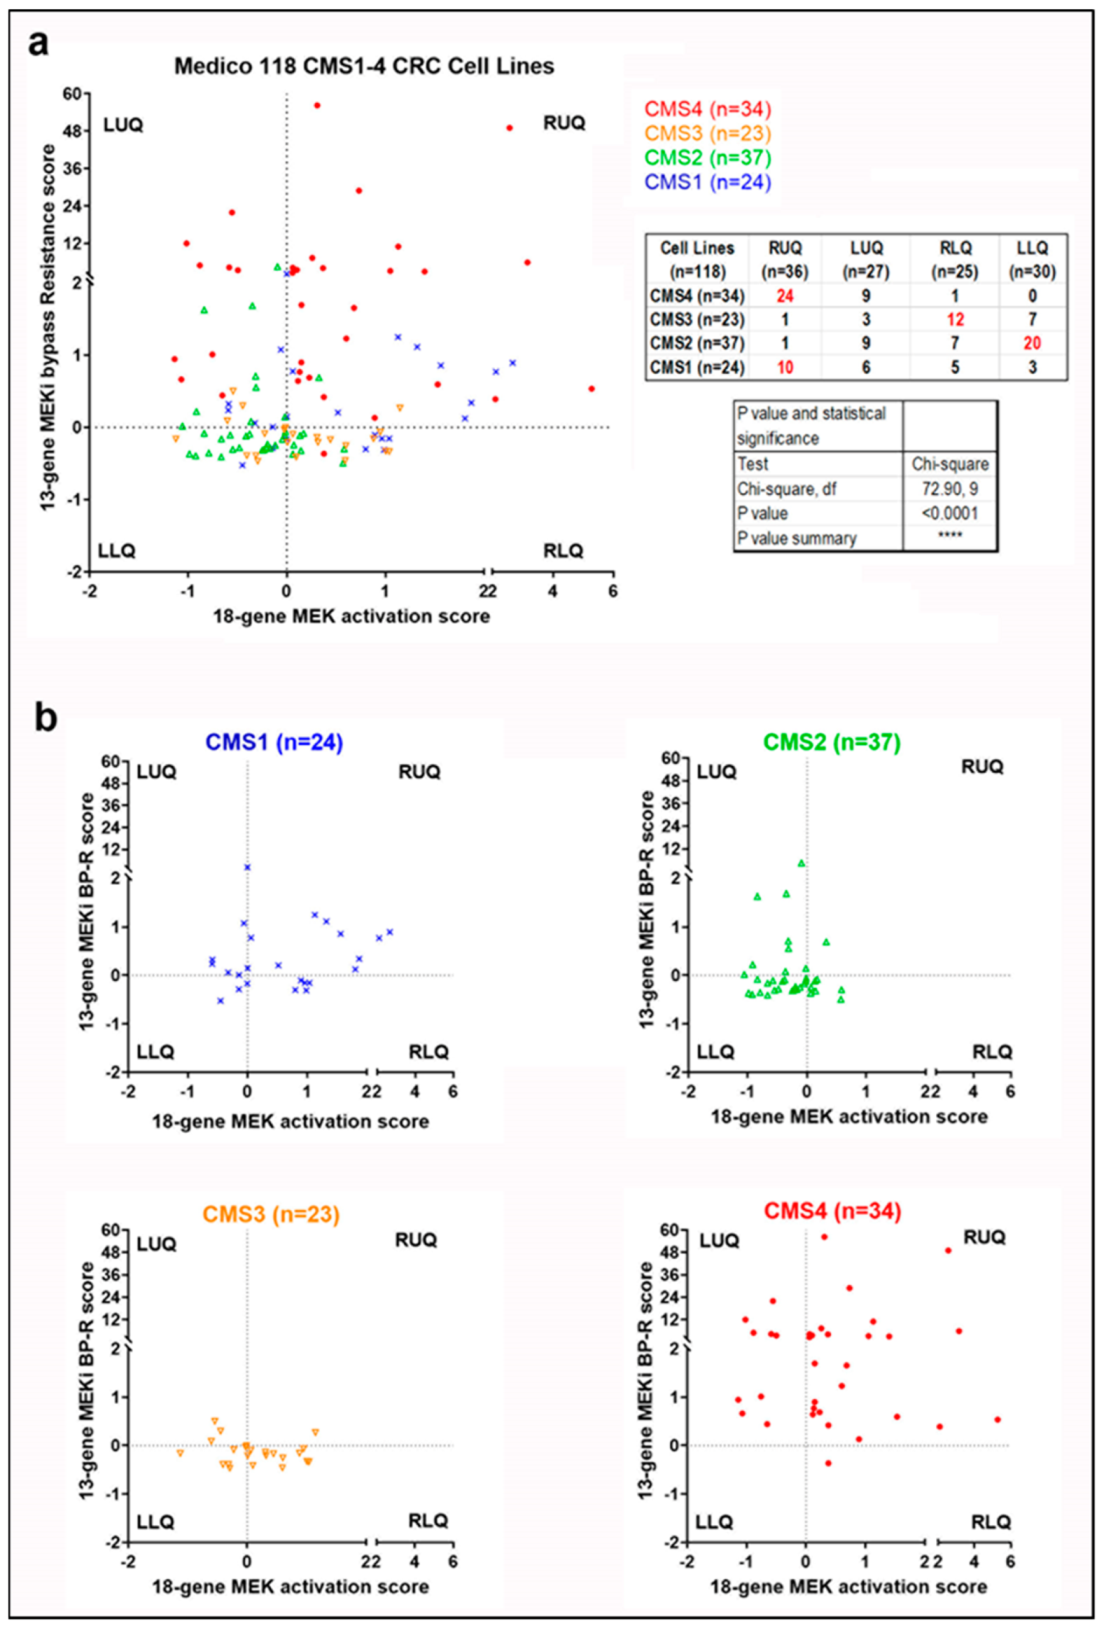
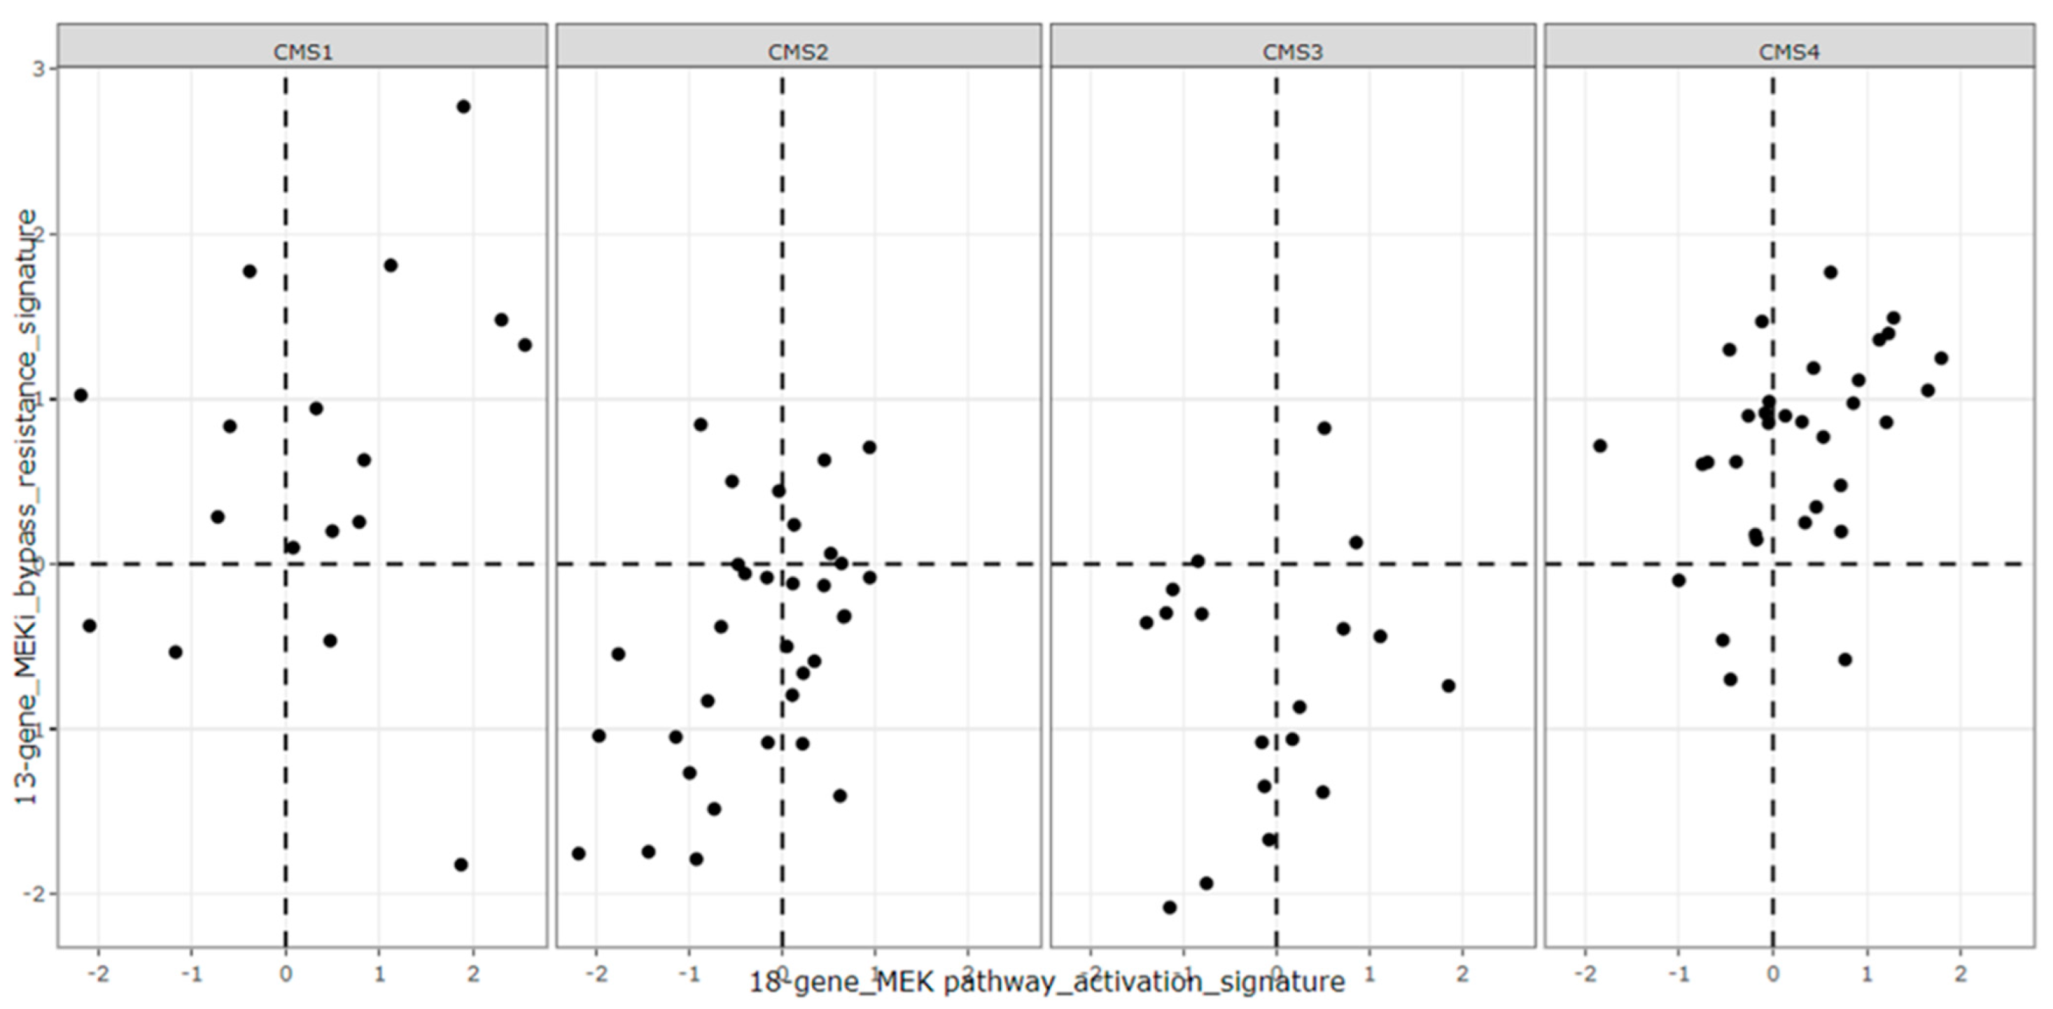
2.5. Gene Signature Score Analysis and CMS Classification
2.6. Statistical Analysis
3. Results
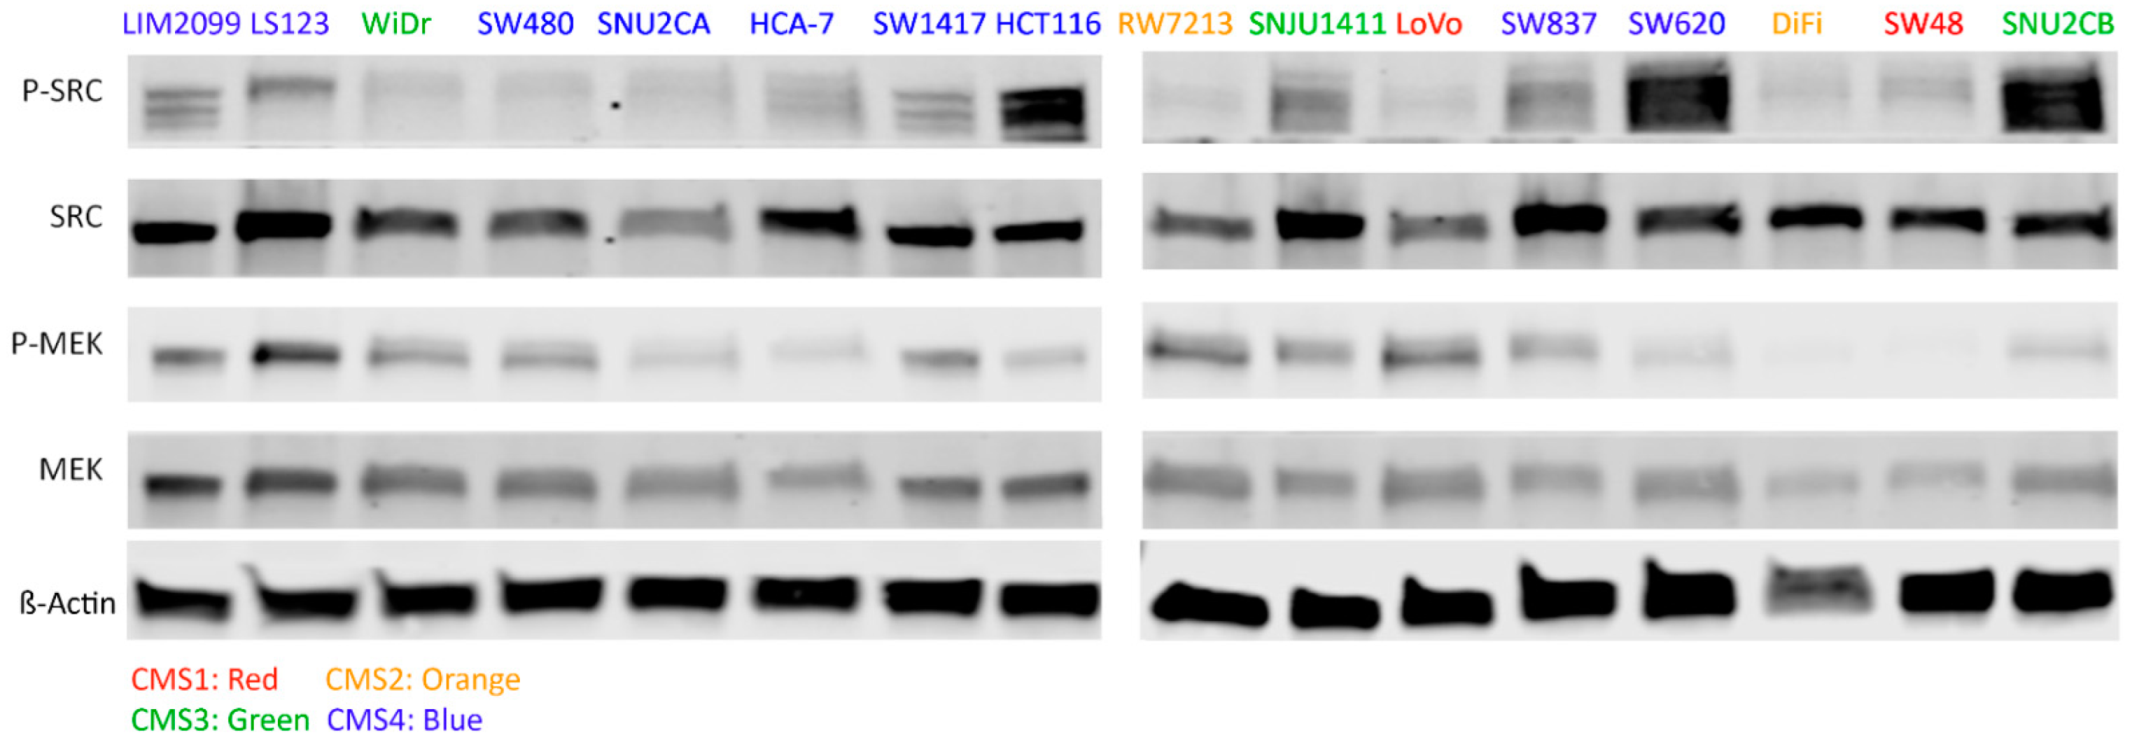
3.1. CRC Cell Line Selection and Associated MEK and SRC Activation
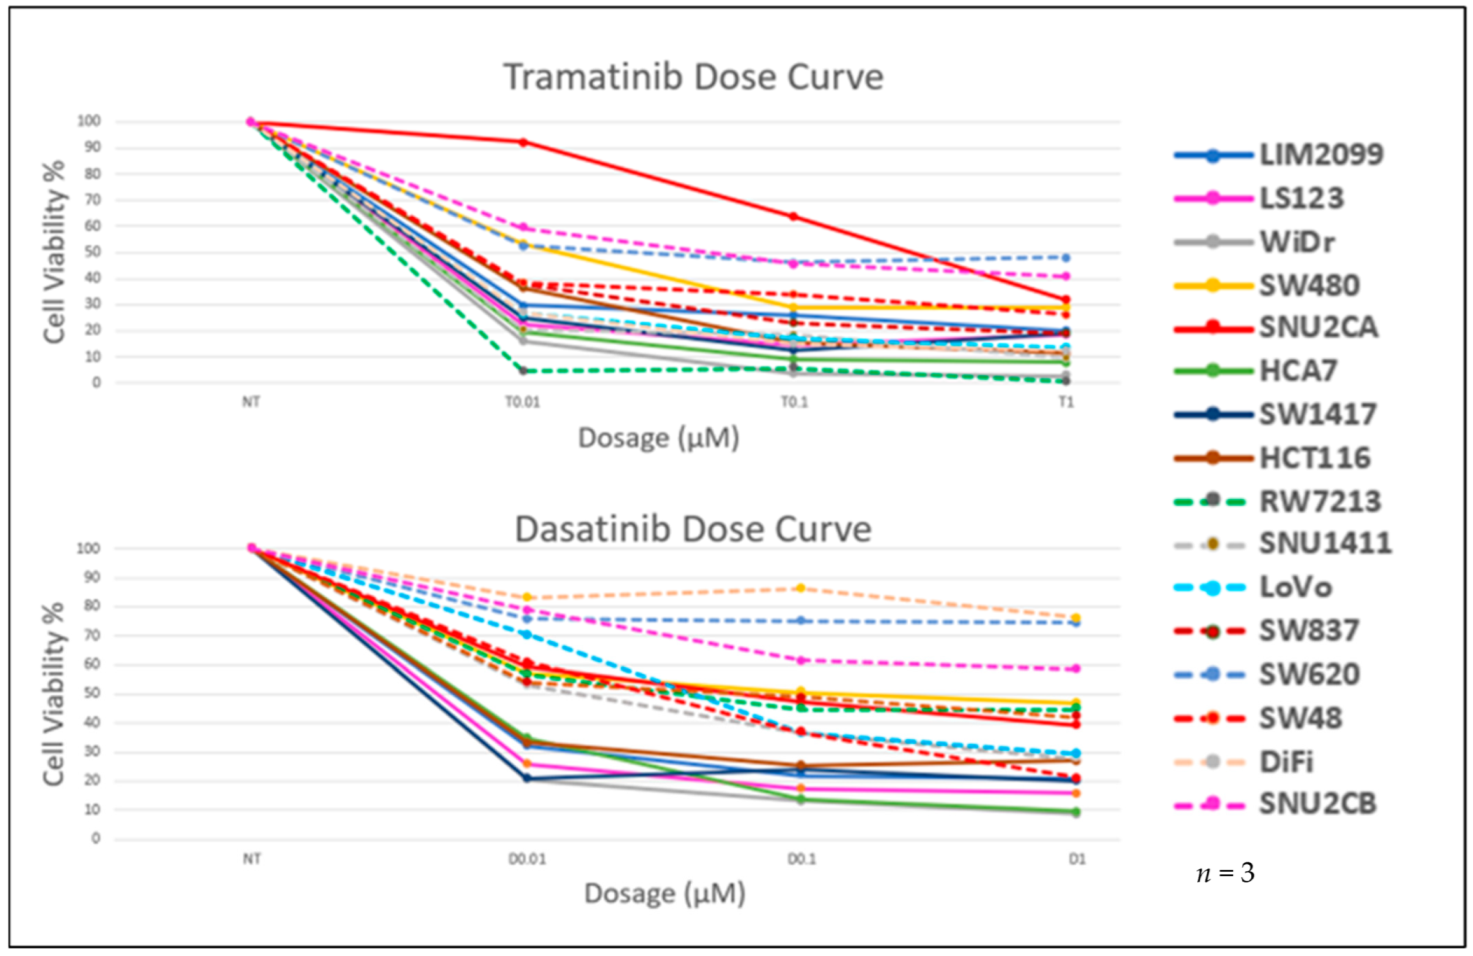
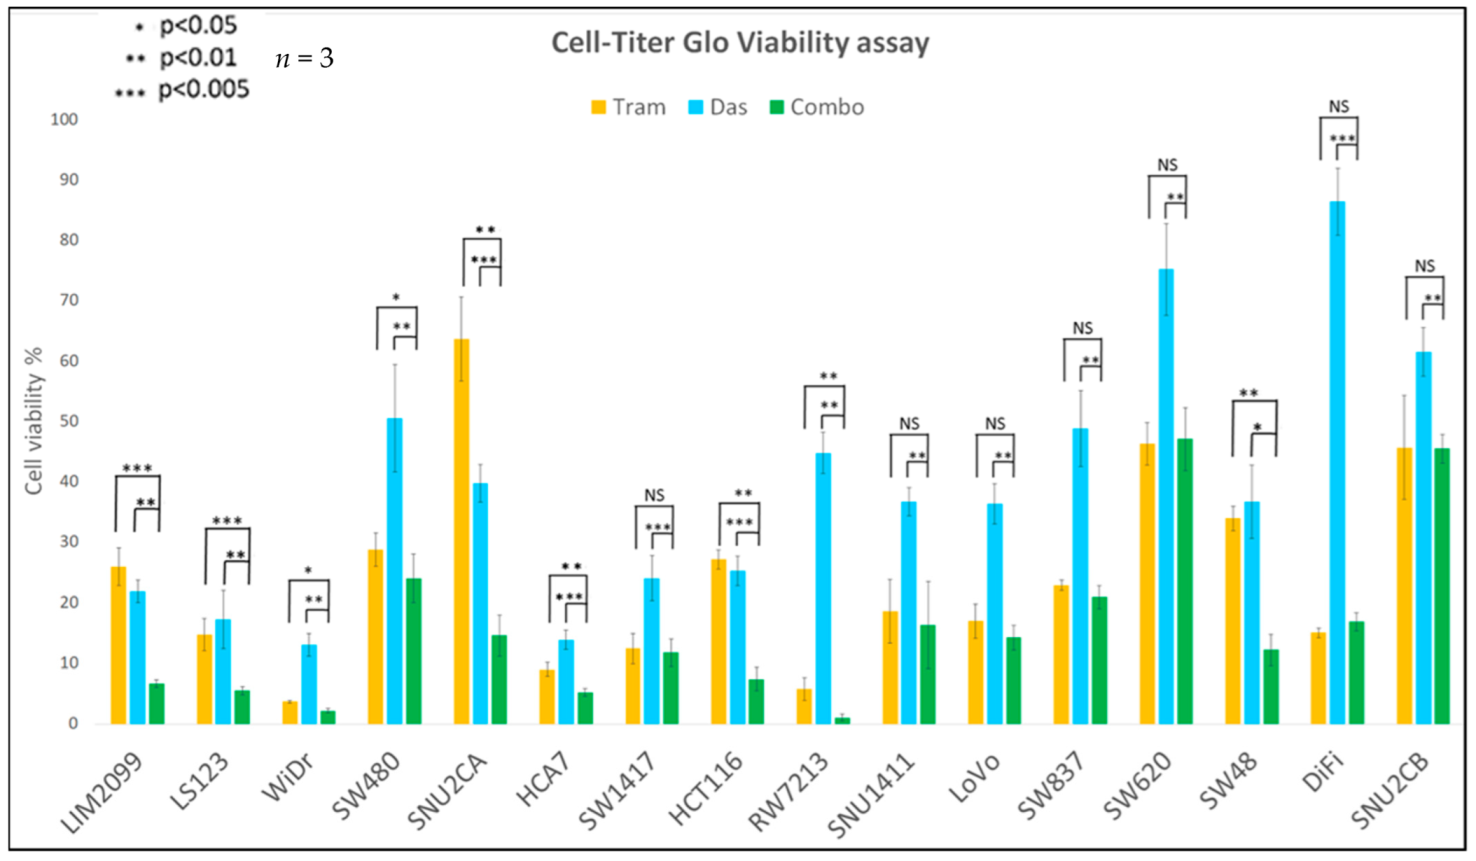
3.2. The Effect of Inhibition of MEK and SRC on Cell Viability
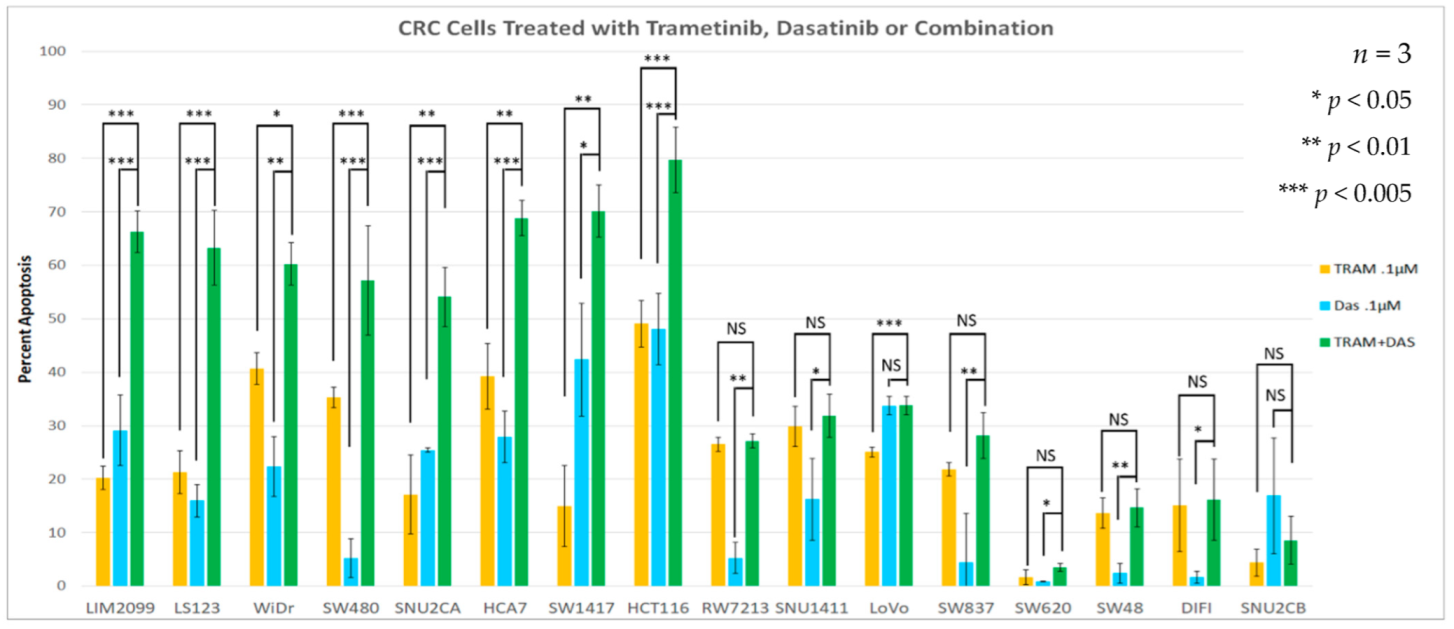
3.3. Drug Stimulated Apoptosis
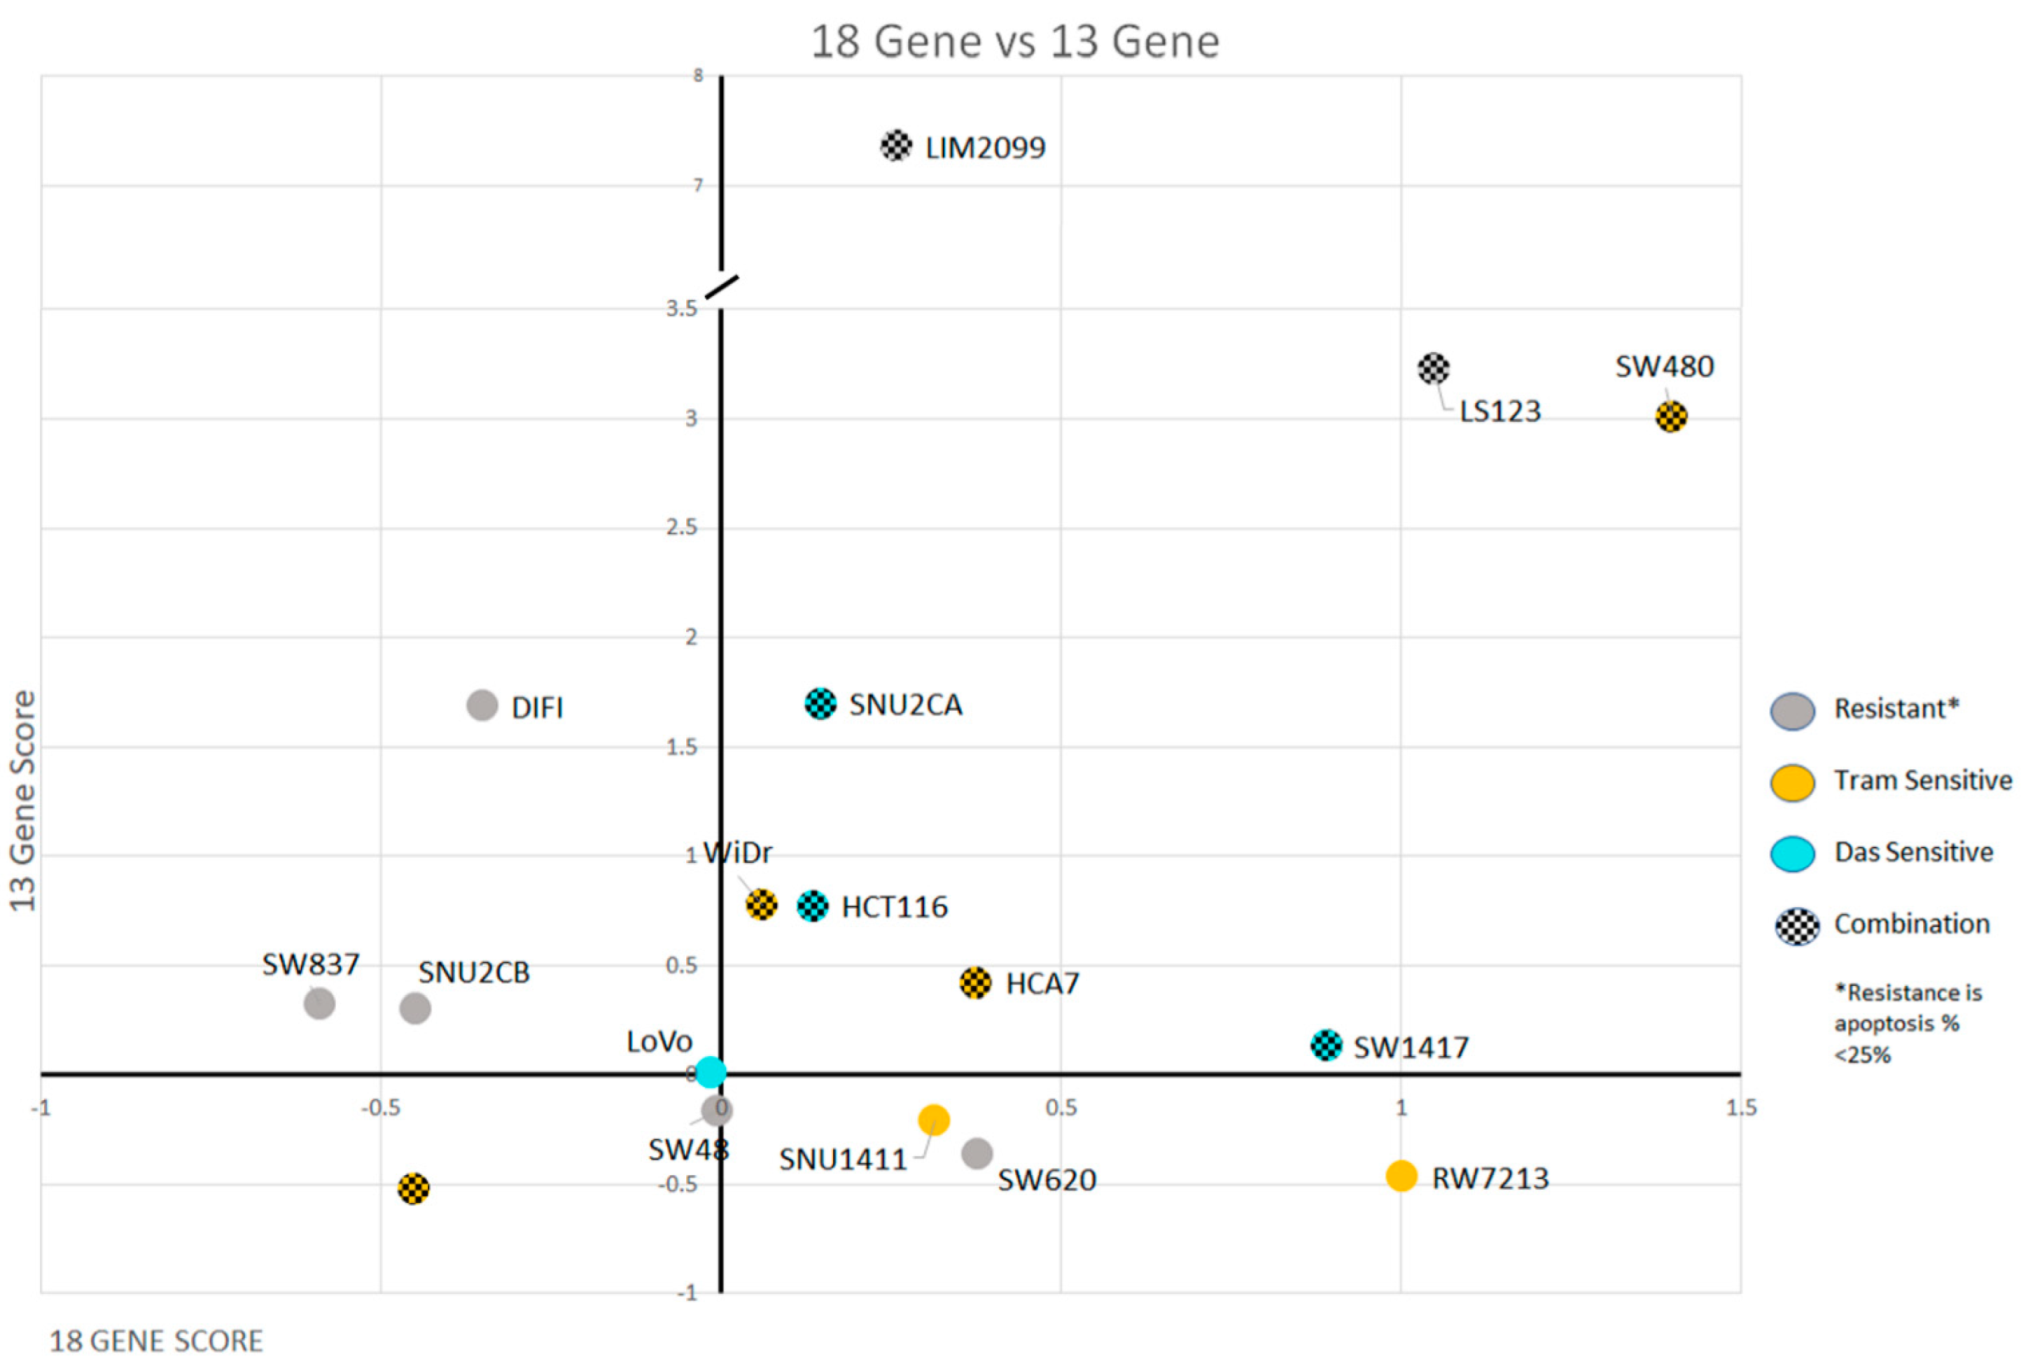
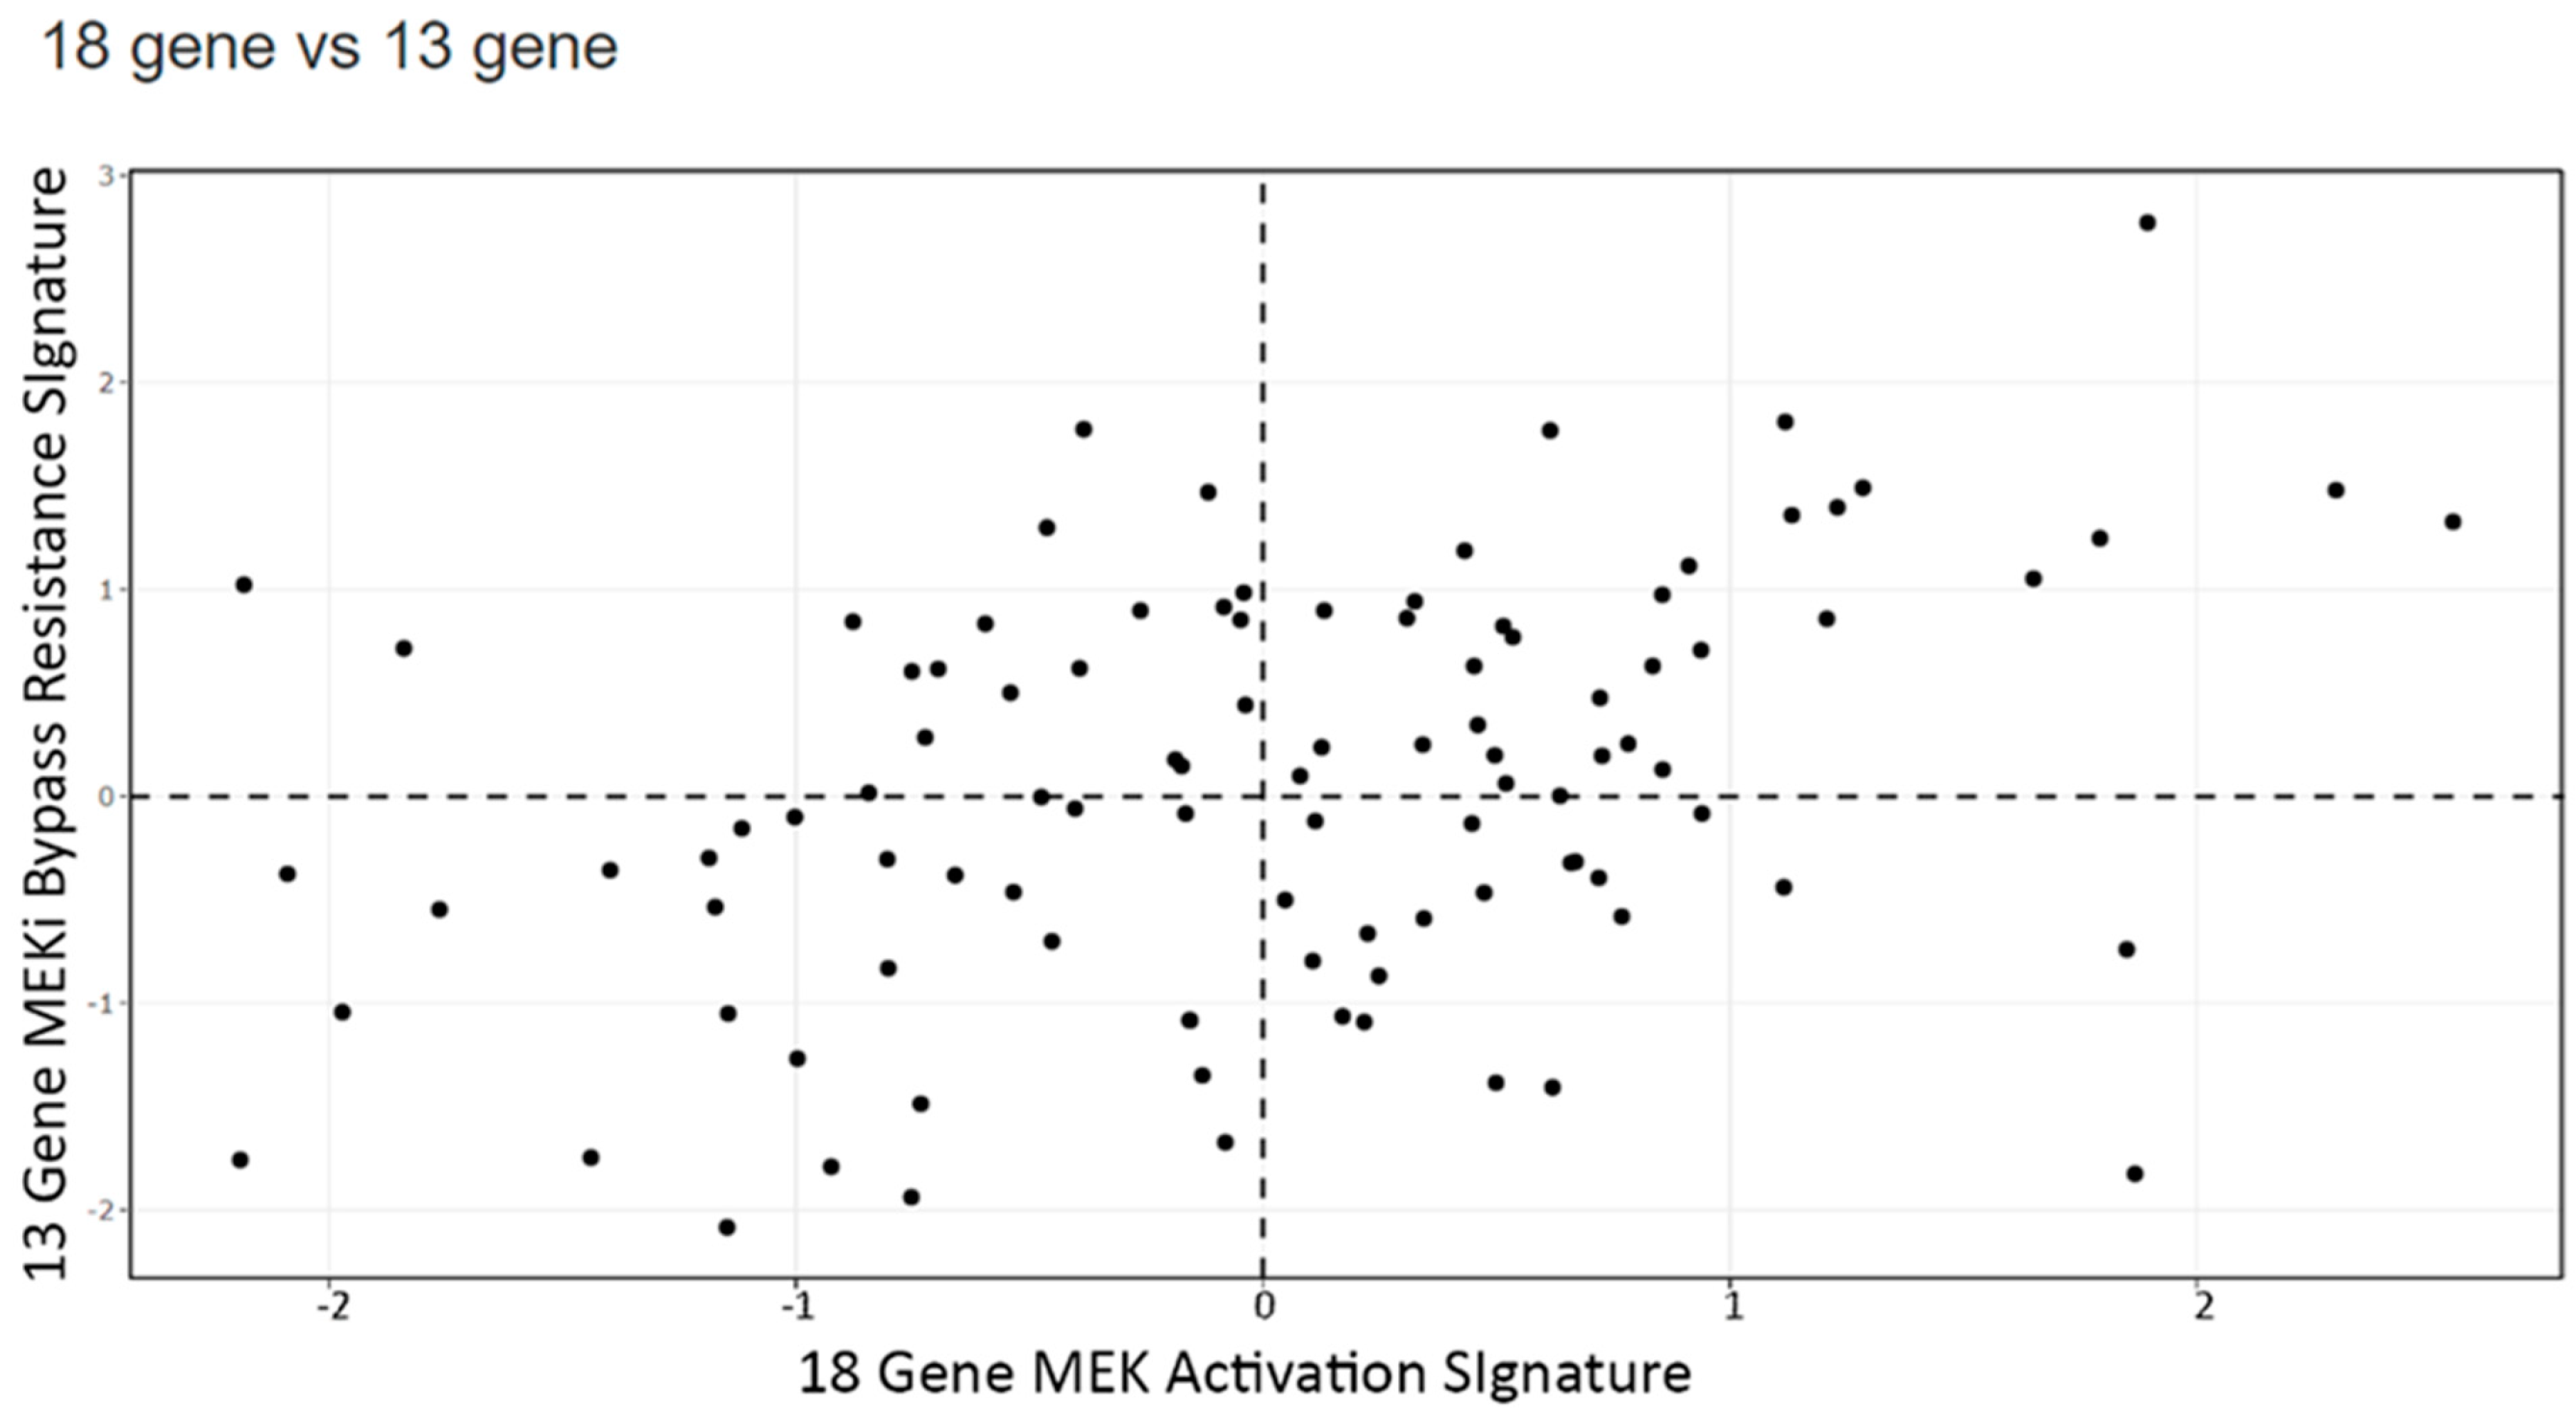
3.4. Signature Scores to Predict Drug Sensitivity
4. Discussion
5. Conclusions
Supplementary Materials
Author Contributions
Funding
Institutional Review Board Statement
Informed Consent Statement
Data Availability Statement
Conflicts of Interest
References
- Siegel, R.L.; Miller, K.D.; Jemal, A. Cancer statistics, 2016. CA Cancer J. Clin. 2016, 66, 7–30. [Google Scholar] [CrossRef] [PubMed] [Green Version]
- Cancer Genome Atlas N: Comprehensive molecular characterization of human colon and rectal cancer. Nature 2012, 487, 330–337. [CrossRef] [PubMed] [Green Version]
- Schubbert, S.; Shannon, K.; Bollag, G. Hyperactive Ras in developmental disorders and cancer. Nat. Rev. Cancer 2007, 7, 295–308. [Google Scholar] [CrossRef] [PubMed]
- Schell, M.J.; Yang, M.; Teer, J.K.; Lo, F.Y.; Madan, A.; Coppola, D.; Monteiro, A.N.A.; Nebozhyn, M.V.; Yue, B.; Loboda, A.; et al. A multigene mutation classification of 468 colorectal cancers reveals a prognostic role for APC. Nat. Commun. 2016, 7, 11743. [Google Scholar] [CrossRef] [PubMed] [Green Version]
- Giannakis, M.; Mu, X.J.; Shukla, S.A.; Qian, Z.R.; Cohen, O.; Nishihara, R.; Bahl, S.; Cao, Y.; Amin-Mansour, A.; Yamauchi, M.; et al. Genomic Correlates of Immune-Cell Infiltrates in Colorectal Carcinoma. Cell Rep. 2016, 17, 1206. [Google Scholar] [CrossRef]
- Popovici, V.; Budinska, E.; Tejpar, S.; Weinrich, S.; Estrella, H.; Hodgson, G.; Van Cutsem, E.; Xie, T.; Bosman, F.T.; Roth, A.D.; et al. Identification of a Poor-Prognosis BRAF-Mutant–Like Population of Patients with Colon Cancer. J. Clin. Oncol. 2012, 30, 1288–1295. [Google Scholar] [CrossRef] [PubMed]
- Xie, Y.H.; Chen, Y.X.; Fang, J.Y. Comprehensive review of targeted therapy for colorectal cancer. Signal Transduct. Target. Ther. 2020, 5, 22. [Google Scholar] [CrossRef] [PubMed]
- Amaral, T.; Sinnberg, T.; Meier, F.; Krepler, C.; Levesque, M.; Niessner, H.; Garbe, C. MAPK pathway in melanoma part II—secondary and adaptive resistance mechanisms to BRAF inhibition. Eur. J. Cancer 2017, 73, 93–101. [Google Scholar] [CrossRef] [PubMed]
- Chandarlapaty, S. Negative Feedback and Adaptive Resistance to the Targeted Therapy of Cancer. Cancer Discov. 2012, 2, 311–319. [Google Scholar] [CrossRef] [Green Version]
- Ma, P.; Fu, Y.; Chen, M.; Jing, Y.; Wu, J.; Li, K.; Shen, Y.; Gao, J.-X.; Wang, M.; Zhao, X.; et al. Adaptive and Acquired Resistance to EGFR Inhibitors Converge on the MAPK Pathway. Theranostics 2016, 6, 1232–1243. [Google Scholar] [CrossRef] [Green Version]
- Pazarentzos, E.; Bivona, T.G. Adaptive stress signaling in targeted cancer therapy resistance. Oncogene 2015, 34, 5599–5606. [Google Scholar] [CrossRef] [Green Version]
- Rosell, R.; Karachaliou, N.; Morales-Espinosa, D.; Costa, C.; Molina, M.A.; Sansano, I.; Gasco, A.; Viteri, S.; Massuti, B.; Wei, J.; et al. Adaptive resistance to targeted therapies in cancer. Transl. Lung Cancer Res. 2013, 2, 152–159. [Google Scholar] [CrossRef]
- Fedele, C.; Ran, H.; Diskin, B.; Wei, W.; Jen, J.; Geer, M.J.; Araki, K.; Ozerdem, U.; Simeone, D.M.; Miller, G.; et al. SHP2 Inhibition Prevents Adaptive Resistance to MEK Inhibitors in Multiple Cancer Models. Cancer Discov. 2018, 8, 1237–1249. [Google Scholar] [CrossRef] [Green Version]
- Yeatman, T.J. A renaissance for SRC. Nat. Rev. Cancer 2004, 4, 470–480. [Google Scholar] [CrossRef]
- Dehm, S.M.; Bonham, K. SRC gene expression in human cancer: The role of transcriptional activation. Biochem. Cell Biol. 2004, 82, 263–274. [Google Scholar] [CrossRef]
- Hurwitz, H.; Fehrenbacher, L.; Novotny, W.; Cartwright, T.; Hainsworth, J.; Heim, W.; Berlin, J.; Baron, A.; Griffing, S.; Holmgren, E.; et al. Bevacizumab plus Irinotecan, Fluorouracil, and Leucovorin for Metastatic Colorectal Cancer. N. Engl. J. Med. 2004, 350, 2335–2342. [Google Scholar] [CrossRef] [Green Version]
- Irby, R.; Mao, W.; Coppola, D.; Jove, R.; Gamero, A.; Cuthbertson, D.; Fujita, D.J.; Yeatman, T.J. Overexpression of normal c-Src in poorly metastatic human colon cancer cells enhances primary tumor growth but not metastatic potential. Cell Growth Differ. 1997, 8, 1287–1295. [Google Scholar] [PubMed]
- Martínez-Pérez, J.; Lopez-Calderero, I.; Saez, C.; Benavent, M.; Limon, M.L.; Gonzalez-Exposito, R.; Soldevilla, B.; Riesco-Martínez, M.C.; Salamanca, J.; Carnero, A.; et al. Prognostic relevance of Src activation in stage II–III colon cancer. Hum. Pathol. 2017, 67, 119–125. [Google Scholar] [CrossRef]
- Simpkins, F.; Jang, K.; Yoon, H.; Hew, K.E.; Kim, M.; Azzam, D.J.; Sun, J.; Zhao, D.; Ince, T.A.; Liu, W.; et al. Dual Src and MEK Inhibition Decreases Ovarian Cancer Growth and Targets Tumor Initiating Stem-Like Cells. Clin. Cancer Res. 2018, 24, 4874–4886. [Google Scholar] [CrossRef] [Green Version]
- Park, S.-M.; Hwang, C.Y.; Choi, J.; Joung, C.Y.; Cho, K.-H. Feedback analysis identifies a combination target for overcoming adaptive resistance to targeted cancer therapy. Oncogene 2020, 39, 3803–3820. [Google Scholar] [CrossRef]
- Davis, T.B.; Yang, M.; Wang, H.; Lee, C.; Yeatman, T.J.; Pledger, W.J. PTPRS drives adaptive resistance to MEK/ERK inhibitors through SRC. Oncotarget 2019, 10, 6768–6780. [Google Scholar] [CrossRef]
- Griffiths, G.J.; Koh, M.Y.; Brunton, V.G.; Cawthorne, C.; Reeves, N.A.; Greaves, M.; Tilby, M.J.; Pearson, D.G.; Ottley, C.J.; Workman, P.; et al. Expression of kinase-defective mutants of c-Src in human metastatic colon cancer cells decreases Bcl-xL and increases oxaliplatin- and Fas-induced apoptosis. J. Biol. Chem. 2004, 279, 46113–46121. [Google Scholar] [CrossRef] [Green Version]
- George, J.A.; Chen, T.; Taylor, C.C. Src Tyrosine Kinase and Multidrug Resistance Protein-1 Inhibitions Act Independently but Cooperatively to Restore Paclitaxel Sensitivity to Paclitaxel-Resistant Ovarian Cancer Cells. Cancer Res. 2005, 65, 10381–10388. [Google Scholar] [CrossRef] [Green Version]
- Guinney, J.; Dienstmann, R.; Wang, X.; De Reyniès, A.; Schlicker, A.; Soneson, C.; Marisa, L.; Roepman, P.; Nyamundanda, G.; Angelino, P.; et al. The consensus molecular subtypes of colorectal cancer. Nat. Med. 2015, 21, 1350–1356. [Google Scholar] [CrossRef]
- Linnekamp, J.F.; Hooff, S.R.V.; Prasetyanti, P.R.; Kandimalla, R.; Buikhuisen, J.Y.; Fessler, E.; Ramesh, P.; Lee, K.; Bochove, G.G.W.; de Jong, J.H.; et al. Consensus molecular subtypes of colorectal cancer are recapitulated in in vitro and in vivo models. Cell Death Differ. 2018, 25, 616–633. [Google Scholar] [CrossRef]
- Song, N.; Pogue-Geile, K.L.; Gavin, P.G.; Yothers, G.; Kim, S.R.; Johnson, N.L.; Lipchik, C.; Allegra, C.J.; Petrelli, N.J.; O’Connell, M.J.; et al. Clinical Outcome From Oxaliplatin Treatment in Stage II/III Colon Cancer According to Intrinsic Subtypes: Secondary Analysis of NSABP C-07/NRG Oncology Randomized Clinical Trial. JAMA Oncol. 2016, 2, 1162–1169. [Google Scholar] [CrossRef] [PubMed]
- Dry, J.R.; Pavey, S.; Pratilas, C.A.; Harbron, C.; Runswick, S.; Hodgson, D.; Chresta, C.; McCormack, R.; Byrne, N.; Cockerill, M.; et al. Transcriptional pathway signatures predict MEK addiction and response to selumetinib (AZD6244). Cancer Res. 2010, 70, 2264–2273. [Google Scholar] [CrossRef] [Green Version]
- Broecker, F.; Hardt, C.; Herwig, R.; Timmermann, B.; Kerick, M.; Wunderlich, A.; Schweiger, M.R.; Borsig, L.; Heikenwalder, M.; Lehrach, H.; et al. Transcriptional signature induced by a metastasis-promoting c-Src mutant in a human breast cell line. FEBS J. 2016, 283, 1669–1688. [Google Scholar] [CrossRef] [Green Version]
- Huang, F.; Reeves, K.; Han, X.; Fairchild, C.; Platero, S.; Wong, T.W.; Lee, F.; Shaw, P.; Clark, E. Identification of Candidate Molecular Markers Predicting Sensitivity in Solid Tumors to Dasatinib: Rationale for Patient Selection. Cancer Res. 2007, 67, 2226–2238. [Google Scholar] [CrossRef] [Green Version]
- Yang, M.; Davis, T.B.D.B.; Nebozhyn, M.V.; Loboda, A.; Wang, H.; Schell, M.J.; Pflieger, L.; Thota, R.; Pledger, W.J.; Yeatman, T.J. A novel role of SRC in mediating bypass resistance to MEK inhibition in colorectal cancer stem cells. Cancer Res. 2021, 81 (Suppl. 13), 1083. [Google Scholar]
- Hänzelmann, S.; Castelo, R.; Guinney, J. GSVA: Gene set variation analysis for microarray and RNA-Seq data. BMC Bioinform. 2013, 14, 7. [Google Scholar] [CrossRef] [Green Version]
- Eide, P.W.; Bruun, J.; Lothe, R.A.; Sveen, A. CMScaller: An R package for consensus molecular subtyping of colorectal cancer pre-clinical models. Sci. Rep. 2017, 7, 16618. [Google Scholar] [CrossRef] [PubMed] [Green Version]
- Medico, E.; Russo, M.; Picco, G.; Cancelliere, C.; Valtorta, E.; Corti, G.; Buscarino, M.; Isella, C.; Lamba, S.E.; Martinoglio, B.; et al. The molecular landscape of colorectal cancer cell lines unveils clinically actionable kinase targets. Nat. Commun. 2015, 6, 7002. [Google Scholar] [CrossRef]
- Vasaikar, S.; Huang, C.; Wang, X.; Petyuk, V.A.; Savage, S.R.; Wen, B.; Dou, Y.; Zhang, Y.; Shi, Z.; Arshad, O.A.; et al. Proteogenomic Analysis of Human Colon Cancer Reveals New Therapeutic Opportunities. Cell 2019, 177, 1035–1049.e1019. [Google Scholar] [CrossRef] [Green Version]
- Loboda, A.; Nebozhyn, M.V.; Watters, J.W.; A Buser, C.; Shaw, P.M.; Huang, P.S.; Veer, L.V.; Tollenaar, R.A.E.M.; Jackson, D.B.; Agrawal, D.; et al. EMT is the dominant program in human colon cancer. BMC Med. Genom. 2011, 4, 9. [Google Scholar] [CrossRef] [Green Version]
- Schell, M.J.; Yang, M.; Missiaglia, E.; Delorenzi, M.; Soneson, C.; Yue, B.; Nebozhyn, M.V.; Loboda, A.; Bloom, G.; Yeatman, T.J. A Composite Gene Expression Signature Optimizes Prediction of Colorectal Cancer Metastasis and Outcome. Clin. Cancer Res. 2016, 22, 734–745. [Google Scholar] [CrossRef] [Green Version]
- Liston, D.R.; Davis, M. Clinically Relevant Concentrations of Anticancer Drugs: A Guide for Nonclinical Studies. Clin. Cancer Res. 2017, 23, 3489–3498. [Google Scholar] [CrossRef] [Green Version]
- Davis, T.B.; Yang, M.; Schell, M.J.; Wang, H.; Ma, L.; Pledger, W.J.; Yeatman, T.J. PTPRS Regulates Colorectal Cancer RAS Pathway Activity by Inactivating Erk and Preventing Its Nuclear Translocation. Sci. Rep. 2018, 8, 9296. [Google Scholar] [CrossRef] [PubMed] [Green Version]


| Cell Lines | Cancer Characteristics | Scores | ||||
|---|---|---|---|---|---|---|
| MSI/MSS Status | Mutation Gene | CMS Class | 18 Gene | 13-Gene | SRC Activation | |
| LIM2099 | MSS | KRAS | CMS4 | 0.26 | 7.36 | 6.78 |
| LS123 | MSS | KRAS | CMS4 | 1.05 | 3.22 | 1.77 |
| SW480 | MSS | KRAS | CMS4 | 1.40 | 3.01 | 1.08 |
| SW1417 | MSS | BRAF | CMS4 | 0.89 | 0.13 | 1.22 |
| SNU2CA | MSI | KRAS | CMS4 | 0.15 | 1.70 | 0.51 |
| HCT116 | MSI | KRAS | CMS4 | 0.14 | 0.77 | −0.17 |
| WiDr | MSS | BRAF | CMS3 | 0.06 | 0.78 | 1.10 |
| HCA7 | MSI | WT | CMS4 | 0.38 | 0.42 | 0.20 |
| SW620 | MSS | KRAS | CMS4 | 0.38 | −0.36 | −0.18 |
| SNU2CB | MSI | KRAS | CMS3 | −0.45 | 0.30 | −0.42 |
| SNU1411 | MSS | KRAS | CMS3 | 0.32 | −0.21 | 1.45 |
| DIFI | MSS | WT | CMS2 | −0.35 | 1.69 | 1.14 |
| LoVo | MSI | KRAS | CMS1 | −0.01 | 0.01 | 0.07 |
| SW48 | MSI | WT | CMS1 | 0.00 | −0.17 | −0.45 |
| SW837 | MSS | KRAS | CMS4 | −0.59 | 0.32 | −0.17 |
| RW7213 | MSS | KRAS | CMS2 | 1.00 | −0.47 | −0.41 |
Publisher’s Note: MDPI stays neutral with regard to jurisdictional claims in published maps and institutional affiliations. |
© 2022 by the authors. Licensee MDPI, Basel, Switzerland. This article is an open access article distributed under the terms and conditions of the Creative Commons Attribution (CC BY) license (https://creativecommons.org/licenses/by/4.0/).
Share and Cite
Davis, T.B.; Gupta, S.; Yang, M.; Pflieger, L.; Rajan, M.; Wang, H.; Thota, R.; Yeatman, T.J.; Pledger, W.J. Ras Pathway Activation and MEKi Resistance Scores Predict the Efficiency of MEKi and SRCi Combination to Induce Apoptosis in Colorectal Cancer. Cancers 2022, 14, 1451. https://doi.org/10.3390/cancers14061451
Davis TB, Gupta S, Yang M, Pflieger L, Rajan M, Wang H, Thota R, Yeatman TJ, Pledger WJ. Ras Pathway Activation and MEKi Resistance Scores Predict the Efficiency of MEKi and SRCi Combination to Induce Apoptosis in Colorectal Cancer. Cancers. 2022; 14(6):1451. https://doi.org/10.3390/cancers14061451
Chicago/Turabian StyleDavis, Thomas Benjamin, Shilpa Gupta, Mingli Yang, Lance Pflieger, Malini Rajan, Heiman Wang, Ramya Thota, Timothy J. Yeatman, and Warren Jackson Pledger. 2022. "Ras Pathway Activation and MEKi Resistance Scores Predict the Efficiency of MEKi and SRCi Combination to Induce Apoptosis in Colorectal Cancer" Cancers 14, no. 6: 1451. https://doi.org/10.3390/cancers14061451
APA StyleDavis, T. B., Gupta, S., Yang, M., Pflieger, L., Rajan, M., Wang, H., Thota, R., Yeatman, T. J., & Pledger, W. J. (2022). Ras Pathway Activation and MEKi Resistance Scores Predict the Efficiency of MEKi and SRCi Combination to Induce Apoptosis in Colorectal Cancer. Cancers, 14(6), 1451. https://doi.org/10.3390/cancers14061451