
Testicular Neoplasms: Primary Tumour Size Is Closely Interrelated with Histology, Clinical Staging, and Tumour Marker Expression Rates—A Comprehensive Statistical Analysis

 ,
,
Abstract
Simple Summary
Abstract
1. Introduction
2. Materials and Methods
2.1. Patient Recruitment, Data Procurement
2.2. Statistical Analysis
3. Results
3.1. General Results
3.2. Assumption # 1 (Association of Tumour Size with Histology)
3.3. Assumption #2 (Association of Tumour Size and Clinical Staging in GCTs)
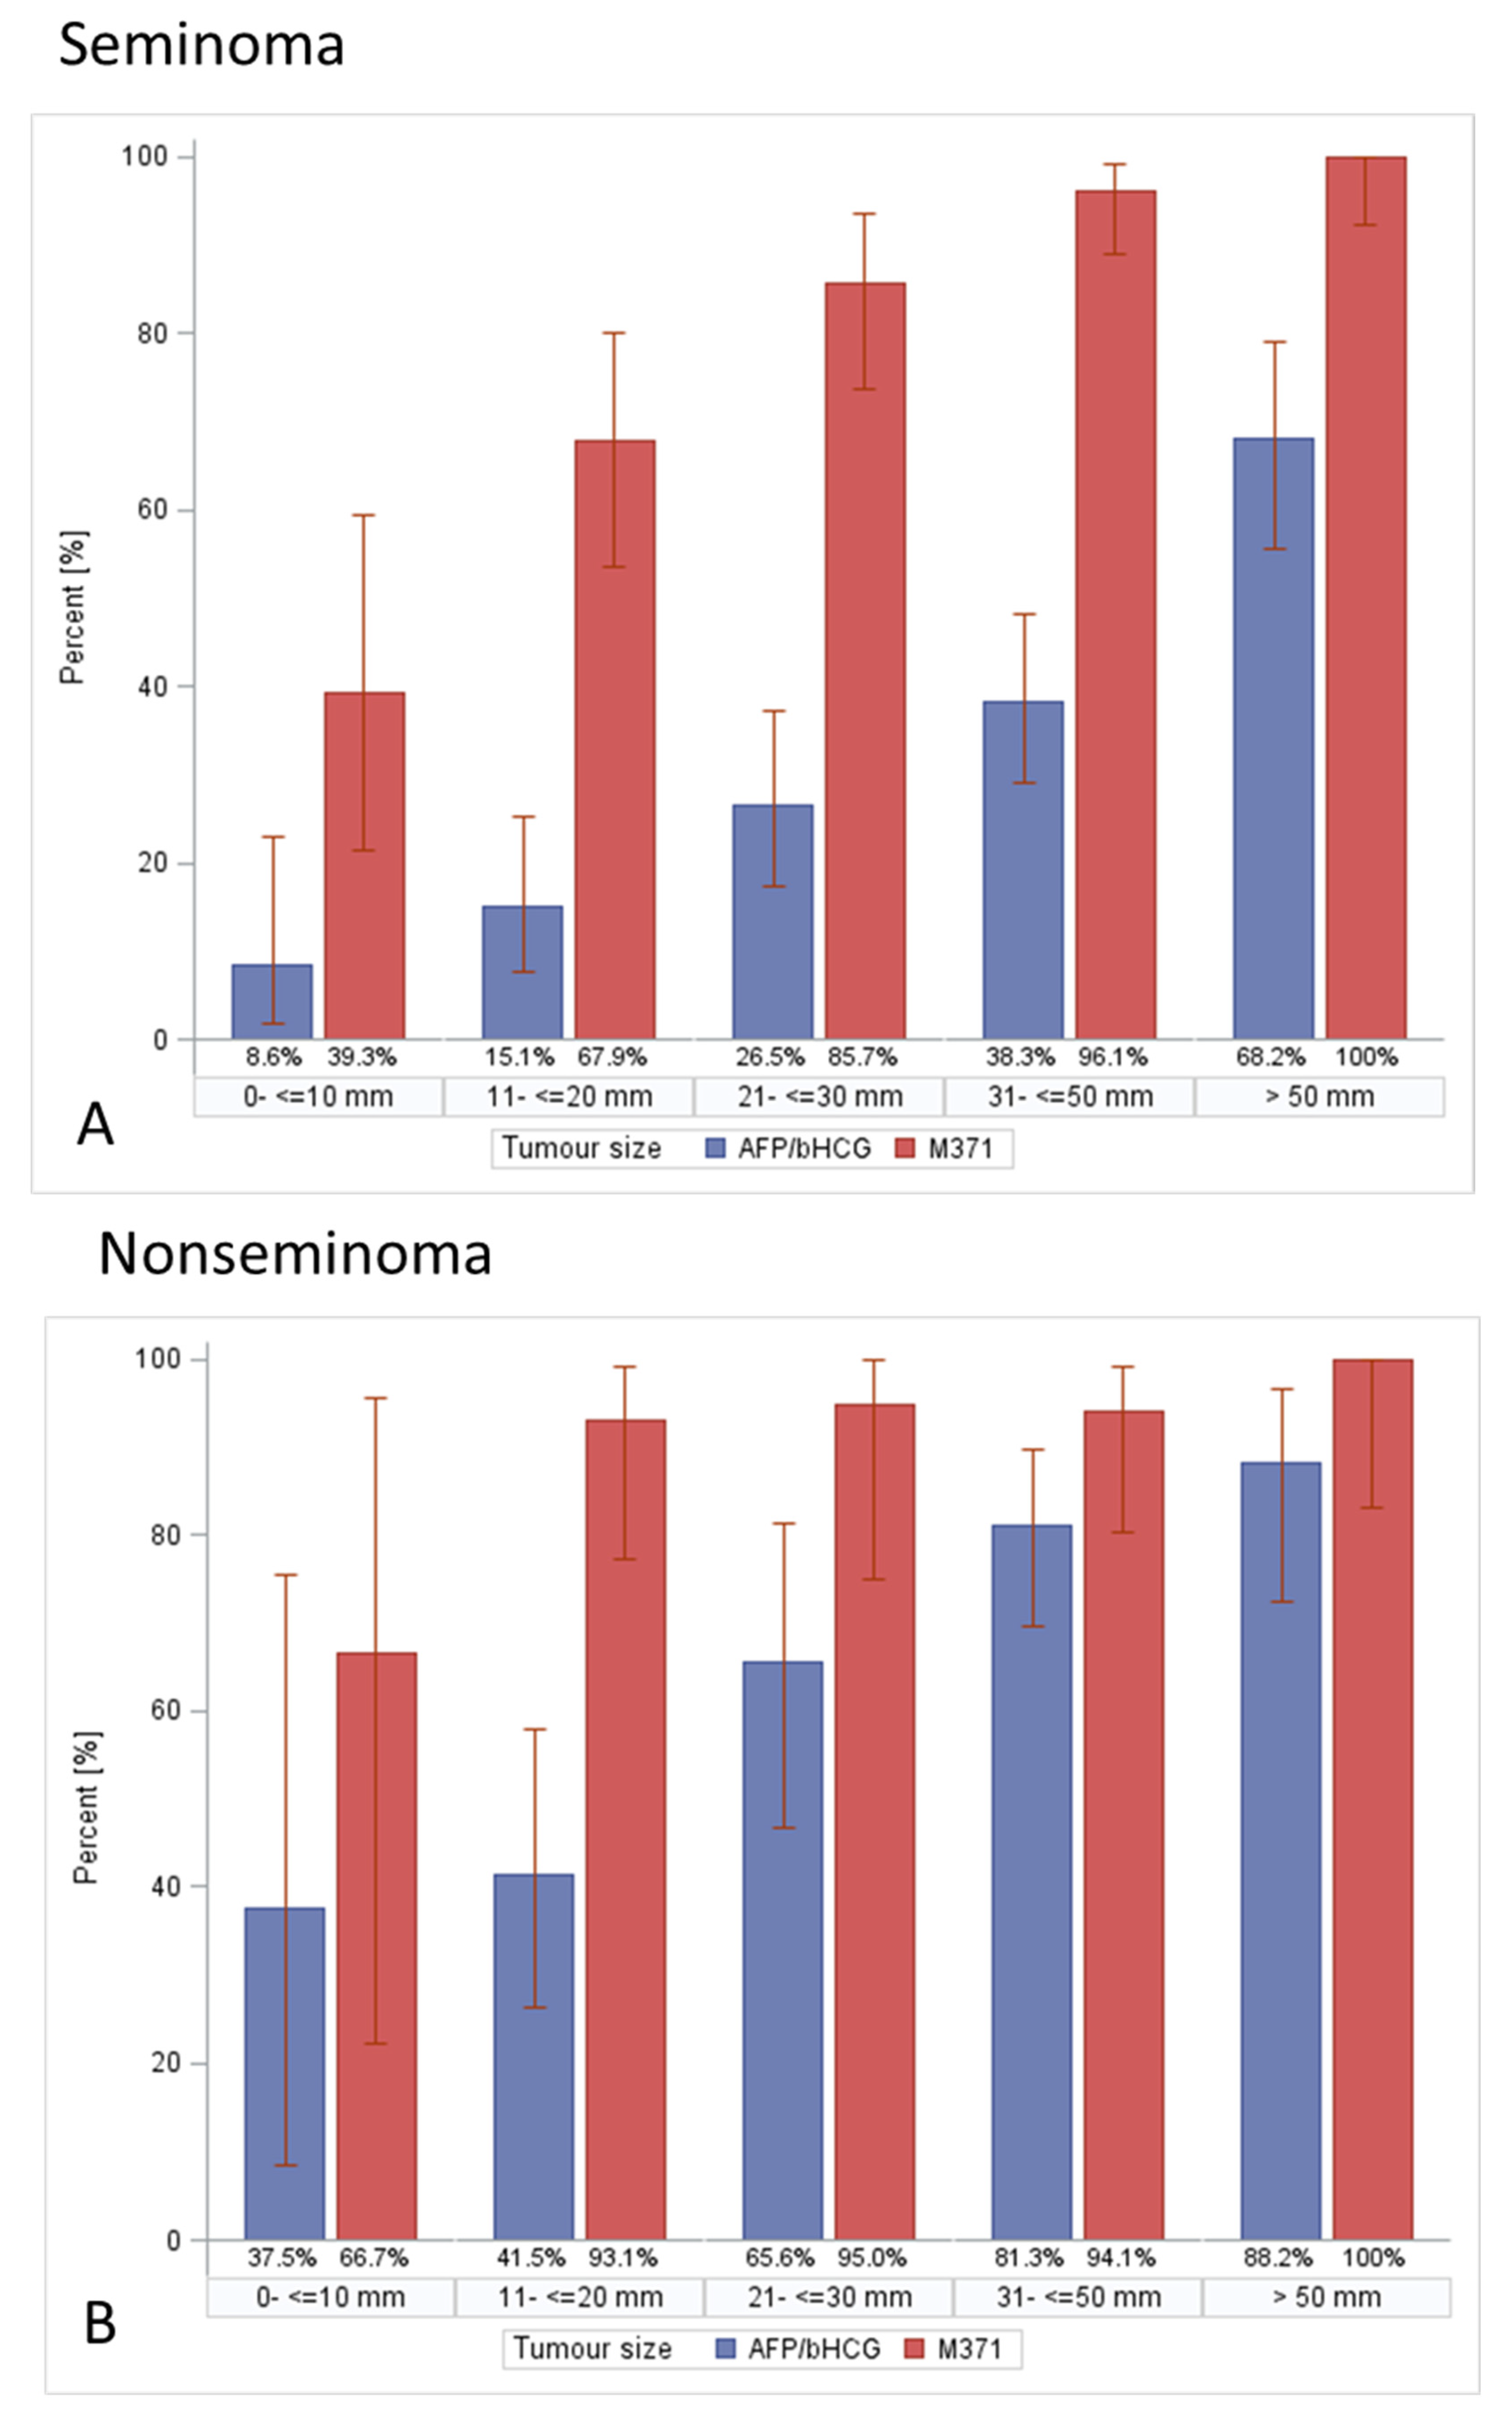
3.4. Assumption #3 (Tumour Size Is Associated with Frequencies of Tumour Marker Expression in GCTs)
3.5. Assumption #4 (Association of Patient Age with Tumour Size)
4. Discussion
4.1. Tumour Size—General Considerations
4.2. Association of Primary Tumour Size with Histology (Assumption #1)
4.3. The Impact of Tumour Size on Clinical Staging in Testicular Germ Cell Tumours (Assumption #2)
4.4. The Association of Tumour Size with Serum Tumour Marker Expression Rates in Germ Cell Tumours (Assumption #3)
4.5. No Association between Patient Age and Tumour Size (Assumption #4)
4.6. Limitations of the Study
5. Conclusions
Author Contributions
Funding
Institutional Review Board Statement
Informed Consent Statement
Data Availability Statement
Acknowledgments
Conflicts of Interest
Abbreviations
| AFP | Alpha fetoprotein |
| AUC | area under the curve |
| bHCG | beta human chorionic gonadotropin |
| BT | benign tumours |
| CI | confidence interval |
| CS | clinical stage |
| GCT | germ cell tumour |
| IQR | inter quartile range |
| LDH | lactate dehydrogenase |
| M371 | microRNA-371a-3p |
| mm | milli meter |
| NS | nonseminoma |
| n | number |
| OM | other testicular malignancies |
| ROC | receiver operating characteristic |
| SE | seminoma |
| STM | serum tumour marker |
| TS | tumour size |
| ULN | upper limit of norm |
| Q1 | first quartile |
| Q3 | third quartile |
References
- Boden, G.; Gibb, R. Radiotherapy and testicular neoplasms. Lancet 1951, 2, 1195–1197. [Google Scholar] [CrossRef]
- Dixon, F.J.; Moore, R.A. Testicular tumors. A Clinicopathologic study. Cancer 1953, 6, 427–454. [Google Scholar] [CrossRef]
- Javadpour, N. The National Cancer Institute Experience with Testicular Cancer. J. Urol. 1978, 120, 651–659. [Google Scholar] [CrossRef]
- Collins, D.H.; Pugh, R.C.B. Classification and frequency of testicular tumours. Br. J. Urol. 1964, 36, 1–11. [Google Scholar]
- Fraley, E.E.; Lange, P.H.; Kennedy, B.J. Germ-cell testicular cancer in adults (first of two parts). N. Engl. J. Med. 1979, 301, 1370–1377. [Google Scholar] [CrossRef]
- Khoury, J.D.; Solary, E.; Abla, O.; Akkari, Y.; Alaggio, R.; Apperley, J.F.; Bejar, R.; Berti, E.; Busque, L.; Chan, J.K.C.; et al. The 5th edition of the World Health Organization Classification of Haematolymphoid Tumours: Myeloid and Histiocytic/Dendritic Neoplasms. Leukemia 2022, 36, 1703–1719. [Google Scholar] [CrossRef]
- Gentile, G.; Rizzo, M.; Bianchi, L.; Falcone, M.; Dente, D.; Cilletti, M.; Franceschelli, A.; Vagnoni, V.; Garofalo, M.; Schiavina, R.; et al. Testis Sparing Surgery for Small Testicular Masses: Retrospective Analysis of a Multi-Center Cohort. J. Urol. 2020, 203, 760–766. [Google Scholar] [CrossRef]
- Tsili, A.C.; Bougia, C.K.; Pappa, O.; Argyropoulou, M. Ultrasonography of the scrotum: Revisiting a classic technique. Eur. J. Radiol. 2021, 145, 110000. [Google Scholar] [CrossRef]
- Ager, M.; Donegan, S.; Boeri, L.; Mayor de Castro, J.; Donaldson, J.F.; Omar, M.I.; Dimitropoulos, K.; Tharakan, T.; Janisch, F.; Muilwijk, T.; et al. Radiological features characterising indeterminate testes masses; A systematic review and meta-analysis. BJU Int. 2022. Epub ahead of print. [Google Scholar] [CrossRef]
- Bertolotto, M.; Muça, M.; Currò, F.; Bucci, S.; Rocher, L.; Cova, M.A. Multiparametric US for scrotal diseases. Abdom. Radiol. 2018, 43, 899–917. [Google Scholar] [CrossRef]
- Zengerling, F.; Kunath, F.; Jensen, K.; Ruf, C.; Schmidt, S.; Spek, A. Prognostic factors for tumor recurrence in patients with clinical stage I seminoma undergoing surveillance-A systematic review. Urol. Oncol. 2018, 36, 448–458. [Google Scholar] [CrossRef] [PubMed]
- Dieckmann, K.P.; Simonsen-Richter, H.; Kulejewski, M.; Anheuser, P.; Zecha, H.; Isbarn, H.; Pichlmeier, U. Serum Tumour Markers in Testicular Germ Cell Tumours: Frequencies of Elevated Levels and Extents of Marker Elevation Are Significantly Associated with Clinical Parameters and with Response to Treatment. BioMed Res. Int. 2019, 2019, 1–22. [Google Scholar] [CrossRef] [PubMed]
- Leão, R.; Albersen, M.; Looijenga, L.H.J.; Tandstad, T.; Kollmannsberger, C.; Murray, M.J.; Culine, S.; Coleman, N.; Belge, G.; Hamilton, R.J.; et al. Circulating MicroRNAs, the Next-Generation Serum Biomarkers in Testicular Germ Cell Tumours: A Systematic Review. Eur. Urol. 2021, 80, 456–466. [Google Scholar] [CrossRef]
- Dieckmann, K.P.; Radtke, A.; Geczi, L.; Matthies, C.; Anheuser, P.; Eckardt, U.; Sommer, J.; Zengerling, F.; Trenti, E.; Pichler, R.; et al. Serum levels of microRNA-371a-3p (M371 Test) as a new biomarker of testicular germ cell-tumors: Results of a prospective multicentric study. J. Clin. Oncol. 2019, 37, 1412–1423. [Google Scholar] [CrossRef] [PubMed]
- McGuinness, L.A.; Obeidat, S.; Hickerton, B.; Long, R. Has increasing public health awareness influenced the size of testicular tumours among adult populations over the last 40 years? J. Public Health 2016, 39, 90–94. [Google Scholar] [CrossRef] [PubMed]
- Scandura, G.; Verrill, C.; Protheroe, A.; Joseph, J.; Ansell, W.; Sahdev, A.; Shamash, J.; Berney, D.M. Incidentally detected testicular lesions <10 mm in diameter: Can orchidectomy be avoided? BJU Int. 2017, 121, 575–582. [Google Scholar] [CrossRef]
- Heinzelbecker, J.; Katzmarzik, M.; Weiss, C.; Trojan, L.; Michel, M.S.; Haecker, A. Changes of Stage, Predictive Factors and Adjuvant Treatment Modalities in Seminomatous Testicular Cancer from 1987 to 2007 and Their Impact on the Status of Metastasis, Recurrence-Free and Overall Survival: A Single-Center Analysis. Urol. Int. 2011, 87, 282–287. [Google Scholar] [CrossRef]
- Song, G.; Xiong, G.Y.; Fan, Y.; Huang, C.; Kang, Y.M.; Ji, G.J.; Chen, J.C.; Xin, Z.C.; Zhou, L.Q. The role of tumor size, ultrasonographic findings, and serum tumor markers in predicting the likelihood of malignant testicular histology. Asian J. Androl. 2019, 21, 196–200. [Google Scholar] [CrossRef]
- Dieckmann, K.P.; Richter-Simonsen, H.; Kulejewski, M.; Ikogho, R.; Zecha, H.; Anheuser, P.; Pichlmeier, U. Testicular germ-cell tumours: A descriptive analysis of clinical characteristics at first presentation. Urol. Int. 2018, 100, 409–419. [Google Scholar] [CrossRef]
- Kliesch, S.; Schmidt, S.; Wilborn, D.; Aigner, C.; Albrecht, W.; Bedke, J.; Beintker, M.; Beyersdorff, D.; Bokemeyer, C.; Busch, J.; et al. Management of Germ Cell Tumours of the Testis in Adult Patients. German Clinical Practice Guideline Part I: Epidemiology, Classification, Diagnosis, Prognosis, Fertility Preservation, and Treatment Recommendations for Localized Stages. Urol. Int. 2021, 105, 169–180. [Google Scholar] [CrossRef]
- Rothermundt, C.; Thurneysen, C.; Cathomas, R.; Müller, B.; Mingrone, W.; Hirschi-Blickenstorfer, A.; Wehrhahn, T.; Ruf, C.; Rothschild, S.; Seifert, B.; et al. Baseline characteristics and patterns of care in testicular cancer patients: First data from the Swiss Austrian German Testicular Cancer Cohort Study (SAG TCCS). Swiss Med. Wkly. 2018, 148, w14640. [Google Scholar] [PubMed]
- Heinzelbecker, J.; Katzmarzik, M.; Weiss, C.; Trojan, L.; Haecker, A. During twenty years of Cisplatin-based therapy the face of nonseminomatous testicular germ cell tumors is still changing: An evaluation of presentation, management, predictive factors and survival. Int. Braz. J. Urol. 2013, 39, 10–21. [Google Scholar] [CrossRef] [PubMed][Green Version]
- Paffenholz, P.; Held, L.; Loosen, S.H.; Pfister, D.; Heidenreich, A. Testis-sparing surgery for benign testicular masses–diagnostics and therapeutic approaches. J. Urol. 2018, 200, 353–360. [Google Scholar] [CrossRef] [PubMed]
- Woldu, S.L.; Aydin, A.M.; Rao, A.V.; Hutchinson, R.C.; Singla, N.; Clinton, T.N.; Krabbe, L.M.; Passoni, N.M.; Raj, G.V.; Miller, D.S.; et al. Differences at Presentation and Treatment of Testicular Cancer in Hispanic Men: Institutional and National Hospital-Based Analysis. Urology 2018, 112, 103–111. [Google Scholar] [CrossRef]
- Bhardwa, J.M.; Powles, T.; Berney, D.; Baithun, S.; Nargund, V.H.; Oliver, R.T. Assessing the size and stage of testicular germ cell tumours: 1984-2003. BJU Int. 2005, 96, 819–821. [Google Scholar] [CrossRef]
- Agnarsson, B.A.; Gudbjartsson, T.; Einarsson, G.V.; Magnusson, K.; Thoroddsen, A.; Bergthorsson, J.T.; Amundadottir, L.; Barkardottir, R.B.; Björnsson, J. Testicular germ cell tumours in Iceland: A nationwide clinicopathological study. APMIS 2006, 114, 779–783. [Google Scholar] [CrossRef]
- Kobayashi, K.; Saito, T.; Kitamura, Y.; Nobushita, T.; Kawasaki, T.; Hara, N.; Takahashi, K. Effect of the time from the presentation of symptoms to medical consultation on primary tumor size and survival in patients with testicular cancer: Shift in the last 2 decades. Urol. Oncol. 2014, 32, 43.e17–43.e22. [Google Scholar] [CrossRef]
- MacKay, E.N.; Sellers, A.H. A statistical study of malignant testicular tumours based on the experience of the Ontario cancer Foundation Clinics, 1938-1961. Canad. Med. Ass. J. 1966, 94, 889–899. [Google Scholar]
- Krag Jacobsen, G.; Barlebo, H.; Olsen, J.; Schultz, H.P.; Starklint, H.; Sögaaard, H.; Vaeth, M.; Dateca Study Group. Testicular germ cell tumours in Denmark 1976-1980. Acta Radiol. Oncol. 1984, 23, 239–247. [Google Scholar]
- Egan, J.; Cheaib, J.G.; Biles, M.J.; Huang, M.M.; Metcalf, M.; Matoso, A.; Pierorazio, P. Testis-Sparing Surgery: A Single Institution Experience. Urology 2020, 147, 192–198. [Google Scholar] [CrossRef]
- Schwen, Z.R.; Liu, J.L.; Gabrielson, A.T.; Patel, H.D.; Gupta, M.; Rowe, S.P.; Herati, A.S.; Pierorazio, P.M. Testicular ultrasound underestimates the size of small testicular masses: A radiologic-pathologic correlation study. World J. Urol. 2021, 39, 3399–3405. [Google Scholar] [CrossRef] [PubMed]
- Keske, M.; Canda, A.E.; Yalcin, S.; Kilicarslan, A.; Kibar, Y.; Tuygun, C.; Onder, E.; Atmaca, A.F.; Yildirim, A.; Ozkanli, S.S.; et al. Is testis-sparing surgery safe in small testicular masses? Results of a multicentre study. Can. Urol. Assoc. J. 2017, 11, E100–E104. [Google Scholar] [CrossRef] [PubMed][Green Version]
- Pratsinis, M.; Fankhauser, C.; Pratsinis, K.; Beyer, J.; Bührer, E.; Cathomas, R.; Fischer, N.; Hermanns, T.; Hirschi-Blickenstorfer, A.; Kamradt, J.; et al. Metastatic Potential of Small Testicular Germ Cell Tumors: Implications for Surveillance of Small Testicular Masses. Eur. Urol. Open Sci. 2022, 40, 16–18. [Google Scholar] [CrossRef] [PubMed]
- Belfield, J.; Findlay-Line, C. Testicular Germ Cell Tumours-The Role of Conventional Ultrasound. Cancers 2022, 14, 3882. [Google Scholar] [CrossRef] [PubMed]
- Lewicki, A.; Freeman, S.; Jędrzejczyk, M.; Dobruch, J.; Dong, Y.; Bertolotto, M.; Dietrich, C.F. Incidental Findings and How to Manage Them: Testis- A WFUMB Position Paper. Ultrasound Med. Biol. 2021, 47, 2787–2802. [Google Scholar] [CrossRef]
- Wardak, S.; Pang, K.H.; Castiglione, F.; Lindsay, J.; Walkden, M.; Heffernan Ho, D.; Kirkham, A.; Hadway, P.; Nigam, R.; Rees, R.; et al. Management of small testicular masses: Outcomes from a single centre multidisciplinary team. BJU Int. 2022. Epub ahead of print. [Google Scholar] [CrossRef]
- Shilo, Y.; Zisman, A.; Lindner, A.; Raz, O.; Strauss, S.; Siegel, Y.I.; Segal, M.; Sandbank, J.; Leibovici, D. The predominance of benign histology in small testicular masses. Urol. Oncol. 2012, 30, 719–722. [Google Scholar] [CrossRef]
- Galosi, A.B.; Fulvi, P.; Fabiani, A.; Servi, L.; Filosa, A.; Leone, L.; Marronaro, A.; Caraceni, E.; Montironi, R. Testicular sparing surgery in small testis masses: A multinstitutional experience. Arch. Ital. Urol. Androl. 2016, 88, 320–324. [Google Scholar] [CrossRef][Green Version]
- Lagabrielle, S.; Durand, X.; Droupy, S.; Izard, V.; Marcelli, F.; Huyghe, E.; Ferriere, J.M.; Ferretti, L. Testicular tumours discovered during infertility workup are predominantly benign and could initially be managed by sparing surgery. J. Surg. Oncol. 2018, 118, 630–635. [Google Scholar] [CrossRef]
- Dieckmann, K.P.; Frey, U.; Lock, G. Contemporary diagnostic work up of testicular germ cell tumours. Nat. Rev. Urol. 2013, 10, 703–712. [Google Scholar] [CrossRef]
- Gobbo, A.; Negri, L.; Casale, P.; Fasulo, V.; Lughezzani, G.; Saitta, C.; Benaglia, R.; Buffi, N.M.; Levi Setti, P. Is testis sparing surgery safe in patients with incidental small testicular lesions referring to a fertility center? A retrospective analysis reporting factors correlated to malignancy and long-term oncological outcomes. Urol. Oncol. 2022. Epub ahead of print. [Google Scholar] [CrossRef] [PubMed]
- Narayan, Y.; Brown, D.; Ivaz, S.; Das, K.; Moussa, M.; Tsampoukas, G.; Papatsoris, A.; Buchholz, N. Incidental testicular masses and the role of organ-sparing approach. Arch. Ital. Urol. Androl. 2021, 93, 296–300. [Google Scholar] [CrossRef] [PubMed]
- Corrie, D.; Mueller, E.J.; Thompson, I.M. Management of ultrasonically detected nonpalpable testis masses. Urology 1991, 38, 429–431. [Google Scholar] [CrossRef]
- Staudacher, N.; Tulchiner, G.; Bates, K.; Ladurner, M.; Kafka, M.; Aigner, F.; Pichler, R.; Horninger, W. Organ-Sparing Surgery in Testicular Tumor: Is This the Right Approach for Lesions ≤ 20 mm? J. Clin. Med. 2020, 9, 2911. [Google Scholar] [CrossRef]
- Del Real, O.J.; Calvo de la Barra, C.I.; Jiménez, J.A.; Sepulveda, F.; Domínguez, J. Predicting malignancy in small testicular lesions. Cent. Eur. J. Urol. 2022, 75, 47–51. [Google Scholar] [CrossRef]
- Ates, F.; Malkoc, E.; Zor, M.; Demirer, Z.; Alp, B.F.; Basal, S.; Guragac, A.; Yildirim, I. Testis-Sparing Surgery in Small Testicular Masses Not Suspected to Be Malignant. Clin. Genitourin. Cancer 2016, 14, e49–e53. [Google Scholar] [CrossRef]
- Hindley, R.G.; Chandra, A.; Saunders, A.; O’Brien, T.S. Impalpable testis cancer. BJU Int. 2003, 92, 572–574. [Google Scholar] [CrossRef]
- Niemczyk, G.; Zapała, Ł.; Borkowski, T.; Szabłoński, W.; Radziszewski, P.; Cudnoch-Jędrzejewska, A. Feasibility of active surveillance in small testicular mass: A mini review. Cent. Eur. J. Urol. 2021, 74, 10–13. [Google Scholar]
- Bieniek, J.M.; Juvet, T.; Margolis, M.; Grober, E.D.; Lo, K.C.; Jarvi, K.A. Prevalence and management of incidental small testicular masses discovered on ultrasonographic evaluation of male infertility. J. Urol. 2018, 199, 481–486. [Google Scholar] [CrossRef]
- Eifler, J.B.J.; King, P.; Schlegel, P.N. Incidental Testicular Lesions Found During Infertility Evaluation are Usually Benign and May be Managed Conservatively. J. Urol. 2008, 180, 261–265. [Google Scholar] [CrossRef]
- Beck, S.D.; Foster, R.S.; Bihrle, R.; Donohue, J.P. Significance of primary tumor size and preorchiectomy serum tumor marker level in predicting pathologic stage at retroperitoneal lymph node dissection in clinical Stage A nonseminomatous germ cell tumors. Urology 2007, 69, 557–559. [Google Scholar] [CrossRef] [PubMed]
- Warde, P.; Specht, L.; Horwich, A.; Oliver, T.; Panzarella, T.; Gospodarowicz, M.; Von Der Maase, H. Prognostic factors for relapse in stage I seminoma managed by surveillance: A pooled analysis. J. Clin. Oncol. 2002, 20, 4448–4452. [Google Scholar] [CrossRef] [PubMed]
- Boormans, J.L.; Mayor de Castro, J.; Marconi, L.; Yuan, Y.; Laguna Pes, M.P.; Bokemeyer, C.; Nicolai, N.; Algaba, F.; Oldenburg, J.; Albers, P. Testicular Tumour Size and Rete Testis Invasion as Prognostic Factors for the Risk of Relapse of Clinical Stage I Seminoma Testis Patients Under Surveillance: A Systematic Review by the Testicular Cancer Guidelines Panel. Eur. Urol. 2018, 73, 394–405. [Google Scholar] [CrossRef] [PubMed]
- Stephenson, A.; Eggener, S.E.; Bass, E.B.; Chelnick, D.M.; Daneshmand, S.; Feldman, D.; Gilligan, T.; Karam, J.A.; Leibovich, B.; Liauw, S.L.; et al. Diagnosis and Treatment of Early Stage Testicular Cancer: AUA Guideline. J. Urol. 2019, 202, 272–281. [Google Scholar] [CrossRef]
- Oldenburg, J.; Berney, D.M.; Bokemeyer, C.; Climent, M.A.; Daugaard, G.; Gietema, J.A.; De Giorgi, U.; Haugnes, H.S.; Huddart, R.A.; Leão, R.; et al. Testicular seminoma and non-seminoma: ESMO-EURACAN Clinical Practice Guideline for diagnosis, treatment and follow-up. Ann. Oncol. 2022, 33, 362–375. [Google Scholar] [CrossRef]
- von Eyben, F.E.; Madsen, E.L.; Blaabjerg, O.; Petersen, P.H.; von der Maase, H.; Jacobsen, G.K.; Rorth, M. Serum lactate dehydrogenase isoenzyme 1 and relapse in patients with nonseminomatous testicular germ cell tumors clinical stage I. Acta Oncol. 2002, 40, 536–540. [Google Scholar] [CrossRef]
- Hartmann, M.; Pottek, T.; Bussar-Maatz, R.; Weissbach, L. Elevated human chorionic gonadotropin concentrations in the testicular vein and in peripheral venous blood in seminoma patients. An analysis of various parameters. Eur. Urol. 1997, 31, 408–413. [Google Scholar]
- Huertas Mora, R.A.; Larrodera López, L.; Gómez Matobella, I.; Cortes Funes, H. Human B-HCG and AFP as biological markers in germinal testicular tumors. Article in Spanish. Rev. Esp. Oncol. 1984, 31, 321–330. [Google Scholar]
- Myklebust, M.P.; Thor, A.; Rosenlund, B.; Gjengstø, P.; Karlsdottir, Á.; Brydøy, M.; Bercea, B.S.; Olsen, C.; Johnson, I.; Berg, M.I.; et al. Serum miR371 in testicular germ cell cancer before and after orchiectomy, assessed by digital-droplet PCR in a prospective study. Sci. Rep. 2021, 11, 15582. [Google Scholar] [CrossRef]
- Nason, G.J.; Aditya, I.; Leao, R.; Anson-Cartwright, L.; Jewett, M.A.S.; O’Malley, M.; Sweet, J.; Hamilton, R.J. Partial orchiectomy: The Princess Margaret cancer centre experience. Urol. Oncol. 2020, 38, 605.e19–605.e24. [Google Scholar] [CrossRef]


| n (%) | Age (Years) | |||||
|---|---|---|---|---|---|---|
| Min | Q1 | Median | Q3 | Max | ||
| Total | 641 (100%) | 17 | 31 | 38 | 47 | 98 |
| Seminoma (SE) | 365 (56.94%) | 17 | 33 | 40 | 48 | 78 |
| Nonseminoma (NS) | 179 (27.93%) | 17 | 26 | 31 | 37 | 74 |
| Benign tumours (BT) | 79 (12.32%) | 19 | 32 | 41 | 50 | 68 |
| Other malignant tumours (OM) | 18 (2.81%) | 52 | 68 | 72.5 | 78 | 98 |
| GCT (mm) | Seminomas (mm) | Nonseminomas (mm) | Benign Tumours (mm) | Other Malignant Tumours (mm) | |
|---|---|---|---|---|---|
| Mean | 35.9 | 34.8 | 38.2 | 11.8 | 53.0 |
| Std Dev | 23.2 | 22.2 | 25.7 | 7.8 | 14.3 |
| Min | 3 | 4 | 7 | 3 | 16 |
| Q1 | 15 | 19 | 20 | 6 | 49 |
| Median | 30 | 30 | 35 | 10 | 53 |
| Q3 | 46 | 46 | 49 | 15 | 56 |
| Max | 189 | 170 | 189 | 42 | 78 |
| n | 544 | 365 | 179 | 79 | 18 |
| Histologic Groups | p * |
|---|---|
| SE vs. NS | 0.1255 |
| (SE + NS) vs. (BT + OM) | <0.0001 |
| (SE + NS) vs. BT | <0.0001 |
| (SE + NS) vs. OM | <0.0001 |
| BT vs. OM | <0.0001 |
| Size Categories | SE | NS | BT | OM | Total | p * |
|---|---|---|---|---|---|---|
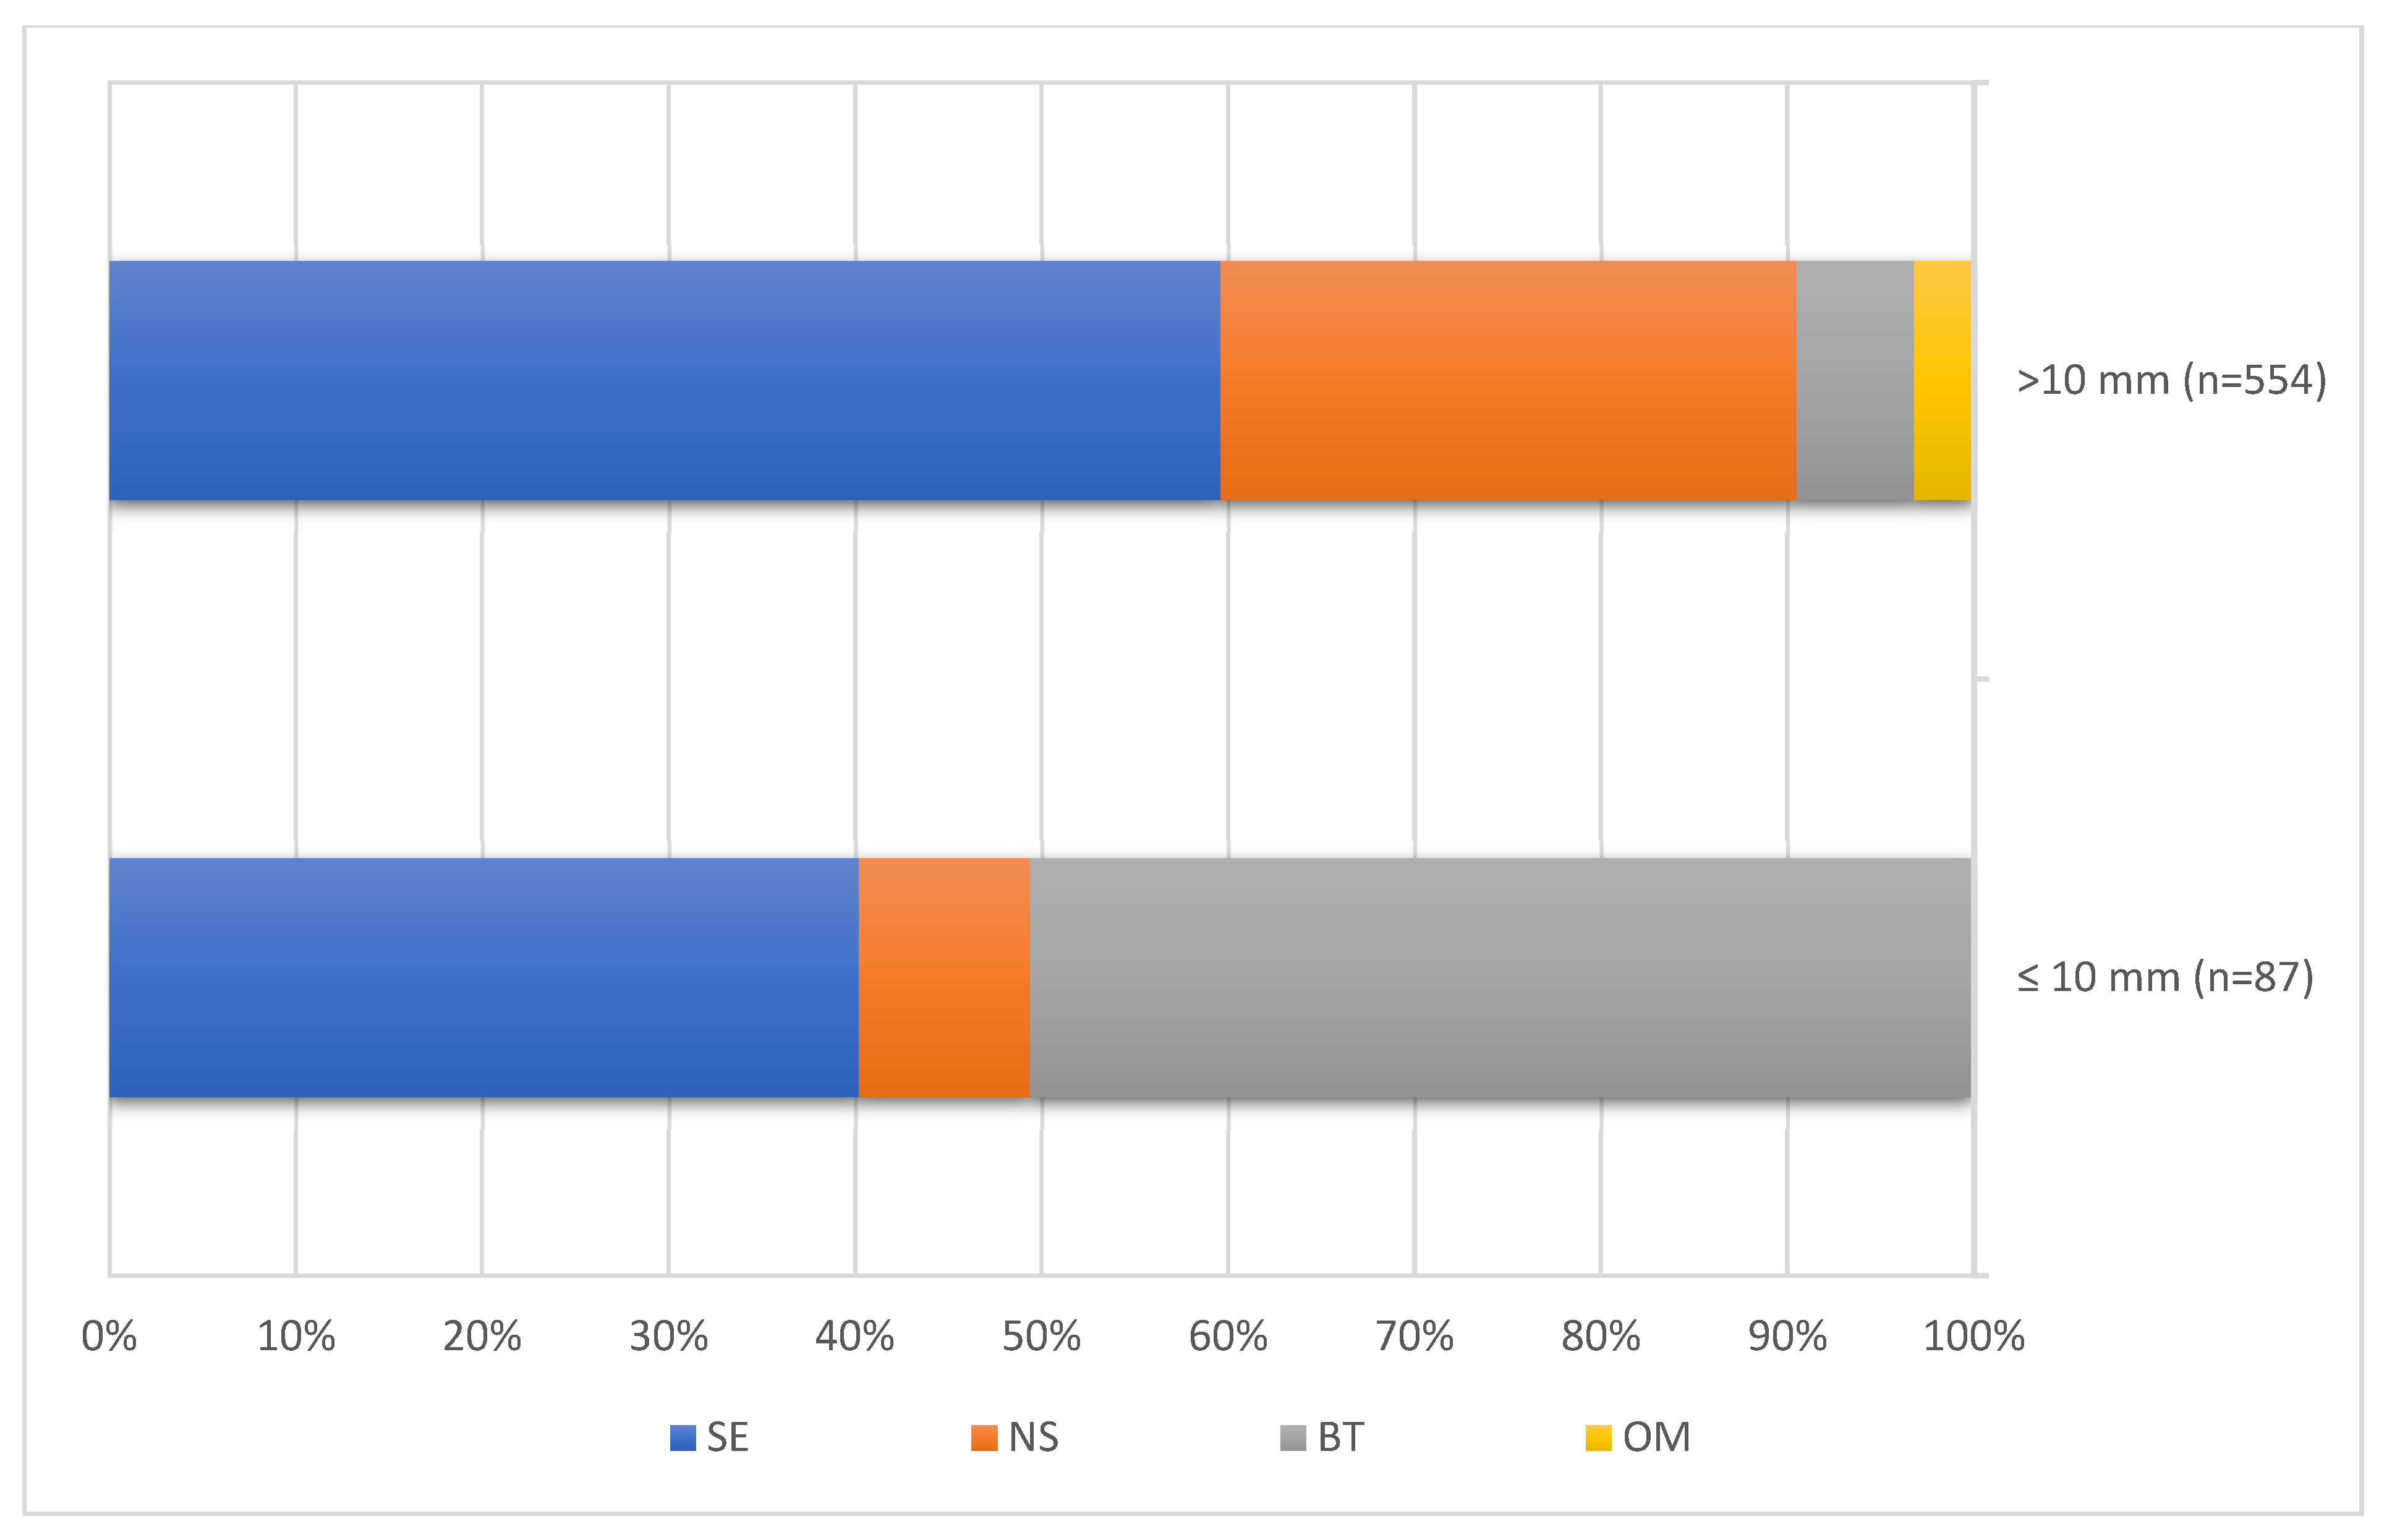
| ≤10 mm (n = 87) | 35 (40.23%) | 8 (9.20%) | 44 (50.57%) | 0 (0.00%) | 100% | <0.0001 |
| >10 mm (n = 554) | 330 (59.57%) | 171 (30.87%) | 35 (6.32%) | 18 (3.25%) | 100% |
| Size Categories | SE | NS | BT | OM | Total |
|---|---|---|---|---|---|
| ≤10 mm (n = 87) | 35 (40.23%) | 8 (9.20%) | 44 (50.57%) | 0 (0.00%) | 100% |
| 11–20 (n = 141) | 73 (51.77%) | 41 (29.08%) | 26 (18.44%) | 1 (0.71%) | 100% |
| 21–30 (n = 123) | 84 (68.29%) | 32 (26.02%) | 7 (5.69%) | 0 (0.00%) | 100% |
| >30 mm (n = 290) | 173 (59.66%) | 98 (33.79%) | 2 (0.69%) | 17 (5.86%) | 100% |
| Size Categories | GCT + OM | BT | p * |
|---|---|---|---|
| ≤10 (n = 87) | 43 (49.43%) | 44 (50.57%) | <0.0001 |
| 11–20 (n = 141) | 115 (81.56%) | 26 (18.44%) | |
| 21–30 (n = 123) | 116 (94.31%) | 7 (5.69%) | |
| >30 mm (n = 290) | 288 (99.31%) | 2 (0.69%) |
| CS1 (n) | CS2a/2b (n) | CS2c (n) | CS3 (n) | |
|---|---|---|---|---|
| ≤10 mm | 42 (97.67%) | 1 (2.33%) | 0 (0.00%) | 0 (0.00%) |
| 11–20 mm | 98 (85.96%) | 11 (9.65%) | 3 (2.63%) | 2 (1.75%) |
| 21–30 mm | 94 (81.03%) | 19 (16.38%) | 0 (0.00%) | 3 (2.59%) |
| >30 mm | 187 (69.00%) | 53 (19.56%) | 12 (4.43%) | 19 (7.01%) |
| CS1 (n) | >CS1 (n) | p * | |
|---|---|---|---|
| ≤10 mm | 42 (97.67%) | 1 (2.33%) | <0.0001 |
| 11–20 mm | 98 (85.96%) | 16 (14.04%) | |
| 21–30 mm | 94 (81.03%) | 22 (18.97%) | |
| >30 mm | 187 (69.00%) | 84 (31.00%) |
| CS1 (mm) | CS2a,b (mm) | CS2c (mm) | CS3 (mm) | |
|---|---|---|---|---|
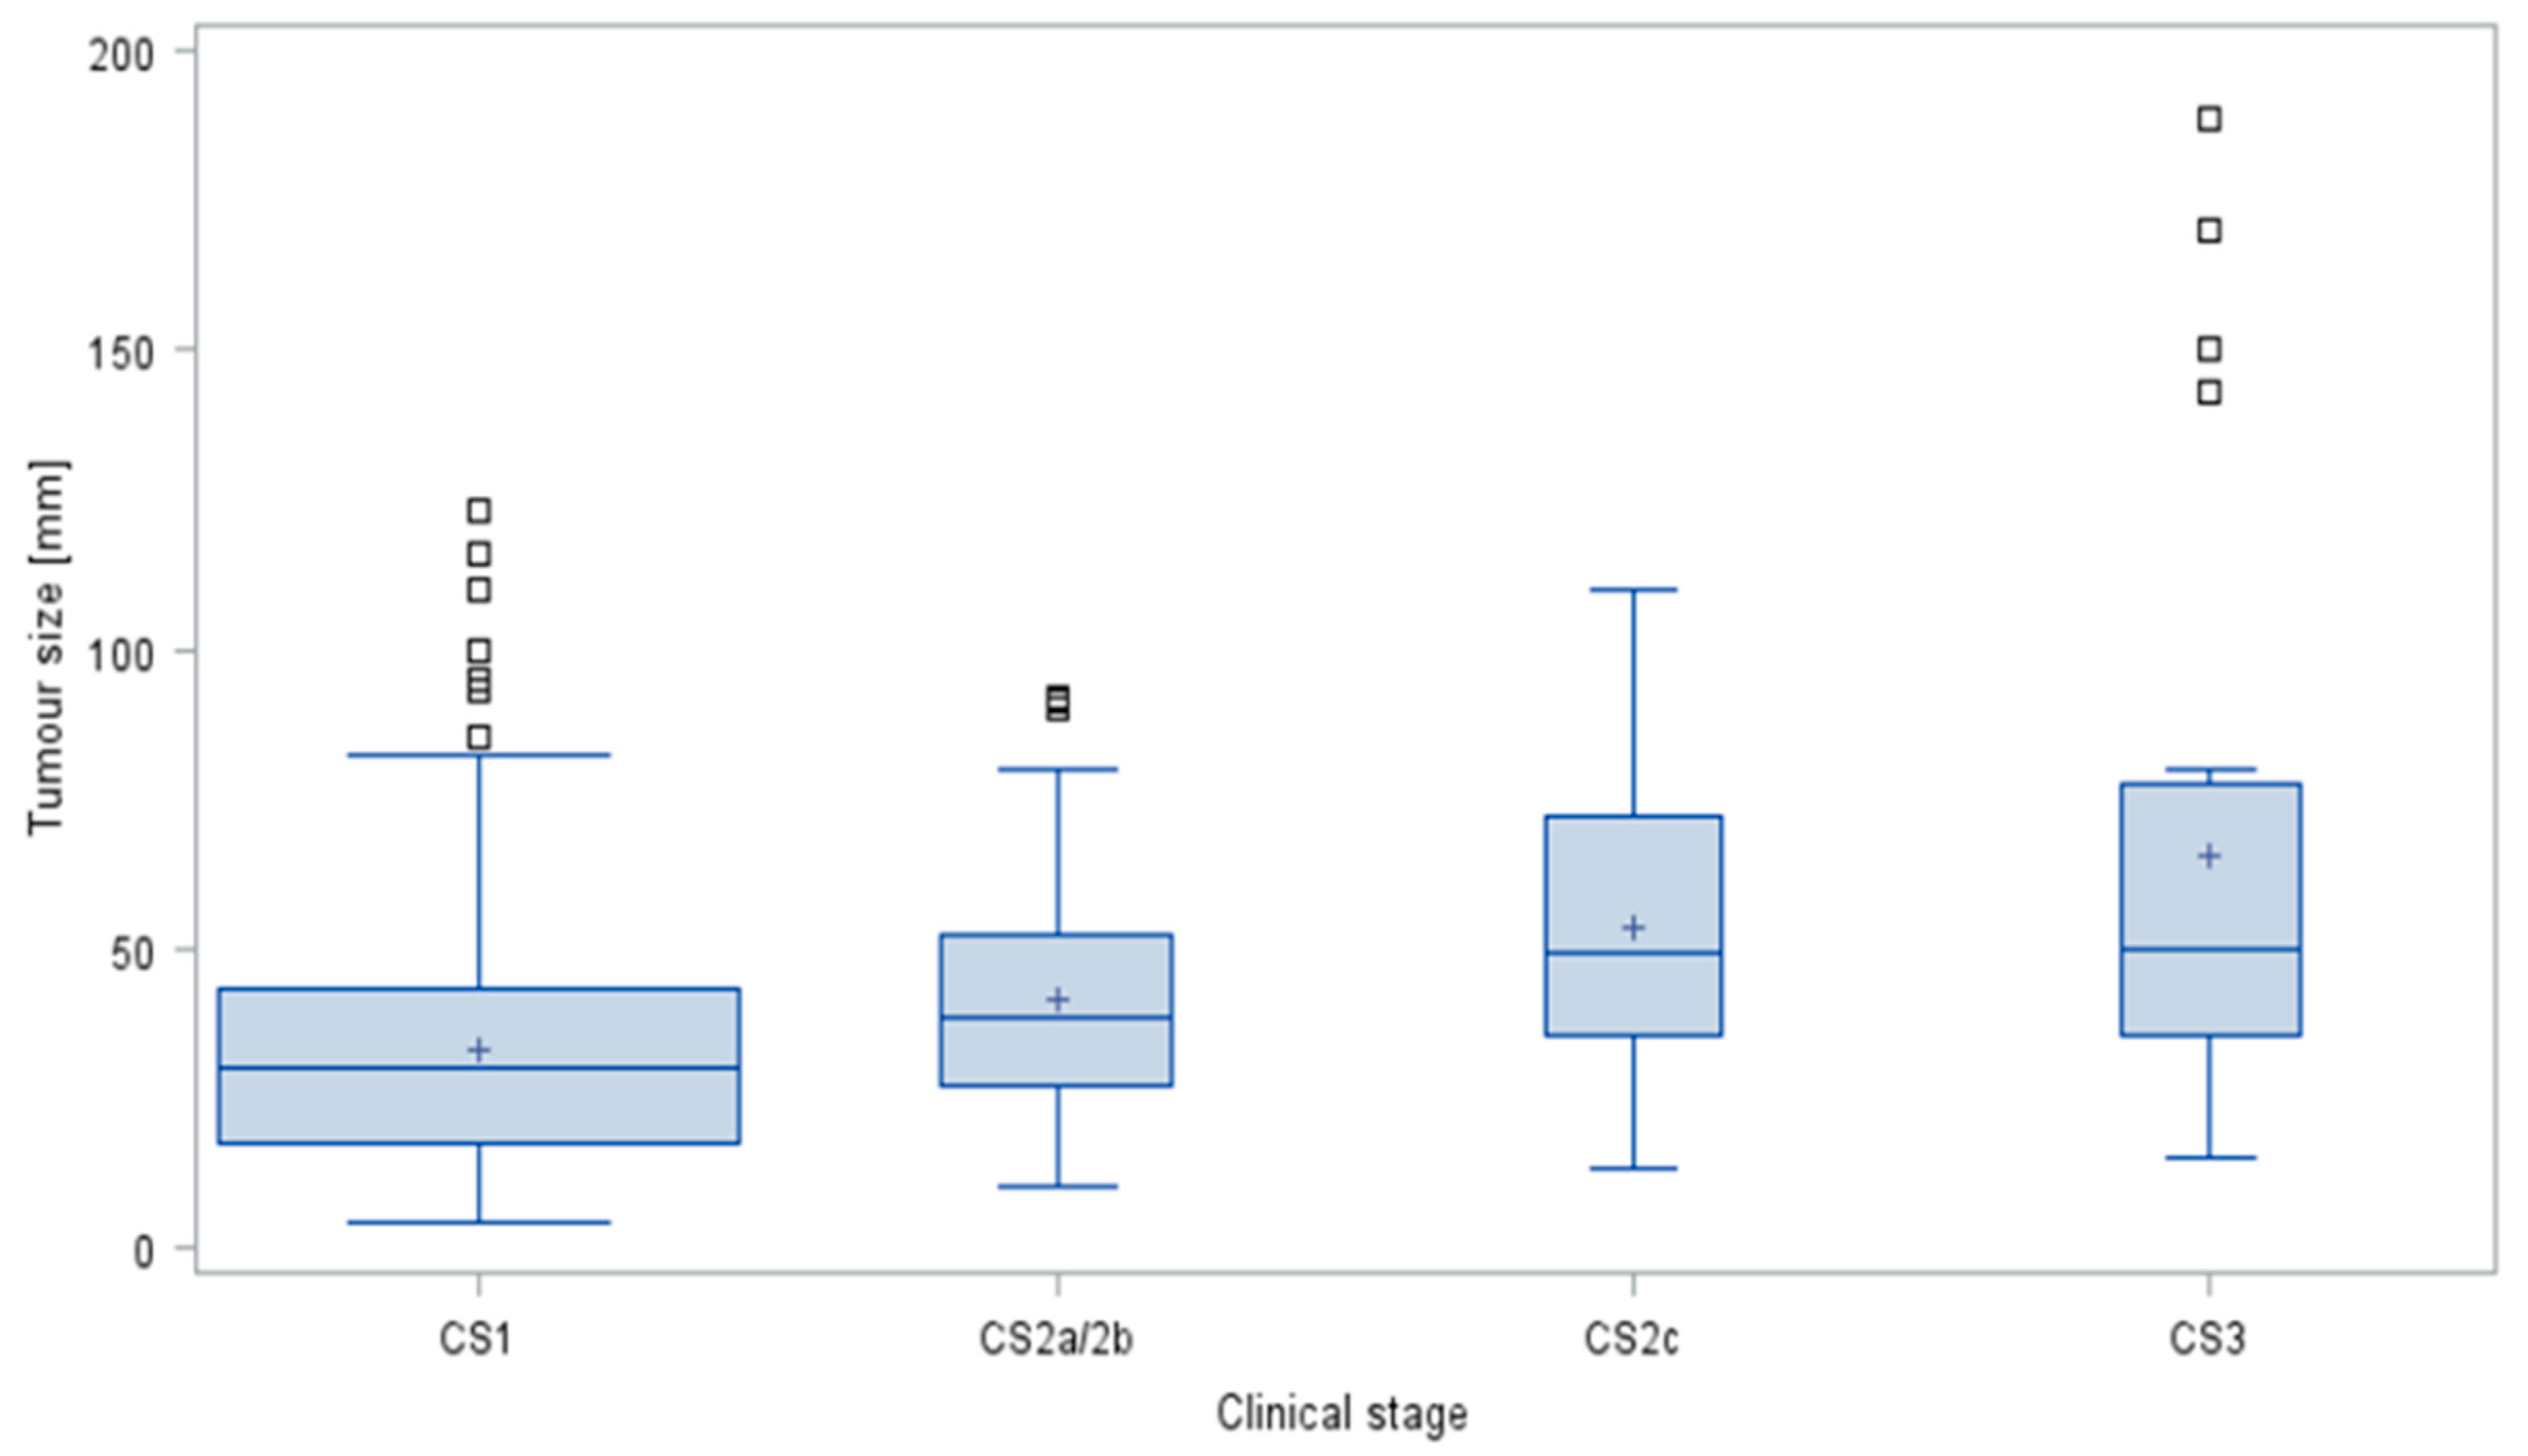
| Mean | 32.6 | 41.2 | 53.2 | 65.5 |
| Std Dev | 20 | 19.5 | 30.1 | 48.3 |
| Min | 4 | 10 | 13 | 15 |
| Q1 | 17 | 27 | 35 | 35.5 |
| Median | 30 | 38 | 49 | 50 |
| Q3 | 43 | 52 | 72 | 77.5 |
| Max | 123 | 92 | 110 | 189 |
| n | 421 | 84 | 15 | 24 |
| bHCG | AFP | LDH | AFP/bHCG | M371 | |
|---|---|---|---|---|---|
| n/N | n/N | n/N | n/N | n/N | |
| ≤10 mm | 6/87 (6.90%) | 2/87 (2.30%) | 3/87 (3.45%) | 8/87 (9.20%) | 16/75 (21.33%) |
| >10 mm | 202/553 (36.53%) | 116/553 (20.98%) | 122/546 (22.34%) | 241/553 (43.58%) | 309/375 (82.40%) |
| p-value * | <0.0001 | <0.0001 | <0.0001 | <0.0001 | <0.0001 |
| bHCG | AFP | LDH | AFP/bHCG | M371 | |
|---|---|---|---|---|---|
| n/N | n/N | n/N | n/N | n/N | |
| ≤10 mm | 5/43 (11.63%) | 1/43 (2.33%) | 3/43 (6.98%) | 6/43 (13.95%) | 15/34 (44.12%) |
| >10 mm | 299/500 (59.80%) | 115/500 (23.00%) | 119/493 (24.14%) | 239/500 (47.80%) | 302/335 (90.15%) |
| p-value * | 0.0002 | 0.0015 | 0.0101 | <0.0001 | <0.0001 |
| bHCG | AFP | LDH | AFP/ bHCG | M371 | |
|---|---|---|---|---|---|
| n/N | n/N | n/N | n/N | n/N | |
| ≤10 mm | 4/42 (9.52%) | 1/42 (2.38%) | 3/42 (7.14%) | 5/42 (11.90%) | 15/34 (44.12%) |
| >10 mm | 132/378 (34.92%) | 70/378 (18.52%) | 63/375 (16.80%) | 158/378 (41.80%) | 240/273 (87.91%) |
| p-value * | 0.0008 | 0.0081 | 0.1039 | 0.0002 | <0.0001 |
| bHCG | AFP | LDH | AFP/bHCG | M371 | |
|---|---|---|---|---|---|
| n/N | n/N | n/N | n/N | n/N | |
| Total population | |||||
| ≤10 mm (n = 87) | 6/87 (6.90%) | 2/87 (2.30%) | 3/87 (3.45%) | 8/87 (9.20%) | 16/75 (21.33%) |
| 11–20 mm (n = 141) | 23/141 (16.31%) | 14 /141 (9.93%) | 12/140 (8.57%) | 30/141 (21.28%) | 66/107 (61.68%) |
| 21–30 mm (n = 123) | 47/122 (30.33%) | 21/122 (17.21%) | 15/121 (12.39%) | 43/122 (35.25%) | 67/81 (82.72%) |
| 31–50 mm (n = 179) | 76/179 (42.46%) | 52 /179 (29.05%) | 45/176 (25.57%) | 93/179 (51.96%) | 107/114 (93.86%) |
| >50 mm (n = 111) | 66/111 (59.46%) | 29/111 (26.13%) | 50/109 (45.87%) | 75/111 (67.57%) | 69/73 (94.52%) |
| p-value * | <0.0001 | <0.0001 | <0.0001 | <0.0001 | <0.0001 |
| Seminoma | |||||
| ≤10 mm | 2/35 (5.71%) | 1/35 (2.86%) | 3/35 (8.57%) | 3/35 (8.57%) | 11/28 (39.29%) |
| 11–20 mm (n = 73) | 8/73 (10.96%) | 3/73 (4.11%) | 8/72 (11.11%) | 11/73 (15.07%) | 36/53 (67.92%) |
| 21–30 mm (n = 84) | 18/83 (21.69%) | 5/83 (6.02%) | 9/83 (10.84%) | 22/83 (26.51%) | 48/56 (85.71%) |
| 31–50 mm (n = 107) | 35/107 (32.71%) | 8/107 (7.48%) | 27/106 (25.47%) | 41/107 (38.32%) | 74/77 (96.10%) |
| >50 mm (n = 66) | 43/66 (65.15%) | 2/66 (3.03%) | 35/66 (53.03%) | 45/66 (68.18%) | 46/46 (100%) |
| p-value * | <0.0001 | 0.9133 | <0.0001 | <0.0001 | <0.0001 |
| Nonseminoma | |||||
| ≤10 mm (n = 8) | 3/8/37.50%) | 0/8 (0.00%) | 0/8 (0.00%) | 3/8 (37.50%) | 4/6 (66.67%) |
| 11–20 mm (n = 41) | 14/41 (34.15%) | 10/41 (24.39%) | 3/41 (7.32%) | 17/41 (41.46%) | 27/29 (93.10%) |
| 21–30 mm (n = 32) | 19/32 (59.38%) | 16/32 (50.00%) | 6/31 (19.35%) | 21/32 (65.63%) | 19/20 (95.00%) |
| 31–50 mm (n = 64) | 41/64 (64.06%) | 44/64 (68.75%) | 17/62 (27.42%) | 52/64 (81.25%) | 32/34 (94.12%) |
| >50 mm (n = 34) | 23/34 (67.65%) | 27/34 (79.41%) | 14/32 (43.75%) | 30/34 (88.24%) | 20/20 (100%) |
| p-value * | 0.0022 | <0.0001 | <0.0001 | <0.0001 | 0.0745 |
| Age Categories (years) | Tumour Size (mm) | p * | ||||
|---|---|---|---|---|---|---|
| Min | Q1 | Median | Q3 | Max | ||
| ≤30 | 3 | 18 | 32 | 50 | 189 | 0.0117 |
| 31–40 | 4 | 15 | 28 | 43 | 95 | |
| 41–50 | 4 | 14 | 24 | 40 | 110 | |
| >50 | 3 | 15 | 35 | 53 | 170 | |
| Age Categories (years) | Tumour Size (mm) | p * | ||||
|---|---|---|---|---|---|---|
| Min | Q1 | Median | Q3 | Max | ||
| ≤30 | 6 | 24 | 35 | 50 | 189 | 0.0161 |
| 31–40 | 4 | 20 | 30 | 45 | 95 | |
| 41–50 | 4 | 15 | 27 | 42 | 110 | |
| >50 | 7 | 19 | 36.5 | 53 | 170 | |
| Patients | Cutoff | AUC | 95% CI | Sensitivity | Specificity | ||
|---|---|---|---|---|---|---|---|
| First Author [#] | Year | (n) | (mm) | (%) | (%) | ||
| Shilo [37] | 2012 | 11 | 18.5 | 0.902 | 87 | 83 | |
| Paffenholz [23] | 2018 | 28 | 14 | 0.896 | 83 | 89 | |
| Gentile [7] | 2019 | 108 | 8.5 | 0.75 | 0.63; 0.86 | 81 | 58 |
| Staudacher [44] | 2020 | 60 | 13.5 | 0.726 | 0.623; 0.828 | 55 | 85 |
| Schwen [31] | 2021 | 22 | 10 | 0.60 | 31.8 | 88.7 | |
| Gobbo [41] | 2022 | 56 | 10 | 0.59 | 0.43; 0.75 | 25 | 92.9 |
| Del Real [45] | 2022 | 22 | 18.3 | 0.753 | 83 | 74 | |
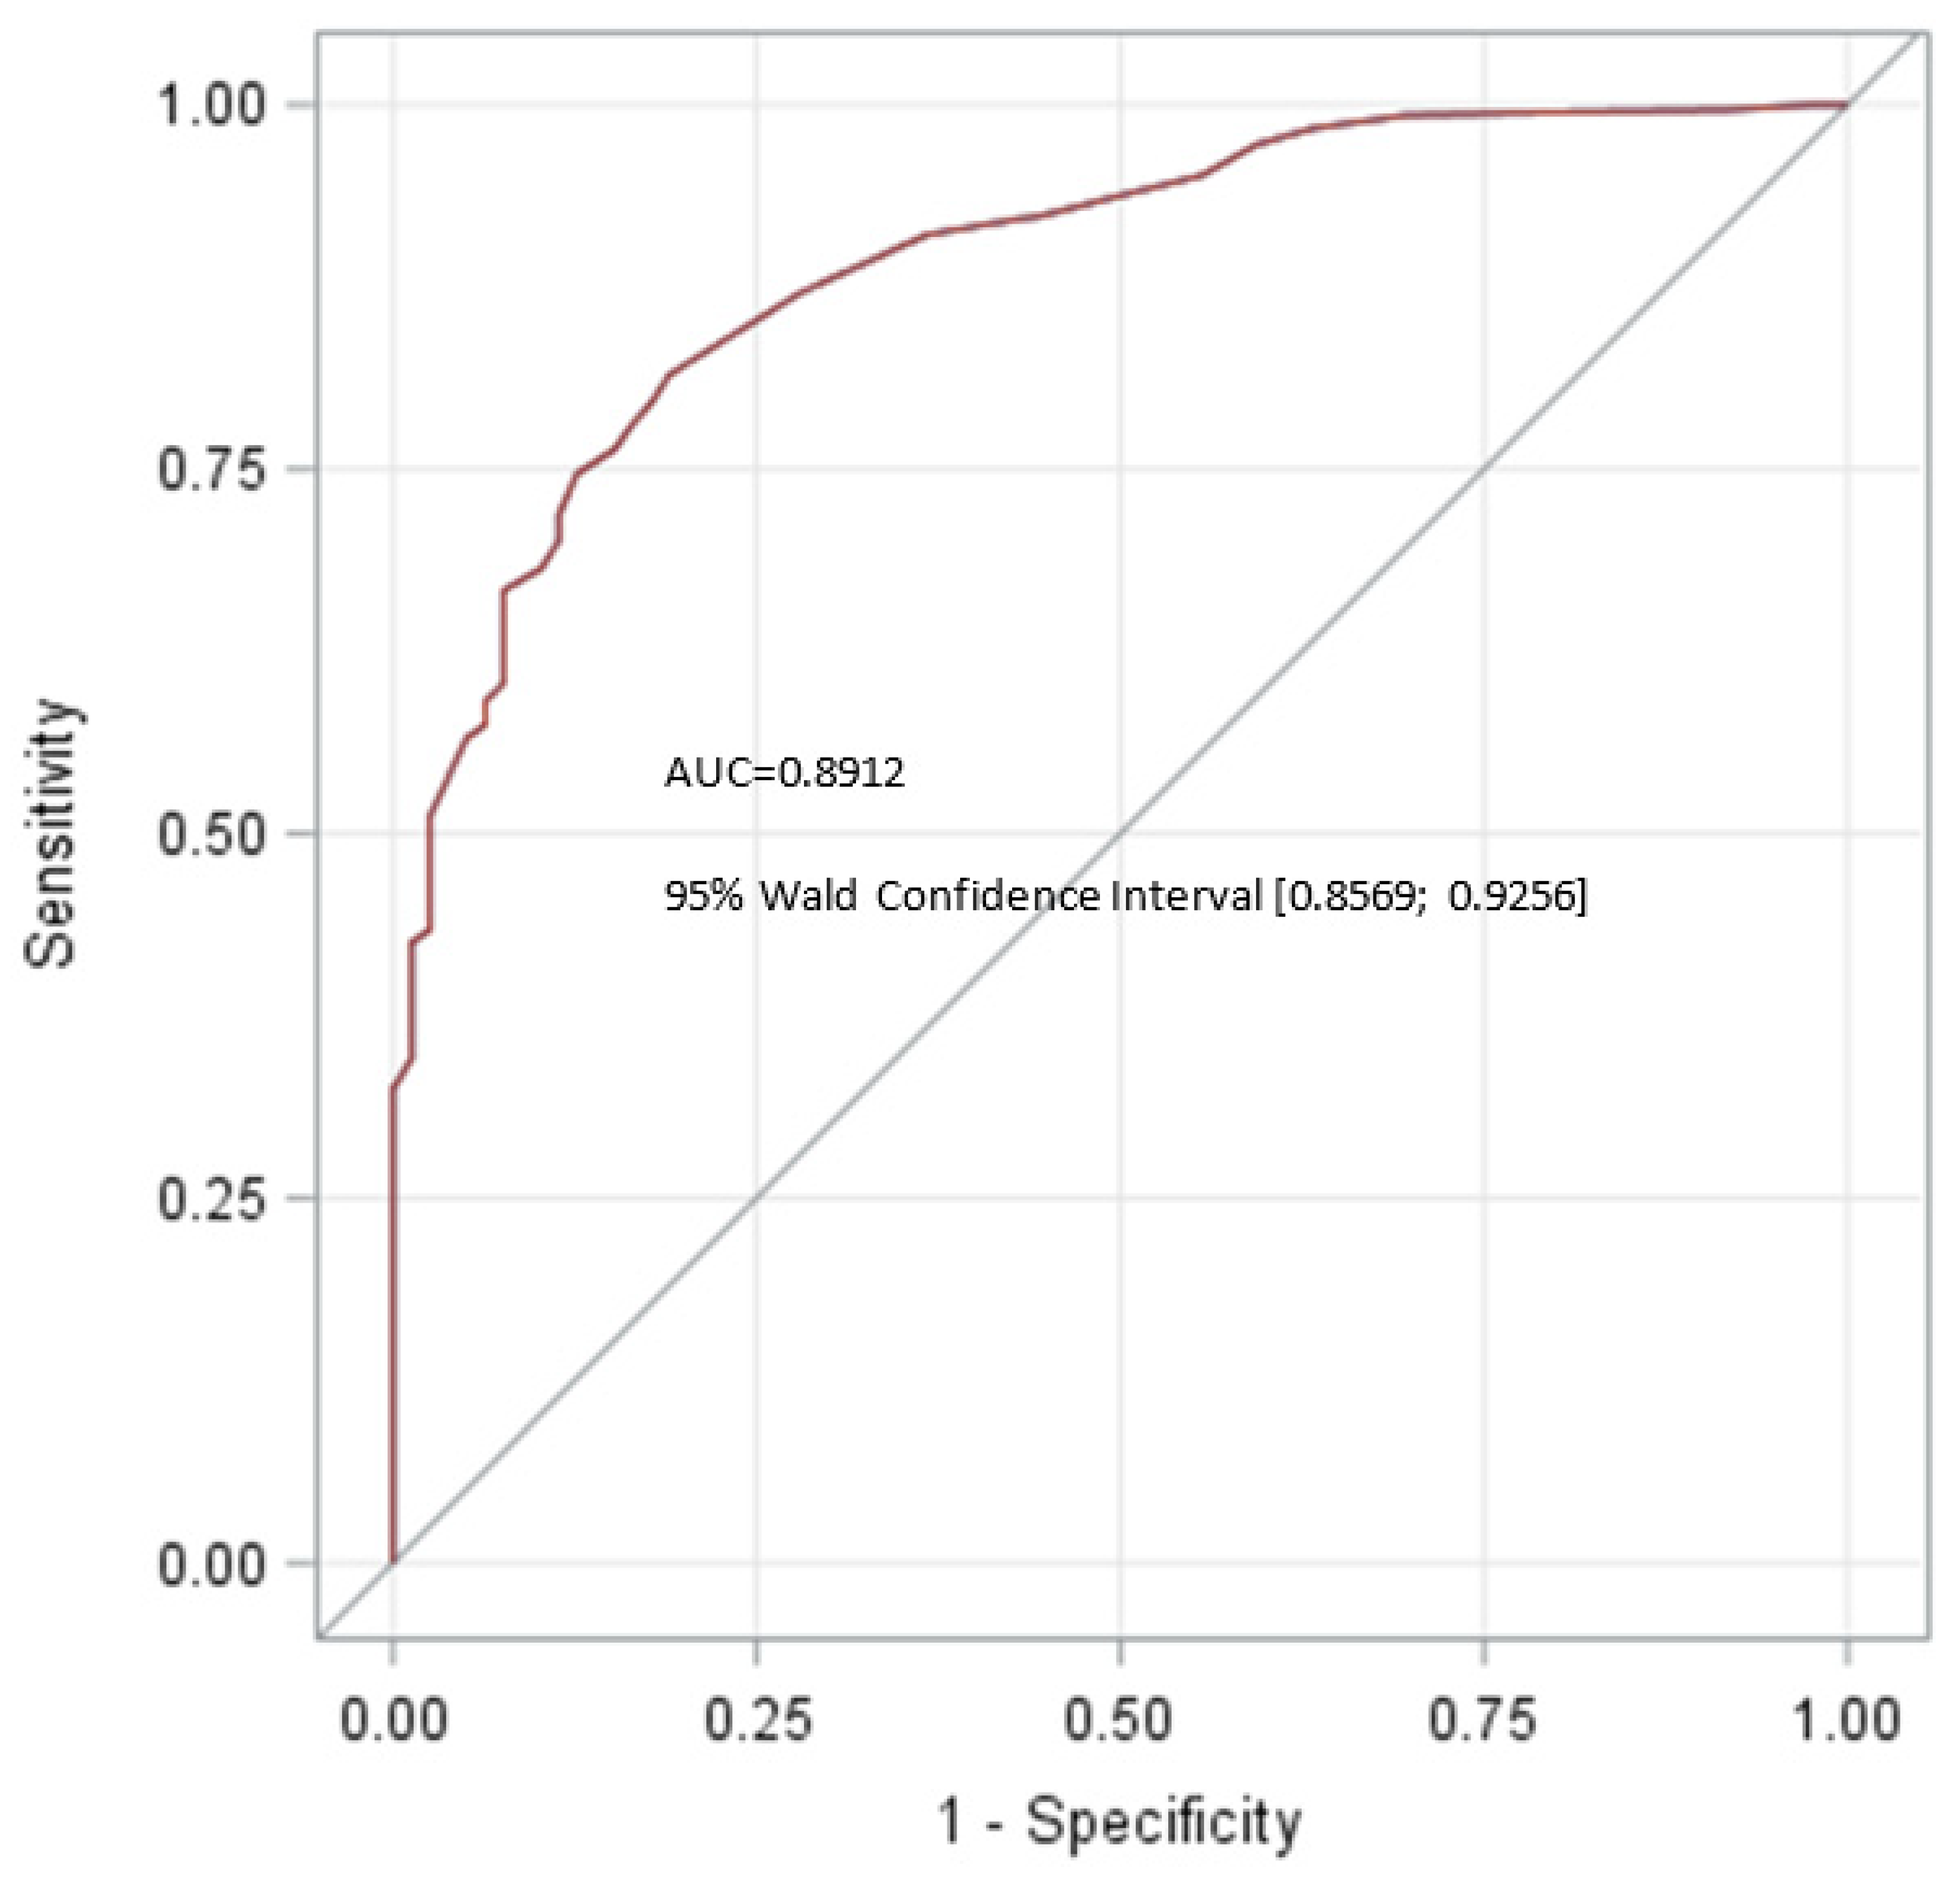
| Present study | 2022 | 79 | 16 | 0.8912 | 0.8569; 0.9256 | 81.5 | 81.0 |
Publisher’s Note: MDPI stays neutral with regard to jurisdictional claims in published maps and institutional affiliations. |
© 2022 by the authors. Licensee MDPI, Basel, Switzerland. This article is an open access article distributed under the terms and conditions of the Creative Commons Attribution (CC BY) license (https://creativecommons.org/licenses/by/4.0/).
Share and Cite
Dieckmann, K.-P.; Isbarn, H.; Grobelny, F.; Dumlupinar, C.; Utschig, J.; Wülfing, C.; Pichlmeier, U.; Belge, G. Testicular Neoplasms: Primary Tumour Size Is Closely Interrelated with Histology, Clinical Staging, and Tumour Marker Expression Rates—A Comprehensive Statistical Analysis. Cancers 2022, 14, 5447. https://doi.org/10.3390/cancers14215447
Dieckmann K-P, Isbarn H, Grobelny F, Dumlupinar C, Utschig J, Wülfing C, Pichlmeier U, Belge G. Testicular Neoplasms: Primary Tumour Size Is Closely Interrelated with Histology, Clinical Staging, and Tumour Marker Expression Rates—A Comprehensive Statistical Analysis. Cancers. 2022; 14(21):5447. https://doi.org/10.3390/cancers14215447
Chicago/Turabian StyleDieckmann, Klaus-Peter, Hendrik Isbarn, Francesca Grobelny, Cansu Dumlupinar, Julia Utschig, Christian Wülfing, Uwe Pichlmeier, and Gazanfer Belge. 2022. "Testicular Neoplasms: Primary Tumour Size Is Closely Interrelated with Histology, Clinical Staging, and Tumour Marker Expression Rates—A Comprehensive Statistical Analysis" Cancers 14, no. 21: 5447. https://doi.org/10.3390/cancers14215447
APA StyleDieckmann, K.-P., Isbarn, H., Grobelny, F., Dumlupinar, C., Utschig, J., Wülfing, C., Pichlmeier, U., & Belge, G. (2022). Testicular Neoplasms: Primary Tumour Size Is Closely Interrelated with Histology, Clinical Staging, and Tumour Marker Expression Rates—A Comprehensive Statistical Analysis. Cancers, 14(21), 5447. https://doi.org/10.3390/cancers14215447