Radiomic Signatures Derived from Hybrid Contrast-Enhanced Ultrasound Images (CEUS) for the Assessment of Histological Characteristics of Breast Cancer: A Pilot Study
Abstract
Simple Summary
Abstract
1. Introduction
2. Materials and Methods
2.1. Study Design and Population
2.2. Image Acquisition
2.3. Image Processing
2.4. Reference Standard
2.5. Texture Analysis (TA)
2.5.1. Image Pre-Processing and Segmentation
2.5.2. Feature Extraction
2.5.3. Feature Selection
2.5.4. Class Prediction
3. Results
4. Discussion
5. Conclusions
Author Contributions
Funding
Institutional Review Board Statement
Informed Consent Statement
Data Availability Statement
Acknowledgments
Conflicts of Interest
References
- Vraka, I.; Panourgias, E.; Sifakis, E.; Koureas, A.; Galanis, P.; Dellaportas, D.; Gouliamos, A.; Antoniou, A. Correlation between contrast-enhanced ultrasound characteristics (qualitative and quantitative) and pathological prognostic factors in breast cancer. In Vivo 2018, 32, 945–954. [Google Scholar] [CrossRef] [PubMed]
- Esfehani, M.H.; Yazdankhah-kenari, A.; Omranipour, R. Validation of Contrast Enhanced Ultrasound Technique to Wire Localization of Sentinel Lymph Node in Patients with Early Breast Cancer. Indian J. Surg. Oncol. 2015, 6, 370–373. [Google Scholar] [CrossRef] [PubMed]
- Jia, K.; Li, L.; Wu, X.J.; Hao, M.J.; Xue, H.Y. Contrast-enhanced ultrasound for evaluating the pathologic response of breast cancer to neoadjuvant chemotherapy: A meta-analysis. Medicine 2019, 98, 14258. [Google Scholar] [CrossRef]
- Boca, I.; Ciurea, A.I.; Ciortea, C.A.; Ștefan, P.A.; Lisencu, L.A.; Dudea, S.M. Differentiating breast tumors from background parenchymal enhancement at contrast-enhanced mammography: The role of radiomics—A pilot reader study. Diagnostics 2021, 11, 1248. [Google Scholar] [CrossRef]
- Lupean, R.-A.; Ștefan, P.-A.; Csutak, C.; Lebovici, A.; Măluțan, A.; Buiga, R.; Melincovici, C.; Mihu, C. Differentiation of endometriomas from ovarian hemorrhagic cysts at magnetic resonance: The role of texture analysis. Medicina 2020, 56, 487. [Google Scholar] [CrossRef] [PubMed]
- Gillies, R.J.; Kinahan, P.E.; Hricak, H. Radiomics: Images are more than pictures, they are data. Radiology 2016, 278, 563–577. [Google Scholar] [CrossRef] [PubMed]
- Ștefan, P.-A.; Lupean, R.-A.; Mihu, C.M.; Lebovici, A.; Oancea, M.D.; Hîțu, L.; Duma, D.; Csutak, C. Ultrasonography in the diagnosis of adnexal lesions: The role of texture analysis. Diagnostics 2021, 11, 812. [Google Scholar] [CrossRef] [PubMed]
- Pinker, K.; Chin, J.; Melsaether, A.N.; Morris, E.A.; Moy, L. Precision medicine and radiogenomics in breast cancer: New approaches toward diagnosis and treatment. Radiology 2018, 287, 732–747. [Google Scholar] [CrossRef]
- Fan, M.; Zhang, P.; Wang, Y.; Peng, W.; Wang, S.; Gao, X.; Xu, M.; Li, L. Radiomic analysis of imaging heterogeneity in tumours and the surrounding parenchyma based on unsupervised decomposition of DCE-MRI for predicting molecular subtypes of breast cancer. Eur. Radiol. 2019, 29, 4456–4467. [Google Scholar] [CrossRef]
- Li, W.; Yu, K.; Feng, C.; Zhao, D. Molecular Subtypes Recognition of Breast Cancer in Dynamic Contrast-Enhanced Breast Magnetic Resonance Imaging Phenotypes from Radiomics Data. Comput. Math Methods Med. 2019, 2019, 6978650. [Google Scholar] [CrossRef]
- Wu, L.; Zhao, Y.; Lin, P.; Qin, H.; Liu, Y.; Wan, D.; Li, X.; He, Y.; Yang, H. Preoperative ultrasound radiomics analysis for expression of multiple molecular biomarkers in mass type of breast ductal carcinoma in situ. BMC Med. Imaging. 2021, 21, 84. [Google Scholar] [CrossRef] [PubMed]
- Shan, Y.N.; Xu, W.; Wang, R.; Wang, W.; Pang, P.P.; Shen, Q.J. A Nomogram Combined Radiomics and Kinetic Curve Pattern as Imaging Biomarker for Detecting Metastatic Axillary Lymph Node in Invasive Breast Cancer. Front. Oncol. 2020, 10, 1643. [Google Scholar] [CrossRef] [PubMed]
- Luo, W.Q.; Huang, Q.X.; Huang, X.W.; Hu, H.T.; Zeng, F.Q.; Wang, W. Predicting Breast Cancer in Breast Imaging Reporting and Data System (BI-RADS) Ultrasound Category 4 or 5 Lesions: A Nomogram Combining Radiomics and BI-RADS. Sci. Rep. 2019, 9, 11921. [Google Scholar] [CrossRef]
- Wang, Z.; Lin, F.; Ma, H.; Shi, Y.; Dong, J.; Yang, P.; Zhang, K.; Guo, N.; Zhang, R.; Cui, J.; et al. Contrast-Enhanced Spectral Mammography-Based Radiomics Nomogram for the Prediction of Neoadjuvant Chemotherapy-Insensitive Breast Cancers. Front. Oncol. 2021, 11, 605230. [Google Scholar] [CrossRef] [PubMed]
- Leithner, D.; Bernard-Davila, B.; Martinez, D.F.; Horvat, J.V.; Jochelson, M.S.; Marino, M.A.; Avendano, D.; Ochoa-Albiztegui, R.E.; Sutton, E.J.; Morris, E.A.; et al. Radiomic Signatures Derived from Diffusion-Weighted Imaging for the Assessment of Breast Cancer Receptor Status and Molecular Subtypes. Mol. Imaging Biol. 2020, 22, 453–461. [Google Scholar] [CrossRef]
- Zhang, Y.; Liu, F.; Zhang, H.; Ma, H.; Sun, J.; Zhang, R.; Song, L.; Shi, H. Diagnostic Value of Radiomics Analysis in Contrast-Enhanced Spectral Mammography for Identifying Triple-Negative Breast Cancer. Front. Oncol. 2021, 11, 773196. [Google Scholar] [CrossRef]
- Wang, X.-Y.; Hu, Q.; Fang, M.-Y.; He, Y.; Wei, H.-M.; Chen, X.-X.; Zhang, B. The correlation between HER-2 expression and the CEUS and ARFI characteristics of breast cancer. PLoS ONE 2017, 12, e0178692. [Google Scholar] [CrossRef] [PubMed][Green Version]
- Mayerhoefer, M.E.; Breitenseher, M.; Amann, G.; Dominkus, M. Are signal intensity and homogeneity useful parameters for distinguishing between benign and malignant soft tissue masses on MR images? Objective evaluation by means of texture analysis. Magn. Reson. Imaging 2008, 26, 1316–1322. [Google Scholar] [CrossRef]
- Yadav, A.K.; Roy, R. Wavelet Based Texture Analysis for Medical Images. Int. J. Adv. Res. Electr. Electron. Instrum. Eng. 2015, 4, 3958–3963. [Google Scholar]
- Materka, A. Texture analysis methodologies for magnetic resonance imaging. Dialogues Clin. Neurosci. 2004, 6, 243–250. [Google Scholar] [CrossRef]
- Cao, X.-L.; Bao, W.; Zhu, S.-G.; Wang, L.-H.; Sun, M.-H.; Men, Y.-M.; Xue, J. Contrast-enhanced ultrasound characteristics of breast cancer: Correlation with prognostic factors. Ultrasound Med. Biol. 2014, 40, 11–17. [Google Scholar] [CrossRef] [PubMed]
- Li, C.; Gong, H.; Ling, L.; Du, L.; Su, T.; Wang, S.; Wang, J. Diagnostic performance of contrast-enhanced ultrasound and enhanced magnetic resonance for breast nodules. J. Biomed. Res. 2018, 32, 198–207. [Google Scholar] [PubMed]
- La Forgia, D.; Fanizzi, A.; Campobasso, F.; Bellotti, R.; Didonna, V.; Lorusso, V.; Moschetta, M.; Massafra, R.; Tamborra, P.; Tangaro, S.; et al. Radiomic Analysis in Contrast-Enhanced Spectral Mammography for Predicting Breast Cancer Histological Outcome. Diagnostics 2020, 10, 708. [Google Scholar] [CrossRef] [PubMed]
- Huang, Y.Q.; Liang, H.Y.; Yang, Z.X.; Ding, Y.; Zeng, M.S.; Rao, S.X. Value of MR histogram analyses for prediction of microvascular invasion of hepatocellular carcinoma. Medicine 2016, 95, e4034. [Google Scholar] [CrossRef] [PubMed]
- Zhao, L.-X.; Liu, H.; Wei, Q.; Xu, G.; Wu, J.; Xu, H.-X.; Wu, R.; Pu, H. Contrast-enhanced ultrasonography features of breast malignancies with different sizes: Correlation with prognostic factors. BioMed Res. Int. 2015, 2015, 613831. [Google Scholar] [CrossRef] [PubMed]
- Zhao, Y.X.; Liu, S.; Hu, Y.B.; Ge, Y.Y.; Lv, D.M. Diagnostic and prognostic values of contrast-enhanced ultrasound in breast cancer: A retrospective study. Onco Targets Ther. 2017, 10, 1123–1129. [Google Scholar] [CrossRef] [PubMed]
- Putti, T.C.; El-Rehim, D.M.A.; Rakha, E.; Paish, C.E.; Lee, A.H.; Pinder, S.E.; Ellis, I. Estrogen receptor-negative breast carcinomas: A review of morphology and immunophenotypical analysis. Mod. Pathol. 2005, 18, 26–35. [Google Scholar] [CrossRef]
- Wan, C.F.; Du, J.; Fang, H.; Li, F.H.; Zhu, J.S.; Liu, Q. Enhancement Patterns and Parameters of Breast Cancers at contrast-enhanced US: Correlation with prognostic factors. Radiology 2012, 262, 450–459. [Google Scholar] [CrossRef]
- Mu, K.; Li, L.; Yang, Q.; Yun, H.; Kharaziha, P.; Ye, D.-W.; Auer, G.; Lagercrantz, S.B.; Zetterberg, A. A standardized method for quantifying proliferation by Ki-67 and cyclin A immunohistochemistry in breast cancer. Ann. Diagn. Pathol. 2015, 19, 243–248. [Google Scholar] [CrossRef]
- Demircioglu, A.; Grueneisen, J.; Ingenwerth, M.; Hoffmann, O.; Pinker-Domenig, K.; Morris, E.; Haubold, J.; Forsting, M.; Nensa, F.; Umutlu, L. A rapid volume of interest-based approach of radiomics analysis of breast MRI for tumor decoding and phenotyping of breast cancer. PLoS ONE. 2020, 15, e0234871. [Google Scholar] [CrossRef]
- Marino, M.A.; Leithner, D.; Sung, J.; Avendano, D.; Morris, E.A.; Pinker, K.; Jochelson, M.S. Radiomics for tumor characterization in breast cancer patients: A feasibility study comparing contrast-enhanced mammography and magnetic resonance imaging. Diagnostics 2020, 10, 492. [Google Scholar] [CrossRef] [PubMed]
- Bhooshan, N.; Giger, M.L.; Jansen, S.A.; Li, H.; Lan, L.; Newstead, G.M. Cancerous breast lesions on dynamic contrast-enhanced MR images: Computerized characterization for image-based prognostic markers. Radiology 2010, 254, 680–690. [Google Scholar] [CrossRef] [PubMed]


| Radiomics Features | Computation Method | Computational Variations | Class |
|---|---|---|---|
| Perc.01–99%, Skewness, Kurtosis, Variance, Mean | - | - | Histogram |
| GLevNonU, LngREmph, RLNonUni, ShrtREmp, Fraction | 6 bits/pixel | 4 directions | RLM |
| Teta 1–4, Sigma | - | - | ARM |
| InvDfMom, SumAverg, SumVarnc, SumEntrp, Entropy, DifVarnc, DifEntrp, AngScMom, Contrast, Correlat, SumOfSqs | 6 bits/pixel; 5 between-pixel distances | 4 directions | COM |
| WavEn | 5 scales | 4 frequency bands | WT |
| GrNonZeros, percentage of pixels with nonzero gradient, GrMean, GrVariance, GrSkewness, GrKurtosis | 4 bits/pixel | - | AR |
| Patients’ Characteristics | Number | Frequency (%) |
|---|---|---|
| Mean age, years (range) | 56.5 (29–83) | |
| Mean lesion size, mm (range) | 24.07 (7–60) | |
| Pathological Type | ||
| DCIS | 1 | 1.38 |
| DCIS + Borderline phyllodes | 1 | 1.38 |
| IDC NST | 63 | 87.56 |
| IDC with mucinous components | 1 | 1.38 |
| Tubular carcinoma | 1 | 1.38 |
| Papillary carcinoma | 2 | 2.77 |
| Malignant phyllodes | 1 | 1.38 |
| ILC | 2 | 2.77 |
| Nottingham grade | ||
| I | 11 | 15.28 |
| II | 39 | 54.17 |
| III | 22 | 30.55 |
| Estrogen receptor status | ||
| Negative | 13 | 18.05 |
| Positive | 59 | 81.95 |
| Progesterone receptor status | ||
| Negative | 34 | 40.27 |
| Positive | 38 | 59.73 |
| Her2 status | ||
| Negative | 59 | 81.94 |
| Positive | 13 | 18.06 |
| Ki-67 | ||
| <20% | 35 | 48.61 |
| ≥20% | 37 | 51.39 |
| Luminal subtype | ||
| A | 29 | 40.27. |
| B | 30 | 41.66 |
| HER2+ | 6 | 8.33 |
| Triple-negative | 7 | 9.74 |
| Nottingham I vs. Nottingham II + III | ||||||
| Texture Parameters | F | p-Value | Nottingham I | Nottingham II + III | ||
| Median | IQR | Median | IQR | |||
| RATeta3 | 0.3089 | 0.2832 | 0.49 | 0.43–0.56 | 0.51 | 0.46–0.57 |
| RATeta4 | 0.2881 | 0.3289 | 0.16 | 0.12–0.17 | 0.14 | 0.12–0.16 |
| RCV4D6DifVarnc | 0.2458 | 0.2293 | 6.53 | 3.37–7.71 | 7.04 | 5.51–7.98 |
| RCV3D6DifVarnc | 0.2428 | 0.321 | 5.15 | 2.80–6 | 5.45 | 4.42–6.07 |
| RCV5D6DifVarnc | 0.238 | 0.2356 | 7.43 | 3.77–9.16 | 8.39 | 6.18–9.69 |
| RCV2D6DifVarnc | 0.2191 | 0.4151 | 3.45 | 2–3.91 | 3.52 | 2.89–3.91 |
| RWavEnHH_s-4 | 0.2097 | 0.1532 | 6.44 | 4.18–10.63 | 9.67 | 6.40–13.32 |
| RATeta2 | 0.2073 | 0.3132 | −0.58 | −0.64–−0.48 | −0.59 | −0.64–−0.55 |
| RCZ3D6DifVarnc | 0.2029 | 0.3535 | 6.52 | 3.23–7.06 | 6.47 | 5.34–7.42 |
| RCN2D6DifVarnc | 0.2006 | 0.4244 | 3.71 | 2.24–4.75 | 4.07 | 3.31–4.71 |
| ER Negative vs. ER Positive | ||||||
| Texture Parameters | F | p-Value | ER Negative | ER Positive | ||
| Median | IQR | Median | IQR | |||
| RWavEnLH_s-4 | 0.4951 | 0.0181 | 39.44 | 34.77–51.97 | 31.64 | 18.5–44.76 |
| RWavEnHL_s-4 | 0.3413 | 0.0854 | 26.66 | 17.677–31.83 | 18.34 | 11.67–27.36 |
| RATeta1 | 0.3017 | 0.1535 | 0.93 | 0.92–0.94 | 0.93 | 0.91–0.93 |
| RWavEnLL_s-6 | 0.2874 | 0.1665 | 1511.37 | 1024.61–2972.41 | 1168.38 | 711.04–1775.91 |
| RWavEnLL_s-5 | 0.2851 | 0.1901 | 1347.99 | 1034.33–3232.67 | 1137.51 | 703.89–1882.82 |
| RWavEnHL_s-6 | 0.2467 | 0.1535 | 25.66 | 14.75–46.63 | 16.93 | 12.07–30.72 |
| RPerc10 | 0.2042 | 0.1141 | 15 | 7.5–25.75 | 10 | 3–15.75 |
| RWavEnLL_s-4 | 0.1957 | 0.2627 | 1193.40 | 889.87–3281.36 | 1108 | 688.71–1738.54 |
| RPerc50 | 0.1926 | 0.2951 | 25 | 21.5–53.25 | 24 | 18.25–35 |
| RWavEnLL_s-3 | 0.1771 | 0.3758 | 1238.59 | 744.08–3315.79 | 1019.02 | 676.08–1729.19 |
| PR Negative vs. PR Positive | ||||||
| Texture Parameters | F | p-Value | PR Negative | PR Positive | ||
| Median | IQR | Median | IQR | |||
| RPerc01 | 0.3341 | 0.0108 | 7 | 2–12 | 2 | 2–7 |
| RPerc10 | 0.325 | 0.0352 | 13.5 | 6–20 | 8.5 | 2–16 |
| RWavEnLH_s-4 | 0.2964 | 0.0195 | 36.66 | 27.74–48.28 | 28.88 | 17.57–38.36 |
| RWavEnLL_s-5 | 0.2809 | 0.1117 | 1408.29 | 773.71–2509.74 | 1125.22 | 617.94–1697.62 |
| RWavEnLL_s-4 | 0.2634 | 0.1307 | 1257.85 | 729.63–2883.87 | 1039.67 | 533.92–1671.16 |
| RPerc50 | 0.2541 | 0.1181 | 25 | 21–43 | 23.5 | 15–33 |
| RWavEnLL_s-3 | 0.2473 | 0.152 | 1324.88 | 715.54–2705.42 | 1008.67 | 537.07–1652.83 |
| RWavEnLL_s-6 | 0.2454 | 0.1586 | 1408.96 | 786.48–2145.92 | 1142.90 | 742.80–1637.12 |
| RMean | 0.2444 | 0.1067 | 31.58 | 25.23–47.44 | 28.54 | 19.63–35.84 |
| RCZ4D6SumAverg | 0.2439 | 0.0973 | 16.50 | 13.01–24.54 | 14.80 | 10.57–18.86 |
| Ki-67 Negative vs. Ki-67 Positive | ||||||
| Texture Parameters | F | p-Value | Ki-67 Negative | Ki-67 Positive | ||
| Median | IQR | Median | IQR | |||
| RWavEnLH_s-6 | 0.17 | 0.1446 | 42.28 | 27.07–56.67 | 32.77 | 15.98–50.05 |
| RATeta4 | 0.1309 | 0.1446 | 0.16 | 0.12–0.17 | 0.14 | 0.12–0.16 |
| RCN1D6AngScMom | 0.129 | 0.1446 | 0.01 | 0.009–0.04 | 0.02 | 0.01–0.04 |
| RCV1D6AngScMom | 0.129 | 0.1574 | 0.01 | 0.01–0.04 | 0.02 | 0.01–0.04 |
| RCZ1D6AngScMom | 0.1284 | 0.1477 | 0.01 | 0.009–0.04 | 0.02 | 0.01–0.04 |
| RCV2D6AngScMom | 0.126 | 0.1477 | 0.01 | 0.006–0.02 | 0.01 | 0.008–0.029 |
| RCN2D6AngScMom | 0.1246 | 0.1509 | 0.01 | 0.006–0.02 | 0.01 | 0.008–0.02 |
| RCH2D6AngScMom | 0.1244 | 0.1856 | 0.02 | 0.01–0.04 | 0.03 | 0.01–0.04 |
| RCH3D6AngScMom | 0.1244 | 0.1675 | 0.01 | 0.008–0.03 | 0.02 | 0.01–0.03 |
| RCV3D6AngScMom | 0.1242 | 0.1509 | 0.01 | 0.005–0.02 | 0.01 | 0.007–0.02 |
| HER2 Negative vs. HER2 Positive | ||||||
| Texture Parameters | F | p-Value | HER2 Negative | HER2 Positive | ||
| Median | IQR | Median | IQR | |||
| RWavEnLH_s-6 | 0.7015 | 0.0037 | 40.78 | 26.56–56.72 | 22.20 | 8.96–36.05 |
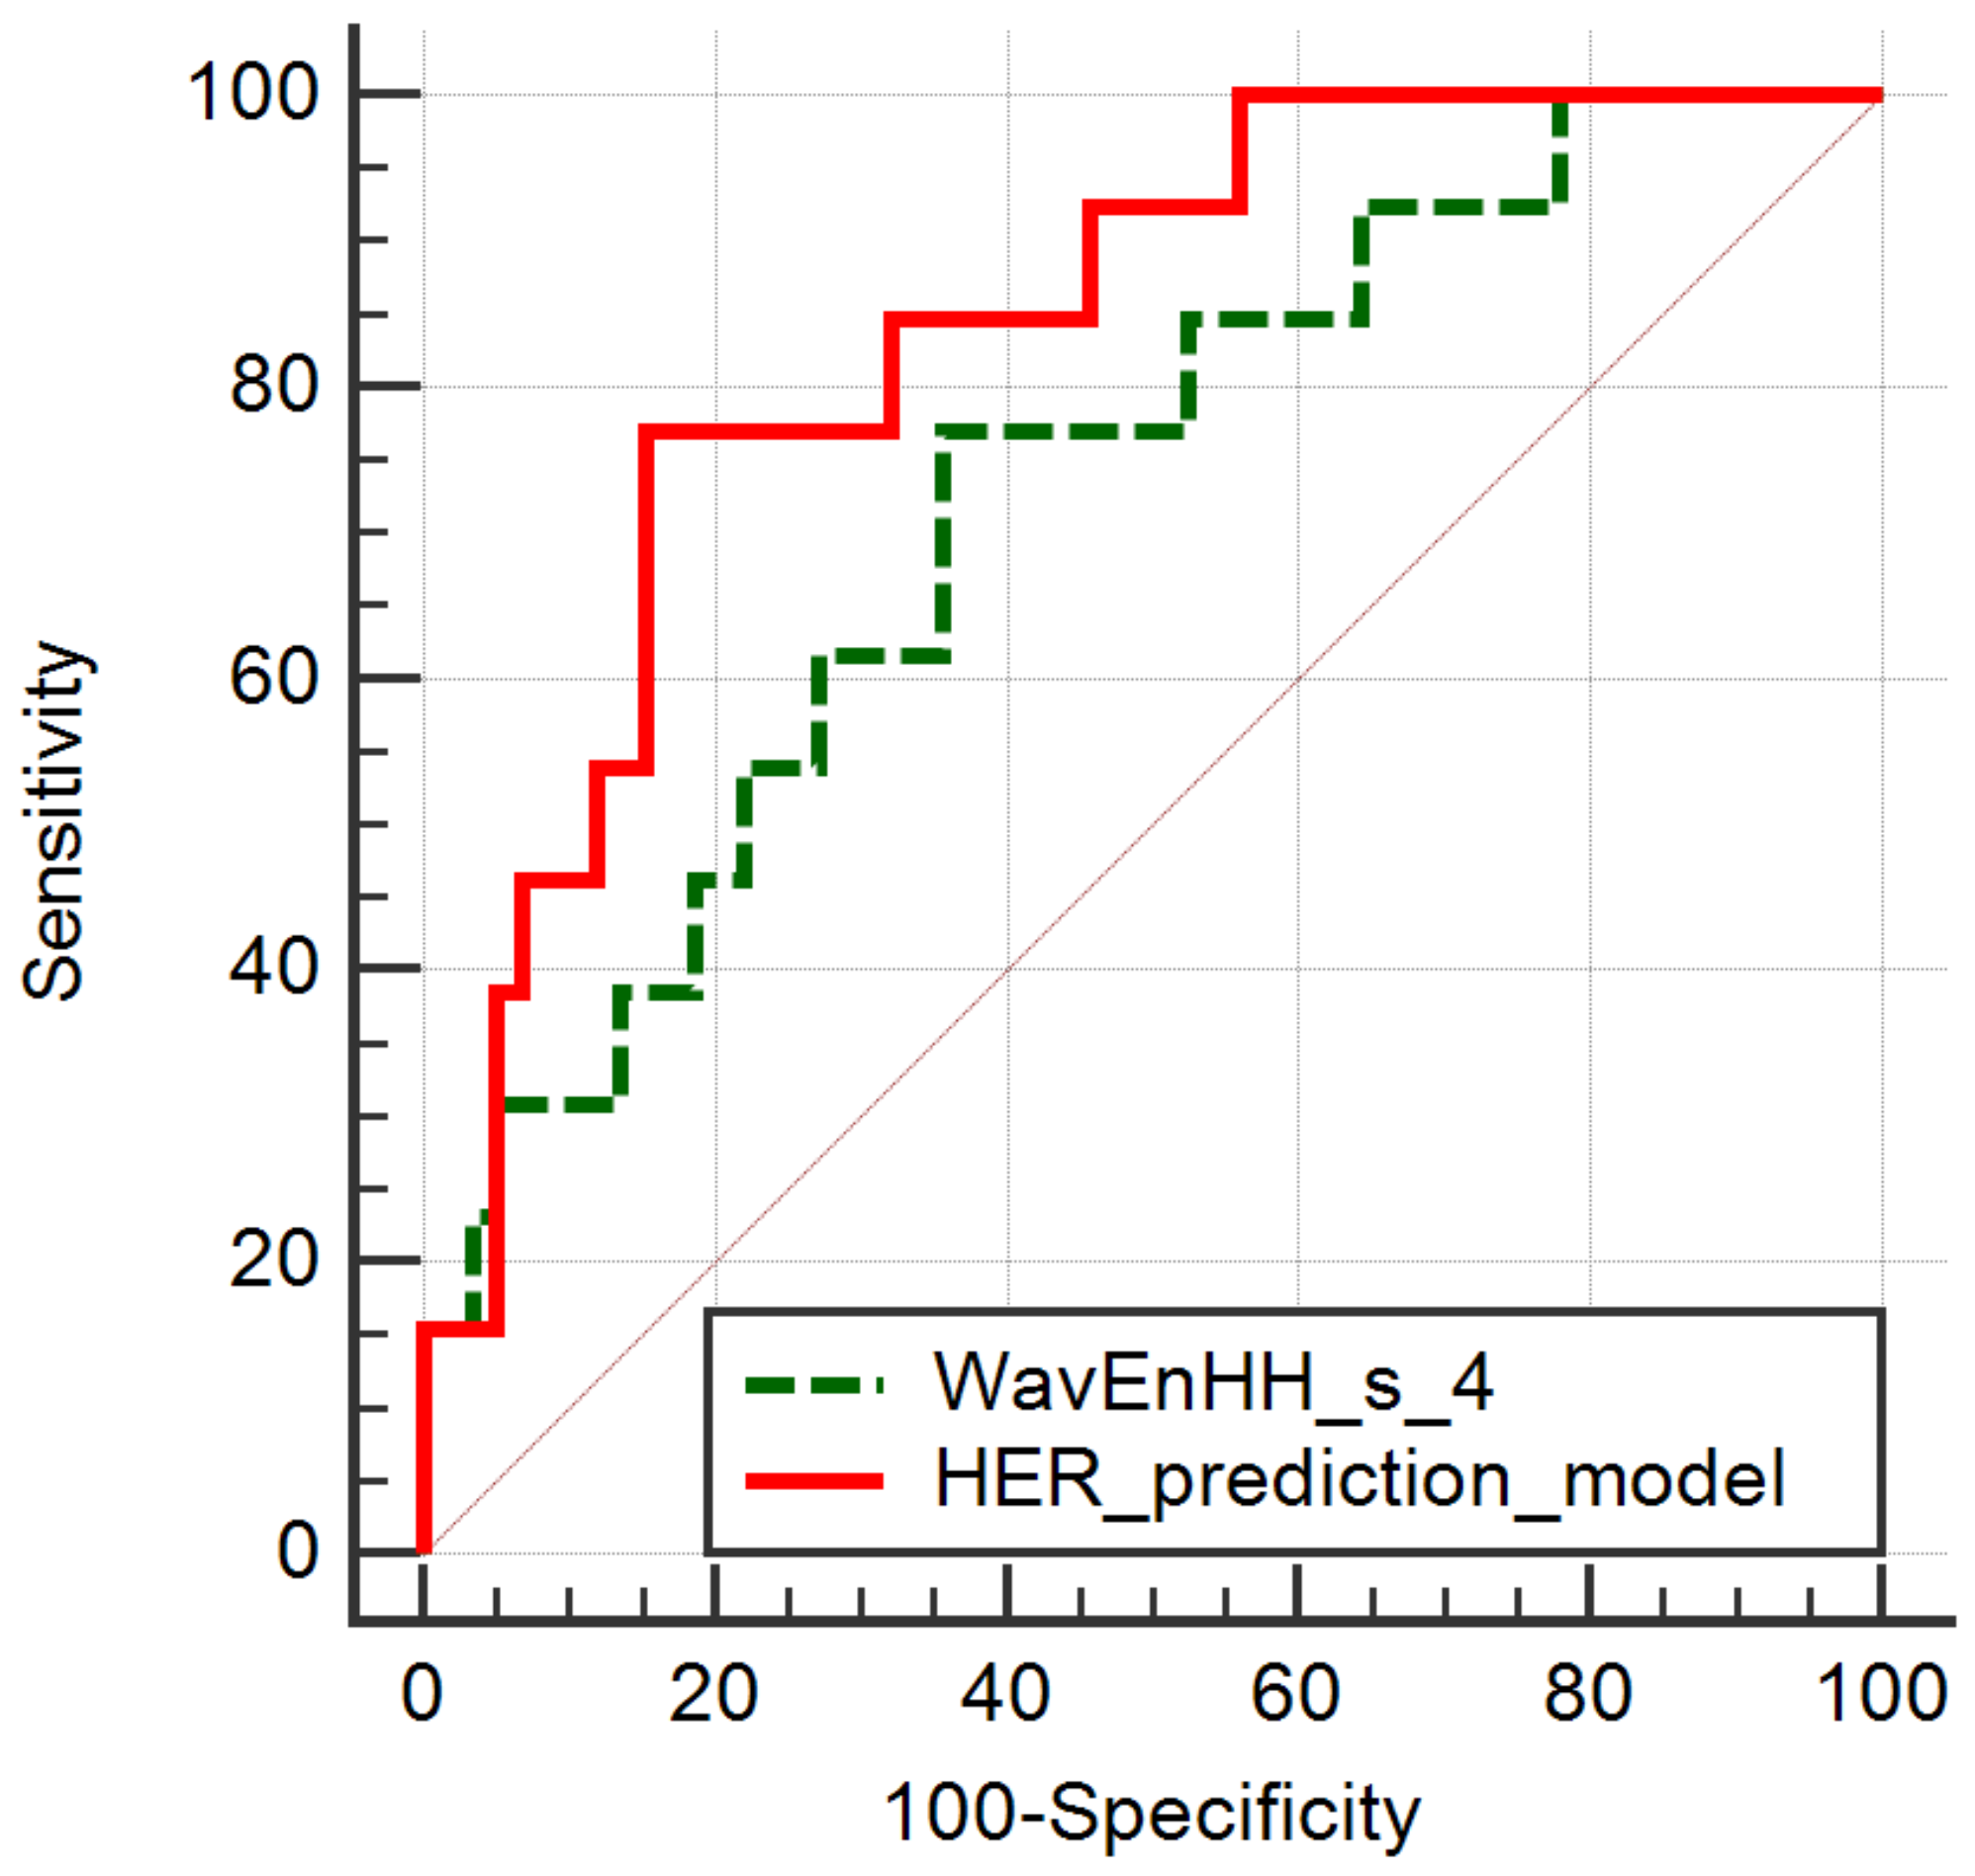
| RWavEnHH_s-4 | 0.6693 | 0.0111 | 9.83 | 6.51–13.32 | 6.30 | 2.98–8.67 |
| RRZD6ShrtREmp | 0.5754 | 0.0457 | 0.79 | 0.73–0.82 | 0.72 | 0.68–0.80 |
| RRHD6ShrtREmp | 0.5677 | 0.0729 | 0.67 | 0.59–0.70 | 0.61 | 0.52–0.66 |
| RRND6ShrtREmp | 0.5622 | 0.0524 | 0.79 | 0.73–0.82 | 0.72 | 0.68–0.80 |
| RRVD6ShrtREmp | 0.5377 | 0.0706 | 0.77 | 0.72–0.80 | 0.70 | 0.65–0.78 |
| RRHD6Fraction | 0.5063 | 0.0357 | 0.49 | 0.41–0.54 | 0.40 | 0.34–0.48 |
| RCH1D6InvDfMom | 0.4597 | 0.0426 | 0.72 | 0.68–0.77 | 0.77 | 0.71–0.81 |
| RCH2D6InvDfMom | 0.4571 | 0.037 | 0.56 | 0.51–0.64 | 0.63 | 0.57–0.69 |
| RCH3D6InvDfMom | 0.4474 | 0.0332 | 0.47 | 0.42–0.55 | 0.55 | 0.48–0.61 |
| Independent Variables | Coefficient | Std. Error | t | p | rpartial | rsemipartial | VIF |
|---|---|---|---|---|---|---|---|
| RCH1D6InvDfMom | 12.71 | 19.76 | 0.64 | 0.522 | 0.08 | 0.07 | 813.42 |
| RCH2D6InvDfMom | −43.60 | 38.37 | −1.13 | 0.260 | −0.14 | 0.12 | 6252.58 |
| RCH3D6InvDfMom | 10.69 | 20.28 | 0.52 | 0.599 | 0.06 | 0.05 | 2153.36 |
| RRHD6Fraction | −19.03 | 9.60 | −1.98 | 0.052 | −0.24 | 0.22 | 499 |
| RRZD6ShrtREmp | −1.61 | 2 | −0.8 | 0.424 | −0.1 | 0.08 | 10.73 |
| RWavEnHH_s_4 | −0.02 | 0.01 | −2.05 | 0.044 | −0.24 | 0.22 | 2.33 |
| RWavEnLH_s_6 | −0.002 | 0.001 | −1.09 | 0.279 | −0.13 | 0.12 | 1.46 |
| Parameter | p-Value | AUC | J | Cut-Off | Se (%) | Sp (%) |
|---|---|---|---|---|---|---|
| RWavEnLH_s_6 | 0.0002 | 0.759 (0.644–0.852) | 0.3977 | ≤42.41 | 92.31 (64.0–99.8) | 47.46 (34.3–60.9) |
| RRZD6ShrtREmp | 0.0344 | 0.678 (0.557–0.783) | 0.3690 | ≤0.72 | 53.85 (25.1–80.8) | 83.05 (71.0–91.6) |
| RRHD6Fraction | 0.0212 | 0.687 (0.567–0.791) | 0.3716 | ≤0.48 | 84.62 (54.6–98.1) | 52.54 (39.1–65.7) |
| RCH1D6InvDfMom | 0.0249 | 0.681 (0.560–0.786) | 0.3977 | >0.706 | 92.31 (64.0–99.8) | 47.46 (34.3–60.9) |
| RCH2D6InvDfMom | 0.0211 | 0.686 (0.566–0.790) | 0.3977 | >0.549 | 92.31 (64.0–99.8) | 47.46 (34.3–60.9) |
| RCH3D6InvDfMom | 0.0174 | 0.690 (0.570–0.794) | 0.3716 | >0.478 | 84.62 (54.6–98.1) | 52.54 (39.1–65.7) |
| Independent Variables | Coefficient | Std. Error | t | p | rpartial | rsemipartial | VIF |
|---|---|---|---|---|---|---|---|
| RPerc01 | −0.01 | 0.02 | −0.62 | 0.5329 | −0.07 | 0.07 | 5.8 |
| RPerc10 | −0.001 | 0.01 | −0.08 | 0.9296 | −0.01 | 0.01 | 6.33 |
| RWavEnLH_s_4 | −0.004 | 0.003 | −1.17 | 0.2445 | −0.14 | 0.13 | 1.44 |
Publisher’s Note: MDPI stays neutral with regard to jurisdictional claims in published maps and institutional affiliations. |
© 2022 by the authors. Licensee MDPI, Basel, Switzerland. This article is an open access article distributed under the terms and conditions of the Creative Commons Attribution (CC BY) license (https://creativecommons.org/licenses/by/4.0/).
Share and Cite
Bene, I.; Ciurea, A.I.; Ciortea, C.A.; Ștefan, P.A.; Ciule, L.D.; Lupean, R.A.; Dudea, S.M. Radiomic Signatures Derived from Hybrid Contrast-Enhanced Ultrasound Images (CEUS) for the Assessment of Histological Characteristics of Breast Cancer: A Pilot Study. Cancers 2022, 14, 3905. https://doi.org/10.3390/cancers14163905
Bene I, Ciurea AI, Ciortea CA, Ștefan PA, Ciule LD, Lupean RA, Dudea SM. Radiomic Signatures Derived from Hybrid Contrast-Enhanced Ultrasound Images (CEUS) for the Assessment of Histological Characteristics of Breast Cancer: A Pilot Study. Cancers. 2022; 14(16):3905. https://doi.org/10.3390/cancers14163905
Chicago/Turabian StyleBene, Ioana, Anca Ileana Ciurea, Cristiana Augusta Ciortea, Paul Andrei Ștefan, Larisa Dorina Ciule, Roxana Adelina Lupean, and Sorin Marian Dudea. 2022. "Radiomic Signatures Derived from Hybrid Contrast-Enhanced Ultrasound Images (CEUS) for the Assessment of Histological Characteristics of Breast Cancer: A Pilot Study" Cancers 14, no. 16: 3905. https://doi.org/10.3390/cancers14163905
APA StyleBene, I., Ciurea, A. I., Ciortea, C. A., Ștefan, P. A., Ciule, L. D., Lupean, R. A., & Dudea, S. M. (2022). Radiomic Signatures Derived from Hybrid Contrast-Enhanced Ultrasound Images (CEUS) for the Assessment of Histological Characteristics of Breast Cancer: A Pilot Study. Cancers, 14(16), 3905. https://doi.org/10.3390/cancers14163905


