
TNFRSF1A Gene Polymorphism (−610 T > G, rs4149570) as a Predictor of Malnutrition and a Prognostic Factor in Patients Subjected to Intensity-Modulated Radiation Therapy Due to Head and Neck Cancer

 , , and
Abstract
:Simple Summary
Abstract
1. Introduction
2. Material and Methods
2.1. Study Group
2.2. Treatment
2.3. Assessment of Disease Stage of Advancement, Patient’s Performance and Nutritional Status
2.4. Bioelectrical Impedance Analysis
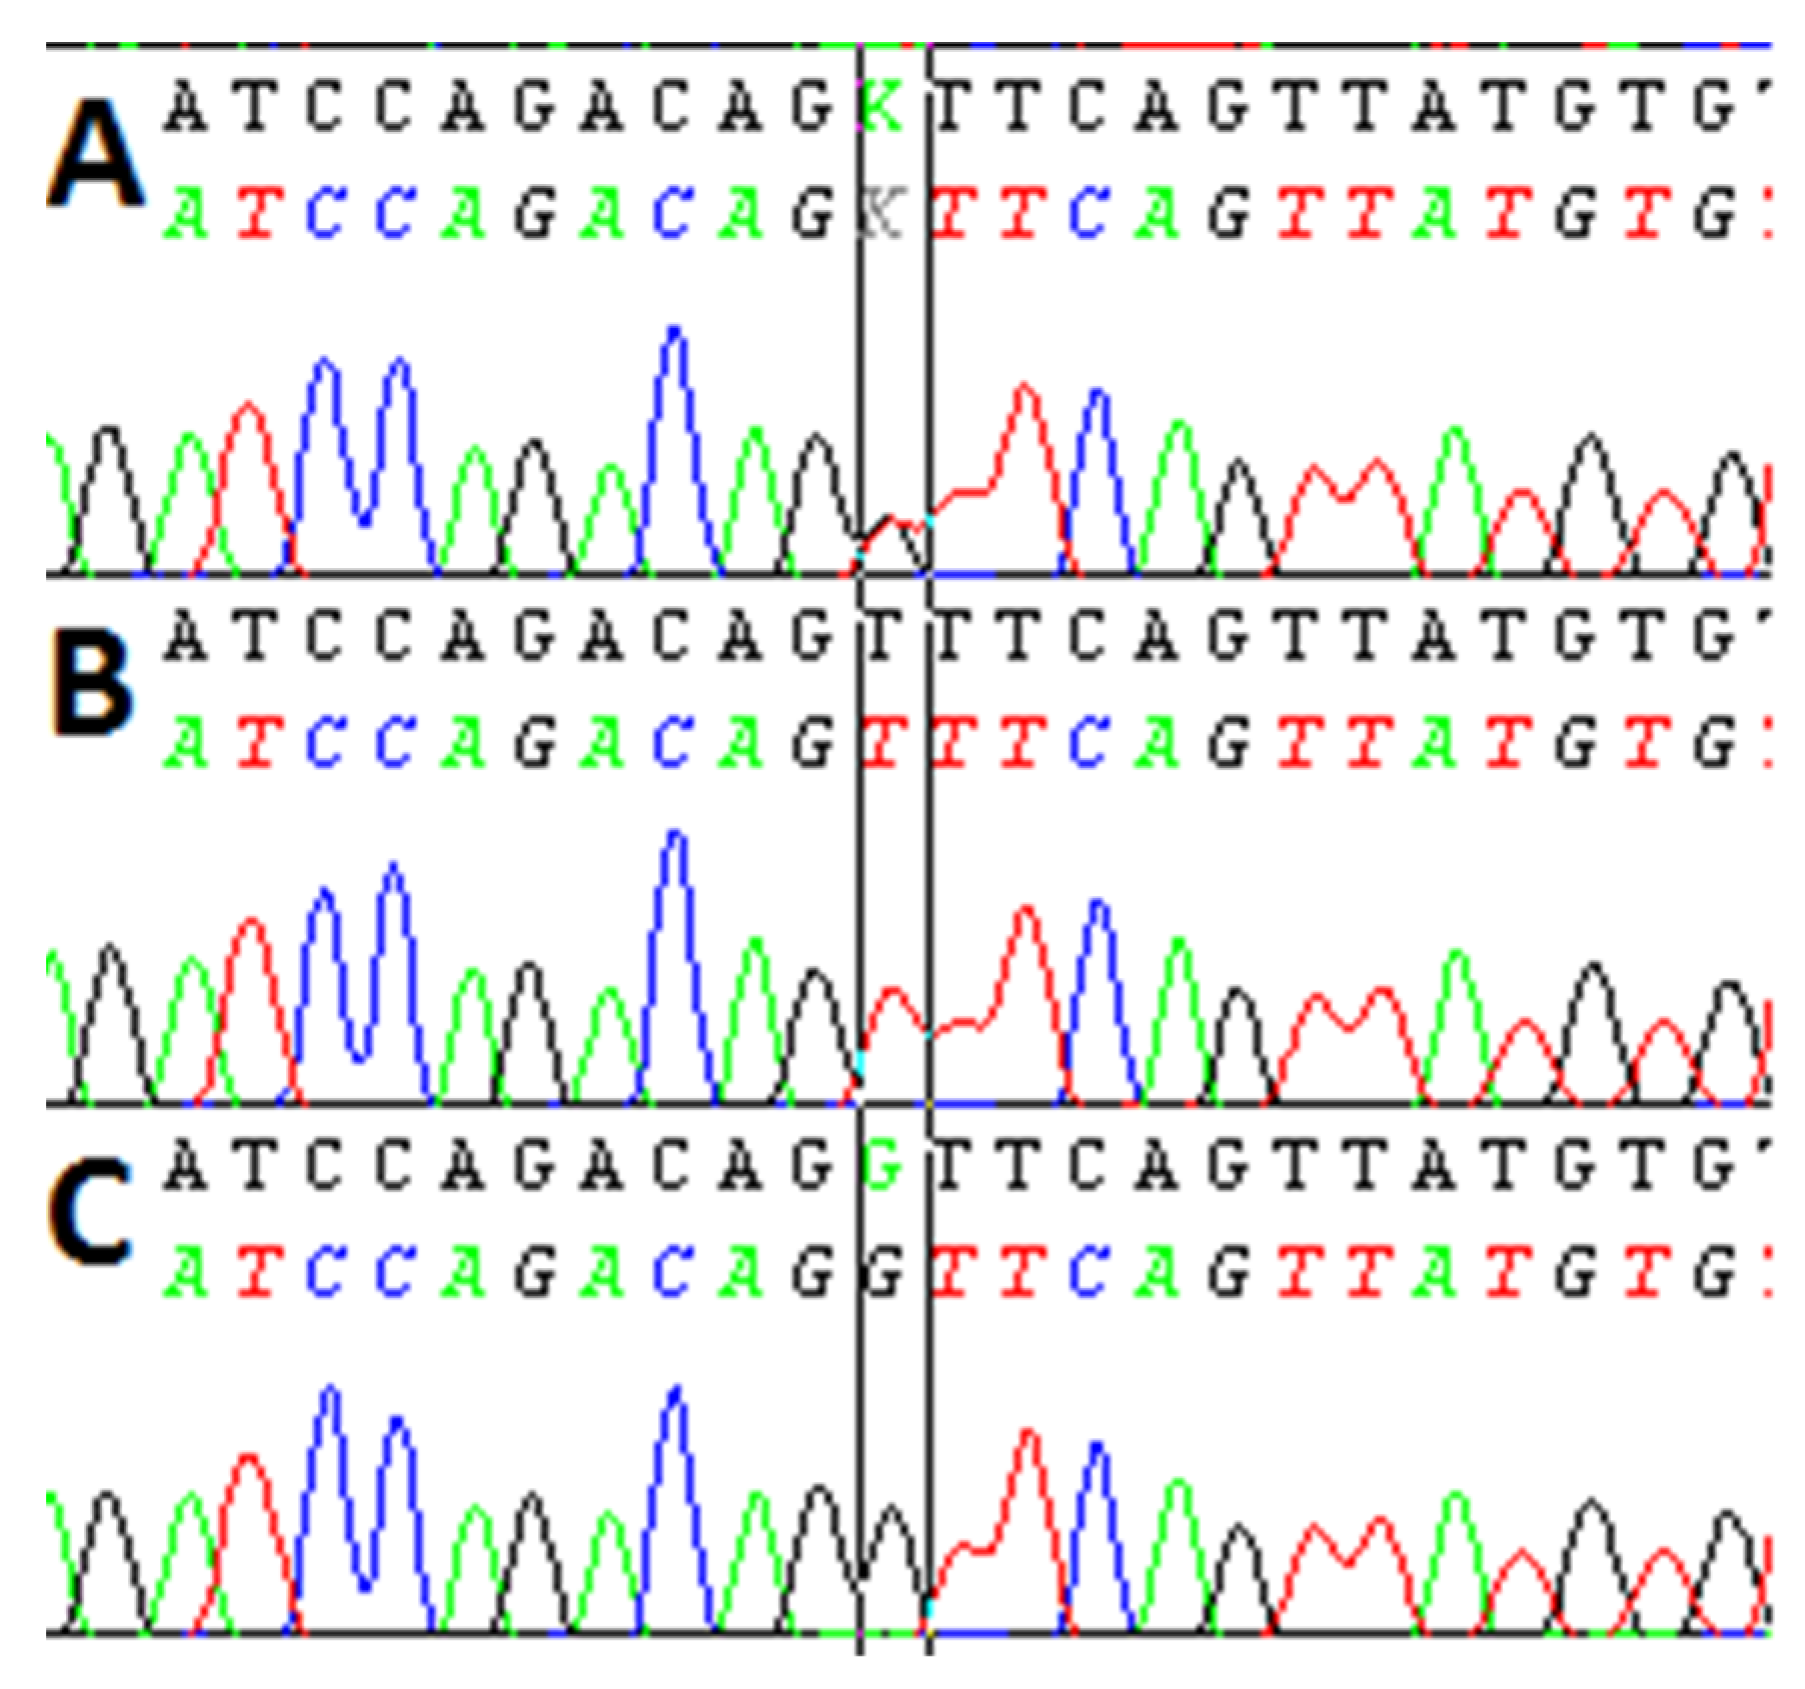
2.5. Determination of TNFRSF1A Polymorphism
2.6. Statistical Analysis
3. Results
3.1. Characteristics of the Study Group
3.2. The Influence of the Demographic, Clinical, and Genetic Variables on the Risk of Malnutrition According to SGA
3.2.1. Univariable Analysis
3.2.2. Multivariable Analysis
3.3. The Influence of the Demographic, Clinical, and Genetic Variables on the Nutritional Risk According to NRS-2002
3.3.1. Univariable Analysis
3.3.2. Multivariable Analysis
3.4. The Influence of the Demographic, Clinical, Nutritional, and Genetic Variables on the Risk of the Necessary Application of Parenteral Nutrition
3.4.1. Univariable Analysis
3.4.2. Multivariable Analysis
3.5. The Influence of the Demographic, Clinical, Nutritional, and Genetic Variables on the Risk of CWL
3.5.1. Univariable Analysis
3.5.2. Multivariable Analysis
3.6. Overall Survival
3.6.1. Univariable Analysis
3.6.2. Multivariable Analysis
3.7. Comparisons of Demographic, Laboratory, and Nutritional Variables According to TNFRSF1A Genotypes
3.8. Comparisons of Demographic, Laboratory, and Nutritional Variables According to SGA Category
3.9. Comparisons of Demographic, Laboratory and Nutritional Variables According to NRS Category
3.10. Comparisons of Demographic, Laboratory and Nutritional Variables According to CWL
4. Discussion
5. Conclusions
Supplementary Materials
Author Contributions
Funding
Institutional Review Board Statement
Informed Consent Statement
Data Availability Statement
Conflicts of Interest
References
- Aupérin, A. Epidemiology of head and neck cancers: An update. Curr. Opin. Oncol. 2020, 32, 178–186. [Google Scholar] [CrossRef] [PubMed]
- Giraldi, L.; Leoncini, E.; Pastorino, R.; Wünsch-Filho, V.; de Carvalho, M.; Lopez, R.; Cadoni, G.; Arzani, D.; Petrelli, L.; Matsuo, K.; et al. Alcohol and cigarette consumption predict mortality in patients with head and neck cancer: A pooled analysis within the International Head and Neck Cancer Epidemiology (INHANCE) Consortium. Ann. Oncol. 2017, 28, 2843–2851. [Google Scholar] [CrossRef] [PubMed]
- Richey, L.M.; George, J.R.; Couch, M.E.; Kanapkey, B.K.; Yin, X.; Cannon, T.; Stewart, P.W.; Weissler, M.C.; Shores, C.G. Defining cancer cachexia in head and neck squamous cell carcinoma. Clin. Cancer Res. 2007, 13, 6561–6567. [Google Scholar] [CrossRef] [Green Version]
- Meza-Valderrama, D.; Marco, E.; Dávalos-Yerovi, V.; Muns, M.D.; Tejero-Sánchez, M.; Duarte, E.; Sánchez-Rodríguez, D. Sarcopenia, malnutrition, and cachexia: Adapting definitions and terminology of nutritional disorders in older people with cancer. Nutrients 2021, 13, 761. [Google Scholar] [CrossRef]
- Elkashty, O.A.; Ashry, R.; Tran, S.D. Head and neck cancer management and cancer stem cells implication. Saudi Dent. J. 2019, 31, 395–416. [Google Scholar] [CrossRef] [PubMed]
- Gorenc, M.; Kozjek, N.R.; Strojan, P. Malnutrition and cachexia in patients with head and neck cancer treated with (chemo)radiotherapy. Reports Pract. Oncol. Radiother. 2015, 20, 249–258. [Google Scholar] [CrossRef] [PubMed] [Green Version]
- Nicolini, A.; Ferrari, P.; Masoni, M.C.; Fini, M.; Pagani, S.; Giampietro, O.; Carpi, A. Malnutrition, anorexia and cachexia in cancer patients: A mini-review on pathogenesis and treatment. Biomed. Pharmacother. 2013, 67, 807–817. [Google Scholar] [CrossRef] [PubMed]
- Vanhoutte, G.; van de Wiel, M.; Wouters, K.; Sels, M.; Bartolomeeussen, L.; De Keersmaecker, S.; Verschueren, C.; De Vroey, V.; De Wilde, A.; Smits, E.; et al. Cachexia in cancer: What is in the definition? BMJ Open Gastroenterol. 2016, 3, e000097. [Google Scholar] [CrossRef]
- Baracos, V.E. Cancer-associated malnutrition. Eur. J. Clin. Nutr. 2018, 72, 1255–1259. [Google Scholar] [CrossRef]
- Dianliang, Z. Probing cancer cachexia-anorexia: Recent results with knockout, transgene and polymorphisms. Curr. Opin. Clin. Nutr. Metab. Care 2009, 12, 227–231. [Google Scholar] [CrossRef]
- Yang, W.; Huang, J.; Wu, H.; Wang, Y.; Du, Z.; Ling, Y.; Wang, W.; Wu, Q.; Gao, W. Molecular mechanisms of cancer cachexia-induced muscle atrophy (Review). Mol. Med. Rep. 2020, 22, 4967–4980. [Google Scholar] [CrossRef] [PubMed]
- Omatsu, H.; Kuwahara, A.; Yamamori, M.; Fujita, M.; Okuno, T.; Miki, I.; Tamura, T.; Nishiguchi, K.; Okamura, N.; Nakamura, T.; et al. TNF-α -857C>T genotype is predictive of clinical response after treatment with definitive 5-fluorouracil/cisplatin-based chemoradiotherapy in Japanese patients with esophageal squamous cell carcinoma. Int. J. Med. Sci. 2013, 10, 1755–1760. [Google Scholar] [CrossRef] [PubMed] [Green Version]
- Sennikov, S.V.; Vasilyev, F.F.; Lopatnikova, J.A.; Shkaruba, N.S.; Silkov, A.N. Polymorphisms in the tumor necrosis factor receptor genes affect the expression levels of membrane-bound type I and type II receptors. Mediators Inflamm. 2014, 2014, 745909. [Google Scholar] [CrossRef] [Green Version]
- Kalliolias, G.D.; Ivashkiv, L.B. TNF biology, pathogenic mechanisms and emerging therapeutic strategies. Nat. Rev. Rheumatol. 2016, 12, 49–62. [Google Scholar] [CrossRef] [PubMed]
- Brenner, D.; Blaser, H.; Mak, T.W. Regulation of tumour necrosis factor signalling: Live or let die. Nat. Rev. Immunol. 2015, 15, 362–374. [Google Scholar] [CrossRef]
- Sode, J.; Bank, S.; Vogel, U.; Andersen, P.S.; Sørensen, S.B.; Bojesen, A.B.; Andersen, M.R.; Brandslund, I.; Dessau, R.B.; Hoffmann, H.J.; et al. Genetically determined high activities of the TNF-alpha, IL23/IL17, and NFkB pathways were associated with increased risk of ankylosing spondylitis. BMC Med. Genet. 2018, 19, 165. [Google Scholar] [CrossRef] [Green Version]
- Bank, S.; Skytt Andersen, P.; Burisch, J.; Pedersen, N.; Roug, S.; Galsgaard, J.; Ydegaard Turino, S.; Broder Brodersen, J.; Rashid, S.; Kaiser Rasmussen, B.; et al. Polymorphisms in the inflammatory pathway genes TLR2, TLR4, TLR9, LY96, NFKBIA, NFKB1, TNFA, TNFRSF1A, IL6R, IL10, IL23R, PTPN22, and PPARG are associated with susceptibility of inflammatory bowel disease in a Danish cohort. PLoS ONE 2014, 9, e98815. [Google Scholar] [CrossRef]
- Brzozowska, A.; Powrózek, T.; Homa-Mlak, I.; Mlak, R.; Ciesielka, M.; Gołębiowski, P.; Małecka-Massalska, T. Polymorphism of Promoter Region of TNFRSF1A Gene (−610 T > G) as a Novel Predictive Factor for Radiotherapy Induced Oral Mucositis in HNC Patients. Pathol. Oncol. Res. 2018, 24, 135–143. [Google Scholar] [CrossRef] [Green Version]
- Sainz, J.; Salas-Alvarado, I.; López-Fernández, E.; Olmedo, C.; Comino, A.; García, F.; Blanco, A.; Gómez-Lopera, S.; Oyonarte, S.; Bueno, P.; et al. TNFR1 mRNA expression level and TNFR1 gene polymorphisms are predictive markers for susceptibility to develop invasive pulmonary aspergillosis. Int. J. Immunopathol. Pharmacol. 2010, 23, 423–436. [Google Scholar] [CrossRef] [Green Version]
- Langius, J.A.E.; Bakker, S.; Rietveld, D.H.F.; Kruizenga, H.M.; Langendijk, J.A.; Weijs, P.J.M.; Leemans, C.R. Critical weight loss is a major prognostic indicator for disease-specific survival in patients with head and neck cancer receiving radiotherapy. Br. J. Cancer 2013, 109, 1093–1099. [Google Scholar] [CrossRef]
- Meriggi, F. Cancer Cachexia: One Step Ahead. Rev. Recent Clin. Trials 2015, 10, 246–250. [Google Scholar] [CrossRef] [PubMed]
- Cao, J.; Xu, H.; Li, W.; Guo, Z.; Lin, Y.; Shi, Y.; Hu, W.; Ba, Y.; Li, S.; Li, Z.; et al. Nutritional assessment and risk factors associated to malnutrition in patients with esophageal cancer. Curr. Probl. Cancer 2021, 45, 100638. [Google Scholar] [CrossRef]
- Johns, N.; Tan, B.H.; MacMillan, M.; Solheim, T.S.; Ross, J.A.; Baracos, V.E.; Damaraju, S.; Fearon, K.C.H. Genetic basis of interindividual susceptibility to cancer cachexia: Selection of potential candidate gene polymorphisms for association studies. J. Genet. 2014, 93, 893–916. [Google Scholar] [CrossRef] [PubMed]
- Ostrowska, J.; Sulz, I.; Tarantino, S.; Hiesmayr, M.; Szostak-Węgierek, D. Hospital Malnutrition, Nutritional Risk Factors, and Elements of Nutritional Care in Europe: Comparison of Polish Results with All European Countries Participating in the nDay Survey. Nutrients 2021, 13, 263. [Google Scholar] [CrossRef] [PubMed]
- Zhang, Z.; Wan, Z.; Zhu, Y.; Zhang, L.; Zhang, L.; Wan, H. Prevalence of malnutrition comparing NRS2002, MUST, and PG-SGA with the GLIM criteria in adults with cancer: A multi-center study. Nutrition 2021, 83, 111072. [Google Scholar] [CrossRef] [PubMed]
- Barbosa-Silva, M.C.G.; Barros, A.J.D. Indications and limitations of the use of subjective global assessment in clinical practice: An update. Curr. Opin. Clin. Nutr. Metab. Care 2006, 9, 263–269. [Google Scholar] [CrossRef]
- Jager-Wittenaar, H.; Dijkstra, P.U.; Vissink, A.; Van Der Laan, B.F.A.M.; Van Oort, R.P.; Roodenburg, J.L.N. Critical weight loss in head and neck cancer—Prevalence and risk factors at diagnosis: An explorative study. Support. Care Cancer 2007, 15, 1045–1050. [Google Scholar] [CrossRef] [Green Version]
- Comabella, M.; Caminero, A.B.; Malhotra, S.; Agulló, L.; Fernández, O.; Reverter, F.; Vandenbroeck, K.; Rodríguez-Antigüedad, A.; Matesanz, F.; Izquierdo, G.; et al. TNFRSF1A polymorphisms rs1800693 and rs4149584 in patients with multiple sclerosis. Neurology 2013, 80, 2010–2016. [Google Scholar] [CrossRef]
- Kim, S.; Moon, S.-M.; Kim, Y.S.; Kim, J.-J.; Ryu, H.-J.; Kim, Y.-J.; Choi, J.-W.; Park, H.-S.; Kim, D.-G.; Shin, H.-D.; et al. TNFR1 promoter -329G/T polymorphism results in allele-specific repression of TNFR1 expression. Biochem. Biophys. Res. Commun. 2008, 368, 395–401. [Google Scholar] [CrossRef]
- Powrózek, T.; Mlak, R.; Brzozowska, A.; Mazurek, M.; Gołębiowski, P.; Małecka-Massalska, T. Relationship between TNF-α −1031T/C gene polymorphism, plasma level of TNF-α, and risk of cachexia in head and neck cancer patients. J. Cancer Res. Clin. Oncol. 2018, 144, 1423–1434. [Google Scholar] [CrossRef] [Green Version]
- Johns, N.; Stretch, C.; Tan, B.H.L.; Solheim, T.S.; Sørhaug, S.; Stephens, N.A.; Gioulbasanis, I.; Skipworth, R.J.E.; Deans, D.A.C.; Vigano, A.; et al. New genetic signatures associated with cancer cachexia as defined by low skeletal muscle index and weight loss. J. Cachexia. Sarcopenia Muscle 2017, 8, 122–130. [Google Scholar] [CrossRef] [PubMed] [Green Version]
- de Luis, D.A.; Sagrado, M.G.; Vallejo, L.A.; Carcedo, L.M.G.; Izaola, O.; Cuellar, L.; Terroba, M.C.; Aller, R. Influence of G308A polymorphism of tumor necrosis factor-alpha gene on inflammatory markers in postsurgical head and neck cancer patients with early enteral nutrition. Nutrition 2007, 23, 529–532. [Google Scholar] [CrossRef] [PubMed]


| Variable | Study Group (n = 77) | |
|---|---|---|
| Gender | Male | 62 (80.5%) |
| Female | 15 (19.5%) | |
| Age [years] | Median (range) | 63 (42–87) |
| ≥63 | 39 (50.6%) | |
| <63 | 38 (49.4%) | |
| Histopathological diagnosis | Squamous cell carcinoma | 71 (92.2%) |
| Non-squamous cell carcinoma | 6 (77.8%) | |
| Tumor location | Oropharynx | 29 (37.7%) |
| Larynx | 39 (50.6%) | |
| Other sites a | 9 (11.7%) | |
| T stage | T1 | 3 (3.9%) |
| T2 | 12 (15.6%) | |
| T3 | 27 (35.1%) | |
| T4 | 35 (45.4%) | |
| N stage | N0 | 27 (35.1%) |
| N1 | 9 (11.7%) | |
| N2 | 35 (45.4%) | |
| N3 | 6 (7.8%) | |
| M stage | M0 | 67 (87%) |
| M1 | 10 (13%) | |
| Disease stage according to TNM | III | 22 (28.6%) |
| IVA | 40 (51.9%) | |
| IVB | 5 (6.5%) | |
| IVC | 10 (13.0%) | |
| Performance status | ≤1 | 21 (27.3%) |
| >1 | 56 (72.7%) | |
| Type of treatment | Surgery + RT | 31 (40.2%) |
| Surgery + C-RT | 18 (23.4%) | |
| RT alone | 12 (15.6%) | |
| Induction CTH + RT | 3 (3.9%) | |
| C-RT | 8 (10.4%) | |
| Induction CTH + C-RT | 4 (5.2%) | |
| Induction CTH + Surgery + C-RT | 1 (1.3%) | |
| Excessive alcohol consumption | Yes | 35 (45.5%) |
| No | 42 (54.5%) | |
| Smoking status (ever) | Smoker | 59 (76.6%) |
| Nonsmoker | 18 (23.4%) | |
| Smoking status (currently) [no data: n = 18] | Current smoker | 52 (88.1%) |
| Former smoker | 7 (11.9%) | |
| Parenteral nutrition | Yes | 15 (19.5%) |
| No | 62 (80.5%) | |
| Weight [kg] | Median (range) | 67 (43–91) |
| BMI [kg/m2] | Median (range) | 22.83 (14.5–34.4) |
| SGA | A | 17 (22.1%) |
| B | 34 (44.1%) | |
| C | 26 (33.8%) | |
| NRS-2002 | 2 | 54 (70.1%) |
| 3 | 20 (26.0%) | |
| 4 | 2 (2.6%) | |
| 5 | 1 (1.3%) | |
| CWL | Yes | 28 (36.4%) |
| No | 49 (63.6%) | |
| Variable | SGA | ||||||||
|---|---|---|---|---|---|---|---|---|---|
| A | B or C | Univariable Analysis | Multivariable Analysis | A or B | C | Univariable Analysis | Multivariable Analysis | ||
| OR [95% CI] p | OR [95% CI] p | OR [95% CI] p | OR [95% CI] p | ||||||
| Gender | Male | 11 (55.00%) | 51 (89.48%) | 3.09 [0.91–10.48] 0.0701 | 4.67 [0.96–22.63] 0.0555 | 40 (64.52%) | 22 (35.48%) | 1.51 [0.43–5.32] 0.5189 | 1.73 [0.43–6.94] 0.4387 |
| Female | 6 (10.52%) | 9 (45.00%) | 11 (73.33%) | 4 (26.67%) | |||||
| Age [years] | ≥63 | 10 (25.64%) | 29 (74.36%) | 0.65 [0.22–1.95] 0.4467 | 0.42 [0.11–1.60] 0.2034 | 25 (64.10%) | 14 (35.90%) | 1.21 [0.47–3.12] 0.6889 | 1.20 [0.44–3.33] 0.7216 |
| <63 | 7 (18.42%) | 31 (81.58%) | 26 (68.42%) | 12 (31.58%) | |||||
| Histopathological diagnosis | Squamous-cell carcinoma | 14 (19.72%) | 57 (80.28%) | 4.07 [0.74–22.37] 0.1063 | 2.99 [0.35–25.82] 0.3184 | 46 (64.79%) | 25 (35.21%) | 2.72 [0.30–24.56] 0.3735 | 5.02 [0.37–68.27] 0.2252 |
| Non-squamous-cell carcinoma | 3 (50.00%) | 3 (50.00%) | 5 (83.33%) | 1 (16.67%) | |||||
| Tumor location | Oropharynx | 11 (37.93%) | 18 (62.07%) | 0.23 [0.07–0.73] 0.0123 * | 0.18 [0.05–0.68] 0.0116 * | 9 (50.00%) | 9 (50.00%) | 2.48 [0.83–7.29] 0.1014 | 0.92 [0.32–2.65] 0.8785 |
| Other sites a | 6 (12.50%) | 42 (87.50%) | 42 (71.19%) | 17 (28.81%) | |||||
| Larynx | 5 (12.82%) | 34 (87.18%) | 3.14 [0.98–10.03] 0.0536 | 2.72 [0.73–10.09] 0.1352 | 26 (66.67%) | 13 (33.33%) | 0.96 [0.37–2.47] 0.9351 | 0.85 [0.31–2.39] 0.7704 | |
| Other sites b | 12 (31.58%) | 26 (68.42%) | 25 (65.79%) | 13 (34.21%) | |||||
| T stage | T4 | 1 (2.86%) | 34 (97.14%) | 20.92 [2.60–168.12] 0.0042 * | 20.24 [2.45–166.82] 0.0052 * | 19 (54.28%) | 16 (45.72%) | 2.69 [1.02–7.13] 0.0458 * | 2.23 [0.81–6.20] 0.1221 |
| T1–3 | 16 (38.09%) | 26 (61.91%) | 32 (76.19%) | 10 (23.81%) | |||||
| N stage | N1–3 | 8 (16.00%) | 42 (84.00%) | 2.62 [0.87–7.89] 0.0858 | 2.90 [0.91–9.29] 0.0722 | 7 (25.92%) | 20 (74.08%) | 20.95 [6.23–70.39] <0.0001 * | 2.83 [0.88–9.08] 0.0800 |
| N0 | 9 (33.33%) | 18 (66.67%) | 44 (88.00%) | 6 (12.00%) | |||||
| M stage | M1 | 1 (10.00%) | 9 (90.00%) | 2.82 [0.33–24.02] 0.3420 | 2.78 [0.29–27.12] 0.3766 | 4 (40.00%) | 6 (60.00%) | 3.52 [0.89–13.86] 0.0713 | 4.34 [0.96–19.61] 0.0561 |
| M0 | 16 (23.88%) | 51 (76.12%) | 47 (70.15%) | 20 (29.85%) | |||||
| Disease stage according to TNM | IVA-IVC | 6 (10.91%) | 49 (89.09%) | 8.17 [2.48–26.86] 0.0005 * | 9.47 [2.45–36.56] 0.0011 * | 29 (52.73%) | 26 (47.27%) | 40.42 [2.33–699.65] 0.0110 * | 2.69 [1.26–5.74] 0.0107 * |
| III | 11 (50.00%) | 11 (50.00%) | 22 (100.00%) | - | |||||
| Performance status | >1 | 12 (19.35%) | 50 (80.65%) | 2.08 [0.6–7.23] 0.2478 | 0.42 [0.10–1.85] 0.2550 | 43 (69.35%) | 19 (30.64%) | 0.50 [0.16–1.59] 0.2439 | 2.18 [0.58–8.28] 0.2502 |
| ≤1 | 5 (33.33%) | 10 (66.67%) | 8 (53.33%) | 7 (46.67%) | |||||
| Excessive alcohol consumption | Yes | 6 (16.22%) | 31 (83.78%) | 1.96 [0.64–5.98] 0.2374 | 1.66 [0.43–6.45] 0.4658 | 21 (56.76%) | 16 (43.24%) | 2.69 [1.02–7.13] 0.0458 * | 3.99 [1.27–12.52] 0.0174 * |
| No | 11 (27.50%) | 29 (72.50%) | 30 (75.00%) | 10 (25.00%) | |||||
| Smoking status (ever) | Smoker | 1 (2.04%) | 48 (97.96%) | 24.00 [2.63–218.67] 0.0048 * | 1.49 [0.35–6.28] 0.5853 | 27 (55.10%) | 22 (44.90%) | 4.89 [1.47–16.21] 0.0095 * | 2.01 [0.55–7.39] 0.2919 |
| Nonsmoker | 6 (33.33%) | 12 (66.67%) | 24 (85.71%) | 4 (14.29%) | |||||
| Smoking status (currently) [no data n = 18] | Current smoker | 10 (19.23%) | 42 (80.77%) | 0.70 [0.07–6.49] 0.7535 | 1.45 [0.12–17.67] 0.7682 | 33 (63.46%) | 19 (36.54%) | 0.77 [0.15–3.80] 0.7460 | 0.69 [0.11–4.31] 0.6939 |
| Former smoker | 1 (14.28%) | 6 (85.72%) | 4 (57.14%) | 3 (42.86%) | |||||
| Treatment | Definitive (C)-RT | 1 (10.00%) | 9 (90.00%) | 1.39 [0.43–4.47] 0.5810 | 2.13 [0.48–9.48] 0.3223 | 3 (30.00%) | 7 (70.00%) | 1.60 [0.60–4.26] 0.3432 | 1.83 [0.57–5.85] 0.3091 |
| Postoperative (C)-RT | 16 (23.88%) | 51 (76.12%) | 48 (71.64%) | 19 (28.36%) | |||||
| Concurrent C-RT | Yes | 9 (27.27%) | 24 (72.73%) | 1.04 [0.36–2.97] 0.9459 | 0.65 [0.17–2.46] 0.5239 | 21 (63.64%) | 12 (36.36%) | 1.22 [0.48–3.17] 0.6766 | 1.32 [0.46–3.83] 0.6052 |
| No | 8 (18.18%) | 36 (81.82%) | 30 (68.18%) | 14 (31.82%) | |||||
| TNFRSF1A genotype | TT | 1 (10.00%) | 9 (90.00%) | 2.82 [0.33–24.02] 0.3420 | 0.95 [0.09–9.91] 0.9649 | 3 (30.00%) | 7 (70.00%) | 5.89 [1.38–25.21] 0.0167 * | 5.05 [1.12–22.76] 0.0350 * |
| GT and GG | 16 (23.88%) | 51 (76.12%) | 48 (71.64%) | 19 (28.36%) | |||||
| GG | 6 (26.09%) | 17 (73.91%) | 0.72 [0.23–2.27] 0.5808 | 0.28 [0.06–1.26] 0.0973 | 16 (69.56%) | 7 (30.44%) | 0.81 [0.28–2.30] 0.6869 | 0.72 [0.24–2.13] 0.5495 | |
| TT and GT | 11 (20.37%) | 43 (79.63%) | 35 (64.81%) | 19 (35.19%) | |||||
| GT | 10 (22.73%) | 34 (77.27%) | 0.91 [0.31–2.73] 0.8740 | 3.60 [0.76–17.02] 0.1059 | 32 (72.73%) | 12 (27.27%) | 0.51 [0.19–1.32] 0.1668 | 0.60 [0.22–1.64] 0.3218 | |
| GG and TT | 7 (21.21%) | 26 (78.79%) | 19 (57.58%) | 14 (42.42%) | |||||
| Variable | NRS-2002 | |||
|---|---|---|---|---|
| <3 | ≥3 | OR [95% CI] p | ||
| Gender | Male | 43 (69.35%) | 19 (30.64%) | 1.21 [0.34–4.31] 0.7628 |
| Female | 11 (73.33%) | 4 (26.67%) | ||
| Age [years] | ≥63 | 27 (76.15%) | 12 (23.85%) | 1.09 [0.41–2.90] 0.8614 |
| <63 | 27 (71.05%) | 11 (28.95%) | ||
| Histopathological diagnosis | Squamous-cell carcinoma | 51 (71.83%) | 20 (28.17%) | 0.39 [0.07–2.11] 0.2753 |
| Non-squamous-cell carcinoma | 3 (50.00%) | 3 (50.00%) | ||
| Tumor location | Oropharyngeal | 21 (72.41%) | 8 (27.59%) | 0.84 [0.30–2.32] 0.7337 |
| Other a | 33 (68.75%) | 15 (31.25%) | ||
| Larynx | 26 (66.67%) | 13 (33.33%) | 1.40 [0.52–3.74] 0.5019 | |
| Other b | 28 (73.68%) | 10 (26.32%) | ||
| T stage | T4 | 25 (71.43%) | 10 (28.87%) | 0.89 [0.33–2.38] 0.8202 |
| T1–3 | 29 (69.05%) | 13 (30.95%) | ||
| N stage | N1–3 | 37 (74.00%) | 13 (26.00%) | 0.60 [0.22–1.63] 0.3147 |
| N0 | 17 (62.96%) | 10 (37.04%) | ||
| M stage | M1 | 7 (70.00%) | 3 (30.00%) | 1.00 [0.24–4.29] 0.9923 |
| M0 | 47 (70.15%) | 20 (29.85%) | ||
| Disease stage according to TNM | IVA-IVC | 41 (74.54%) | 14 (25.46%) | 0.49 [0.17–1.40] 0.1846 |
| III | 13 (59.09%) | 9 (40.91%) | ||
| Performance status | >1 | 12 (80.00%) | 3 (20.00%) | 0.52 [0.13–2.07] 0.3575 |
| ≤1 | 42 (67.74%) | 20 (32.26%) | ||
| Excessive alcohol consumption | Yes | 25 (71.43%) | 10 (28.57%) | 0.89 [0.33–2.38] 0.8202 |
| No | 29 (69.05%) | 13 (30.95%) | ||
| Smoking status (ever) | Smoker | 43 (72.88%) | 16 (27.12%) | 0.58 [0.19–1.77] 0.3424 |
| Nonsmoker | 11 (61.11%) | 7 (38.89%) | ||
| Smoking status (currently) [no data n = 18] | Current smoker | 37 (71.15%) | 15 (28.85%) | 2.43 [0.27–21.96] 0.4285 |
| Former smoker | 6 (85.71%) | 1 (14.29%) | ||
| Treatment | Definitive (C)-RT | 21 (77.8%) | 6 (22.2%) | 0.55 [0.19–1.63] 0.2846 |
| Post-operative (C)-RT | 33 (66%) | 17 (34%) | ||
| Concurrent C-RT | Yes | 21 (63.64%) | 12 (36.36%) | 1.71 [0.64–4.58] 0.2831 |
| No | 33 (75.00%) | 11 (25.00%) | ||
| TNFRSF1A genotype | TT | 10 (100.00%) | - | 0.09 [0.01–1.61] 0.1016 |
| GT and GG | 44 (65.67%) | 23 (34.33%) | ||
| GG | 14 (60.87%) | 9 (39.13%) | 1.84 [0.65–5.17] 0.2497 | |
| GT and TT | 40 (74.07%) | 14 (25.93%) | ||
| GT | 30 (68.18%) | 14 (31.82%) | 1.24 [0.46–3.36] 0.6665 | |
| GG and TT | 24 (72.73%) | 9 (27.27%) | ||
| Variable | Parenteral Nutrition | ||||
|---|---|---|---|---|---|
| No | Yes | Univariable Analysis | Multivariable Analysis | ||
| OR [95% CI] p | OR [95% CI] p | ||||
| Gender | Male | 52 (83.9%) | 10 (16.1%) | 0.38 [0.11–1.37] 0.1400 | 0.44 [0.09–2.18] 0.3172 |
| Female | 10 (66.7%) | 5 (33.3%) | |||
| Age [years] | ≥63 | 30 (76.9%) | 9 (23.1%) | 1.60 [0.51–5.04] 0.4218 | 1.61 [0.43–6.07] 0.4783 |
| <63 | 32 (84.2%) | 6 (15.8%) | |||
| Histopathological diagnosis | Squamous-cell carcinoma | 58 (81.7%) | 13 (18.3%) | 0.45 [0.07–2.71] 0.3825 | 0.24 [0.02–2.65] 0.2457 |
| Non-squamous-cell carcinoma | 4 (66.7%) | 2 (33.3%) | |||
| Tumor location | Oropharyngeal | 27 (93.1%) | 2 (6.9%) | 0.20 [0.04–0.96] 0.0443 * | 0.16 [0.03–0.95] 0.0439 * |
| Other a | 35 (72.9%) | 13 (27.1%) | |||
| Larynx | 31 (79.5%) | 8 (20.5%) | 1.14 [0.37–3.54] 0.8168 | 1.56 [0.40–6.07] 0.5164 | |
| Other b | 31 (81.6%) | 7 (18.4%) | |||
| T stage | T4 | 31 (73.8%) | 4 (26.2%) | 0.36 [0.10–1.27] 0.1121 | 0.31 [0.08–1.13] 0.0765 |
| T1–3 | 31 (88.6%) | 11 (11.4%) | |||
| N stage | N1–3 | 41 (82%) | 9 (18%) | 0.77 [0.24–2.45] 0.6558 | 0.51 [0.13–2.03] 0.3390 |
| N0 | 21 (77.8%) | 6 (22.2%) | |||
| M stage | M1 | 5 (50%) | 5 (50%) | 5.70 [1.39–23.35] 0.0155 * | 2.66 [0.54–13.01] 0.2267 |
| M0 | 57 (85.1%) | 10 (14.9%) | |||
| Disease stage according to TNM | IVA-IVC | 44 (80%) | 11 (20%) | 1.12 [0.32–4.00] 0.8556 | 0.41 [0.06–2.77] 0.3620 |
| III | 18 (81.8%) | 4 (18.2) | |||
| Performance status | >1 | 9 (60%) | 6 (40%) | 3.93 [1.12–13.72] 0.0322 * | 3.68 [0.84–16.08] 0.0827 |
| ≤1 | 53 (85.5%) | 9 (14.5%) | |||
| Excessive alcohol consumption | Yes | 25 (71.4%) | 10 (28.6%) | 2.96 [0.90–9.70] 0.0733 | 2.58 [0.67–9.90] 0.1653 |
| No | 37 (88.1%) | 5 (11.9%) | |||
| Smoking status (ever) | Smoker | 47 (79.7%) | 12 (20.3%) | 1.28 [0.32–5.14] 0.7310 | 2.35 [0.38–14.48] 0.3574 |
| Nonsmoker | 15 (83.3%) | 3 (16.7%) | |||
| Smoking status (currently) [no data n = 18] | Current smoker | 40 (81.6%) | 9 (18.4%) | 0.82 [0.26–2.62] 0.7444 | 0.31 [0.04–2.16] 0.2358 |
| Former smoker | 22 (78.6%) | 6 (21.4%) | |||
| Treatment | Definitive (C)-RT | 19 (70.4%) | 8 (29.6%) | 2.59 [0.82–8.16] 0.1051 | 1.68 [0.43–6.54] 0.4177 |
| Post-operative (C)-RT | 43 (86%) | 7 (14%) | |||
| Concurrent C-RT | Yes | 9 (69.2%) | 4 (30.8%) | 2.14 [0.56–8.22] 0.2671 | 2.04 [0.54–7.70] 0.2943 |
| No | 53 (82.8%) | 11 (17.2%) | |||
| NRS-2002 | ≥3 | 20 (87%) | 3 (13%) | 0.52 [0.13–2.07] 0.3575 | 0.58 [0.13–2.67] 0.4900 |
| <3 | 42 (77.8%) | 12 (22.2%) | |||
| SGA | B or C | 47 (78.3%) | 13 (21.7%) | 2.07 [0.42–10.26] 0.3708 | 1.89 [0.27–12.95] 0.5179 |
| A | 15 (88.2%) | 2 (11.8%) | |||
| C | 17 (65.4%) | 9 (34.6%) | 3.97 [1.23–12.84] 0.0213 * | 3.40 [0.93–15.52] 0.0650 | |
| A or B | 45 (88.2%) | 6 (11.8%) | |||
| TNFRSF1A genotype | TT | 7 (70%) | 3 (30%) | 1.96 [0.44–8.71] 0.3744 | 0.71 [0.11–4.52] 0.7165 |
| GT and GG | 55 (82.1%) | 12 (17.9%) | |||
| GG | 19 (82.6%) | 4 (17.4%) | 0.82 [0.23–2.92] 0.7628 | 0.66 [0.15–2.91] 0.5855 | |
| GT and TT | 43 (79.6%) | 11 (20.4%) | |||
| GT | 36 (81.8%) | 8 (18.2%) | 0.82 [0.27–2.56] 0.7399 | 1.74 [0.43–7.01] 0.4341 | |
| GG and TT | 26 (78.8%) | 7 (21.2%) | |||
| Variable | CWL | ||||
|---|---|---|---|---|---|
| No | Yes | Univariable Analysis | Multivariable Analysis | ||
| OR [95% CI] p | OR [95% CI] p | ||||
| Gender | Male | 41 (66.13%) | 21 (33.87%) | 0.58 [0.19–1.83] 0.3583 | 0.56 [0.13–2.39] 0.4314 |
| Female | 8 (53.33%) | 7 (46.67%) | |||
| Age [years] | ≥63 | 22 (56.41%) | 17 (43.59%) | 1.89 [0.74–4.88] 0.1841 | 3.19 [0.90–11.34] 0.0718 |
| <63 | 27 (71.05%) | 11 (28.95%) | |||
| Histopathological diagnosis | Squamous-cell carcinoma | 47 (66.20%) | 24 (33.80%) | 0.25 [0.04–1.49] 0.1300 | 0.31 [0.03–3.25] 0.3312 |
| Non-squamous-cell carcinoma | 2 (33.33%) | 4 (66.67%) | |||
| Tumor location | Oropharyngeal | 10 (34.48%) | 19 (65.52%) | 8.23 [2.86–23.63] 0.0001 * | 15.28 [4.22–55.39] <0.0001 * |
| Other a | 39 (81.25%) | 9 (18.75%) | |||
| Larynx | 34 (87.18%) | 5 (12.82%) | 0.09 [0.03–0.30] 0.0001 * | 0.05 [0.009–0.23] 0.0001 * | |
| Other b | 15 (39.47%) | 23 (60.53%) | |||
| T stage | T4 | 21 (60.00%) | 14 (40.00%) | 1.81 [0.73–4.51] 0.2028 | 1.21 [0.36–4.08] 0.7490 |
| T1–3 | 38 (73.08%) | 14 (26.92%) | |||
| N stage | N1–3 | 33 (66.00%) | 17 (34.00%) | 0.75 [0.28–1.94] 0.5579 | 0.69 [0.20–2.36] 0.5545 |
| N0 | 16 (59.26%) | 11 (40.74%) | |||
| M stage | M1 | 7 (100.00%) | 3 (30.00%) | 0.72 [0.17–3.04] 0.6548 | 0.80 [0.13–5.00] 0.8097 |
| M0 | 42 (62.69%) | 25 (37.31%) | |||
| Disease stage according to TNM | IVA-IVC | 34 (61.82%) | 21 (38.18%) | 1.32 [0.46–3.78] 0.6005 | 0.91 [0.24–3.47] 0.8965 |
| III | 15 (68.19%) | 7 (31.82%) | |||
| Performance status | >1 | 9 (60.00%) | 6 (40.00%) | 1.21 [0.38–3.85] 0.744 | 0.62 [0.14–2.82] 0.5396 |
| ≤1 | 40 (64.52%) | 22 (35.48%) | |||
| Excessive alcohol consumption | Yes | 23 (65.71%) | 12 (34.29%) | 0.85 [0.33–2.16] 0.7294 | 0.90 [0.27–2.96] 0.8645 |
| No | 26 (61.90%) | 16 (38.10%) | |||
| Smoking status (ever) | Smoker | 35 (59.32%) | 24 (40.68%) | 2.40 [0.71–8.13] 0.1618 | 3.83 [0.87–16.85] 0.0759 |
| Nonsmoker | 14 (77.78%) | 4 (22.22%) | |||
| Smoking status (currently) [no data n = 18] | Current smoker | 31 (59.61%) | 21 (40.38%) | 0.90 [0.18–4.46] 0.9005 | 0.96 [0.10–9.70] 0.9764 |
| Former smoker | 4 (57.14%) | 3 (42.86%) | |||
| Treatment | Definitive (C)-RT | 14 (51.9%) | 13 (48.1%) | 2.17 [0.82–5.70] 0.1172 | 3.32 [0.89] 0.0731 |
| Post-operative (C)-RT | 35 (70%) | 15 (30%) | |||
| Concurrent C-RT | Yes | 21 (63.64%) | 12 (36.36%) | 1.00 [0.39–2.56] 1.0000 | 0.41 [0.11–1.50] 0.1799 |
| No | 28 (63.64%) | 16 (36.36%) | |||
| NRS-2002 | ≥3 | 17 (73.91%) | 6 (26.09%) | 0.51 [0.17–1.51] 0.2252 | 0.51 [0.13–2.06] 0.3475 |
| <3 | 32 (59.26%) | 22 (40.74%) | |||
| SGA | B or C | 40 (66.67%) | 20 (33.33%) | 0.56 [0.19–1.68] 0.3023 | 1.00 [0.25–3.92] 0.9980 |
| A | 9 (52.94%) | 8 (47.06%) | |||
| C | 13 (50%) | 13 (50%) | 2.40 [0.90–6.37] 0.0789 | 0.98 [0.26–3.62] 0.9725 | |
| A or B | 36 (70.59%) | 15 (29.41%) | |||
| Parenteral nutrition | Yes | 10 (66.67%) | 5 (33.33%) | 0.84 [0.26–2.79] 0.7858 | 1.54 [0.31–7.76] 0.5995 |
| No | 39 (62.90%) | 23 (37.10%) | |||
| TNFRSF1A genotype | TT | 2 (20.00%) | 8 (80.00%) | 9.40 [1.83–48.24] 0.0072 * | 24.85 [3.74–168.89] 0.0009 * |
| GT and GG | 47 (70.15%) | 20 (29.85%) | |||
| GG | 19 (82.61%) | 4 (17.39%) | 0.26 [0.08–0.88] 0.0298 * | 0.24 [0.6–0.94] 0.0398 * | |
| GT and TT | 30 (55.56%) | 24 (44.44%) | |||
| GT | 28 (63.64%) | 16 (36.36%) | 1.00 [0.39–2.55] 1.0000 | 0.71 [0.24–2.10] 0.5331 | |
| GG and TT | 21 (63.64%) | 12 (36.36%) | |||
| Variable | Univariable Analysis | Multivariable Analysis | ||
|---|---|---|---|---|
| mOS (Months) | HR [95% CI] p | HR [95% CI] p | ||
| Gender | Male | 26 | 0.82 [0.41–1.66] 0.5537 | 0.58 [0.29–1.17] 0.1335 |
| Female | 23.5 | |||
| Age (years) | ≥63 | 25 | 1.02 [0.60–1.74] 0.9246 | 0.99 [0.96–1.03] 0.8692 |
| <63 | 26.5 | |||
| Smoking history (ever) | Yes | 24.5 | 1.36 [0.77–2.41] 0.2777 | 0.94 [0.47–1.89] 0.8734 |
| No | 26 | |||
| Smoking during treatment [no data n = 18] | Yes | 25 | 1.32 [0.77–2.25] 0.3006 | 1.11 [0.60–2.06] 0.7298 |
| No | 26 | |||
| Excessive alcohol consumption | Yes | 26.5 | 0.82 [0.48–1.39] 0.4562 | 0.66 [0.36–1.23] 0.1930 |
| No | 24.5 | |||
| Performance status | >1 | 19.5 | 1.34 [0.67–2.72] 0.3480 | 1.63 [0.81–3.30] 0.1742 |
| ≤1 | 26 | |||
| Tumor location | Oropharynx | 23.5 | 0.87 [0.51–1.49] 0.6106 | 0.83 [0.38–1.82] 0.6489 |
| Other a | 25 | |||
| Larynx | 26 | 0.96 [0.57–1.64] 0.8941 | 0.85 [0.41–1.76] 0.6671 | |
| Other b | 23.5 | |||
| T stage | T4 | 23 | 1.92 [1.07–3.43] 0.0093 * | 2.07 [1.13–3.80] 0.0193 * |
| T1-T3 | 30 | |||
| N stage | N1–3 | 25 | 1.29 [0.76–2.20] 0.3204 | 0.85 [0.41–1.78] 0.6692 |
| N0 | 26 | |||
| M stage | M1 | 19 | 1.29 [0.57–2.95] 0.4898 | 1.04 [0.46–2.32] 0.9251 |
| M0 | 25 | |||
| Disease stage according to TNM | IVA-IVC | 24.5 | 1.89 [1.11–3.23] 0.0171 * | 2.47 [1.16–5.28] 0.0203 * |
| III | 29 | |||
| Parenteral nutrition | Yes | 20 | 1.28 [0.64–2.55] 0.4359 | 1.23 [0.58–2.61] 0.5939 |
| No | 30.65 | |||
| Treatment | Definitive (C)-RT | 26.5 | 0.84 [0.49–1.46] 0.5026 | 0.84 [0.45–1.58] 0.6000 |
| Post-operative (C)-RT | 19 | |||
| Concurrent C-RT | Yes | 26.5 | 0.92 [0.54–1.57] 0.7643 | 1.25 [0.65–2.37] 0.5033 |
| No | 24.5 | |||
| SGA | C | 23 | 1.35 [0.75–2.43] 0.2712 | 0.72 [0.32–1.60] 0.4194 |
| A or B | 26 | |||
| B or C | 23 | 2.27 [1.31–3.93] 0.0072 * | 1.66 [0.66–4.16] 0.2844 | |
| A | 35 | |||
| NRS-2002 | ≥3 | 24.5 | 0.88 [0.49–1.56] 0.6597 | 0.77 [0.35–1.68] 0.5165 |
| <3 | 26 | |||
| CWL | Yes | 18.5 | 1.91 [1.02–3.57] 0.0142 * | 1.92 [1.05–3.54] 0.0364 * |
| No | 27 | |||
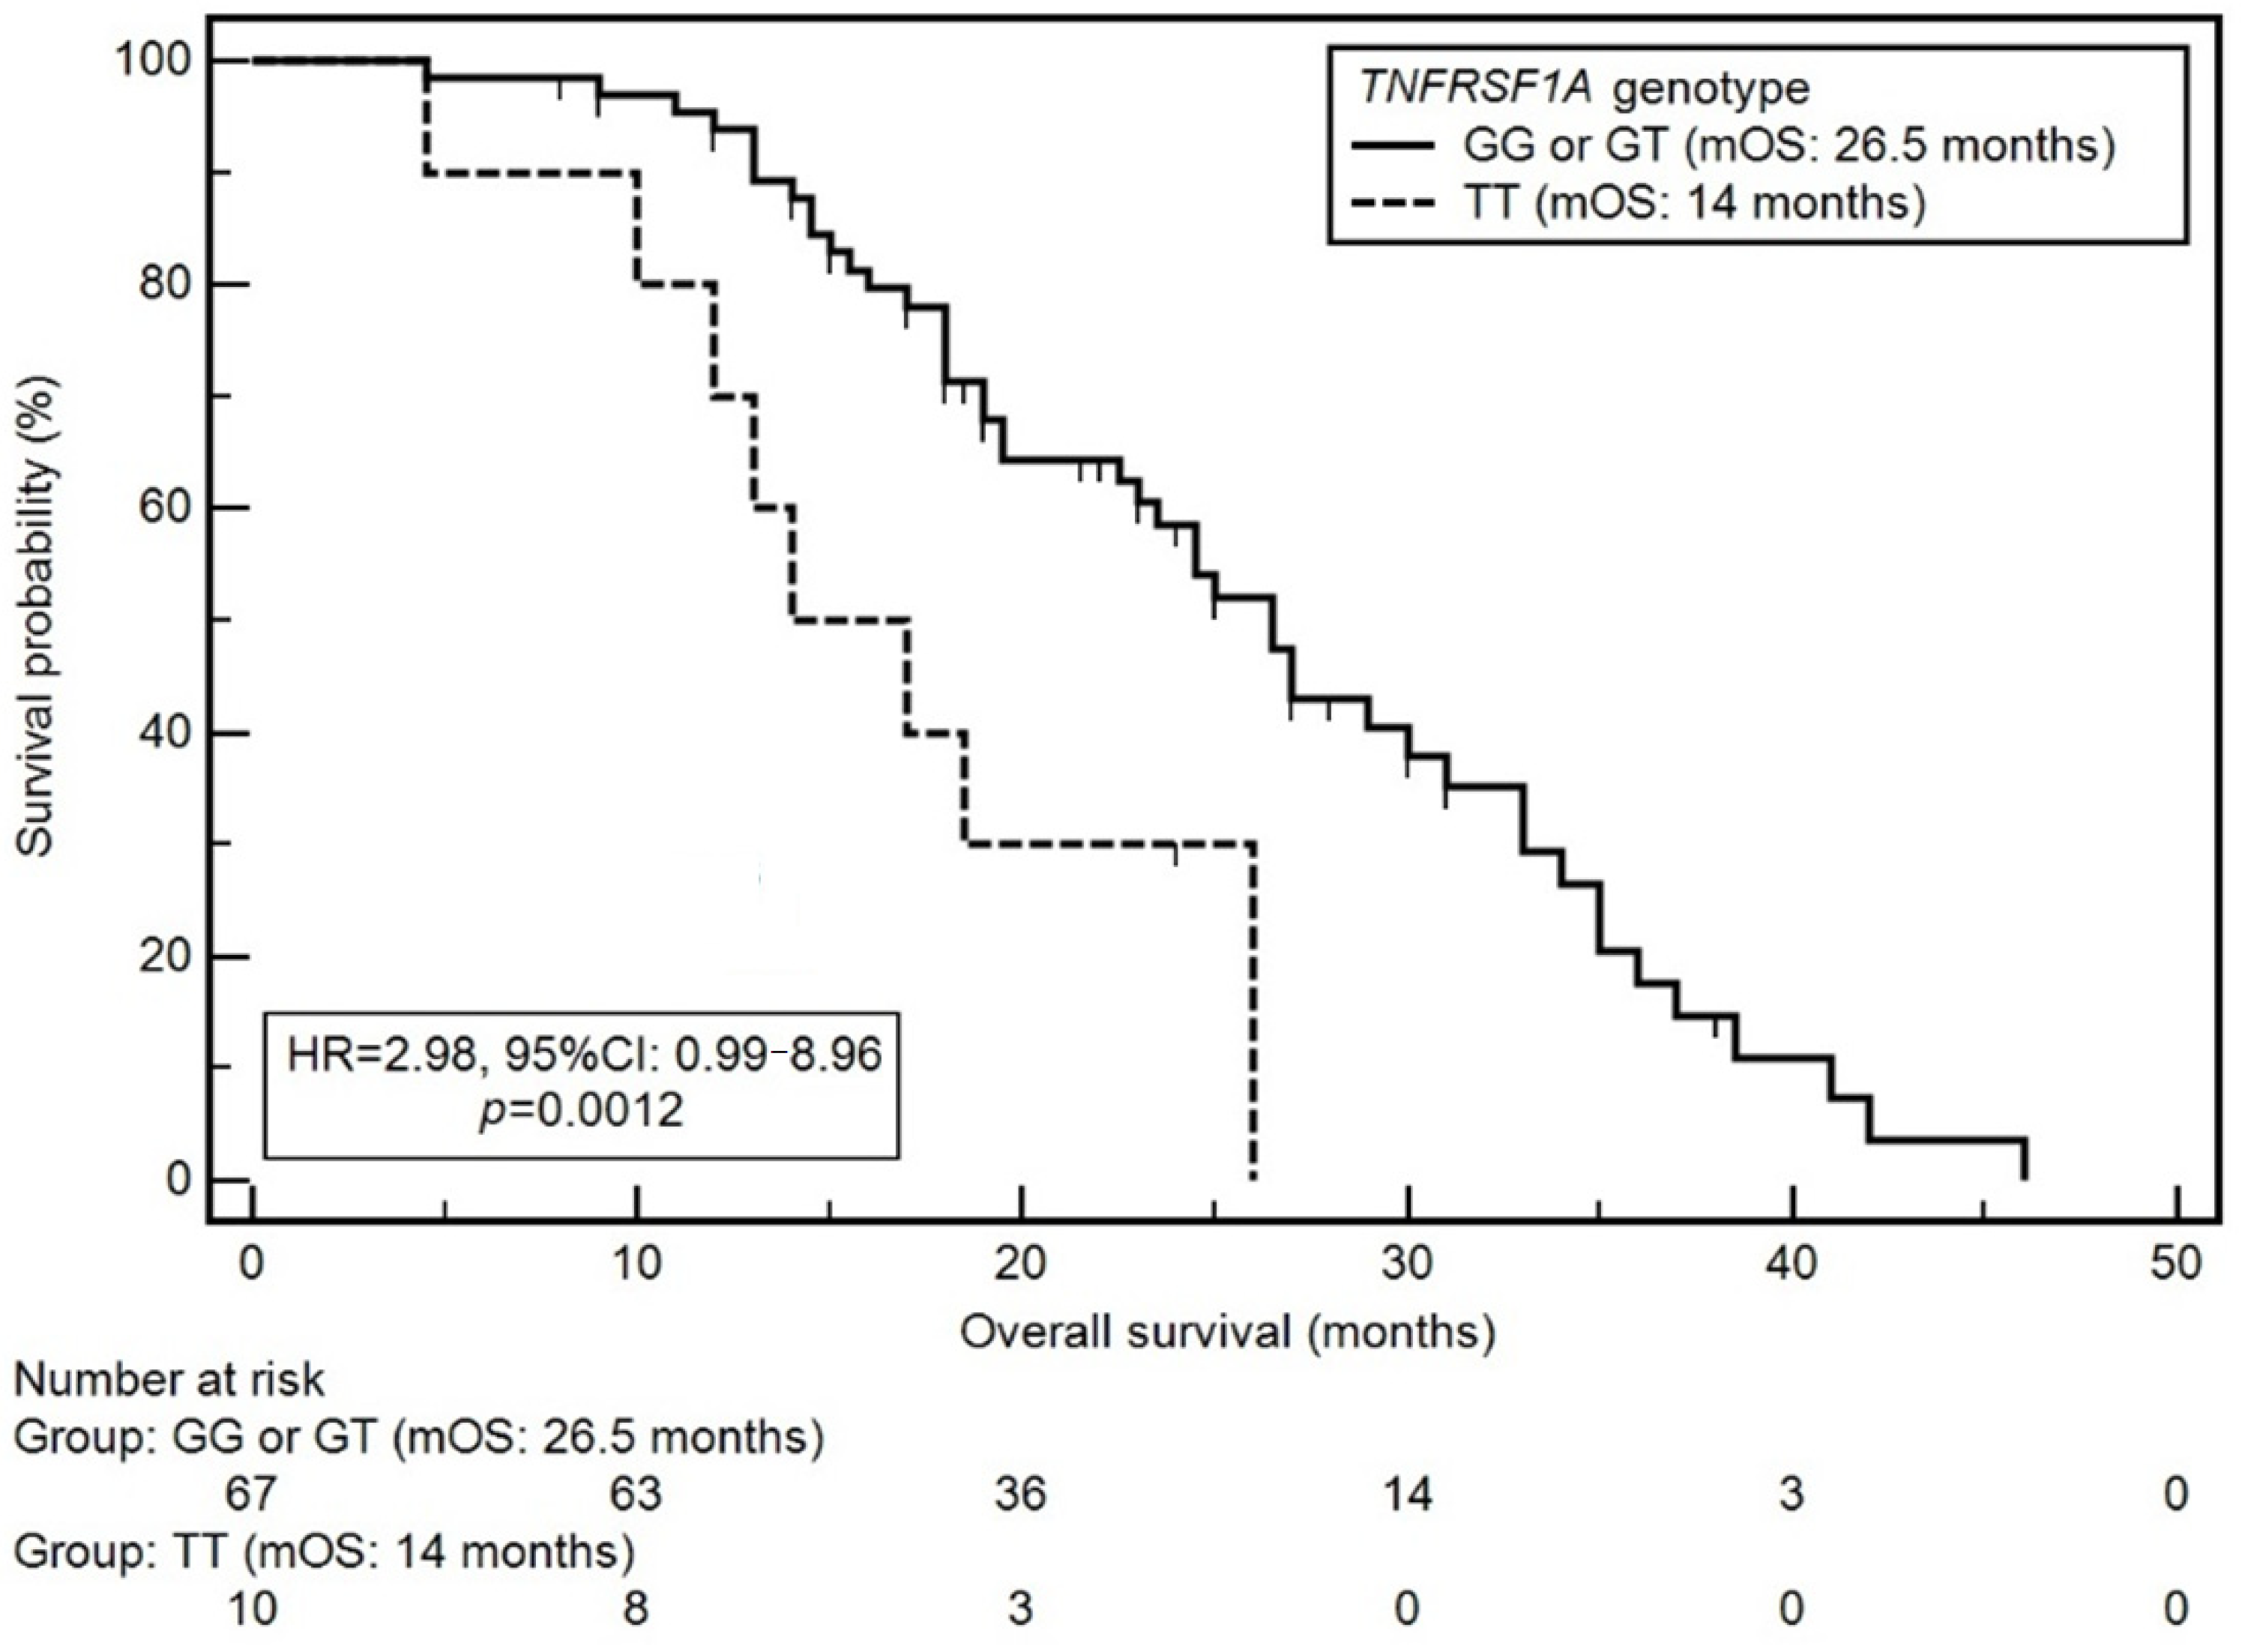
| TNFRSF1A genotype | TT | 14 | 2.98 [0.99–8.96] 0.0012 * | 3.02 [1.40–6.50] 0.0051 * |
| GG or GT | 26.5 | |||
| GG | 27 | 0.67 [0.39–1.17] 0.1750 | 0.79 [0.36–1.73] 0.5606 | |
| GT or TT | 23.5 | |||
| GT | 26.5 | 0.93 [0.54–1.59] 0.7842 | 1.26 [0.58–2.75] 0.5606 | |
| GG or TT | 25 | |||
Publisher’s Note: MDPI stays neutral with regard to jurisdictional claims in published maps and institutional affiliations. |
© 2022 by the authors. Licensee MDPI, Basel, Switzerland. This article is an open access article distributed under the terms and conditions of the Creative Commons Attribution (CC BY) license (https://creativecommons.org/licenses/by/4.0/).
Share and Cite
Homa-Mlak, I.; Mlak, R.; Mazurek, M.; Brzozowska, A.; Powrózek, T.; Rahnama-Hezavah, M.; Małecka-Massalska, T. TNFRSF1A Gene Polymorphism (−610 T > G, rs4149570) as a Predictor of Malnutrition and a Prognostic Factor in Patients Subjected to Intensity-Modulated Radiation Therapy Due to Head and Neck Cancer. Cancers 2022, 14, 3407. https://doi.org/10.3390/cancers14143407
Homa-Mlak I, Mlak R, Mazurek M, Brzozowska A, Powrózek T, Rahnama-Hezavah M, Małecka-Massalska T. TNFRSF1A Gene Polymorphism (−610 T > G, rs4149570) as a Predictor of Malnutrition and a Prognostic Factor in Patients Subjected to Intensity-Modulated Radiation Therapy Due to Head and Neck Cancer. Cancers. 2022; 14(14):3407. https://doi.org/10.3390/cancers14143407
Chicago/Turabian StyleHoma-Mlak, Iwona, Radosław Mlak, Marcin Mazurek, Anna Brzozowska, Tomasz Powrózek, Mansur Rahnama-Hezavah, and Teresa Małecka-Massalska. 2022. "TNFRSF1A Gene Polymorphism (−610 T > G, rs4149570) as a Predictor of Malnutrition and a Prognostic Factor in Patients Subjected to Intensity-Modulated Radiation Therapy Due to Head and Neck Cancer" Cancers 14, no. 14: 3407. https://doi.org/10.3390/cancers14143407