Next Article in Journal
ED-B-Containing Isoform of Fibronectin in Tumor Microenvironment of Thymomas: A Target for a Theragnostic Approach
Next Article in Special Issue
Inhibition of a Mitochondrial Potassium Channel in Combination with Gemcitabine and Abraxane Drastically Reduces Pancreatic Ductal Adenocarcinoma in an Immunocompetent Orthotopic Murine Model
Previous Article in Journal
Recent Applications of Artificial Intelligence from Histopathologic Image-Based Prediction of Microsatellite Instability in Solid Cancers: A Systematic Review
Previous Article in Special Issue
Calcium Channel Blocker Use and the Risk for Breast Cancer: A Population-Based Nested Case-Control Study
 
 
Correction published on 26 May 2023, see Cancers 2023, 15(11), 2925.
Article

Design of New Potent and Selective Thiophene-Based KV1.3 Inhibitors and Their Potential for Anticancer Activity

1
Faculty of Pharmacy, University of Ljubljana, Aškerčeva 7, 1000 Ljubljana, Slovenia
2
Campus Gasthuisberg, University of Leuven, Toxicology and Pharmacology, Onderwijs en Navorsing 2, Herestraat 49, 3000 Leuven, Belgium
3
AG Oncophysiology, Max-Planck Institute for Multidisciplinary Sciences, Hermann-Rein-Str. 3, 37075 Göttingen, Germany
4
Laboratory for Molecular, Cellular and Network Excitability, Department of Biomedical Sciences, University of Antwerp, 2610 Wilrijk, Belgium
5
Department of Basic and Applied Medical Sciences, Ghent University, Corneel Heymanslaan 10 (Entrance 36), 9000 Ghent, Belgium
*
Author to whom correspondence should be addressed.
Cancers 2022, 14(11), 2595; https://doi.org/10.3390/cancers14112595
Submission received: 25 April 2022 / Revised: 16 May 2022 / Accepted: 17 May 2022 / Published: 24 May 2022 / Corrected: 26 May 2023
(This article belongs to the Collection Ion Channels in Cancer Therapies)

Abstract

:

Simple Summary

In this article, we describe the discovery of a new class of potent and selective thiophene-based inhibitors of the voltage-gated potassium channel KV1.3 and their potential to induce apoptosis and inhibit proliferation. The KV1.3 channel has only recently emerged as a molecular target in cancer therapy. The most potent KV1.3 inhibitor 44 had an IC50 KV1.3 value of 470 nM (oocytes) and 950 nM (Ltk cells) and appropriate selectivity for other KV channels. New KV1.3 inhibitors significantly inhibited proliferation of Panc-1 cells and KV1.3 inhibitor 4 induced significant apoptosis in tumor spheroids of Colo-357 cells.

Abstract

The voltage-gated potassium channel KV1.3 has been recognized as a tumor marker and represents a promising new target for the discovery of new anticancer drugs. We designed a novel structural class of KV1.3 inhibitors through structural optimization of benzamide-based hit compounds and structure-activity relationship studies. The potency and selectivity of the new KV1.3 inhibitors were investigated using whole-cell patch- and voltage-clamp experiments. 2D and 3D cell models were used to determine antiproliferative activity. Structural optimization resulted in the most potent and selective KV1.3 inhibitor 44 in the series with an IC50 value of 470 nM in oocytes and 950 nM in Ltk cells. KV1.3 inhibitor 4 induced significant apoptosis in Colo-357 spheroids, while 14, 37, 43, and 44 significantly inhibited Panc-1 proliferation.

1. Introduction

The voltage-gated potassium channel KV1.3 is a transmembrane protein belonging to the KV1 (Shaker) subfamily, which is the largest subfamily of voltage-gated potassium channels with eight members (KV1.1–KV1.8). KV1.3 is formed by four monomers, each containing six transmembrane segments (S1–S6) [1]. The S5–S6 domain of each monomer assembles to form the K+ conducting pore that is surrounded by four voltage sensor domains (VSD), each consisting of segments S1 to S4. The VSDs detect depolarization of the membrane and initiate conformational changes that lead to the opening of the pore. The selectivity filter in the K+ conducting pore consists of oxygen cages that mimic the hydration shell of potassium in solution and allow the rapid and selective passage of potassium ions [2,3,4].
The KV1.3 channel has only recently emerged as a molecular target in cancer therapy. Cancer cells display mutations enabling extensive proliferation and resistance to apoptosis. KV1.3 channel activity has been found to be involved in cell proliferation, migration, and invasion, which are among the most important processes in cancer progression. Moreover, overexpression of KV1.3 enhances tumorigenic processes and promotes tumor progression [5,6,7,8]. The use of small-molecule KV1.3 inhibitors could selectively suppress the proliferation of cancer cells, thus providing a new potential therapeutic approach [9]. Although KV1.3 has been recognized as a tumor marker in cancer tissues with predominantly higher KV1.3 expression, a clear pattern of altered KV1.3 expression in cancer cells compared with healthy cells has not yet been found. The type and stage of disease also influence KV1.3 expression. Up-regulated KV1.3 expression was detected in breast, colon, and prostate tumors, in smooth muscle and skeletal muscle cancers, and in mature neoplastic B cells in chronic lymphocytic leukemia [10].
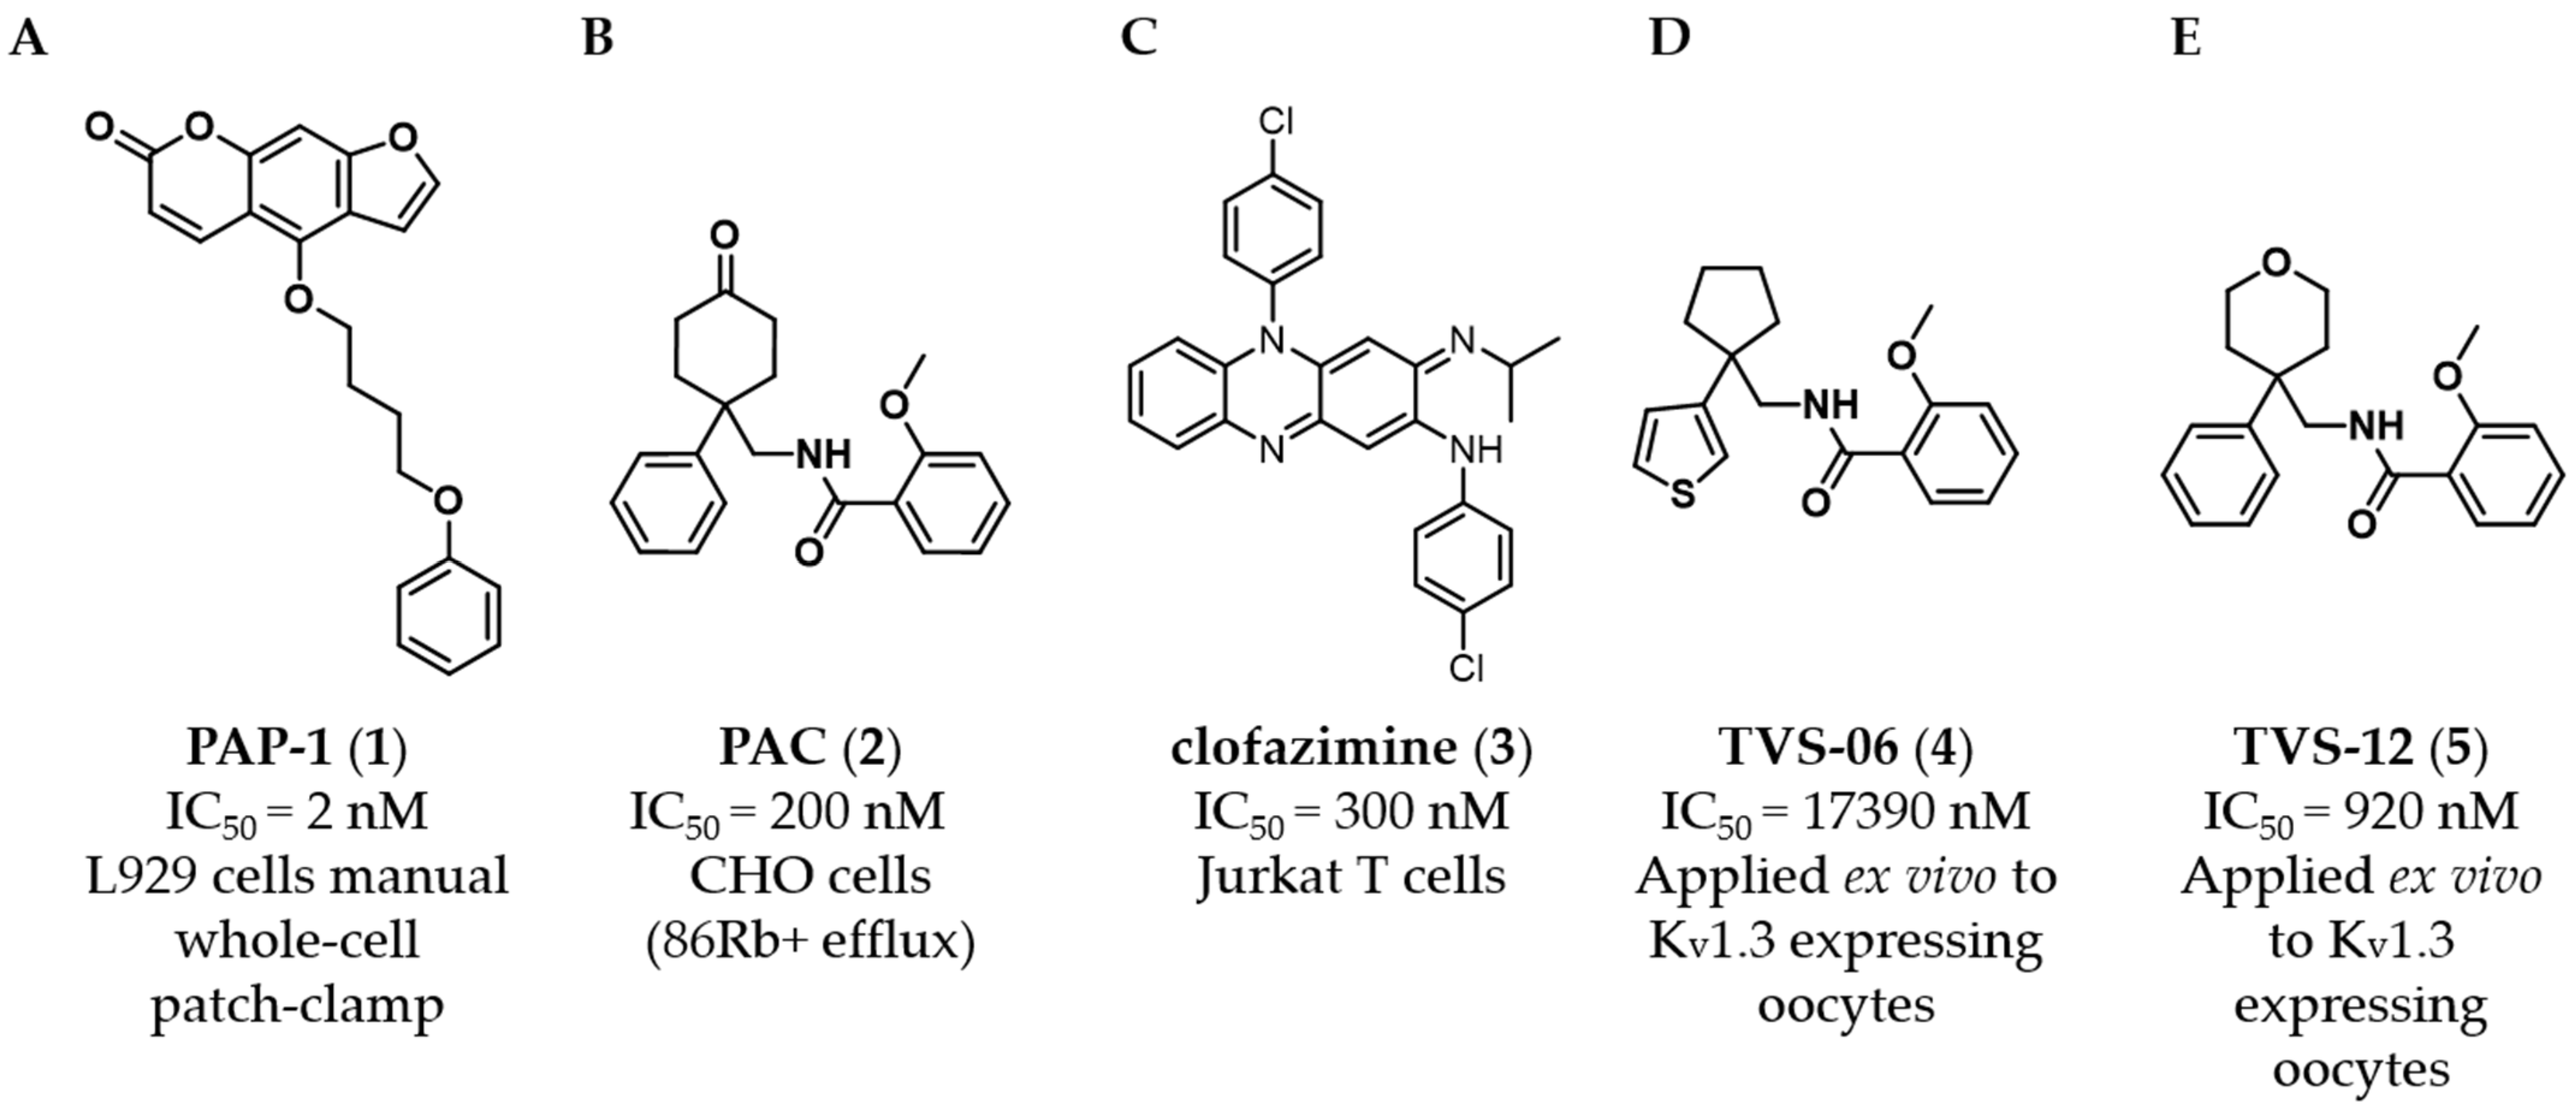
To date, several small-molecule KV1.3 inhibitors have been discovered (Figure 1) [11,12,13]. Originally, KV1.3 inhibitors were extensively studied to selectively target the proliferation of effector memory T (TEM) cells in the immune system and to develop a new therapy for T-cell—mediated autoimmune and chronic inflammatory diseases [14]. However, none of these compounds have been optimised to have suitable properties for clinical trials. Since KV1 family channels have high subtype homology, it is very difficult to find a potent isoform-selective KV1.3 inhibitor [15]. For most of the described compounds, only low or moderate selectivity towards other Kv1.x channels was achieved, preventing subsequent optimization. Cryogenic electron microscopy (cryoEM) was recently used to determine the structures of human KV1.3 alone and bound to dalazatide, which may aid the structure-based design of new inhibitors in the future. To date, the exact binding site for most known KV1.3 inhibitors has not been experimentally demonstrated, and these new cryoEM structures may help to solve this problem [16,17].
The psoralen derivative PAP-1 (1, Figure 1A) is the most potent (IC50 = 2 nM, L929 cells, manual whole-cell patch clamp) and selective (i.e., 23-fold over KV1.5) small-molecule KV1.3 inhibitor known [11]. Benzamide PAC (2, Figure 1B), which inhibits KV1.3 with an IC50 of 200 nM (CHO cells, 86Rb+ efflux), is not selective toward KV1.x family channels [12]. The antimycobacterial drug clofazimine (3, Figure 1C,) is also a KV1.3 inhibitor (IC50 = 300 nM, Jurkat T cells), inhibiting KV1.3 with tenfold higher potency than KV1.1, KV1.2, KV1.5 and KV3.1 [13]. PAP-1 (1) at a concentration of 20 µM, and clofazimine (3) at a concentration of 1 or 10 µM in combination with the multi-drug resistance (MDR) pump inhibitors (MDRi) cyclosporine H (4 µM) and probenecid (100 µM), which induced mild apoptosis in cancer cells (human SAOS2, mouse B16F10 melanoma, and human B-CLL) by specifically inhibiting KV1.3. Similarly, clofazimine (3) induced significant apoptosis in several pancreatic ductal adenocarcinoma (PDAC) cell lines with EC50 values in the micromolar range and significantly reduced primary tumor weight in an orthotopic PDAC xenotransplantation model in SCID beige mice [18,19,20].
In previous work, we identified two new KV1.3 inhibitors by virtual screening based on a 3D similarity search using the KV1.3 inhibitor PAC (2, Figure 1B) as a query [21]. Hit compound 4 (Figure 1D), with an IC50 of 17.4 µM, was a much weaker KV1.3 inhibitor than hit compound 5 (Figure 1E), with an IC50 of 920 nM (applied ex vivo in Xenopus oocytes expressing KV1.3). However, Kv1.3 inhibitor 4 exhibited a good selectivity profile and did not affect other KV1.x family channels or more distantly related channels. In this paper, we describe the optimization of new thiophene-based Kv1.3 inhibitors, their selectivity profile against KV1.x and some other selected ion channels, and the potential of this new class of Kv1.3 inhibitors for antiproliferative activity in 2D and 3D cell models.

2. Materials and Methods

2.1. Oocyte Collection, Oocyte Injection, Drug Solutions, Electrophysiological Recordings, and Statistical Analysis in Xenopus Laevis Oocytes

Stage V–VI oocytes [21] were isolated by partial ovariectomy from Xenopus laevis frogs (African clawed frogs). Mature female frogs were purchased from CRB Xénopes (Rennes, France) and were housed in the Aquatic Facility (KU Leuven) in compliance with the regulations of the European Union (EU) concerning the welfare of laboratory animals as declared in Directive 2010/63/EU. The use of Xenopus laevis was approved by the Animal Ethics Committee of the KU Leuven (Project nr. P186/2019). After anaesthetizing the frogs by a 15-min submersion in 0.1% tricaine methanesulfonate (amino benzoic acid ethyl ester; Merck, Kenilworth, NJ, USA), pH 7.0, the oocytes were collected. The isolated oocytes were then washed with a 1.5 mg/mL collagenase solution for 2 h to remove the follicle layer.
Ion channels (Kv1.x, Kv2.1, Kv4.2, Kv10.1) were expressed in Xenopus laevis oocytes by linearization of the plasmids and subsequent in vitro transcription using a commercial T7 or SP6 mMESSAGE mMACHINE transcription kit (Ambion, Carlsbad, California, USA). Defolliculated Xenopus oocytes were then injected with 20–50 nL of the cRNA at a concentration of 1 ng/nL using a micro-injector (Drummond Scientific1, Broomall, PA, USA). The oocytes were incubated in a solution containing (in mM): NaCl, 96; KCl, 2; CaCl2, 1.8; MgCl2, 2 and HEPES, 5 (pH 7.5), supplemented with 50 mg/L gentamycin sulfate and 90 mg/L theophylline. After ex vivo translation, the ion channels were correctly inserted in the cell membrane of the oocytes.
Two-electrode voltage-clamp recordings were performed at room temperature (18–22 °C) using a Geneclamp 500 amplifier (Molecular Devices, San Jose, CA, USA) and pClamp data acquisition (Axon Instruments, Union City, CA, USA) and using an integrated digital TEVC amplifier controlled by HiClamp, an automated Voltage-Clamp Screening System (Multi Channel Systems MCS GmbH, Reutlingen, Germany). Whole-cell currents from oocytes were recorded 1–4 days after injection. The bath solution composition was ND96 (in mM): NaCl, 96; KCl, 2; CaCl2, 1.8; MgCl2, 2 and HEPES, 5 (pH 7.5). Voltage and current electrodes were filled with a 3 M solution of KCl in H2O. Resistances of both electrodes were kept between 0.5 and 1.5 MΩ. The elicited Kv1.x, Kv2.1, Kv4.2 and Kv10.1 currents were filtered at 0.5 kHz and sampled at 2 kHz using a four-pole low-pass Bessel filter. Leak subtraction was performed using a P/4 protocol [21].
For the electrophysiological analysis of the compounds, a number of protocols were applied from a holding potential of −90 mV. Currents for Kv1.x, Kv2.1, Kv4.2 and Kv10.1 were evoked by 1 s depolarizing pulses either to 0 mV or to a range of voltage steps between −80 mV and +40 mV. For the analysis of the data, only the inhibition at the 0 mV step was used. The concentration dependency of all compounds was assessed by measuring the current inhibition in the presence of increasing compound concentrations. To this end, a stock solution of the compounds was prepared in 100% DMSO for the sake of solubility. From this stock solution, adequate dilutions with a maximum of 0.5% DMSO were made for testing. The data of the concentration-response curves were fitted with the Hill equation: y = 100/{1 + (IC50/[compound])h}, where y is the amplitude of the compound-induced effect, IC50 is the compound concentration at half-maximal efficacy, [compound] is the compound concentration, and h is the Hill coefficient.
All electrophysiological data (Figure S1) are presented as means ± S.E.M of n ≥ three independent experiments unless otherwise indicated. All data were analyzed using pClamp Clampfit 10.4 (Molecular Devices, Downingtown, PA, USA), OriginPro 9 (Originlab, Northampton, MA, USA), GraphPad Prism 8 software (GraphPad Software, Inc., San Diego, CA, USA) and DataMining (Multi Channel Systems MCS GmbH, Reutlingen, Germany). The Dunnett test and one-way ANOVA were performed to calculate the significance of the induced inhibition compared to the control.

2.2. Cell Culture, Transfection, Drug Solutions, Electrophysiological Recordings, and Statistical Analysis in Ltk Cells

Ltk cells were cultured in Dulbecco’s Modified Eagle Medium (DMEM) supplemented with 10% horse serum and 1% penicillin/streptomycin (Invitrogen, Waltham, CA, USA). Human hKV1.3 channels were transiently expressed in these Ltk cells by transfecting subconfluent 60 × 15 mm cell culture dishes (Corning, NY, USA) with 1-1.5 µg plasmid DNA containing the hKv1.3 sequence (KCNA3) using lipofectamine 2000 (Thermo Fisher Scientific, Waltham, MA, USA), according to the manufacturer’s protocol. The coding sequence of hKv1.3 was cloned in a pEGFP plasmid without removing the stop codon (i.e., eGFP was not transcribed). Therefore, during transfection 0.5 µg of pEGFP plasmid (expressing eGFP) was added as transfection marker Cells were collected 24h post-transfection using a 0.05% trypsin-EDTA solution (Thermo Fisher Scientific, Waltham, MA, USA) and transferred to the recording chamber mounted on the stage of an inverted Nikon Eclipse TE2000 fluorescence microscope (Nikon, Minato, Japan). The compounds were dissolved in 100% DMSO and stock solutions were stored at -20°C. Before use, the stock concentrations were diluted with extracellular recording solution to appropriate concentrations, making sure that the final DMSO concentration never exceeded 0.1%. A 0.1% DMSO solution was prepared as a vehicle control.
All recordings were conducted at room temperature (20–23 °C) in the whole-cell configuration using an axopatch 200b amplifier (Molecular Devices, San Jose, CA, USA). Applied voltage pulse protocols and current recordings were controlled with pClamp 10 software and digitized using an axon digidata 1440 (Molecular Devices, San Jose, CA, USA). The cells in the recording chamber were continuously superfused with an extracellular solution (containing in mM): NaCl 145, KCl 4, MgCl2 1, CaCl2 1.8, HEPES 10, and glucose 10 (adjusted to pH 7.35 with NaOH). Patch pipettes were pulled from borosilicate glass (World Precision Instruments, Sarasota, FL, USA), using a P-2000 puller (Sutter Instruments, Novato, CA, USA), with resistances ranging from 1.5–2 MΩ. These pipettes were backfilled with an intracellular solution (containing in mM): KCl 110, K2ATP 5, MgCl2 2, HEPES 10, and K4BAPTA 5 (adjusted to pH 7.2 with KOH). Junction potentials were zeroed with the filled pipette in the extracellular solution of the recording chamber. A series resistance compensation of 80% was employed. Recordings were passed through a 5 kHz low-pass filter while being sampled at 10 kHz. A single step from holding potential (−80 mV) to +40 mV was utilized to monitor KV1.3 current inhibition. The pulse duration was 200 ms with an interpulse interval of 15 s. As PAP-1 blocks KV1.3 in a use-dependent manner, by preferentially binding to the channels C-type inactivated state, the protocol was slightly modified: the pulse duration and interval between pulses were increased to 2 s and 30 s, respectively [11]. A longer pulse duration maximizes the number of channels in their inactivated state. Different concentrations of the compounds were independently added to the recording chamber in the vicinity of the cell investigated using a pressurized fast-perfusion system (custom built with electro-fluidic valves from the Lee Company, Westbrook, CT, USA).
The data was analyzed with pClamp 10 software (Molecular Devices, San Jose, CA, USA), and the dose-response curves shown were made using Sigmaplot 11.0 (Systat software, Palo Alto, CA USA). Data was excluded when the estimated voltage error exceeded 5mV after series resistance compensation. Dose-response curves were obtained by plotting y, the normalized current, as a function of compound concentration. Results are expressed as mean ± SEM, with n being the number of cells analyzed. EC50 values were determined by fitting the Hill equation to the dose-response curve.

2.3. Cell Culture for Apoptosis and Proliferation Assays

Cell lines Panc-1 (ACC 783) and Colo-357 (CVCL_0221) were obtained through the validated collection of the pHioniC consortium (MSC-ITN 813834). Both cell lines were grown in RPMI1640, supplemented with 1 mM sodium pyruvate and 1% Glutamax (all Gibco Thermo-Fisher, Waltham, MA USA) 10%FBS (BioChrom, Berlin, Germany), at 5% CO2 and 37 °C in a humidified atmosphere.

2.4. Apoptosis and Proliferation Assays

For cell proliferation assays, cells were seeded at a density of 10,000 cells/well in 96-well flat bottom culture plates (Corning, Kaiseslautern, Germany) and proliferation was measured through culture confluency using an IncuCyte device (Sartorius, Göttingen, Germany). Every hour, two phase contrast images per well were acquired, and a confluency mask was generated by training the analysis algorithm using representative images. Every image was then analyzed using the obtained parameters to determine culture confluency. Treatments were then added when cells reached a confluency of ~30% (Panc-1) or ~55% (Colo-357), and proliferation was determined for the following 60 h. Proliferation is reported as confluency increase with respect to the start of the treatment.
Spheroids were cultured in round bottom ultra-low attachment 96-well plates (Corning). The optimal seeding densities were empirically determined (8000 cells/well for Colo-357 or 10,000 cells/well for Panc-1 spheroids. The cells were suspended in 2% Matrigel (Corning), centrifuged at 1000× g for 10 min and the spheroids were allowed to form in the incubator. Once the spheroids were formed, the treatments indicated together with 8.9 µM cycloheximide (as apoptosis sensitizer) were added and apoptosis was determined by live imaging in the Incucyte system in real time for approximately 60 h using Caspase-3/7 green reagent (Sartorius) as a reporter of apoptosis, which crosses the cell membrane and is cleaved by the activated Caspase-3/7, resulting in the fluorescent staining of nuclear DNA. Apoptosis on Panc-1 tumor spheroids is presented as integrated green fluorescence in the whole spheroid.

2.5. Ligand-Based Pharmacophore Modeling

Nine KV1.3 inhibitors with inhibition greater than 75% at 10 µM were used as a training set for the generation of ten pharmacophore models in LigandScout 4.4 Expert (Inte:Ligand GmbH, Vienna, Austria) [22]. For each inhibitor, a maximum of 200 conformations were computed using iCon algorithm in LigandScout [23] with default “BEST” settings. Ten ligand-based pharmacophore models were created using the default settings. For each of the models, the creation of exclusion volumes coat around the alignment of the ligands was enabled. For the interaction analyses and image preparation, the highest ranked ligand-based pharmacophore model was used.

2.6. Turbidimetric Solubility Assay

For the phosphate-buffered saline, we dissolved 2.38 g of disodium hydrogen phosphate dodecahydrate, 0.19 g of potassium dihydrogen phosphate, and 8.0 g of sodium chloride in water and diluted it to 1000 mL with the same solvent. Then we adjusted the pH to 7.4. The stock DMSO solutions of the compounds were prepared at concentrations of 50 mM, 20 mM, 10 mM, and 1 mM. The final solutions (500 µM, 200 µM, 100 µM, and 10 µM) were prepared by adding 2 µL of the stock DMSO solution to 198 µL of phosphate-buffered saline. The absorbance (area scan) was measured at 620 nm for sample volume of 200 µL and the appearance of the solutions was checked by visual inspection.

3. Results

3.1. Design and Chemistry

Six different types of cyclopentane-, cyclohexane- and tetrahydropyran-based KV1.3 inhibitors were designed and synthesized with the aim of increasing potency on KV1.3, and selectivity against other members of KV1 family of the hit compounds 4 (TVS-06) and 5 (TVS-12), and to investigate structure-activity relationships (SAR) important for KV1.3 inhibition. Hit compound 4 (TVS-06) (Figure 2), which contained a scaffold of 3-thiophene, cyclopentane, and 2-methoxybenzamide, was first modified in the aromatic (R1) or cyclopentane portion of the molecule to yield a new series of cyclopentane or tetrahydrofuran analogs that were screened for KV1.3 inhibition (Figure 2: Type I compounds). The cyclopentane was replaced by cyclohexane to give new cyclohexane analogs with aromatic R2 substituents (Figure 2: Type compounds II). In both Type I and II compounds, the 2-methoxybenzamide moiety was retained because it is important for binding to the KV1.3 channel.
Hit compound 5 with benzene, 2-methoxybenzamide, and tetrahydropyran structural moieties was modified at both aromatic moieties (Figure 2) to give four tetrahydropyran series (Figure 2: Types III–VI). The first strategy was to replace the benzene ring of hit compound 5 with several small substituents to obtain a new series of 2-methoxybenzamide-based compounds (Figure 2: Type III). Based on biological data, an unsubstituted phenyl ring was selected to be included in novel phenyl-based analogs in which modifications were introduced to the 2-methoxybenzamide moiety (Figure 2: Type IV). The unsubstituted phenyl from hit compound 5 was then replaced with various thiophene or thiazole rings (Figure 2: Type V compounds). Finally, new analogs were prepared with the most promising 3-thiophene moiety and with various modifications to the 2-methoxybenzamide moiety (Figure 2: Compounds of Type VI).
The synthesis of all new analogs is shown in Figures S2–S7. Synthetic procedures, analytical data, chemicals, reagents, and equipment used for organic synthesis and analysis are listed in the Supplementary Materials under the Chemistry section.

3.2. KV1.3 Potencies of Structural Type I and Type II Compounds

In the Type I series, compound 14 with 2-thiophene and the new tetrahydrofuran ring was the most potent with an IC50 value of 0.57 ± 0.36 µM (Table 1), whereas the compounds in the cyclohexane series (Type II compounds 1521) were inactive (Table 1).

3.3. KV1.3 Potencies of Type III–VI Compounds

New tetrahydropyran KV1.3 inhibitors were designed and synthesized to provide a focused library that was screened for KV1.3 inhibition (Table 2). The new compounds of Type III 22–29 (Table 2) were modified at the phenyl ring (R3, Figure 2) of hit compound 5. The highest percentage of KV1.3 inhibition of the Type III compounds was achieved with the 3-substituted phenyl analogs (2829), which were less effective compared with hit compound 5.
The phenyl-based Type IV compounds (3037) contained several modifications of the 2-methoxybenzamide moiety of the molecule. The activity of hit compound 5 was maintained with the new 2-methoxy-4-methylbenzamide (36) and 5-fluoro-2-methoxybenzamide (37) analogs (Table 2), which exhibited approximately two times higher IC50 values than 5.
In the Type V series, the benzene ring of hit compound 5 was replaced by several thiophene or thiazole moieties (Figure 2, 3844) to obtain a suitable moiety that would give better selectivity and potency compared with the benzene ring of hit compound 5. Two potent Type V inhibitors were obtained by using 2-thiophene (43) or 3-thiophene (44) moieties. The 2-thiophene analog 43 had a nanomolar IC50 value of 0.59 ± 0.15 µM and the most potent Type V compound was the 3-thiophene analog 44 with an IC50 value of 0.47 ± 0.02 µM.
Because the Type V compound 44 had a lower IC50 value for KV1.3 compared to hit compound 5, the 3-thiophene moiety was determined to be the most promising bioisosteric replacement for the benzene ring and was incorporated into a new Type VI 3-thiophene-based analog 4550 (Table 2) with modifications of the 2-methoxybenzamide part of the molecule (Figure 2). The most potent Type VI compound was the 2-methoxy-4-methylbenzamide analog 51, which had an IC50 value of 2.92 ± 0.12 µM (Table 2).

3.4. Selectivity and IC50 Determinations of the Most Potent KV1.3 Inhibitors

The most potent compounds from Table 1 and Table 2 (14, 37, 43 and 44) and the reference compound PAP-1 (1) were tested for KV1.3 inhibition with an additional independent method of manual patch-clamp procedures on Ltk cells (Table 3). The aim was to demonstrate the inhibition of KV1.3 in a mammalian cell line and to have a direct comparison with the positive control PAP-1 (1), which was previously tested in L929 cells and human T-cells (IC50 of 2 nM) [11]. Interestingly, the reference compound PAP-1 (1) had an IC50 value of 780 nM (manual voltage clamp on oocytes) and 0.4 nM (manual patch clamp on Ltk cells), PAP-1 had a much lower potency on oocytes compared with the literature data (IC50 of 2 nM, L929 cells, manual whole-cell patch-clamp) and the IC50 value determined based on Ltk cells. The best compound of Types I- VI had comparable potency on oocytes (Figure 3, manual voltage-clamp) and Ltk cells (manual patch-clamp) of 470 nM and 950 nM, respectively.
The aim of new potent KV1.3 inhibitors is sufficient selectivity against other voltage-gated potassium channels. Therefore, Kv1.3 inhibitors 14, 37, 43, and 44 were screened against a panel of voltage-dependent channels using the Xenopus laevis heterologous expression system together with the reference compound PAP-1 (1). These channels were selected based on their importance in cardiac physiology and their structural similarity to KV1.3. PAP-1 (1) was tested at a concentration of 10 µM (Figure 4) and showed no significant effects on the channels KV1.1, KV1.2, KV1.4, KV1.5, KV1.6, KV2.1, KV4.2, and KV10.1 in Xenopus laevis oocytes. Compounds 14, 37, 43, and 44 (Figure 5) were screened at the concentration of their IC50 values for KV1.3. IC50 values for other KV channels were determined for the compounds that showed significant activity on other potassium channels compared with KV1.3 (Table 4).
At a concentration of its IC50 value (IC50 = 1.99 ± 0.61 µM, Table 4) for KV1.3, compound 44 with the 3-thiophene ring showed no significant effects on channels KV1.1, KV1.2, KV1.5, KV1.6, KV2.1 and KV10.1. However, it induced approximately a 16% inhibition of KV1.4 at this concentration, which is why the IC50 value was determined for KV1.4 (8.48 ± 2.21 µM, Table 4). Compound 44 showed the most appropriate selectivity profile compared to the other new KV1.3 inhibitors 14, 37, and 43.
At a concentration of their IC50 values for KV1.3, 14 and 43, based on 2-thiophene scaffolds, showed significant effects on KV1.1, Kv1.2, KV1.5, and KV1.6 (Figure 5), so IC50 values were determined for these channels. Compound 14 (IC50 = 1.03 ± 0.03 µM for KV1.3, Table 4) very potently inhibited KV1.1 (IC50 = 0.71 ± 0.26 µM, Table 4) and KV1.6 currents (IC50 = 0.43 ± 0.02 µM, Table 4). Similarly, 43 (IC50 = 1.20 ± 0.02 µM for KV1.3, Table 4) proved to be an even more potent inhibitor of KV1.1 (IC50 = 0.56 ± 0.12 µM, Table 4) and KV1.6 (IC50 = 0.83 ± 0.01 µM, Table 4) channels.
Compound 37, containing a phenyl ring, at the concentration of the IC50 for KV1.3 (IC50 = 1.97 ± 0.14 µM, Table 4) significantly inhibited the currents of KV1.1, KV1.2, KV1.5, and KV1.6 (Table 4).

3.5. Effects on the Growth of Cell Lines in 2D Cell Culture

KV1.3 is associated with the control of cell proliferation in various cancer cell types. Therefore, we investigated the effects of compounds 14, 37, 43 and 44 on the proliferation of two pancreatic cancer cell lines, Panc-1 and Colo-357, which have been reported to overexpress KV1.3 [19]. The compounds were tested at a concentration of 100 µM, which is the maximal concentration we can achieve while maintaining a low concentration of vehicle (1% DMSO, which was also added to the control). Proliferation was determined as confluence of the culture using live cell imaging over a 72 h period. For Panc-1 cells (Figure 6A,C), compound 44 caused moderate growth inhibition, whereas 14, 43, and especially 37 caused strong inhibition. However, the growth of Colo-357 cells (Figure 6B,D) was not significantly affected by any of the compounds.

3.6. Effects on the Growth of Cell Lines in 3D Cell Culture

To test the ability of the compounds to inhibit tumour progression in a more predictive system, we performed experiments on tumour spheroids of the pancreatic cancer cell lines used for 2D culture. In Panc-1 spheroids (Figure 6E), the compounds that effectively reduced proliferation in 2D culture (14, 37, 43, and 44) did not induce detectable levels of apoptosis, whereas the reference compound PAP-1 did. In Colo-357 cell spheroids, significant induction of apoptosis was observed in the presence of the hit compound 4 (Figure 6F). None of the other compounds tested differed significantly from the control. The degree of apoptosis induction was dose-dependent, although we could not use concentrations higher than 100 µM and therefore cannot determine the IC50 for induction of apoptosis. The level of apoptosis achieved by 100 µM of hit compound 4 was similar to that achieved by 50 µM PAP-1 (1).

4. Discussion

With the structure-activity relationship studies of novel structural classes KV1.3 inhibitors, we identified structural parts that are important for KV1.3 inhibition. With the structural optimization of hit compounds 4 and 5 we developed new KV1.3 inhibitors (e.g., 14, 43, and 44) with improved potency compared to hit compounds. To explain the structural requirements for KV1.3 inhibition, we created a pharmacophore model of the new KV1.3 inhibitors in Ligandscout 4.4 Expert (Inte:Ligand GmbH) using inhibitors that achieved K
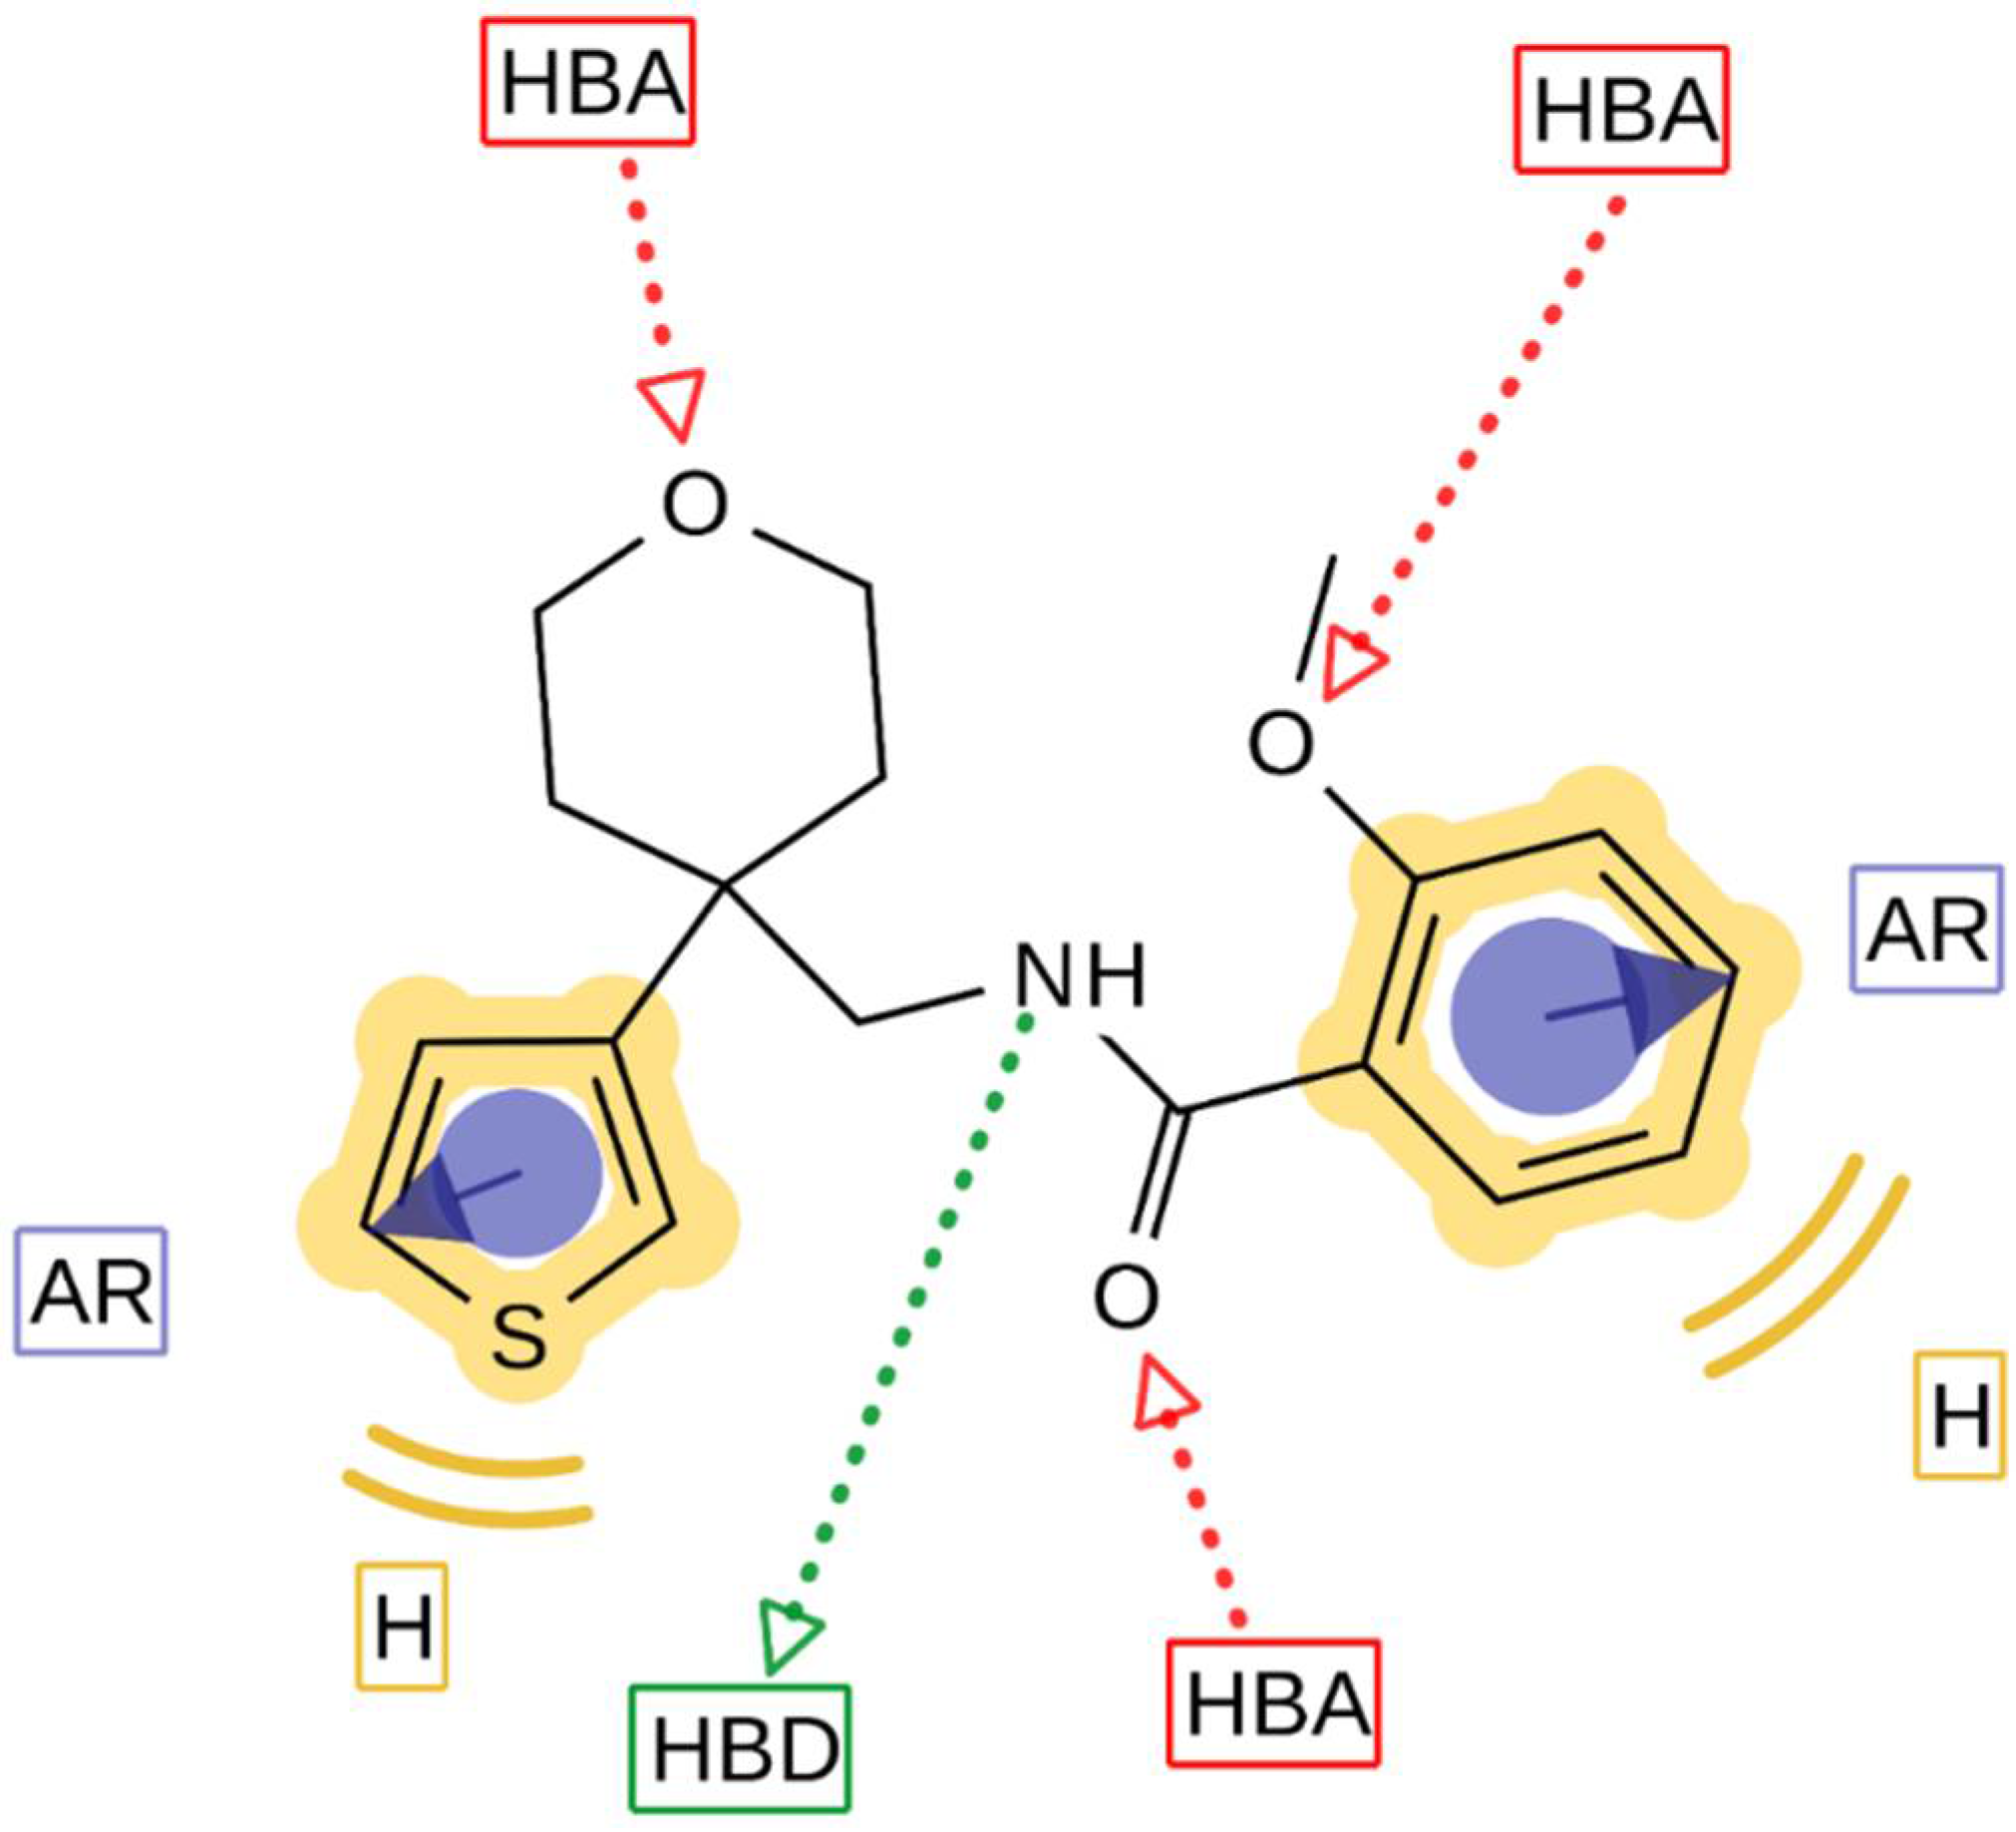
V1.3 inhibition greater than 75% at a concentration of 10 µM. The ligand-based pharmacophore model (Figure 7) is presented with the structure of the most potent KV1.3 inhibitor 44. Structural elements in the most potent analogs that were required for high-affinity interaction with KV1.3 were the amide bond (hydrogen bond acceptor, HBA, hydrogen bond donor, HBD), two aromatic features, oxygen in the 2-methoxy group as HBA, and oxygen in the rings of tetrahydrofuran (Type I) or tetrahydropyran (Type III-VI) rings as HBA. 2-Methoxybenzamide was present in the first aromatic feature (Types I, III and FThe second aromatic feature of most potent inhibitors included 3-substituted (Type III, 28 and 29) or unsubstituted benzene (Type IV, 36, 37), unsubstituted 2-thiophene (Type I, 14 and Type V, 43) or unsubstituted 3-thiophene (Type V, 44 and Type VI, 51).
Several known small molecule KV1.3 inhibitors lack selectivity for KV1.3 over the closely related KV1.x family channels, which have high subtype homology. The lack of selectivity for K
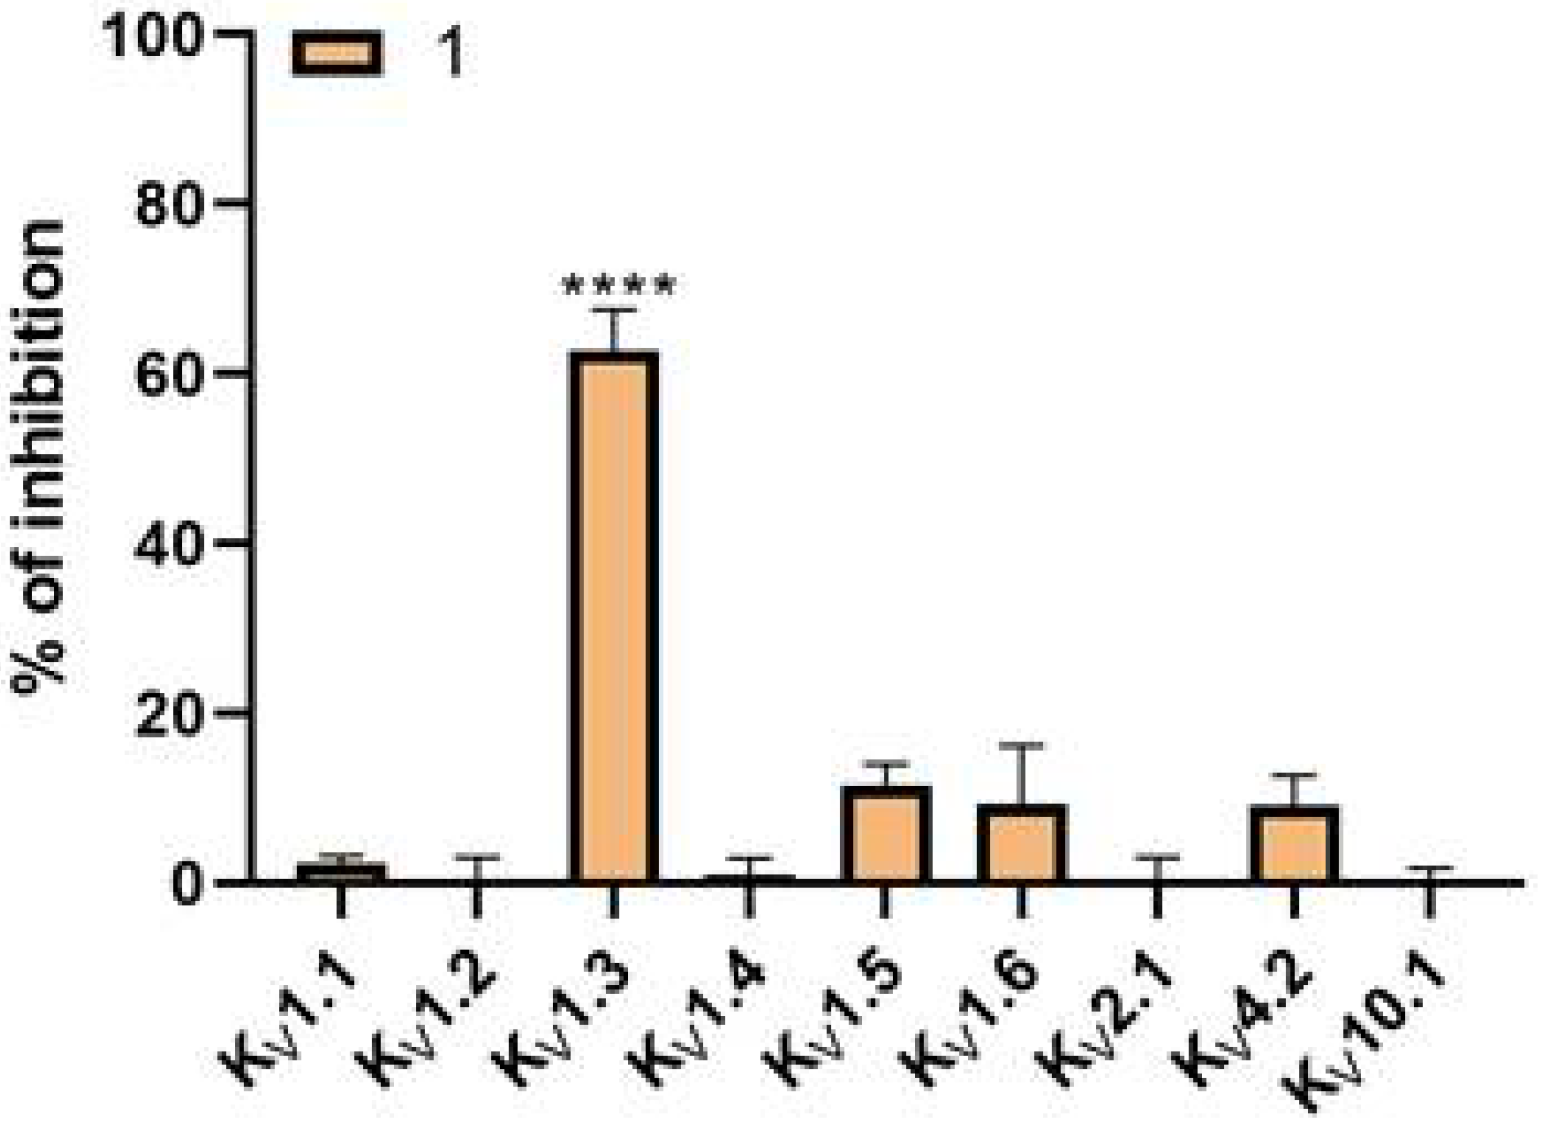
V1.5 raises many concerns regarding potential acute cardiac toxicity. Obtaining a selective small molecule inhibitor remains a major challenge, and often the lack of selectivity prevents subsequent optimization. Based on literature data, PAP-1 (Figure 1, 1) is selective toward KV1 channels, whereas it has the lowest selectivity toward the KV1.5 channel (i.e., 23-fold over KV1.5). We also included into our testing the reference compound PAP-1 to have a direct comparison of potency and selectivity with newly designed compounds. We determined IC50 values for PAP-1 using three independent methods: manual voltage clamp on oocytes (IC50 = 0.78 ± 0.01 µM), HiClamp system on oocytes (IC50 = 2.67 ± 0.30 µM), and manual patch clamp on Ltk cells (IC50 = 0.0004 ± 0.00002 µM). Surprisingly, the IC50 values determined for PAP-1 on oocytes were approximately 390- to 1335-fold higher than the literature IC50 value of 2 nM (L929 cells, manual whole-cell patch-clamp) [24]. Regarding selectivity, the PAP-1 tested at a concentration of 10 µM showed no significant effects on channels KV1.1, KV1.2, KV1.4, KV1.5, KV1.6, KV2.1, KV4.2, and KV10.1 using the HiClamp system on oocytes.
Comparing the IC50 values in Table 3, we can see some differences between the different test systems can be seen. The IC50 values determined based on oocytes using the manual and HiClamp methods are in the same order of magnitude (middle-nanomolar to low-micromolar range), but the IC50 values determined based on mammalian cells are in the low-nanomolar range. These differences can be attributed to several factors:
First, both mammalian and amphibian cells were used, which differ in size, composition, ion channel expression, and permeability to compounds [25].
Second, when comparing the two different methods used on oocytes (manual voltage clamp and HiClamp), it seems that IC50 values are generally slightly higher for the HiClamp method than for the two manual techniques. This may be due to differences in perfusion between the three systems. In the manual setup, oocytes are manually impaled in the recording chamber with two electrodes, and the test solution is either externally applied to the bath filled with ND96 (in the case of the manual voltage-clamp experiments) or applied by continuous extracellular perfusion using a pressurized fast-perfusion system (in the case of the manual patch-clamp experiments), while KV1.3 currents are measured. The HiClamp, on the other hand, is a semi-automatic system, in which the oocyte is picked up from a 96-well plate, deposited in a basket and automatically impaled by two electrodes in the washing chamber. Next, the basket will submerge the oocyte in the test solution in another 96-well plate while KV1.3 currents are measured. In this plate, magnets are continuously stirring the test solutions to assure homogenous perfusion. The higher IC50s observed at the HiClamp could be due to adhesion of the compound to the walls of the 96-well plate or because of the continuous stirring by the magnet, which is not present in the two other experimental setups.
Third, the voltage protocols used are slightly different. In the voltage-clamp experiments, depolarizing pulses of 1 s duration were used at intervals of 1 s, whereas in the patch-clamp experiments, depolarizing pulses of 200 ms duration were applied at intervals of 15 s. The voltage protocol used in the patch-clamp experiments is slightly different. The voltage protocol can affect the IC50 value depending on the state dependence and kinetics of the compound [26,27]. If the compound prefers to bind to a certain state of the channel and the voltage-protocol favors this state, then the observed IC50 will be lower compared to when a voltage-protocol that does not favor this state is used. Similarly, lower affinities will be observed if compounds with slow binding kinetics are measured in a voltage-protocol with a short occupancy period of the open or inactivated state, and vice-versa [28].
Because the solubility of the new drug candidates in aqueous media is relatively low in many cases, we performed a turbidimetric solubility test (Table S1) in phosphate-buffered saline (with a final 1% DMSO concentration) for compounds 37, 43, and 44. Compounds 43 and 44 were soluble at a concentration of 500 µM and compound 37 was soluble at a concentration of 200 µM. For the determination of IC50, the concentrations indicated on the x-axis in logarithmic scale were 0.01 µM, 0.1 µM, 1 µM, 10 µM, and 100 µM. At these concentrations, compounds 37, 43 and 44 were soluble, therefore the IC50 values determined are not affected by the solubility of these compounds.
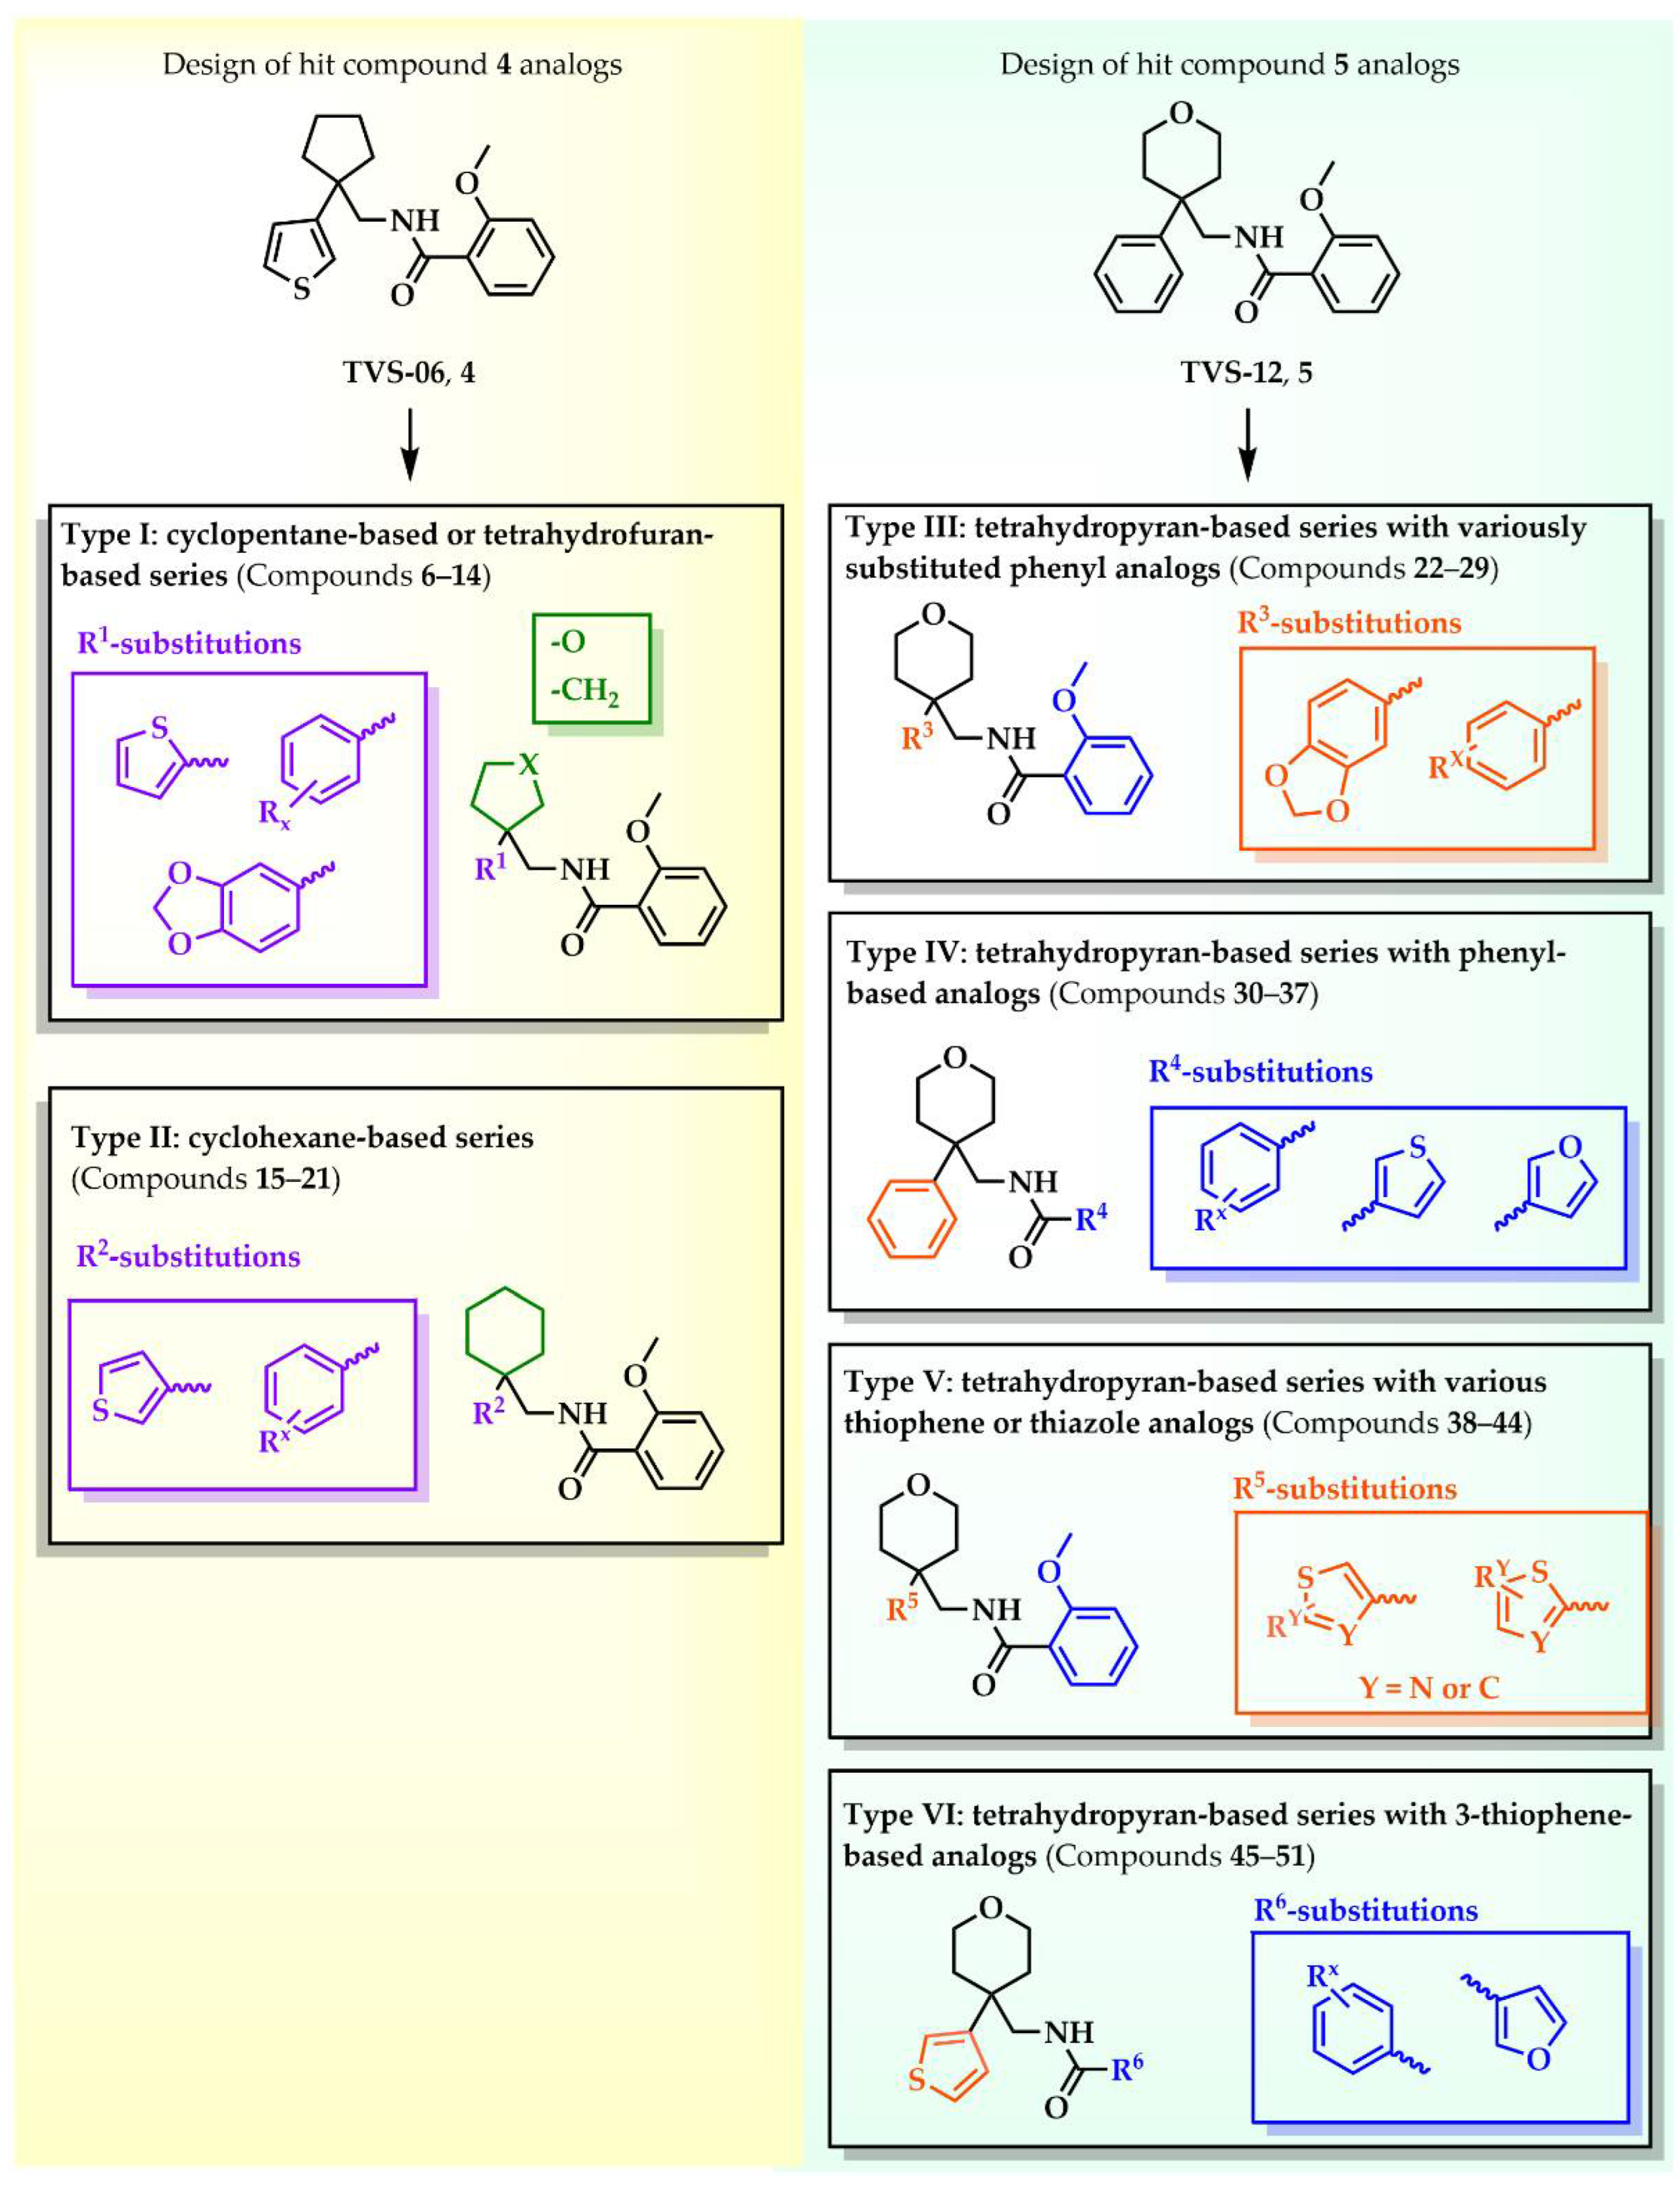
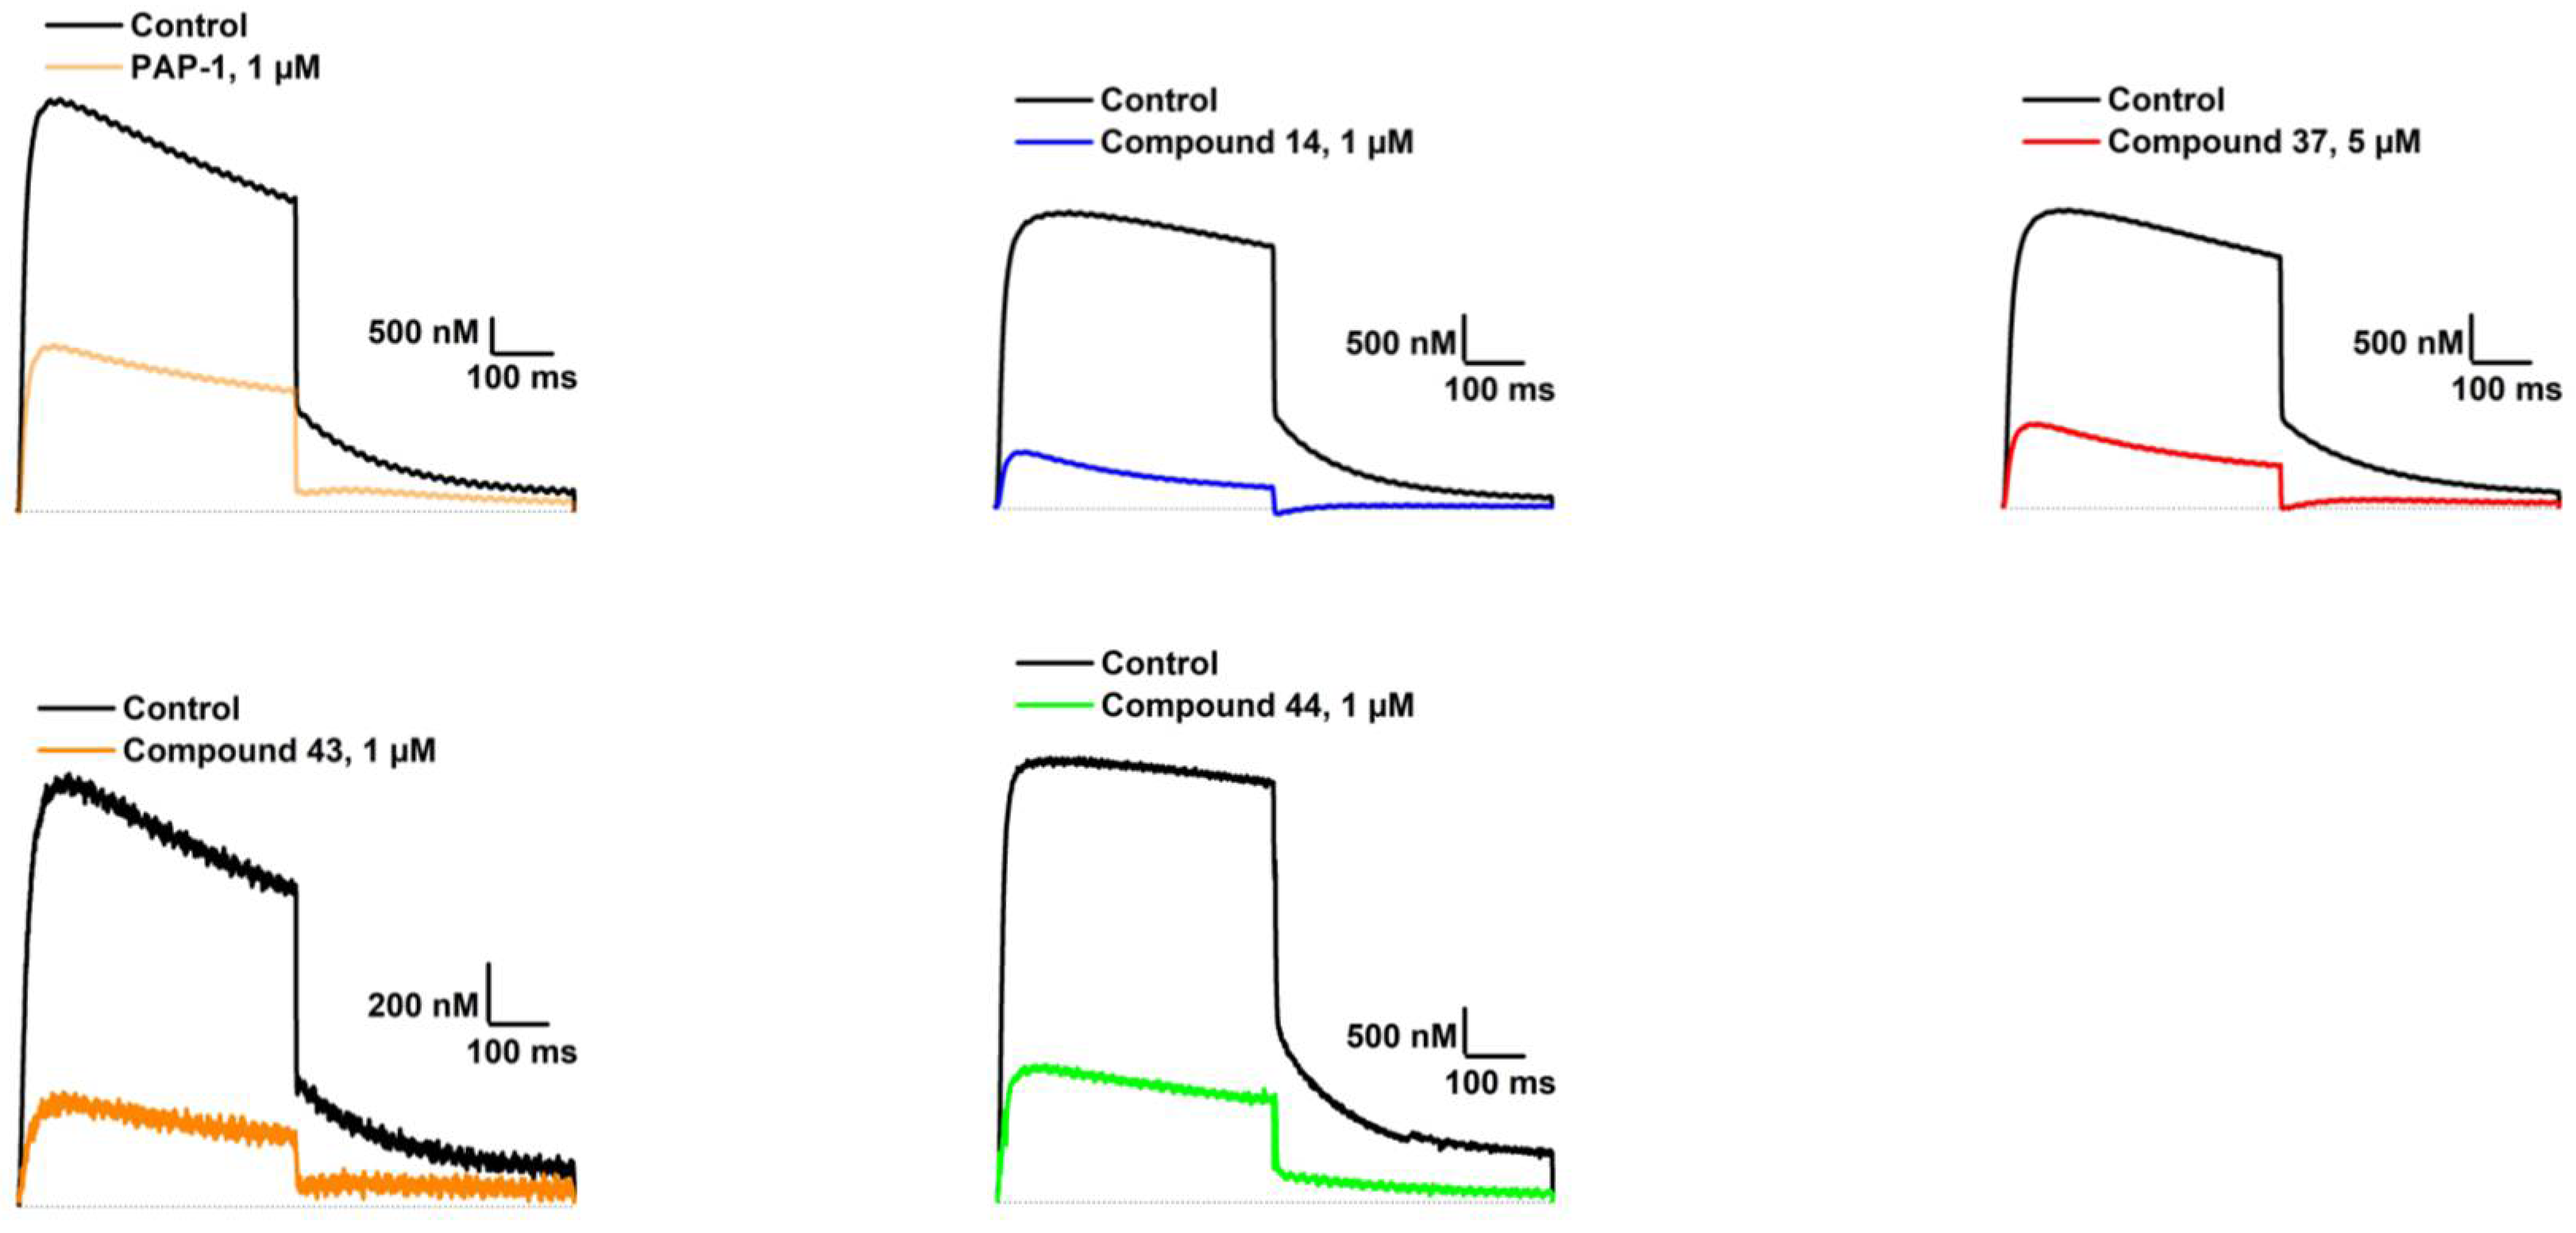
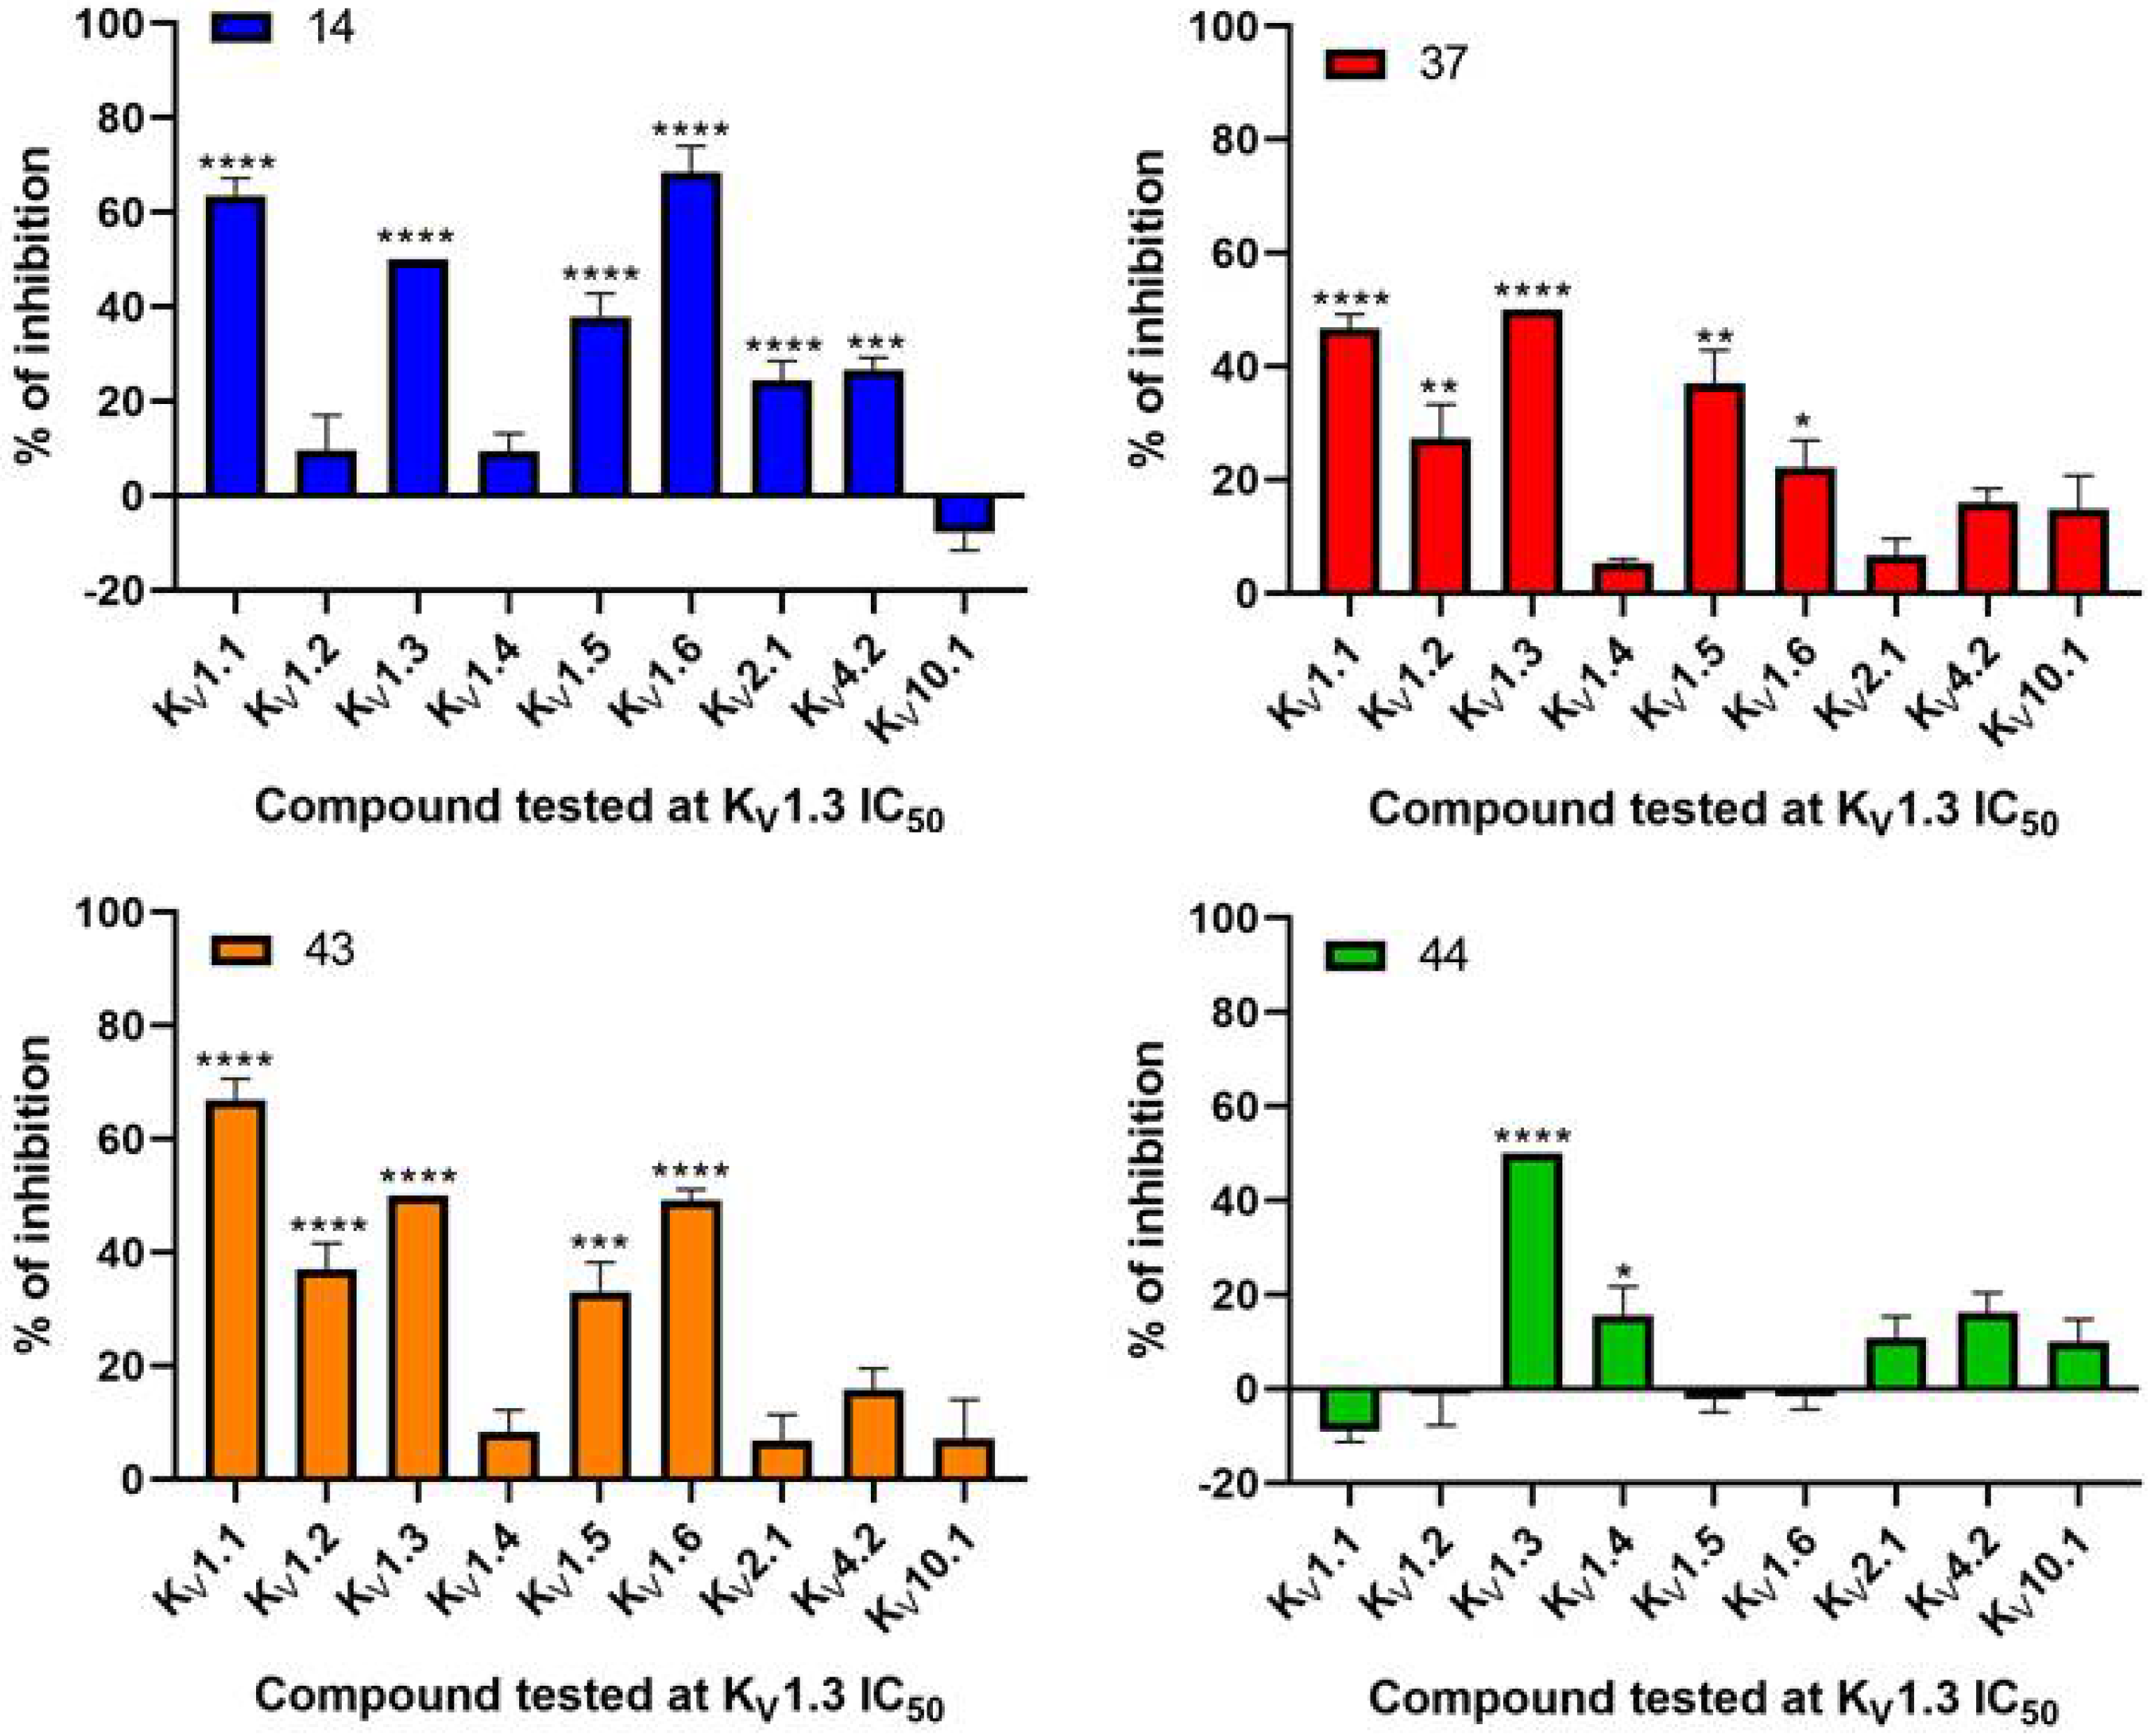
Our aim was to design novel potent and selective KV1.3 inhibitors based on previously determined hit compounds 4 and 5. Based on selectivity data for hit compounds 4 and 5, we hypothesized that the 3-thiophene scaffold and/or the 2-methoxybenzamide moiety together might be responsible for the high selectivity of hit compound 4. To test this hypothesis, we designed six types of novel analogs (Types I-VI) that incorporated 3-thiophene (Types V and VI), 2-thiophene (Types I and V), or benzene (Types III or IV) as scaffolds in the amine portion of the molecules. Compounds 43 (Type I) and 44 (Type V) had very similar affinity for KV1.3 (IC50 = 0.59 ± 0.15 µM and 0.47 ± 0.02 µM, respectively), but interestingly, the 2- or 3-thiophene position leads to a completely different selectivity profile. Among the new KV1.3 inhibitors, 44 (Type V) with 3-thiophene scaffold and 2-methoxybenzamide moiety showed the best selectivity profile showing no significant inhibition of KV1.x channels, except it inhibited KV1.4 with IC50 value of 8.48 ± 2.21 µM. In contrast, inhibitors 14, and 43 with 2-thiophene scaffold and 2-methoxy benzamide moiety lacked selectivity toward KV1.1, KV1.2, KV1.5, and KV1.6. It appears that both the 3-thiophene scaffold and the 2-methoxybenzamide moiety are responsible for the high selectivity of hit compound 4 and the novel benzamide analog 44, but the new structural elements of tetrahydropyran (37, 43 and 44) and tetrahydrofuran (14) allow higher potency for KV1.3.
KV1.3 activity is required for cell proliferation, migration, and invasion, which are very important events in cancer progression [9]. To date, there are several lines of evidence that cell-permeable inhibitors of KV1.3, PAP-1 (1) and clofazimine (3), specifically target KV1.3 to mediate apoptosis. However, PAP-1-based mitochondria-targeted derivatives (PAPTP and PCARBTP) bound to the lipophilic triphenylphosphonium cation (TPP) were found to be very effective in several cancer models, including pancreatic ductal adenocarcinoma, melanoma, and glioblastoma [30,31]. PAPTP and PCARBTP were able to decrease the cell survival with EC50 of approximately 3 and 6 µM in Panc-1 cell line. The decrease in MTS levels when 10 µM PAPTP or PCARBTP was used was due to the apoptosis of Panc-1, while clofazimine only induced cell death of less than 30% even at a concentration of 20 µM. On the other hand, cell death of Colo-357 was achieved only after treatment with high concentrations of PAPTP, PCARBTP, and clofazimine (EC50s of 3.7, 2, and 1.5 µM, respectively) [31].
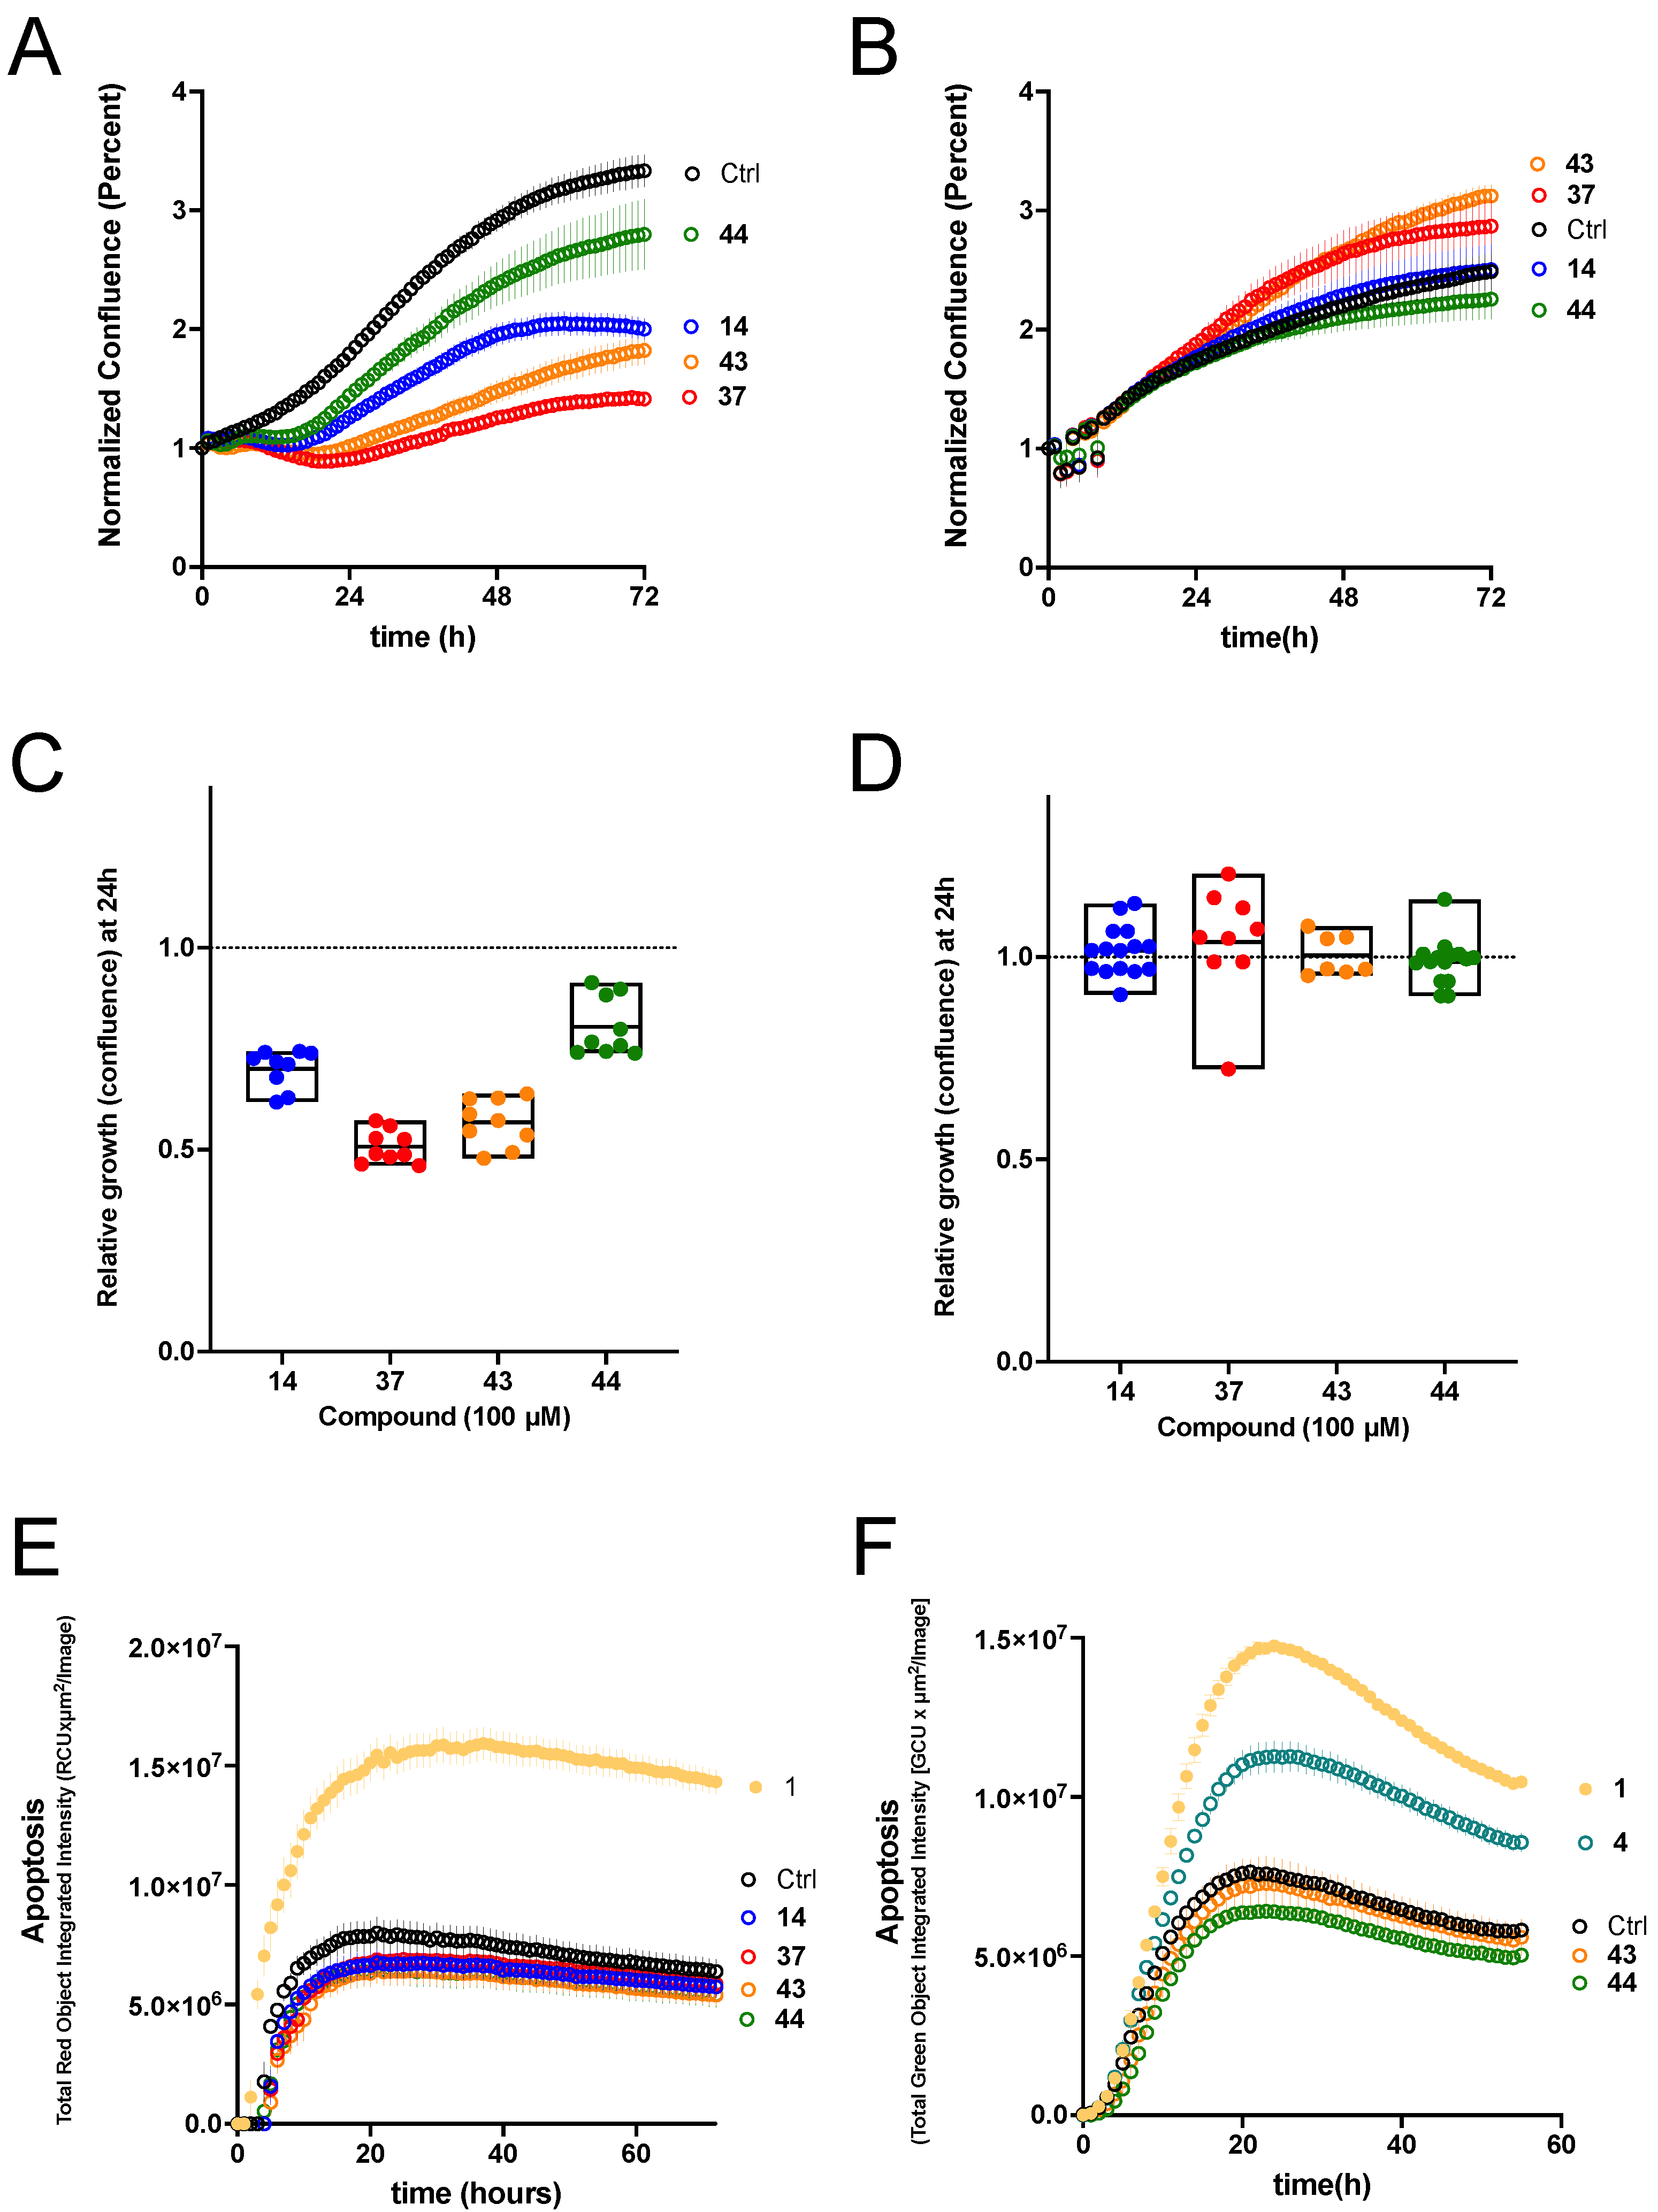
We tested the ability of our new potent KV1.3 inhibitors to inhibit the proliferation of two KV1.3-expressing PDAC cell lines, Colo-357 (metastatic) and Panc-1 (from the pancreatic duct). Growth of Panc-1 cells was inhibited by KV1.3 inhibitors 14, 37, 43, and 44, with 37 in particular causing strong inhibition. Colo-357 growth was unaffected in the presence of these compounds. The fact that Colo-357 cells were unaffected, together with the modest effects observed in Panc-1, indicate that plasma membrane KV1.3 is dispensable for the proliferation of these cell types. The discrepancy between cell lines can be attributed to the selectivity profiles of the compounds, since KV1.1 and KV1.5 have also been implicated in cell proliferation (see for example REF) [32] and are targets for compounds 14, 37 and 43, while the most selective of the new compounds (44) had the smallest effect. In Colo-357 tumor spheroids, starting hit compound 4 induced a significant amount of apoptosis, and the degree of apoptosis achieved by 100 µM of 4 was similar to that achieved by 50 µM PAP-1 (1). All compounds were ineffective as apoptosis inducers in Panc-1 tumor spheroids, whereas PAP-1 was able to induce significant apoptosis. Based on our efficacy data in PDAC cell lines and Colo-357 tumor spheroids, we hypothesize that inhibition of mitochondrial KV1.3 ion channels is required for significant anticancer activity, as previously demonstrated with PAP-1-based mitochondrial KV1.3 inhibitors (PAPTP and PCARBTP). Whether the ability of compound 4, which is specific against KV1.3 [21], is due to its ability to reach mitochondrial KV1.3 channels remains to be investigated. Our results, however, highlight the potential to develop new mitochondrial Kv1.3 inhibitors by adding a TPP moiety to our potent and selective thiophene-based KV1.3 inhibitors.

5. Conclusions

To discover a novel structural class of KV1.3 inhibitors overexpressed in many different tumour types, we used a structural optimization approach and successfully prepared novel potent and selective thiophene-based KV1.3 inhibitors. We identified the potent and appropriately selective nanomolar KV1.3 inhibitor 44, which contains 3-thiophene and tetrahydropyran scaffolds. We demonstrated the inhibition of the Panc-1 cancer cell line proliferation by the new KV1.3 inhibitors. Hit compound 4 induced significant apoptosis in Colo-357 tumour spheroids, and the extent of apoptosis achieved by 100 µM of 4 was comparable to that achieved by 50 µM PAP-1 (1). Based on the efficacy data in PDAC cell lines and Colo-357 tumour spheroids, we can assume that newly developed KV1.3 inhibitors do not reach the mitochondrial KV1.3 channels required for the induction of apoptosis. There is an opportunity to further develop the new structural class of potent and selective KV1.3 inhibitors into mitochondrial KV1.3 inhibitors by adding mitochondrial targeting moieties.

Supplementary Materials

The following are available online at https://www.mdpi.com/2072-6694/14/11/2595/s1, Figure S1: Addition to Table 4; Figure S2: Synthesis of cyclopentane and tetrahydrofuran derivatives; Figure S3: Synthesis of cyclohexane derivatives; Figure S4: Synthesis of benzene-based tetrahydropyran derivatives; Figure S5: Synthesis of benzene-based tetrahydropyran derivatives; Figure S6: Synthesis of heterocyclic tetrahydropyran derivatives; Figure S7: Synthesis of 3-thiophene-based tetrahydropyran derivatives; Table S1: Chemistry: analytical procedures description and NMR spectrums.

Author Contributions

Š.G., S.P., J.T., T.T., L.A.P. and L.P.M.; methodology, J.T., S.P., T.T., L.A.P. and L.P.M.; formal analysis, Š.G., L.A.H., Š.M., E.L.P.-J., S.P. and L.A.P.; investigation, Š.G., L.A.H., X.S., K.M.V.T., T.T. and L.A.P.; data curation, Š.G., L.A.H., X.S., Ž.T., K.M.V.T., T.T. and L.A.P.; writing—original draft preparation, Š.G., J.T., T.T., L.A.P. and L.P.M.; writing—review and editing, Š.G., J.T., K.M.V.T., A.J.L., T.T., L.A.P. and L.P.M.; supervision, S.P., J.T., A.J.L., T.T., L.A.P. and L.P.M.; project administration, J.T., T.T., L.A.P. and L.P.M.; funding acquisition, J.T., L.A.P. and L.P.M. All authors have read and agreed to the published version of the manuscript.

Funding

This research was funded by Slovenian Research Agency (ARRS) grant numbers J1-9192, N1-0098, P1-0245 and CELSA project. The work has also received funding from the Max-Planck Society and from the European Union through Horizon 2020 research and innovation programme under the Marie Skłodowska-Curie grant agreement No. 813834-PHIONIC-H2020-MSCA-ITN-2018. This study was supported by grants GOE7120N, GOC2319N, and GOA4919N from the F.W.O. Vlaanderen, awarded to J.T. and S.P. was supported by KU Leuven funding (PDM/19/164) and F.W.O. Vlaanderen grant 12W7822N.

Institutional Review Board Statement

The use of Xenopus laevis was approved by the Animal Ethics Committee of the KU Leuven (Project nr. P186/2019).

Informed Consent Statement

Not applicable.

Data Availability Statement

The data presented in this study are available on request from the corresponding author.

Acknowledgments

We thank OpenEye Scientific Software, Santa Fe, NM, USA, for free academic licenses for the use of their software. L.A.P. thanks the expert technical assistance of V. Díaz.

Conflicts of Interest

The authors declare that they have no conflicts of interest. The funders had no role in the design of the study; in the collection, analyses, or interpretation of data; in the writing of the manuscript, or in the decision to publish the results.

References

  1. Serrano-Albarrás, A.; Estadella, I.; Cirera-Rocosa, S.; Navarro-Pérez, M.; Felipe, A. Kv1.3: A Multifunctional Channel with Many Pathological Implications. Expert Opin. Ther. Targets 2018, 22, 101–105. [Google Scholar] [CrossRef] [PubMed]
  2. Rudy, B.; Maffie, J.; Amarillo, Y.; Clark, B.; Goldberg, E.M.; Jeong, H.-Y.; Kruglikov, I.; Kwon, E.; Nadal, M.; Zagha, E. Voltage Gated Potassium Channels: Structure and Function of Kv1 to Kv9 Subfamilies. In Encyclopedia of Neuroscience; Elsevier: Amsterdam, The Netherlands, 2009; pp. 397–425. ISBN 978-0-08-045046-9. [Google Scholar]
  3. Kuang, Q.; Purhonen, P.; Hebert, H. Structure of Potassium Channels. Cell. Mol. Life Sci. 2015, 72, 3677–3693. [Google Scholar] [CrossRef] [PubMed]
  4. Long, S.B.; Campbell, E.B.; MacKinnon, R. Crystal Structure of a Mammalian Voltage-Dependent Shaker Family Kþ Channel. Science 2005, 309, 8. [Google Scholar] [CrossRef] [PubMed]
  5. Pardo, L.A. Voltage-Gated Potassium Channels in Cell Proliferation. Physiology 2004, 19, 285–292. [Google Scholar] [CrossRef]
  6. Serrano-Novillo, C.; Capera, J.; Colomer-Molera, M.; Condom, E.; Ferreres, J.; Felipe, A. Implication of Voltage-Gated Potassium Channels in Neoplastic Cell Proliferation. Cancers 2019, 11, 287. [Google Scholar] [CrossRef]
  7. Comes, N.; Serrano-Albarrás, A.; Capera, J.; Serrano-Novillo, C.; Condom, E.; Ramón y Cajal, S.; Ferreres, J.C.; Felipe, A. Involvement of Potassium Channels in the Progression of Cancer to a More Malignant Phenotype. Biochim. Biophys. Acta BBA-Biomembr. 2015, 1848, 2477–2492. [Google Scholar] [CrossRef]
  8. Pérez-García, M.T.; Cidad, P.; López-López, J.R. The Secret Life of Ion Channels: Kv1.3 Potassium Channels and Proliferation. Am. J. Physiol.-Cell Physiol. 2018, 314, C27–C42. [Google Scholar] [CrossRef]
  9. Teisseyre, A.; Palko-Labuz, A.; Sroda-Pomianek, K.; Michalak, K. Voltage-Gated Potassium Channel Kv1.3 as a Target in Therapy of Cancer. Front. Oncol. 2019, 9, 933. [Google Scholar] [CrossRef]
  10. Comes, N.; Bielanska, J.; Vallejo-Gracia, A.; Serrano-Albarrás, A.; Marruecos, L.; Gómez, D.; Soler, C.; Condom, E.; Ramón y Cajal, S.; Hernández-Losa, J.; et al. The Voltage-Dependent K+ Channels Kv1.3 and Kv1.5 in Human Cancer. Front. Physiol. 2013, 4, 283. [Google Scholar] [CrossRef]
  11. Schmitz, A.; Sankaranarayanan, A.; Azam, P.; Schmidt-Lassen, K.; Homerick, D.; Hänsel, W.; Wulff, H. Design of PAP-1, a Selective Small Molecule Kv1.3 Blocker, for the Suppression of Effector Memory T Cells in Autoimmune Diseases. Mol. Pharmacol. 2005, 68, 1254–1270. [Google Scholar] [CrossRef]
  12. Schmalhofer, W.A.; Bao, J.; McManus, O.B.; Green, B.; Matyskiela, M.; Wunderler, D.; Bugianesi, R.M.; Felix, J.P.; Hanner, M.; Linde-Arias, A.-R.; et al. Identification of a New Class of Inhibitors of the Voltage-Gated Potassium Channel, Kv1.3, with Immunosuppressant Properties. Biochemistry 2002, 41, 7781–7794. [Google Scholar] [CrossRef] [PubMed]
  13. Ren, Y.R.; Pan, F.; Parvez, S.; Fleig, A.; Chong, C.R.; Xu, J.; Dang, Y.; Zhang, J.; Jiang, H.; Penner, R.; et al. Clofazimine Inhibits Human Kv1.3 Potassium Channel by Perturbing Calcium Oscillation in T Lymphocytes. PLoS ONE 2008, 3, e4009. [Google Scholar] [CrossRef] [PubMed]
  14. Chandy, K.G.; Norton, R.S. Peptide Blockers of Kv1.3 Channels in T Cells as Therapeutics for Autoimmune Disease. Curr. Opin. Chem. Biol. 2017, 38, 97–107. [Google Scholar] [CrossRef] [PubMed]
  15. Chen, R.; Robinson, A.; Gordon, D.; Chung, S.-H. Modeling the Binding of Three Toxins to the Voltage-Gated Potassium Channel (Kv1.3). Biophys. J. 2011, 101, 2652–2660. [Google Scholar] [CrossRef]
  16. Liu, S.; Zhao, Y.; Dong, H.; Xiao, L.; Zhang, Y.; Yang, Y.; Ong, S.T.; Chandy, K.G.; Zhang, L.; Tian, C. Structures of Wild-Type and H451N Mutant Human Lymphocyte Potassium Channel KV1.3. Cell Discov. 2021, 7, 39. [Google Scholar] [CrossRef]
  17. Tyagi, A.; Ahmed, T.; Jian, S.; Bajaj, S.; Ong, S.T.; Goay, S.S.M.; Zhao, Y.; Vorobyov, I.; Tian, C.; Chandy, K.G.; et al. Rearrangement of a Unique Kv1.3 Selectivity Filter Conformation upon Binding of a Drug. Proc. Natl. Acad. Sci. USA 2022, 119, e2113536119. [Google Scholar] [CrossRef]
  18. Leanza, L.; Henry, B.; Sassi, N.; Zoratti, M.; Chandy, K.G.; Gulbins, E.; Szabò, I. Inhibitors of Mitochondrial Kv1.3 Channels Induce Bax/Bak-Independent Death of Cancer Cells. EMBO Mol. Med. 2012, 4, 577–593. [Google Scholar] [CrossRef]
  19. Zaccagnino, A.; Managò, A.; Leanza, L.; Gontarewitz, A.; Linder, B.; Azzolini, M.; Biasutto, L.; Zoratti, M.; Peruzzo, R.; Legler, K.; et al. Tumor-Reducing Effect of the Clinically Used Drug Clofazimine in a SCID Mouse Model of Pancreatic Ductal Adenocarcinoma. Oncotarget 2017, 8, 38276–38293. [Google Scholar] [CrossRef]
  20. Leanza, L.; Trentin, L.; Becker, K.A.; Frezzato, F.; Zoratti, M.; Semenzato, G.; Gulbins, E.; Szabo, I. Clofazimine, Psora-4 and PAP-1, Inhibitors of the Potassium Channel Kv1.3, as a New and Selective Therapeutic Strategy in Chronic Lymphocytic Leukemia. Leukemia 2013, 27, 1782–1785. [Google Scholar] [CrossRef]
  21. Hendrickx, L.A.; Dobričić, V.; Toplak, Ž.; Peigneur, S.; Mašič, L.P.; Tomašič, T.; Tytgat, J. Design and Characterization of a Novel Structural Class of Kv1.3 Inhibitors. Bioorganic Chem. 2020, 98, 103746. [Google Scholar] [CrossRef]
  22. Wolber, G.; Langer, T. LigandScout:  3-D Pharmacophores Derived from Protein-Bound Ligands and Their Use as Virtual Screening Filters. J. Chem. Inf. Model. 2005, 45, 160–169. [Google Scholar] [CrossRef] [PubMed]
  23. Poli, G.; Seidel, T.; Langer, T. Conformational Sampling of Small Molecules with ICon: Performance Assessment in Comparison with OMEGA. Front. Chem. 2018, 6, 229. [Google Scholar] [CrossRef] [PubMed]
  24. Lacerda, A.E.; Kramer, J.; Shen, K.-Z.; Thomas, D.; Brown, A.M. Comparison of Block among Cloned Cardiac Potassium Channels by Non-Antiarrhythmic Drugs. Eur. Heart J. Suppl. 2001, 3, K23–K30. [Google Scholar] [CrossRef]
  25. Witchel, H.J.; Milnes, J.T.; Mitcheson, J.S.; Hancox, J.C. Troubleshooting Problems with In Vitro Screening of Drugs for QT Interval Prolongation Using HERG K+ Channels Expressed in Mammalian Cell Lines and Xenopus Oocytes. J. Pharmacol. Toxicol. Methods 2002, 48, 65–80. [Google Scholar] [CrossRef]
  26. Kirsch, G.E.; Trepakova, E.S.; Brimecombe, J.C.; Sidach, S.S.; Erickson, H.D.; Kochan, M.C.; Shyjka, L.M.; Lacerda, A.E.; Brown, A.M. Variability in the Measurement of HERG Potassium Channel Inhibition: Effects of Temperature and Stimulus Pattern. J. Pharmacol. Toxicol. Methods 2004, 50, 93–101. [Google Scholar] [CrossRef] [PubMed]
  27. Yao, J.-A.; Du, X.; Lu, D.; Baker, R.L.; Daharsh, E.; Atterson, P. Estimation of Potency of HERG Channel Blockers: Impact of Voltage Protocol and Temperature. J. Pharmacol. Toxicol. Methods 2005, 52, 146–153. [Google Scholar] [CrossRef]
  28. Lee, W.; Windley, M.J.; Perry, M.D.; Vandenberg, J.I.; Hill, A.P. Protocol-Dependent Differences in IC50 Values Measured in Human Ether-Á-Go-Go-Related Gene Assays Occur in a Predictable Way and Can Be Used to Quantify State Preference of Drug Binding. Mol. Pharmacol. 2019, 95, 537–550. [Google Scholar] [CrossRef]
  29. LigandScout v.4.4 Available from Inte:Ligand. Available online: https://www.Inteligand.Com/Ligandscout (accessed on 20 July 2021).
  30. Leanza, L.; Romio, M.; Becker, K.A.; Azzolini, M.; Trentin, L.; Managò, A.; Venturini, E.; Zaccagnino, A.; Mattarei, A.; Carraretto, L.; et al. Direct Pharmacological Targeting of a Mitochondrial Ion Channel Selectively Kills Tumor Cells In Vivo. Cancer Cell 2017, 31, 516–531. [Google Scholar] [CrossRef]
  31. Peruzzo, R.; Mattarei, A.; Romio, M.; Paradisi, C.; Zoratti, M.; Szabò, I.; Leanza, L. Regulation of Proliferation by a Mitochondrial Potassium Channel in Pancreatic Ductal Adenocarcinoma Cells. Front. Oncol. 2017, 7, 239. [Google Scholar] [CrossRef]
  32. Bachmann, M.; Li, W.; Edwards, M.J.; Ahmad, S.A.; Patel, S.; Szabo, I.; Gulbins, E. Voltage-Gated Potassium Channels as Regulators of Cell Death. Front. Cell Dev. Biol. 2020, 8, 611853. [Google Scholar] [CrossRef]
Figure 1. Structures of known representative KV1.3 inhibitors. (A) PAP-1 (1). (B) PAC (2). (C) Clofazimine (3) (D) TVS-06 (4). (E) TVS-12 (5).
Cancers 14 02595 g001
Figure 2. Design of new KV1.3 inhibitors of structural Types I–VI.
Cancers 14 02595 g002
Figure 3. Raw traces of KV1.3 currents in control conditions in ND96 (black line) and after addition of PAP-1 (light orange line), 14 (blue line), 37 (red line), 43 (orange line), and 44 (green line). The dotted line indicates the zero current level. Measured by manual voltage clamp on Xenopus laevis oocytes.
Cancers 14 02595 g003
Figure 4. Selectivity determination of PAP-1 (1) screened at a concentration of 10 µM (HiClamp Xenopus laevis heterologous expression system) on a panel of ion channels. (**** p < 0.0001, Mean ± S.E.M, N = 3–12).
Cancers 14 02595 g004
Figure 5. Selectivity determination of 14, 37, 43, and 44 screened at a concentration of their IC50 values for KV1.3 on a panel of ion channels. **** p < 0.0001, *** p < 0.001, ** p < 0.01 * p < 0.05, Mean ± S.E.M, N = 3–12).
Cancers 14 02595 g005
Figure 6. Effects on pancreatic cancer cell lines in 2D and 3D cell cultures. (A) Growth curves (culture confluence measured through phase contrast imaging) of Panc-1 cells in the presence of the indicated compounds (100 µM) or the vehicle (DMSO, black symbols). Mean ± S.E.M, N = 9. (B) The equivalent experiment on Colo-357 cells revealed that the growth inhibition was cell-type specific. Mean ± S.E.M, N = 15. The inhibition 24 h after the start of treatment is quantified in (C,D) for the data presented in (A,B) respectively. (E) Apoptosis measured as caspase 3/7 activity on Panc-1 tumor spheroids in the presence of the indicated compounds. (F) Apoptosis in Colo-357 tumor spheroids (p < 0.001, Mean ± S.E.M, N = 4).
Cancers 14 02595 g006
Figure 7. Pharmacophore model of new KV1.3 inhibitors. The model was prepared in the Ligandscout 4.4 Expert (Inte:Ligand GmbH) [22,29] using molecules with inhibition of KV1.3 higher than 75% at 10 µM concentration. Pharmacophore features represent: hydrophobic interactions, yellow spheres; aromatic interactions, blue discs; hydrogen bond donor, green arrow; hydrogen bond acceptors, red arrows. The pharmacophore model shows the most important features of KV1.3 inhibitors with the most potent compound 44 aligned to the pharmacophore model.
Cancers 14 02595 g007
Table 1. KV1.3 inhibitory activities of new analogs 621 from Type I and II series, manually voltage-clamped to determine the percentage of inhibition at 10 μM and the IC50s values determined with manual voltage-clamp on Xenopus laevis oocytes.
Cancers 14 02595 i001Cancers 14 02595 i002
Compound IDR1X% of KV1.3 Inhibition or IC50 [µM]Compound IDR2% of KV1.3 Inhibition or IC50 [µM]
6Cancers 14 02595 i003CH2<10%15Cancers 14 02595 i004<10%
7Cancers 14 02595 i005CH2<10%16Cancers 14 02595 i006<10%
8Cancers 14 02595 i007CH2<10%17Cancers 14 02595 i008<10%
9Cancers 14 02595 i009CH2<10%18Cancers 14 02595 i010<10%
10Cancers 14 02595 i011CH2<10%19Cancers 14 02595 i01212 ± 2%
11Cancers 14 02595 i013CH218 ± 3%20Cancers 14 02595 i01427 ± 2%
12Cancers 14 02595 i015CH216 ± 4%21Cancers 14 02595 i01630 ± 8%
13Cancers 14 02595 i017CH257 ± 9%
14Cancers 14 02595 i018O92 ± 4%
0.57 ± 0.36 µM
Table 2. Structures and KV1.3 inhibitory potencies of the designed and synthesized Type IV–VI analogs 2251, manually voltage-clamped to determine the percentage of inhibition at 10 μM and the IC50s values determined with manual voltage-clamp or HiClamp * on oocytes.
Cancers 14 02595 i019Cancers 14 02595 i020
Compound IDR3% of KV1.3 Inhibition or IC50 [µM]Compound IDR5% of KV1.3 Inhibition or IC50 [µM]
22Cancers 14 02595 i021<10%38Cancers 14 02595 i022<10%
23Cancers 14 02595 i023<10%39Cancers 14 02595 i024<10%
24Cancers 14 02595 i02559 ± 5%40Cancers 14 02595 i026<10%
25Cancers 14 02595 i02752 ± 8%41Cancers 14 02595 i02841 ± 10%
26Cancers 14 02595 i02960 ± 9%42Cancers 14 02595 i03054 ± 10%
27Cancers 14 02595 i03178 ± 4%43Cancers 14 02595 i03292 ± 1%
0.59 ± 0.15 µM
28Cancers 14 02595 i03388 ± 4%
5.75 ± 1.11 µM
44Cancers 14 02595 i03496 ± 1%
0.47 ± 0.02 µM
29Cancers 14 02595 i03587 ± 4%
4.30 ± 0.33 µM
Cancers 14 02595 i036Cancers 14 02595 i037
Compound IDR4% of KV1.3 Inhibition or IC50 [µM]Compound IDR6% of KV1.3 Inhibition or IC50 [µM]
30Cancers 14 02595 i038<10%45Cancers 14 02595 i039<10%
31Cancers 14 02595 i04011 ± 4%46Cancers 14 02595 i04121 ± 6%
32Cancers 14 02595 i04227 ± 6%47Cancers 14 02595 i04335 ± 8%
33Cancers 14 02595 i04438 ± 5%48Cancers 14 02595 i04542 ± 6%
34Cancers 14 02595 i04647 ± 1%49Cancers 14 02595 i04743 ± 1%
35Cancers 14 02595 i04874 ± 9%50Cancers 14 02595 i04947 ± 9%
36Cancers 14 02595 i05089 ± 4%
1.65 ± 0.38 µM *
51Cancers 14 02595 i05182 ± 1%
2.92 ± 0.12 µM *
37Cancers 14 02595 i05294 ± 1%
1.97 ± 0.14 µM *
Table 3. Comparison of KV1.3 IC50 values for compounds 14, 37, 43, 44, and PAP-1 (1) obtained with HiClamp and manual voltage-clamp on Xenopus laevis oocytes (Table 1 and Table 2) and with manual patch-clamp on the Ltk cell-line.
Compound IDIC50 (Manual Voltage-Clamp Oocytes) [µM]IC50 (HiClamp Oocytes) [µM]IC50 (Manual Patch-Clamp Ltk) [µM]
PAP-1 (1)0.78 ± 0.012.67 ± 0.300.0004 ± 0.00002
140.57 ± 0.361.03 ± 0.031.33 ± 0.20
373.96 ± 0.471.97 ± 0.141.35 ± 0.04
430.59 ± 0.151.20 ± 0.021.02 ± 0.07
440.47 ± 0.021.99 ± 0.610.95 ± 0.24
Table 4. IC50 values [µM] for analogs PAP-1, 14, 37, 43, and 44 on relevant voltage-gated ion channels. IC50 values were determined with HiClamp Xenopus laevis heterologous expression system for analogs which showed significant inhibition on the tested ion channels in Figure 5. The NA means that the analogue did not show significant inhibition on the tested ion channel and hence no IC50 was determined.
PAP-1 (1)14374344
KV1.1NA0.71 ± 0.261.76 ± 0.400.56 ± 0.12NA
KV1.2NA4.00 ± 0.202.34 ± 0.262.76 ± 0.56NA
KV1.32.67 ± 0.301.03 ± 0.031.97 ± 0.141.20 ± 0.021.99 ± 0.61
KV1.4NANANANA8.48 ± 2.21
KV1.5NA2.07 ± 0.138.64 ± 0.034.33 ± 0.01NA
KV1.6NA0.43 ± 0.024.33 ± 1.210.83 ± 0.01NA
KV2.1NA6.45 ± 0.42NANANA
KV4.2NA2.41 ± 0.88NANANA
KV10.1NANANANANA
Publisher’s Note: MDPI stays neutral with regard to jurisdictional claims in published maps and institutional affiliations.

