
Autofluorescence Imaging of Treatment Response in Neuroendocrine Tumor Organoids


Abstract
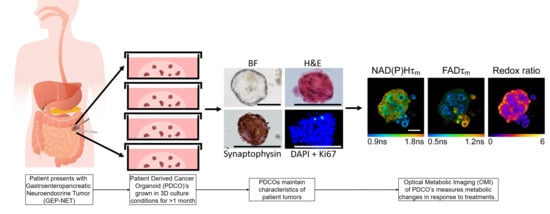
Simple Summary
Abstract
1. Introduction
2. Materials and Methods
2.1. STC-1 Cell Line Experiments
2.2. Cell Isolation and PDCO Culture
2.3. PDCO Diameter Measurements
2.4. Multiphoton Imaging In Vitro Studies
2.5. Quantification of Fluorescence Lifetime Components
2.6. Subpopulation Analysis
2.7. Statistical Analysis
2.8. Histologic Processing and Staining
3. Results
3.1. Optical Metabolic Imaging (OMI) Compared with Standard Measurements of Response
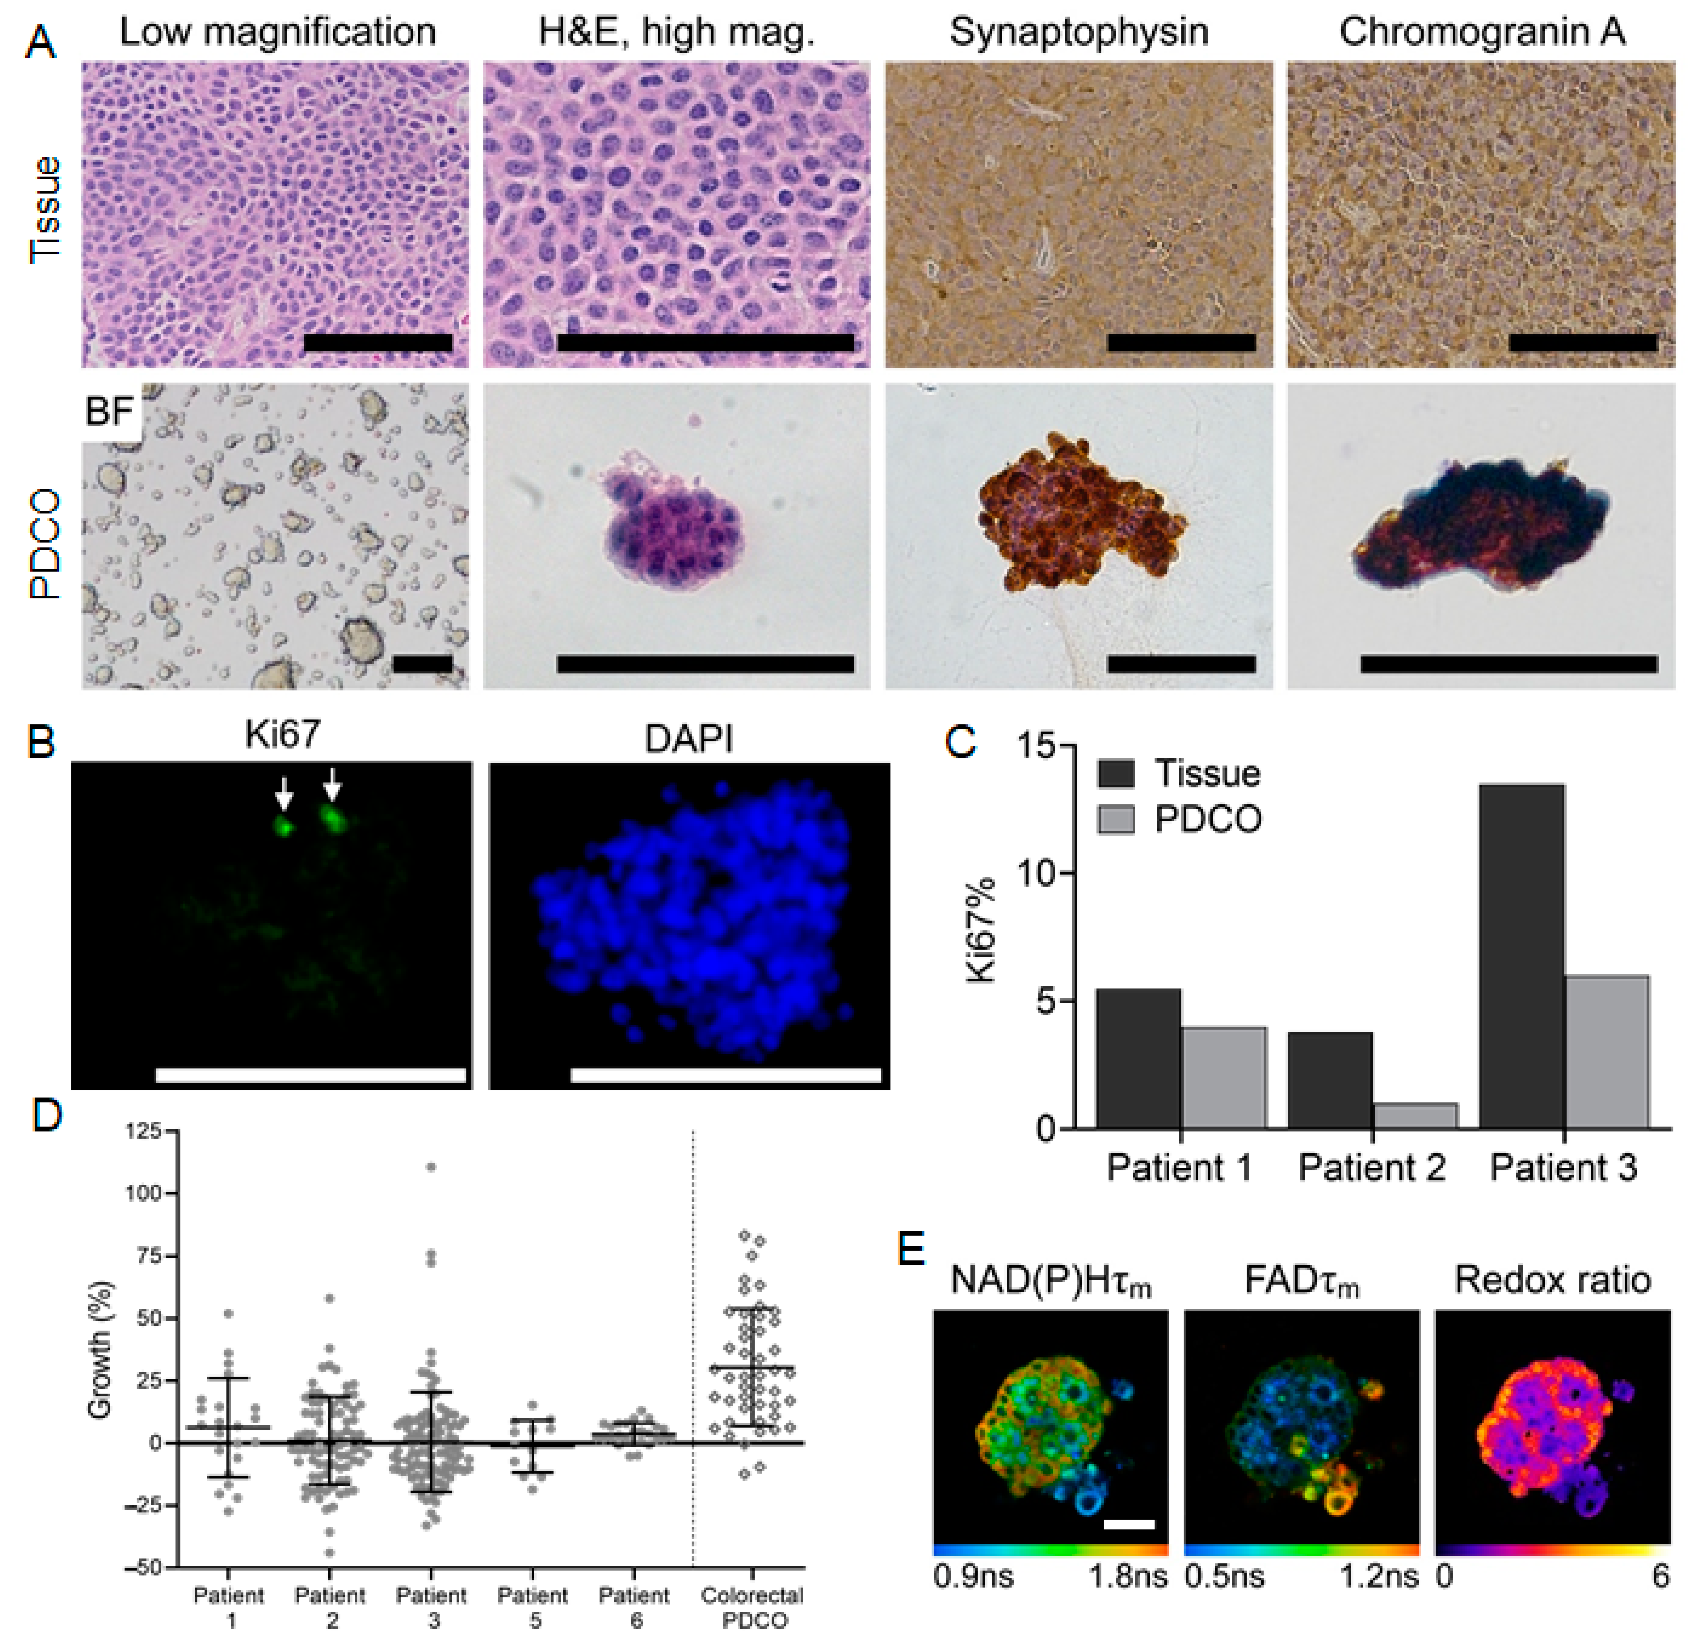
3.2. Patient-Derived Cancer Oranoids of Well-Differentiated NET
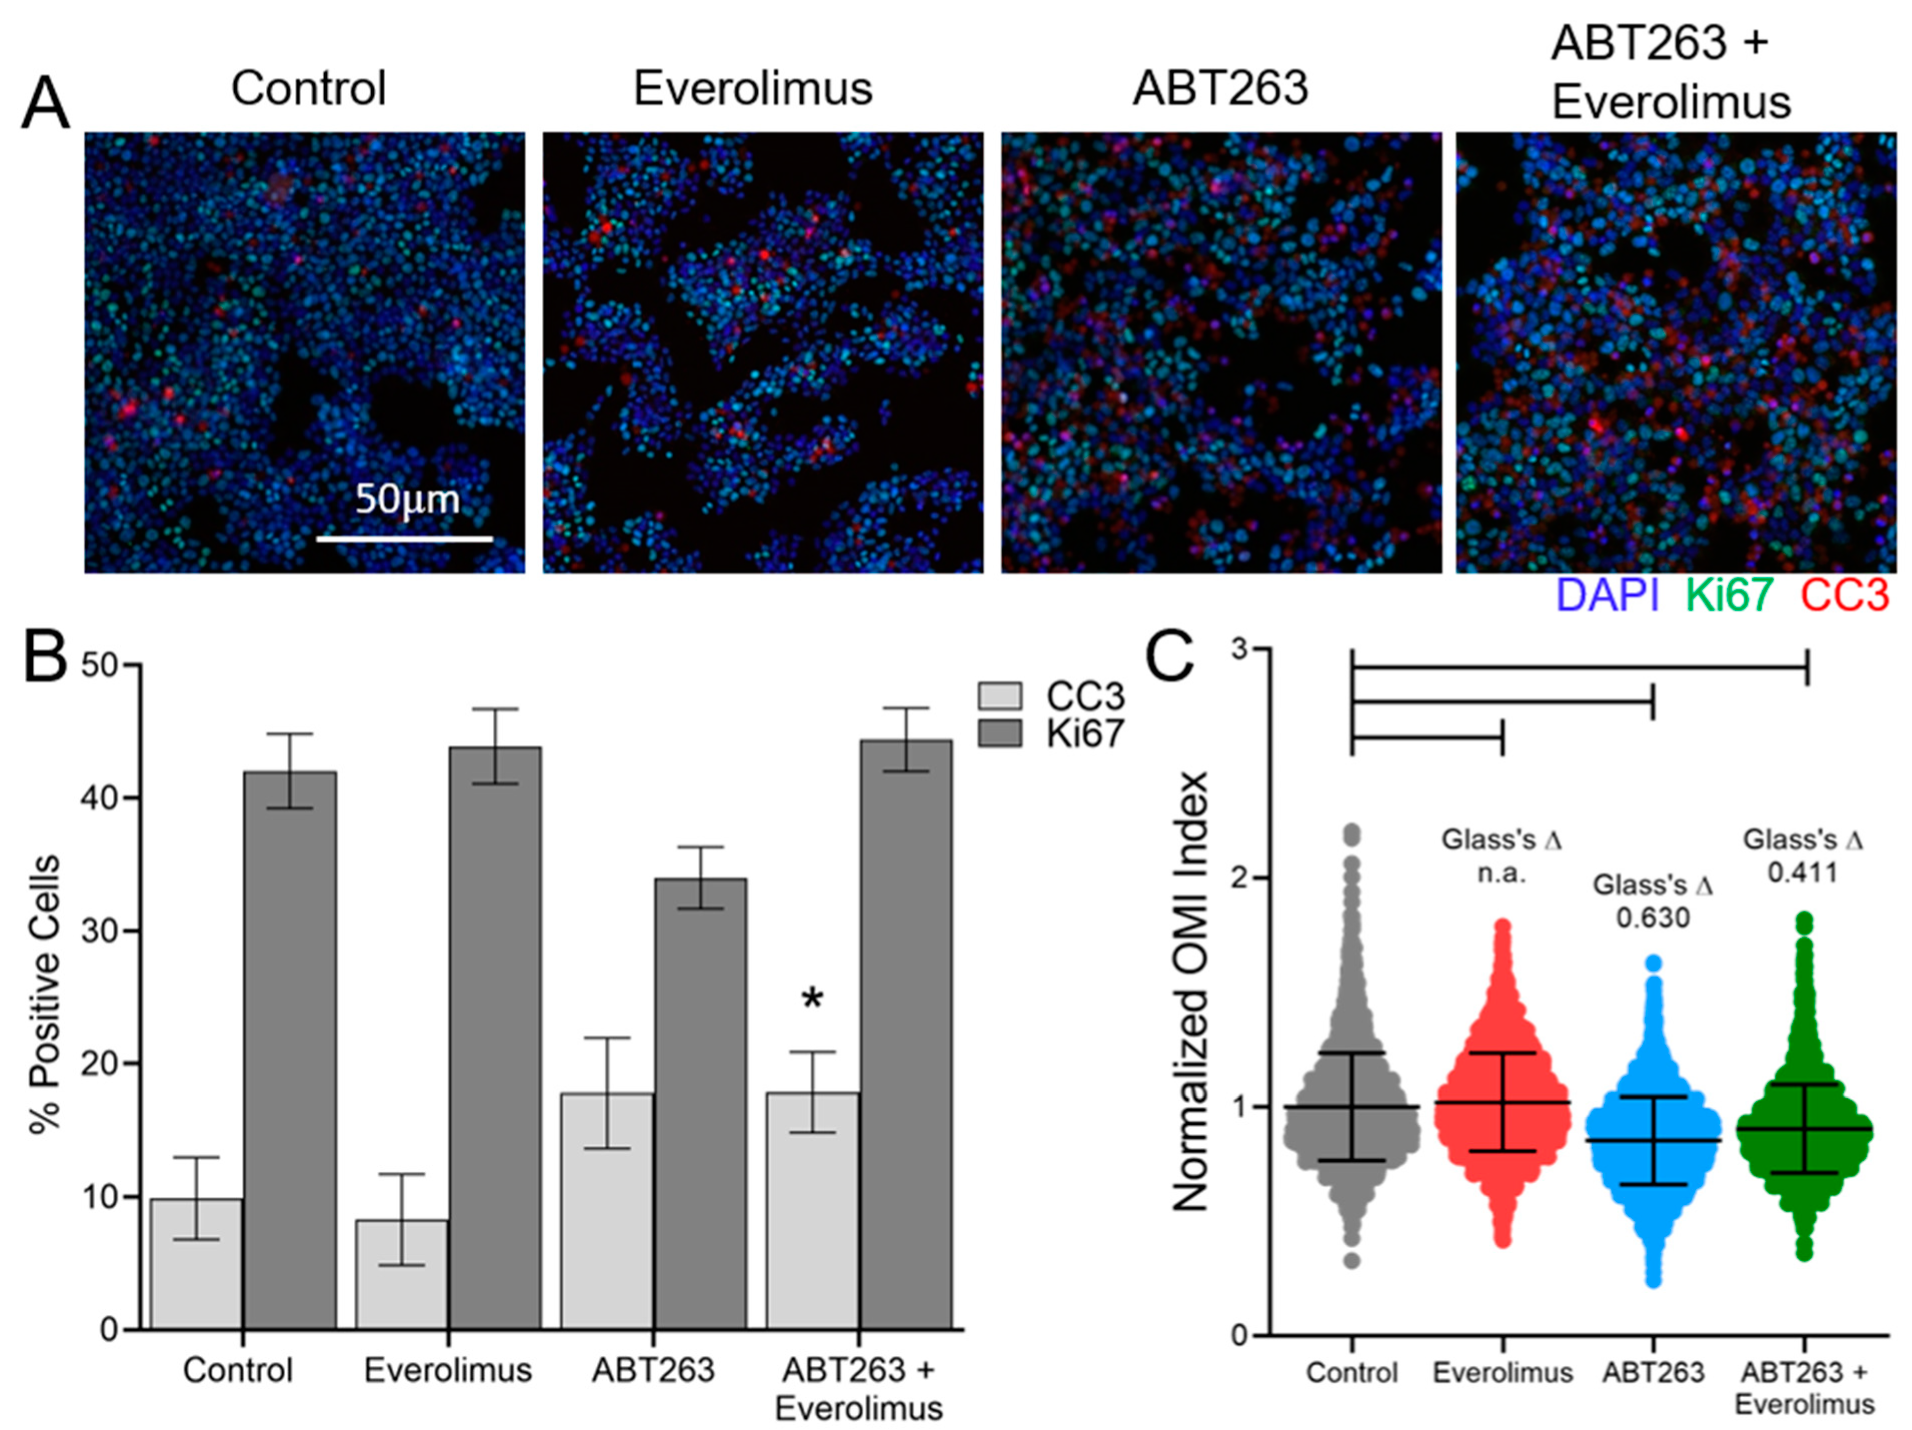
3.3. OMI of Treatment Response in GEP-NET PDCOs
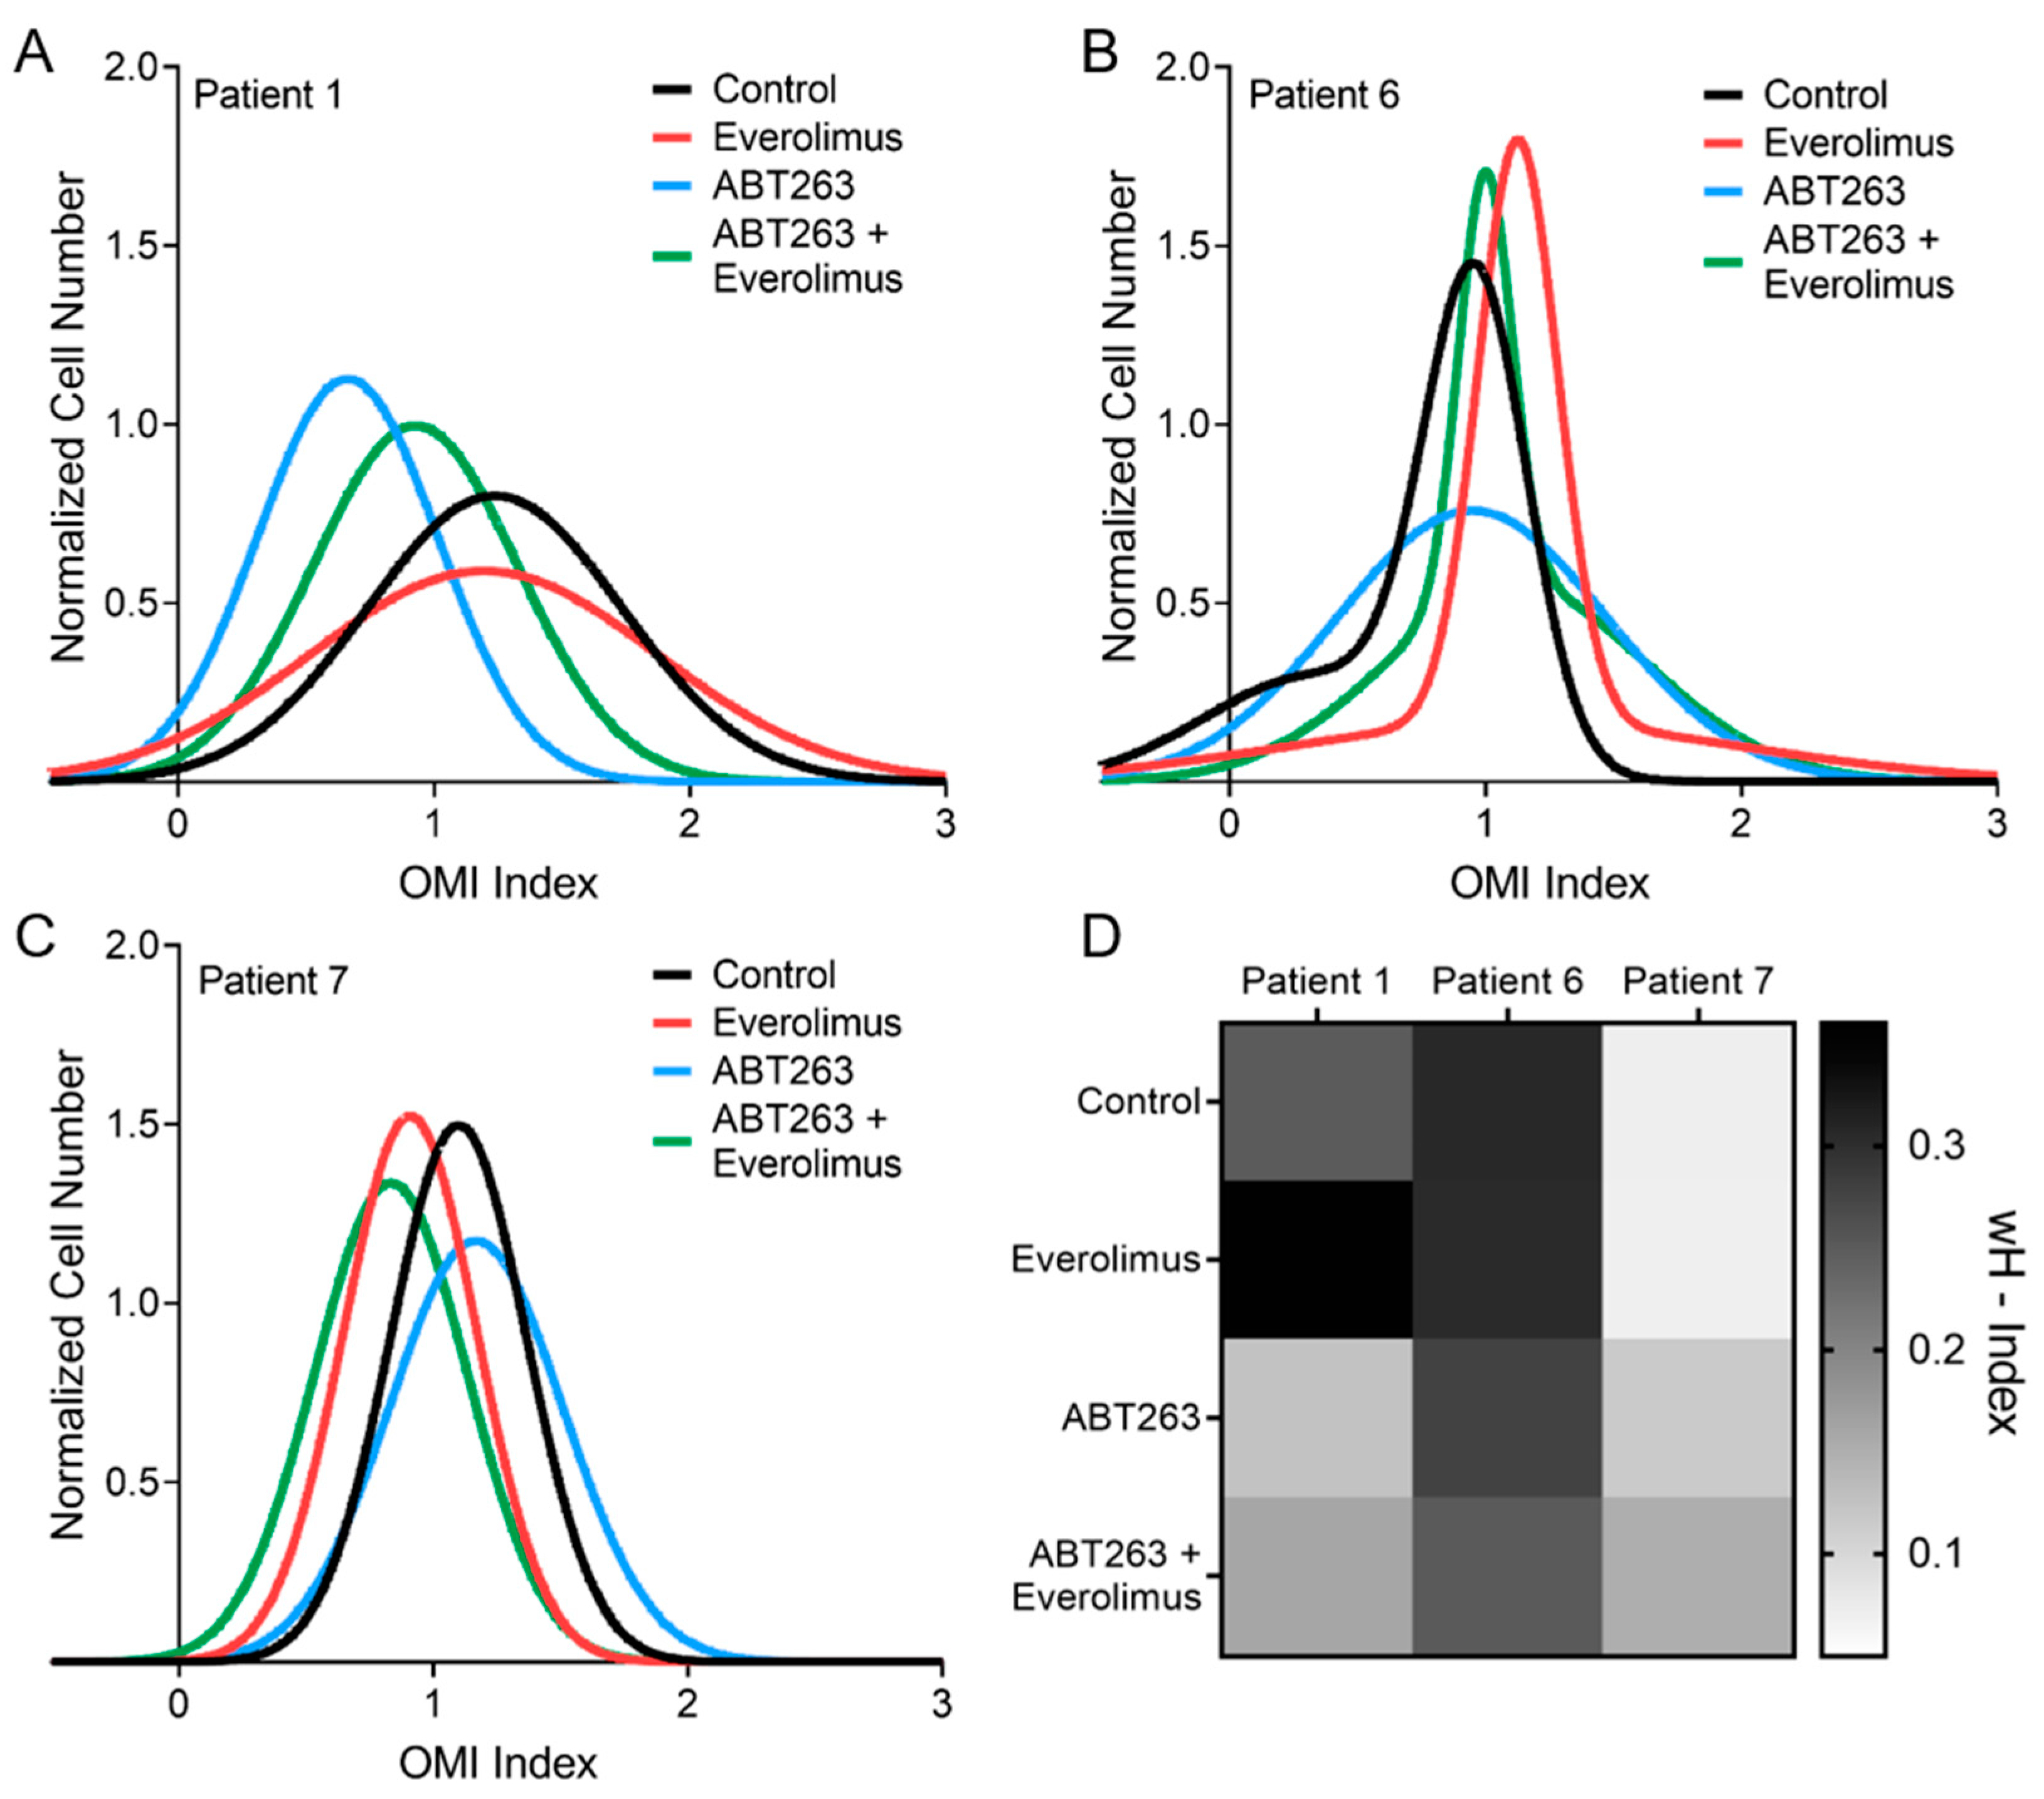
3.4. OMI Quantifies Single Cell Metabolic Heterogeneity
3.5. OMI Measurements of Inter-Patient Heterogeneity
4. Discussion
5. Conclusions
Supplementary Materials
Author Contributions
Funding
Institutional Review Board Statement
Informed Consent Statement
Data Availability Statement
Acknowledgments
Conflicts of Interest
References
- Dasari, A.; Shen, C.; Halperin, D.; Zhao, B.; Zhou, S.; Xu, Y.; Shih, T.; Yao, J.C. Trends in the Incidence, Prevalence, and Survival Outcomes in Patients With Neuroendocrine Tumors in the United States. JAMA Oncol. 2017, 3, 1335–1342. [Google Scholar] [CrossRef]
- Shah, M.H.; Goldner, W.S.; Halfdanarson, T.R.; Bergsland, E.; Berlin, J.D.; Halperin, D.; Chan, J.; Kulke, M.H.; Benson, A.B.; Blaszkowsky, L.S.; et al. NCCN Guidelines Insights: Neuroendocrine and Adrenal Tumors, Version 2.2018. J. Natl. Compr. Cancer Netw. 2018, 16, 693–702. [Google Scholar] [CrossRef]
- Yao, J.C.; Fazio, N.; Singh, S.; Buzzoni, R.; Carnaghi, C.; Wolin, E.; Tomasek, J.; Raderer, M.; Lahner, H.; Voi, M.; et al. Everolimus for the treatment of advanced, non-functional neuroendocrine tumours of the lung or gastrointestinal tract (RADIANT-4): A randomised, placebo-controlled, phase 3 study. Lancet 2016, 387, 968–977. [Google Scholar] [CrossRef]
- Yao, J.C.; Shah, M.H.; Ito, T.; Bohas, C.L.; Wolin, E.M.; Van Cutsem, E.; Hobday, T.J.; Okusaka, T.; Capdevila, J.; de Vries, E.G.; et al. Everolimus for advanced pancreatic neuroendocrine tumors. N. Engl. J. Med. 2011, 364, 514–523. [Google Scholar] [CrossRef] [PubMed]
- Phan, A.T.; Dave, B. The pivotal role of mammalian target of rapamycin inhibition in the treatment of patients with neuroendocrine tumors. Cancer Med. 2016, 5, 2953–2964. [Google Scholar] [CrossRef]
- Davids, M.S.; Letai, A. Targeting the B-cell lymphoma/leukemia 2 family in cancer. J. Clin. Oncol. 2012, 30, 3127–3135. [Google Scholar] [CrossRef]
- Vachhani, P.; Bose, P.; Rahmani, M.; Grant, S. Rational combination of dual PI3K/mTOR blockade and Bcl-2/-xL inhibition in AML. Physiol. Genom. 2014, 46, 448–456. [Google Scholar] [CrossRef] [PubMed]
- Fruman, D.A.; Rommel, C. PI3K and cancer: Lessons, challenges and opportunities. Nat. Rev. Drug Discov. 2014, 13, 140–156. [Google Scholar] [CrossRef]
- Rahmani, M.; Aust, M.M.; Attkisson, E.; Williams, D.C., Jr.; Ferreira-Gonzalez, A.; Grant, S. Dual inhibition of Bcl-2 and Bcl-xL strikingly enhances PI3K inhibition-induced apoptosis in human myeloid leukemia cells through a GSK3- and Bim-dependent mechanism. Cancer Res. 2013, 73, 1340–1351. [Google Scholar] [CrossRef]
- Gardner, E.E.; Connis, N.; Poirier, J.T.; Cope, L.; Dobromilskaya, I.; Gallia, G.L.; Rudin, C.M.; Hann, C.L. Rapamycin rescues ABT-737 efficacy in small cell lung cancer. Cancer Res. 2014, 74, 2846–2856. [Google Scholar] [CrossRef]
- Kawasaki, K.; Fujii, M.; Sato, T. Gastroenteropancreatic neuroendocrine neoplasms: Genes, therapies and models. Dis. Model. Mech. 2018, 11. [Google Scholar] [CrossRef] [PubMed]
- Tang, L.H.; Gonen, M.; Hedvat, C.; Modlin, I.M.; Klimstra, D.S. Objective quantification of the Ki67 proliferative index in neuroendocrine tumors of the gastroenteropancreatic system: A comparison of digital image analysis with manual methods. Am. J. Surg. Pathol. 2012, 36, 1761–1770. [Google Scholar] [CrossRef] [PubMed]
- Hofving, T.; Arvidsson, Y.; Almobarak, B.; Inge, L.; Pfragner, R.; Persson, M.; Stenman, G.; Kristiansson, E.; Johanson, V.; Nilsson, O. The neuroendocrine phenotype, genomic profile and therapeutic sensitivity of GEPNET cell lines. Endocr. Relat. Cancer 2018, 25, 367–380. [Google Scholar] [CrossRef]
- Kawasaki, K.; Toshimitsu, K.; Matano, M.; Fujita, M.; Fujii, M.; Togasaki, K.; Ebisudani, T.; Shimokawa, M.; Takano, A.; Takahashi, S.; et al. An Organoid Biobank of Neuroendocrine Neoplasms Enables Genotype-Phenotype Mapping. Cell 2020, 183, 1420–1435. [Google Scholar] [CrossRef]
- April-Monn, S.L.; Wiedmer, T.; Skowronska, M.; Maire, R.; Schiavo Lena, M.; Trippel, M.; Di Domenico, A.; Muffatti, F.; Andreasi, V.; Capurso, G.; et al. Three-Dimensional Primary Cell Culture: A Novel Preclinical Model for Pancreatic Neuroendocrine Tumors. Neuroendocrinology 2021, 111, 273–287. [Google Scholar] [CrossRef]
- Ear, P.H.; Li, G.; Wu, M.; Abusada, E.; Bellizzi, A.M.; Howe, J.R. Establishment and Characterization of Small Bowel Neuroendocrine Tumor Spheroids. J. Vis. Exp. 2019. [Google Scholar] [CrossRef]
- Mohamed, A.; Romano, D.; Saveanu, A.; Roche, C.; Albertelli, M.; Barbieri, F.; Brue, T.; Niccoli, P.; Delpero, J.R.; Garcia, S.; et al. Anti-proliferative and anti-secretory effects of everolimus on human pancreatic neuroendocrine tumors primary cultures: Is there any benefit from combination with somatostatin analogs? Oncotarget 2017, 8, 41044–41063. [Google Scholar] [CrossRef] [PubMed]
- Mohamed, A.; Blanchard, M.P.; Albertelli, M.; Barbieri, F.; Brue, T.; Niccoli, P.; Delpero, J.R.; Monges, G.; Garcia, S.; Ferone, D.; et al. Pasireotide and octreotide antiproliferative effects and sst2 trafficking in human pancreatic neuroendocrine tumor cultures. Endocr. Relat. Cancer 2014, 21, 691–704. [Google Scholar] [CrossRef] [PubMed]
- Okkelman, I.A.; Foley, T.; Papkovsky, D.B.; Dmitriev, R.I. Live cell imaging of mouse intestinal organoids reveals heterogeneity in their oxygenation. Biomaterials 2017, 146, 86–96. [Google Scholar] [CrossRef]
- Kondo, H.; Ratcliffe, C.D.H.; Hooper, S.; Ellis, J.; MacRae, J.I.; Hennequart, M.; Dunsby, C.W.; Anderson, K.I.; Sahai, E. Single-cell resolved imaging reveals intra-tumor heterogeneity in glycolysis, transitions between metabolic states, and their regulatory mechanisms. Cell Rep. 2021, 34, 108750. [Google Scholar] [CrossRef]
- Johnson, J.; Sharick, J.T.; Skala, M.C.; Li, L. Sample preparation strategies for high-throughput mass spectrometry imaging of primary tumor organoids. J. Mass Spectrom. 2020, 55, e4452. [Google Scholar] [CrossRef] [PubMed]
- Blacker, T.S.; Mann, Z.F.; Gale, J.E.; Ziegler, M.; Bain, A.J.; Szabadkai, G.; Duchen, M.R. Separating NADH and NADPH fluorescence in live cells and tissues using FLIM. Nat. Commun. 2014, 5, 3936. [Google Scholar] [CrossRef] [PubMed]
- Williamson, D.H.; Lund, P.; Krebs, H.A. The redox state of free nicotinamide-adenine dinucleotide in the cytoplasm and mitochondria of rat liver. Biochem. J. 1967, 103, 514–527. [Google Scholar] [CrossRef]
- Xiao, W.; Wang, R.S.; Handy, D.E.; Loscalzo, J. NAD(H) and NADP(H) Redox Couples and Cellular Energy Metabolism. Antioxid. Redox. Signal 2018, 28, 251–272. [Google Scholar] [CrossRef]
- Lakowicz, J.R.; Szmacinski, H.; Nowaczyk, K.; Johnson, M.L. Fluorescence lifetime imaging of free and protein-bound NADH. Proc. Natl. Acad. Sci. USA 1992, 89, 1271–1275. [Google Scholar] [CrossRef]
- Georgakoudi, I.; Quinn, K.P. Optical imaging using endogenous contrast to assess metabolic state. Annu. Rev. Biomed. Eng. 2012, 14, 351–367. [Google Scholar] [CrossRef]
- Becker, W. Advanced Time-Correlated Single Photon Counting Techniques; Springer: Berlin, Germany, 2005; pp. xix, 401. [Google Scholar]
- Nakashima, N.; Yoshihara, K.; Tanaka, F.; Yagi, K. Picosecond fluorescence lifetime of the coenzyme of D-amino acid oxidase. J. Biol. Chem. 1980, 255, 5261–5263. [Google Scholar] [CrossRef]
- Walsh, A.J.; Cook, R.S.; Sanders, M.E.; Aurisicchio, L.; Ciliberto, G.; Arteaga, C.L.; Skala, M.C. Quantitative optical imaging of primary tumor organoid metabolism predicts drug response in breast cancer. Cancer Res. 2014, 74, 5184–5194. [Google Scholar] [CrossRef]
- Zhao, Y.; Butler, E.B.; Tan, M. Targeting cellular metabolism to improve cancer therapeutics. Cell Death Dis. 2013, 4, e532. [Google Scholar] [CrossRef] [PubMed]
- Sharick, J.T.; Walsh, C.M.; Sprackling, C.M.; Pasch, C.A.; Parikh, A.A.; Matkowskyj, K.A.; Deming, D.A.; Skala, M.C. Optical Metabolic Imaging of Heterogeneous Drug Response in Pancreatic Cancer Patient Organoids. bioRxiv 2019. [Google Scholar] [CrossRef]
- Okkelman, I.A.; Neto, N.; Papkovsky, D.B.; Monaghan, M.G.; Dmitriev, R.I. A deeper understanding of intestinal organoid metabolism revealed by combining fluorescence lifetime imaging microscopy (FLIM) and extracellular flux analyses. Redox. Biol. 2020, 30, 101420. [Google Scholar] [CrossRef] [PubMed]
- Hou, J.; Wright, H.J.; Chan, N.; Tran, R.; Razorenova, O.V.; Potma, E.O.; Tromberg, B.J. Correlating two-photon excited fluorescence imaging of breast cancer cellular redox state with seahorse flux analysis of normalized cellular oxygen consumption. J. Biomed. Opt. 2016, 21, 60503. [Google Scholar] [CrossRef] [PubMed]
- Varone, A.; Xylas, J.; Quinn, K.P.; Pouli, D.; Sridharan, G.; McLaughlin-Drubin, M.E.; Alonzo, C.; Lee, K.; Munger, K.; Georgakoudi, I. Endogenous two-photon fluorescence imaging elucidates metabolic changes related to enhanced glycolysis and glutamine consumption in precancerous epithelial tissues. Cancer Res. 2014, 74, 3067–3075. [Google Scholar] [CrossRef]
- Walsh, A.J.; Poole, K.M.; Duvall, C.L.; Skala, M.C. Ex vivo optical metabolic measurements from cultured tissue reflect in vivo tissue status. J. Biomed. Opt. 2012, 17, 116015. [Google Scholar] [CrossRef] [PubMed]
- Pasch, C.A.; Favreau, P.F.; Yueh, A.E.; Babiarz, C.P.; Gillette, A.A.; Sharick, J.T.; Karim, M.R.; Nickel, K.P.; DeZeeuw, A.K.; Sprackling, C.M.; et al. Patient-Derived Cancer Organoid Cultures to Predict Sensitivity to Chemotherapy and Radiation. Clin. Cancer Res. 2019, 25, 5376–5387. [Google Scholar] [CrossRef]
- Vandamme, T.; Beyens, M.; de Beeck, K.O.; Dogan, F.; van Koetsveld, P.M.; Pauwels, P.; Mortier, G.; Vangestel, C.; de Herder, W.; Van Camp, G.; et al. Long-term acquired everolimus resistance in pancreatic neuroendocrine tumours can be overcome with novel PI3K-AKT-mTOR inhibitors. Br. J. Cancer 2016, 114, 650–658. [Google Scholar] [CrossRef]
- Kirchner, G.I.; Meier-Wiedenbach, I.; Manns, M.P. Clinical pharmacokinetics of everolimus. Clin. Pharmacokinet. 2004, 43, 83–95. [Google Scholar] [CrossRef]
- Sanchez-Fructuoso, A.I. Everolimus: An update on the mechanism of action, pharmacokinetics and recent clinical trials. Expert Opin. Drug Metab. Toxicol. 2008, 4, 807–819. [Google Scholar] [CrossRef]
- Wilson, W.H.; O’Connor, O.A.; Czuczman, M.S.; LaCasce, A.S.; Gerecitano, J.F.; Leonard, J.P.; Tulpule, A.; Dunleavy, K.; Xiong, H.; Chiu, Y.L.; et al. Navitoclax, a targeted high-affinity inhibitor of BCL-2, in lymphoid malignancies: A phase 1 dose-escalation study of safety, pharmacokinetics, pharmacodynamics, and antitumour activity. Lancet Oncol. 2010, 11, 1149–1159. [Google Scholar] [CrossRef]
- Tolcher, A.W.; LoRusso, P.; Arzt, J.; Busman, T.A.; Lian, G.; Rudersdorf, N.S.; Vanderwal, C.A.; Kirschbrown, W.; Holen, K.D.; Rosen, L.S. Safety, efficacy, and pharmacokinetics of navitoclax (ABT-263) in combination with erlotinib in patients with advanced solid tumors. Cancer Chemother. Pharmacol. 2015, 76, 1025–1032. [Google Scholar] [CrossRef]
- Walsh, A.J.; Cook, R.S.; Manning, H.C.; Hicks, D.J.; Lafontant, A.; Arteaga, C.L.; Skala, M.C. Optical metabolic imaging identifies glycolytic levels, subtypes, and early-treatment response in breast cancer. Cancer Res. 2013, 73, 6164–6174. [Google Scholar] [CrossRef] [PubMed]
- Lakowicz, J.R. Principles of frequency-domain fluorescence spectroscopy and applications to cell membranes. Subcell. Biochem. 1988, 13, 89–126. [Google Scholar] [CrossRef]
- Walsh, A.J.; Skala, M.C. An automated image processing routine for segmentation of cell cytoplasms in high-resolution autofluorescence images. Proc. SPIE 2014, 8948. [Google Scholar] [CrossRef]
- Walsh, A.J.; Skala, M.C. Optical metabolic imaging quantifies heterogeneous cell populations. Biomed. Opt. Express 2015, 6, 559–573. [Google Scholar] [CrossRef] [PubMed]
- Akaike, H. New Look at Statistical-Model Identification. IEEE Trans. Autom. Control 1974, Ac19, 716–723. [Google Scholar] [CrossRef]
- Shah, A.T.; Diggins, K.E.; Walsh, A.J.; Irish, J.M.; Skala, M.C. In Vivo Autofluorescence Imaging of Tumor Heterogeneity in Response to Treatment. Neoplasia 2015, 17, 862–870. [Google Scholar] [CrossRef]
- Sharick, J.T.; Jeffery, J.J.; Karim, M.R.; Walsh, C.M.; Esbona, K.; Cook, R.S.; Skala, M.C. Cellular Metabolic Heterogeneity In Vivo Is Recapitulated in Tumor Organoids. Neoplasia 2019, 21, 615–626. [Google Scholar] [CrossRef]
- Sharick, J.T.; Walsh, C.M.; Sprackling, C.M.; Pasch, C.A.; Pham, D.L.; Esbona, K.; Choudhary, A.; Garcia-Valera, R.; Burkard, M.E.; McGregor, S.M.; et al. Metabolic Heterogeneity in Patient Tumor-Derived Organoids by Primary Site and Drug Treatment. Front. Oncol. 2020, 10, 553. [Google Scholar] [CrossRef]
- Sawilowsky, S.S. New Effect Size Rules of Thumb. J. Mod. Appl. Stat. Methods 2009, 8. [Google Scholar] [CrossRef]
- GLASS, G.V. Primary, Secondary, and Meta-Analysis of Research. Educ. Res. 1976, 5, 3–8. [Google Scholar] [CrossRef]
- Foley, T.M.; Payne, S.N.; Pasch, C.A.; Yueh, A.E.; Van De Hey, D.R.; Korkos, D.P.; Clipson, L.; Maher, M.E.; Matkowskyj, K.A.; Newton, M.A.; et al. Dual PI3K/mTOR Inhibition in Colorectal Cancers with APC and PIK3CA Mutations. Mol. Cancer Res. 2017, 15, 317–327. [Google Scholar] [CrossRef]
- Payne, S.N.; Maher, M.E.; Tran, N.H.; Van De Hey, D.R.; Foley, T.M.; Yueh, A.E.; Leystra, A.A.; Pasch, C.A.; Jeffrey, J.J.; Clipson, L.; et al. PIK3CA mutations can initiate pancreatic tumorigenesis and are targetable with PI3K inhibitors. Oncogenesis 2015, 4, e169. [Google Scholar] [CrossRef]
- Matsukuma, K.; Olson, K.A.; Gui, D.; Gandour-Edwards, R.; Li, Y.; Beckett, L. Synaptophysin-Ki67 double stain: A novel technique that improves interobserver agreement in the grading of well-differentiated gastrointestinal neuroendocrine tumors. Mod. Pathol. 2017, 30, 620–629. [Google Scholar] [CrossRef] [PubMed]
- Walker, C.; Wright-Perkins, S. Expression of neuroendocrine and epithelial markers in an adherent subline derived from a classic small cell lung cancer cell line. Oncol. Res. 1992, 4, 419–429. [Google Scholar] [PubMed]
- Rinke, A.; Muller, H.H.; Schade-Brittinger, C.; Klose, K.J.; Barth, P.; Wied, M.; Mayer, C.; Aminossadati, B.; Pape, U.F.; Blaker, M.; et al. Placebo-controlled, double-blind, prospective, randomized study on the effect of octreotide LAR in the control of tumor growth in patients with metastatic neuroendocrine midgut tumors: A report from the PROMID Study Group. J. Clin. Oncol. 2009, 27, 4656–4663. [Google Scholar] [CrossRef] [PubMed]
- Shi, H.; Zhang, Q.; Han, C.; Zhen, D.; Lin, R. Variability of the Ki-67 proliferation index in gastroenteropancreatic neuroendocrine neoplasms—A single-center retrospective study. BMC Endocr. Disord. 2018, 18, 51. [Google Scholar] [CrossRef]
- Walsh, A.J.; Castellanos, J.A.; Nagathihalli, N.S.; Merchant, N.B.; Skala, M.C. Optical Imaging of Drug-Induced Metabolism Changes in Murine and Human Pancreatic Cancer Organoids Reveals Heterogeneous Drug Response. Pancreas 2016, 45, 863–869. [Google Scholar] [CrossRef] [PubMed]
- Raymond, E.; Dahan, L.; Raoul, J.-L.; Bang, Y.-J.; Borbath, I.; Lombard-Bohas, C.; Valle, J.; Metrakos, P.; Smith, D.; Vinik, A.; et al. Sunitinib Malate for the Treatment of Pancreatic Neuroendocrine Tumors. NEJM 2011, 364, 501–513. [Google Scholar] [CrossRef]


| Sample | Site of Origin | Differentiation | Grade | Ki67% |
|---|---|---|---|---|
| Patient 1 | Pancreatic tail | Well-differentiated | G2 | 5.5% |
| Patient 2 | Pancreatic head | Well-differentiated | G2 | 3.8% |
| Patient 3 | Mesentery | Well-differentiated | G2 | 13.5% |
| Patient 4 | Ileum | Well-differentiated | G1 | <2% |
| Patient 5 | Ileum | Well-differentiated | G2 | 9.1% |
| Patient 6 | Lymph node | Well-differentiated | G2 | 5% |
| Patient 7 | Duodenum | Well-differentiated | G2 | 8.15% |
Publisher’s Note: MDPI stays neutral with regard to jurisdictional claims in published maps and institutional affiliations. |
© 2021 by the authors. Licensee MDPI, Basel, Switzerland. This article is an open access article distributed under the terms and conditions of the Creative Commons Attribution (CC BY) license (https://creativecommons.org/licenses/by/4.0/).
Share and Cite
Gillette, A.A.; Babiarz, C.P.; VanDommelen, A.R.; Pasch, C.A.; Clipson, L.; Matkowskyj, K.A.; Deming, D.A.; Skala, M.C. Autofluorescence Imaging of Treatment Response in Neuroendocrine Tumor Organoids. Cancers 2021, 13, 1873. https://doi.org/10.3390/cancers13081873
Gillette AA, Babiarz CP, VanDommelen AR, Pasch CA, Clipson L, Matkowskyj KA, Deming DA, Skala MC. Autofluorescence Imaging of Treatment Response in Neuroendocrine Tumor Organoids. Cancers. 2021; 13(8):1873. https://doi.org/10.3390/cancers13081873
Chicago/Turabian StyleGillette, Amani A., Christopher P. Babiarz, Ava R. VanDommelen, Cheri A. Pasch, Linda Clipson, Kristina A. Matkowskyj, Dustin A. Deming, and Melissa C. Skala. 2021. "Autofluorescence Imaging of Treatment Response in Neuroendocrine Tumor Organoids" Cancers 13, no. 8: 1873. https://doi.org/10.3390/cancers13081873
APA StyleGillette, A. A., Babiarz, C. P., VanDommelen, A. R., Pasch, C. A., Clipson, L., Matkowskyj, K. A., Deming, D. A., & Skala, M. C. (2021). Autofluorescence Imaging of Treatment Response in Neuroendocrine Tumor Organoids. Cancers, 13(8), 1873. https://doi.org/10.3390/cancers13081873