Article

Systematic Analysis of the Transcriptome Profiles and Co-Expression Networks of Tumour Endothelial Cells Identifies Several Tumour-Associated Modules and Potential Therapeutic Targets in Hepatocellular Carcinoma

1
ScienceConsult—DI Thomas Mohr KG, Enzianweg 10a, A-2353 Guntramsdorf, Austria
2
Institute of Cancer Research, Department of Medicine I, Medical University of Vienna and Comprehensive Cancer Center, A-1090 Vienna, Austria
3
Department of Dermatology, Medical University of Vienna, A-1090 Vienna, Austria
4
Max-Planck-Institute of Immunobiology and Epigenetics, D-79108 Freiburg, Germany
5
Department of Blood Group Serology and Transfusion Medicine, Medical University of Vienna, A-1090 Vienna, Austria
6
Center of Physiology and Pharmacology, Institute of Vascular Biology and Thrombosis Research, Medical University of Vienna, A-1090 Vienna, Austria
7
Section of Artificial Intelligence and Decision Support, Center for Medical Statistics, Informatics and Intelligent Systems, Medical University of Vienna, A-1090 Vienna, Austria
*
Author to whom correspondence should be addressed.
Cancers 2021, 13(8), 1768; https://doi.org/10.3390/cancers13081768
Submission received: 17 February 2021 / Revised: 27 March 2021 / Accepted: 31 March 2021 / Published: 7 April 2021
(This article belongs to the Special Issue Hepatocellular Carcinoma)

Abstract

:

Simple Summary

Endothelial cells, the innermost layer of blood vessels, play an essential role in the progression of cancer, particularly liver cancer. To develop cancer therapies targeting those cells, the investigation of gene co-expression networks is of great importance. In this study, we investigated the gene expression profile of tumour endothelial cells. We compared it to endothelial cells from non-tumour liver-tissue. Using gene-network based methods, we could identify genes that may play a unique role in liver cancer progression or be a target for cancer therapy. Additionally, we provided a framework for similar analyses in other cancers.

Abstract

Hepatocellular carcinoma (HCC) is the sixth most common cancer and the third most common cause of cancer-related death, with tumour associated liver endothelial cells being thought to be major drivers in HCC progression. This study aims to compare the gene expression profiles of tumour endothelial cells from the liver with endothelial cells from non-tumour liver tissue, to identify perturbed biologic functions, co-expression modules, and potentially drugable hub genes that could give rise to novel therapeutic targets and strategies. Gene Set Variation Analysis (GSVA) showed that cell growth-related pathways were upregulated, whereas apoptosis induction, immune and inflammatory-related pathways were downregulated in tumour endothelial cells. Weighted Gene Co-expression Network Analysis (WGCNA) identified several modules strongly associated to tumour endothelial cells or angiogenic activated endothelial cells with high endoglin (ENG) expression. In tumour cells, upregulated modules were associated with cell growth, cell proliferation, and DNA-replication, whereas downregulated modules were involved in immune functions, particularly complement activation. In ENG+ cells, upregulated modules were associated with cell adhesion and endothelial functions. One downregulated module was associated with immune system-related functions. Querying the STRING database revealed known functional-interaction networks underlying the modules. Several possible hub genes were identified, of which some (for example FEN1, BIRC5, NEK2, CDKN3, and TTK) are potentially druggable as determined by querying the Drug Gene Interaction database. In summary, our study provides a detailed picture of the transcriptomic differences between tumour and non-tumour endothelium in the liver on a co-expression network level, indicates several potential therapeutic targets and presents an analysis workflow that can be easily adapted to other projects.

1. Introduction

Hepatocellular carcinoma (HCC) is the sixth most common cancer and the third most common cause of cancer-related death, affecting roughly 500,000 people worldwide each year [1]. It arises in a multistep process from preexisting cellular lesions [2], often aggravated due to malnutrition, increased alcohol consumption and obesity [3]. Chemotherapeutic options are often limited, and prognosis after primarily curative surgery is usually poor [4]. Between 50 and 60% of patients who undergo primary resection with curative intent are experiencing a recurrence of the tumour within five years [5].
Endothelial cells represent roughly 20% of the liver’s overall number of cells and approximately 3% of the liver volume [6,7], and they contribute actively to various processes such as metabolite transport, hemostasis in case of vascular damage, maintenance of vascular tone, inflammation, and angiogenesis [8]. Liver endothelial cells consist of two major subgroups, macrovascular endothelial cells and liver sinusoidal endothelial cells (LSEC), with LSEC presenting the majority of endothelial cells present in the liver. LSEC display fenestrated morphology with minimal basement membrane [9]. A subset of them express high levels of CD36, which is generally not detectable on other types of endothelial cells [10], and endoglin (ENG), a marker for angiogenic activation [11]. PECAM1, CD34 and classic adhesion molecules like ICAMs are weakly expressed [11]. Non-canonical adhesion molecules (VAP1, DESIGN, LYVE1, and MADCAM) are present, underlining the role of LSEC in the immune cell recruitment [11]. In unstimulated LSEC, chemokines and cytokines are only comparatively weakly expressed [11].
When tumours coopt endothelial cells during induction of angiogenesis, a switch in endothelial phenotype occurs that is characterised by loss of differentiation, development of drug resistance [12], a higher angiogenic potential [13], and a distinct gene expression pattern [14]. In HCC, this is evidenced by a loss of fenestration, abrogated expression of markers such as LYVE1 [15], profound angiogenesis, a hyper-vascularised microenvironment [15], and the expression of a cocktail of growth factors and cytokines [11,16]. Thus, tumour endothelial cells play a significant role in at least four of the ten hallmarks of cancer [17], namely “Inducing angiogenesis” [16], “Tumor promoting inflammation” [11], “Activating invasion and metastasis” [18,19], and possibly in “Resisting cell death” [15,20], making them promising targets in for HCC therapy. A combination of bevacizumab and atezolizumab is the first-line treatment in advanced HCC [21], highlighting the role of angiogenesis as target for a successful treatment and the clinical relevance to analyze specific features of TECs for potential new therapeutic targets.
However, discovering potential new therapeutic approaches aimed at endothelial cells requires in-depth knowledge about endothelial cells’ contribution to cancer progression, especially concerning underlying molecular networks. Analysis of transcriptomics datasets derived from normal and tumour endothelium using state-of-the-art co-expression network analysis methods are uniquely suitable for this task. Similar approaches have been applied to tumour cells of various cancers, including HCC [22,23,24,25], but to the best of our knowledge never used to compare tumour versus non-tumour endothelium. Network-based methods identify groups of genes - so-called modules - that act similarly across groups of samples as defined, e.g., by clinical traits, cell types, or other parameters [26]. Modules of interest can be identified by measuring the association of the so-called eigengene (a representation of the gene expression pattern of the module) with the trait of interest, in our case cell location (tumour versus non-tumour) and angiogenic activation (using endoglin as an activation marker, therefore comparing ENG+ versus ENG ), respectively. The biological context of these modules can then be investigated by term enrichment analysis, which identifies biological processes of potential relevance for the underlying pathology. Using network topology based measures, it is possible to detect key drivers and potential therapeutic targets in various pathologic processes [26,27,28].
Our study re-analyses a published dataset (E-GEOD-51401/GSE51401) derived from endothelial cells from hepatocellular carcinoma and adjacent non-tumour tissue. First, we assessed the data’s feasibility by analysing endothelial markers and compared them with RNASeq data. Then, we analysed differences in the gene expression profile and the biological context using Gene Set Variation Analysis. Third, we employed co-expression network techniques to detect gene modules associated with cell origin (tumour versus non-tumour tissue) and angiogenic activation (using endoglin as an activation marker, therefore comparing ENG+ versus ENG cells) and investigate the biological context of these modules. Forth, we used network-based parameters to determine hub genes and potential key drivers in the detected modules. Finally, we identified potential therapeutic targets by querying the Drug–Gene Interaction database with the hub genes as input. This study presents a detailed characterisation of HCC-associated tumour endothelial cells on the transcriptome level and an analysis workflow easily adaptable to other projects.

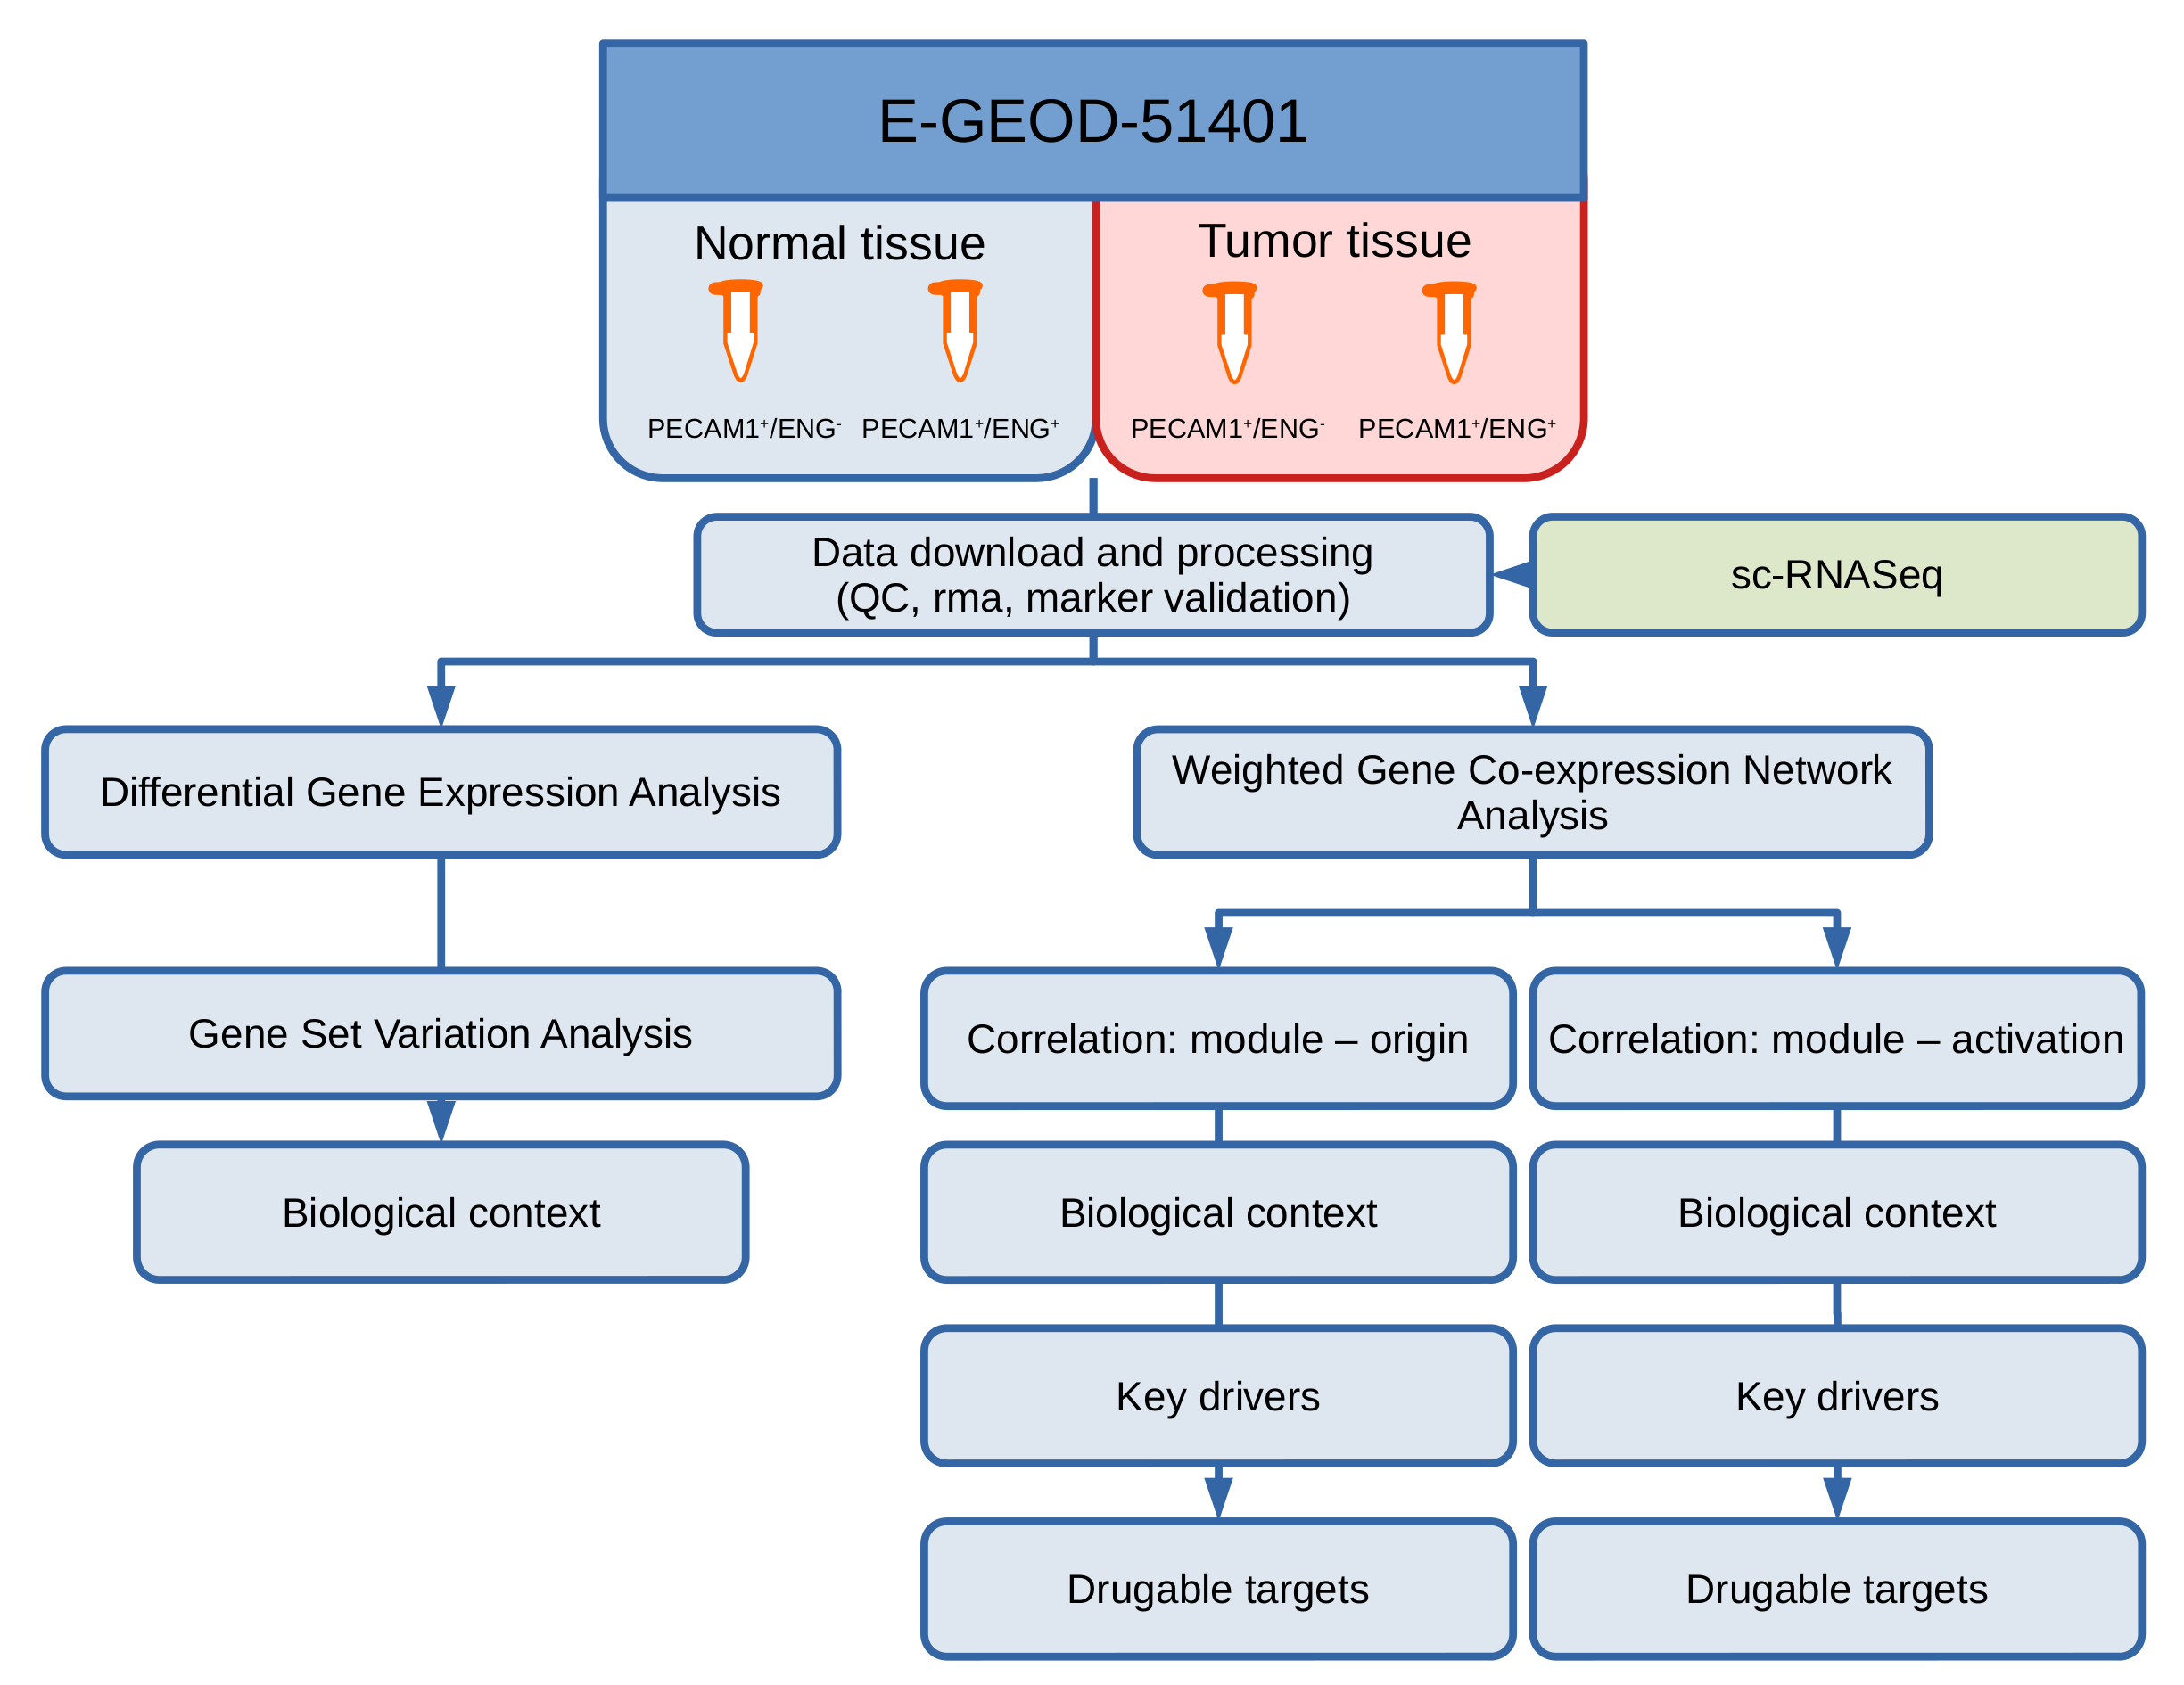
2. Materials and Methods

2.1. Data Generation and Access

The wet-lab experiments for GSE51401 were performed by Sun H and Wang X (Zhongshan hospital, affiliated to Fudan University, Shanghai, China) [20]. For a detailed description of the protocol and the experimental design, see the parallel study by Xiong et al. [20]. Briefly, the specimen of tumours (tumour endothelial cells, TEC) or surrounding non-tumour tissue (non-tumour endothelial cells, NEC) were collected after removal from patients with HCC as determined using routine clinical, histopathological analysis as well as positive alpha-fetoprotein (AFP). After washing and homogenisation, PECAM1+/ENG , as well as PECAM1+/ENG+ cells, were isolated using magnetic beads conjugated with antibodies against PECAM1 and ENG. The latter plays a crucial role in angiogenesis via regulation of cell proliferation and migration [29,30] and serves as a marker of angiogenic activation [31]. Thus, the dataset represents quiescent and angiogenic-activated endothelial cells from tumour and non-tumour liver tissue, without differentiation between endothelial subtypes. Gene expression profiling was performed by the ShanghaiBio Corporation (Shanghai, China) using the Human Genome U133 Plus 2.0 Arrays (Affymetrix, Santa Clara, CA, USA) according to manufacturer’s instruction. The authors made the data publicly available via ArrayExpress/Gene Expression Omnibus as GSE51401 [20].

2.2. Data Preprocessing and QC

CEL files were downloaded and read into “GNU R” [32] using the package “affy” [33] and preprocessed using the R-package “arrayQualityMetrics” [34]. Arrays were marked as outliers and excluded from further analysis if they exceeded the outlier thresholds defined by Kauffmann et al. [34] in any of the quality control parameters: the distance between arrays in the principal component analysis, relative log expression, normalised unscaled standard error, joint distribution of M and A, and spatial distribution. Subsequently, arrays were normalised by robust multiarray average (RMA) normalisation using the R-package “affy” [33]. Probes matching to multiple genes, antisense RNAs, pseudogenes, or uncharacterised loci were removed before further analysis, and genes with several probes present on the array were summarised to the probe with the maximal interquartile range using the “genefilter” package [35]. The resulting expression sets were subjected to a second QC analysis and removal of outliers as described above.

2.3. Single-Cell RNASeq

Single-cell RNA sequencing (scRNASeq) data were obtained from liver tissue originating from individuals with (3) and without (9) HCC by mCEL-Seq2 as described by Aizarani et al. [36]. After data preprocessing, the resulting expression matrices were clustered and assigned to cell types using the RaceID3 algorithm [37]. Clusters associated with liver sinusoidal endothelial cells, macrovascular endothelial cells and other endothelial cells were used to generate aggregated data for pseudo-bulk RNASeq analysis. Count matrices were read into R and aggregated by gene and patient via summing up counts. Samples were annotated with cell origin (i.e., HCC or non-diseased tissue) and analysed for differentially expressed genes using the R-package “DESeq2” and an e x p r e s s i o n o r i g i n design.

2.4. Differential Gene and Pathway Expression Analysis

Differential gene expression and pathway enrichment were determined using the R-package “LIMMA” [38]. Cell origin and activation were concatenated to a “group” factor and entered into the model e x p r e s s i o n 0 + g r o u p . The consensus correlation to account for pairing was calculated using the “duplicateCorrelation” function with the patient ID as a blocking variable. The model was fit using the “lmFit” function with the patient ID as a blocking variable and the consensus correlation as inter-duplicate correlation. Finally, moderated t-statistics, F-statistics and log-odds ratio were calculated using the “eBayes” function. p-values were adjusted to multiple testing according to Benjamani–Hochberg [39]. The thresholds for differentially expressed genes were set to l o g 2 ( F C ) > 2 and p a d j u s t e d < 0.05 .

2.5. Gene Set Variation Analysis

Gene Set Variation Analysis (GSVA) is an extension of the Gene Set Enrichment Analysis for complex experimental designs. Briefly, gene expressions are normalised across samples. Samples are ranked according to the normalised gene expression, and a Kolmogoroff-Smirnov-like rank statistics is calculated for each gene set. This statistics is then translated into a GSVA score, indicating enrichment of genes at the top or bottom of the sample’s ranked gene list. The result is a matrix of GSVA scores, one per gene set and sample, with a positive value indicating overexpression and a negative value indicating underexpression of the geneset’s genes. This approach’s strength lies in the fact that it translates a gene expression matrix to a term expression matrix, which can be analysed using linear models [40]. GSVA was performed using the “gsva” R-package [40]. As input, WikiPathways provided by the CPTAC (Clinical Proteomic Tumor Analysis Consortium, National Institutes of Health, Maryland, Bethesda) portal were used [41]. This group maintains a collection of cancer-related pathways based on cancer hallmarks proposed by Weinberg et al. [17] and encompasses following pathway groups: Activating invasion and metastasis, Avoiding immune destruction, Deregulating cellular energetics, Enabling replicative immortality, Evading growth suppressors, Genome instability and mutation, Inducing angiogenesis, Resisting cell death, Sustaining proliferative signalling, and Tumor promoting inflammation. Differentially enriched pathways were determined using the R-package “LIMMA” as described above.

2.6. Weighted Gene Co-Expression Network Analysis (WGCNA)

WGCNA was performed according to Langfelder et al. [42], modified by an iterative network-stabilising algorithm as described by Greenfest-Allen et al. [43]. This approach is characterised by pruning genes with a low module membership (calculated distance < 0.8) and repetition of module detection until the network stabilises. A two-Gaussian filter approach was used to remove noise due to lowly expressed genes. This approach assumes that the distribution of gene-expression follows two Gaussians, one at the lower end of the expression range representing probes with low expression values (and presumable background expression) and the other representing probes with high expression values. A threshold can be chosen so that genes with an expression value above this threshold have a higher probability of belonging to the Gaussian representing expressed genes. The threshold was set using the R-package “mixtools” [44]. Genes with a log2 expression values below the set threshold of 5.33 in all samples were excluded from further analysis. Potential outliers were removed by calculating the z-normalized inter-sample connectivity (zK) according to Oldham et al. [45]. Samples showing an z K > 1.96 were removed prior to further analysis.
WGCNA was run using the parameters as suggested by Greenfest-Allen et al. [43] for an iterative WGCNA approach except for the following: network type: “signed”, β : 12, deepsplit: 2, correlation: “bicor”, and pamStage: TRUE. A signed network approach was used to focus on the positive correlation between the genes. The goodness-of-fit of the modules was estimated by determining the median module membership of the genes, defined as the absolute correlation between the gene and the module eigengene. It can be used to assess the goodness-of-fit of the modules to the eigengenes. A module membership of 1 denotes a perfect fit, whereas a value of 0 shows no fit. Only modules with a median module membership of greater than 0.8 were considered for further analysis. The association of modules with cell origin or angiogenic activation was determined by fitting a mixed-effects model (using the R-package “lme4” [46]) and calculating the t-statistics as described by Li et al. [47]. The t-statistics can be used to assess the strength of the association between a module and a sample trait [47]. Following model was used to assess module association with cell origin or angiogenic activation:
y i j k = β 0 i + β 1 · o r i g i n j + β 2 · a c t i v a t i o n k + ϵ i j k i = 1 , , n , j = 1 , 2 , and k = 1 , 2
where y i j k is the expression level of the eigengene of the i-th subject and the jk-th sample, o r i g i n j is the cell origin (with j = 1 denoting non-tumour and j = 2 denoting tumour tissue), a c t i v a t i o n k is the activation status (k = 1 denoting ENG and k = 2 denoting ENG+ cells), β 0 i is the subject specific random intercept to account for pairing, and ϵ i j k the random error term [47]. The t-statistics and the associated p-value was calculated using the R-package “lmerTest” [48]. p-value correction was done according to Benjamani–Hochberg using the “p.adjust” function in the R-package “stats” (method = “hochberg”).
Hub genes were determined by calculating the intramodular connectivity (kWithin) [26], normalized to the maximum connectivity within the module for each gene (kWithin.norm) according to the following model:
k W i t h i n . n o r m i = i m o d u l e a i m a x ( i m o d u l e a i )
where a is the adjacency measure used to calculate the co-expression network. Genes strongly correlating with many other genes within the module will get high intramodular connectivity, whereas genes with weak correlations will receive low intramodular connectivity. The top ten percent of genes in terms of intramodular connectivity were considered as potential hub genes. To map strong correlations between genes with known functional interactions, the STRING database was queried using the “STRINGdb” R-package [49].
To determine potential druggability of identified hub genes, we performed a query on the Drug–Gene Interaction database (DGIdb) using an in-house developed API querying function [50,51].

2.7. Term Enrichment Analysis for Detected Modules

To determine the biological context of the modules, GO term Enrichment Analysis was done using the R-package “clusterProfiler” [52] querying the Gene Ontology—Biological Process database [53,54]. According to the concept that the background of a term enrichment analysis should encompass all genes interrogated, all genes present in the final expression set were defined as background. Only terms containing at least 15 genes and at most 500 genes were considered. Terms with an adjusted p-value (Benjamani–Hochberg) of less than 0.05 were considered to be significantly enriched. Terms smaller than fifteen or larger than 500 genes were excluded from the analysis. GO term reduction was done using a GOTSSA (GO term Semantic Similarity Analysis) approach. Term lists were loaded into R using the “GOSemSim” package to calculate semantic similarity based on the method described by Wang et al. [55,56]. The dimensionality of the resulting similarity data was reduced by Uniform Manifold Approximation and Projection (UMAP) [57] using the “umap” function of the “M3C” package and segmented into clusters by density-based clustering using the “fpc” R-package with an ϵ of 0.6 and 5 as a minimum number of neighbours [58]. The GO term with the highest l o g 10 ( p a d u s t e d ) was chosen as a representative for the respective cluster [59].

2.8. Statistics

If not stated otherwise, comparisons between groups were performed using Student’s t-test. If necessary, p-values were adjusted for multiple testing using the Benjamani–Hochberg procedure [39]. An adjusted p-value below 0.05 was considered to be statistically significant.

3. Results

After downloading the raw data, preprocessing and performing quality control, differences in the gene expression profiles were determined using the R-package “LIMMA” and put into biological context by performing Gene Set Variation Analysis. A co-expression network was constructed using WGCNA and segmented into groups of genes (so-called modules) with similar co-expression characteristics. The top two modules’ biological context with a high positive and the top module with a strong negative association to cell origin or angiogenic activation was investigated by term enrichment analysis. Finally, the Drug–Gene Interaction database (DGIdb) was queried using hub genes (as determined by their connectivity within the module) to determine potential drug targets (Figure 1).

3.1. Cohort Characteristics

Data preprocessing and quality control resulted in a dataset with 43 samples, drawn from 16 subjects (3 females, median age 64; 13 males, median age 52). The population characteristics, original samples and excluded samples are shown in Table 1. The discrepancy between the number of ENG and ENG+ samples is due to repeated sampling of the ENG fraction.

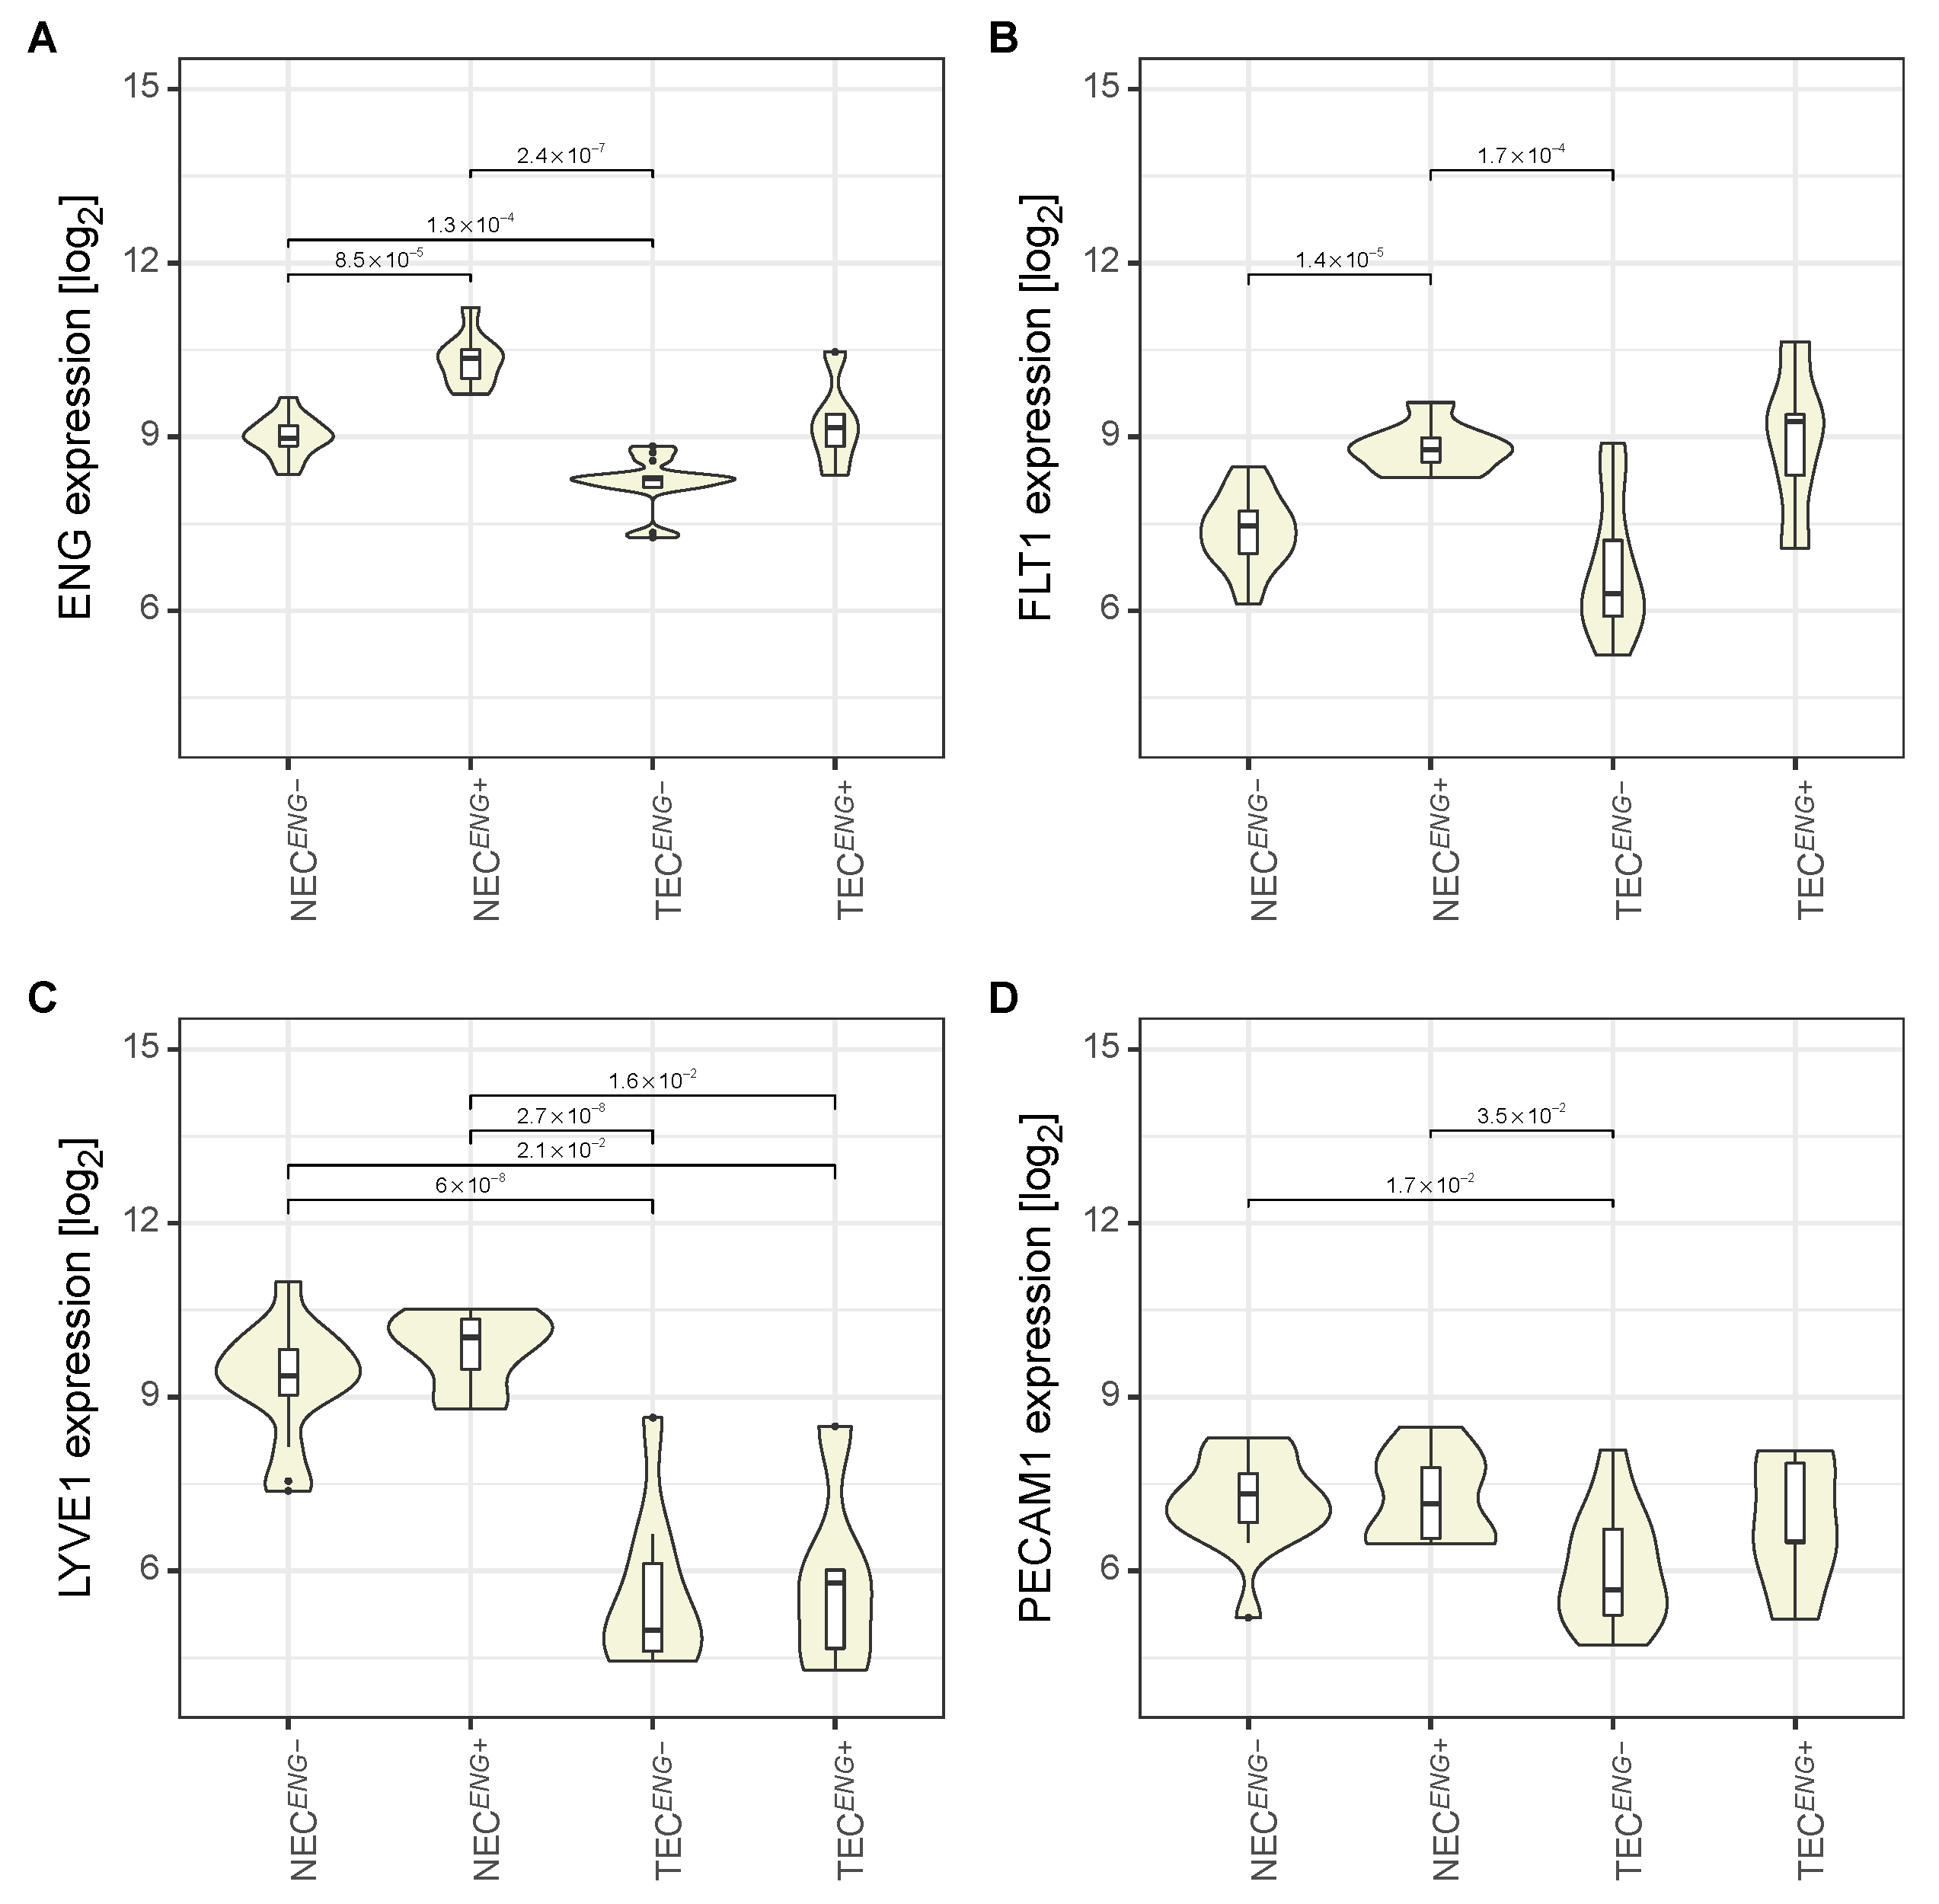
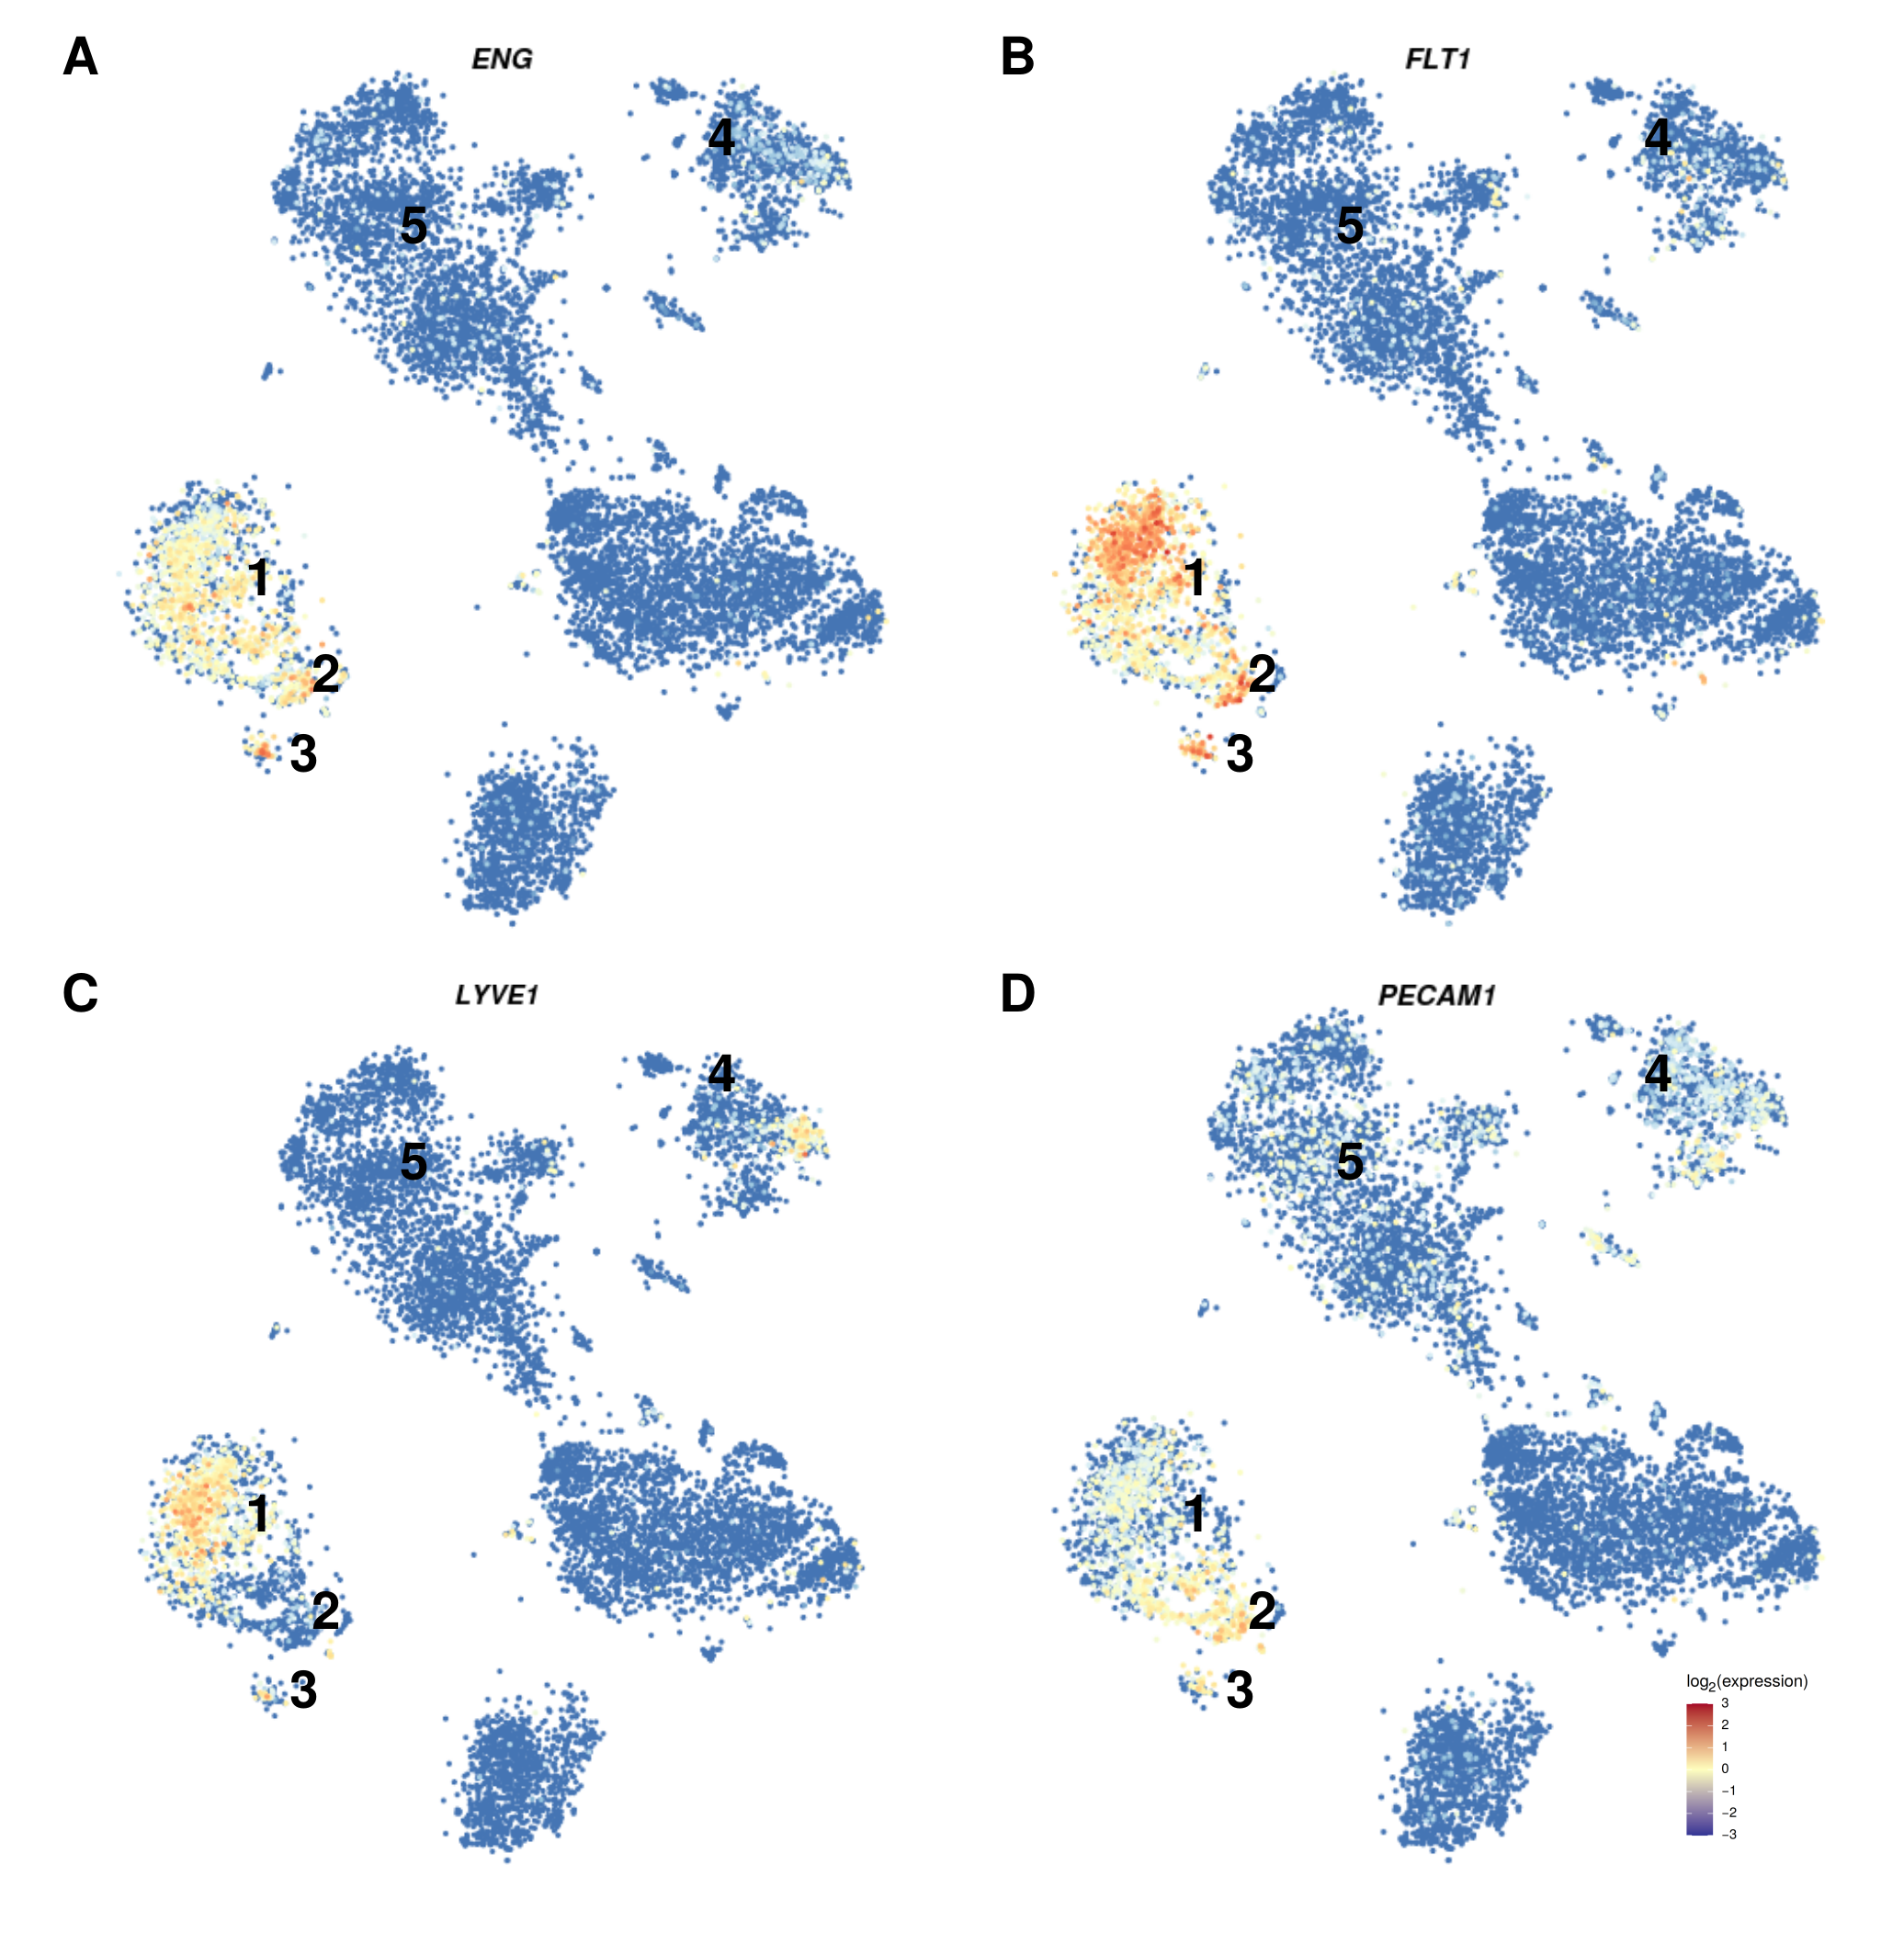
3.2. The Expression Pattern of Endothelial Markers Is in Accordance with That of Liver Endothelial Cells

To test the data quality, the expression of LEC markers PECAM1, ENG, LYVE1, and FLT1 was investigated across all groups. All genes displayed an expression pattern as described previously [7]: expression of ENG, PECAM1, LYVE1 and FLT1, and upregulation of ENG in ENG+ NEC (Figure 2A–D). TEC displayed a trend (non-significant, adjusted p-value = 0.17) to ENG upregulation in ENG+ cells (Supplementary Table S1). The lower expression of all markers in TEC compared to NEC is in line with the reported de-differentiation in these cells [15].
It has been reported that PECAM1 is also expressed in Kupffer and hematopoietic cells, thus leading to potential contamination of the isolate [60]. Therefore, we investigated liver single-cell RNASeq data concerning the expression of ENG, FLT1, LYVE1, and PECAM1. In single-cell RNASeq analysis, ENG and FLT1 expression were restricted to LEC clusters, with ENG being also lowly expressed in Kupffer cell-associated clusters (Figure 3A,B). LYVE1 expression was restricted to the cluster associated with LEC, with a small cluster of Kupffer cells being LYVE1 positive (Figure 3C). PECAM1 showed a high expression in macrovascular endothelial cell-associated clusters, a lower expression in LEC associated clusters and a low to moderate expression in Kupffer cell, NK, NKT, and T-cell associated clusters (Figure 3D). These findings indicate that the use of ENG and PECAM1 for isolation of LEC might lead to contamination of the isolate with Kupffer, NK, NKT and T-cells (Figure 3A,D, clusters 4 and 5) [60]. To estimate potential contamination with those cell types, the expression of PTPRC (CD45), a marker strongly expressed in Kupffer cells and leukocytes in general (therefore also known as leukocyte common antigen, LCA), but only weakly expressed in a subset of LEC [36] was determined. The mean expression level of PTPRC in GSE51401 was 5.6, which is slightly above our cutoff for lowly expressed genes (5.33). Taken together, these results demonstrate that the gene expression pattern of GSE51401 is consistent with liver endothelial cells.

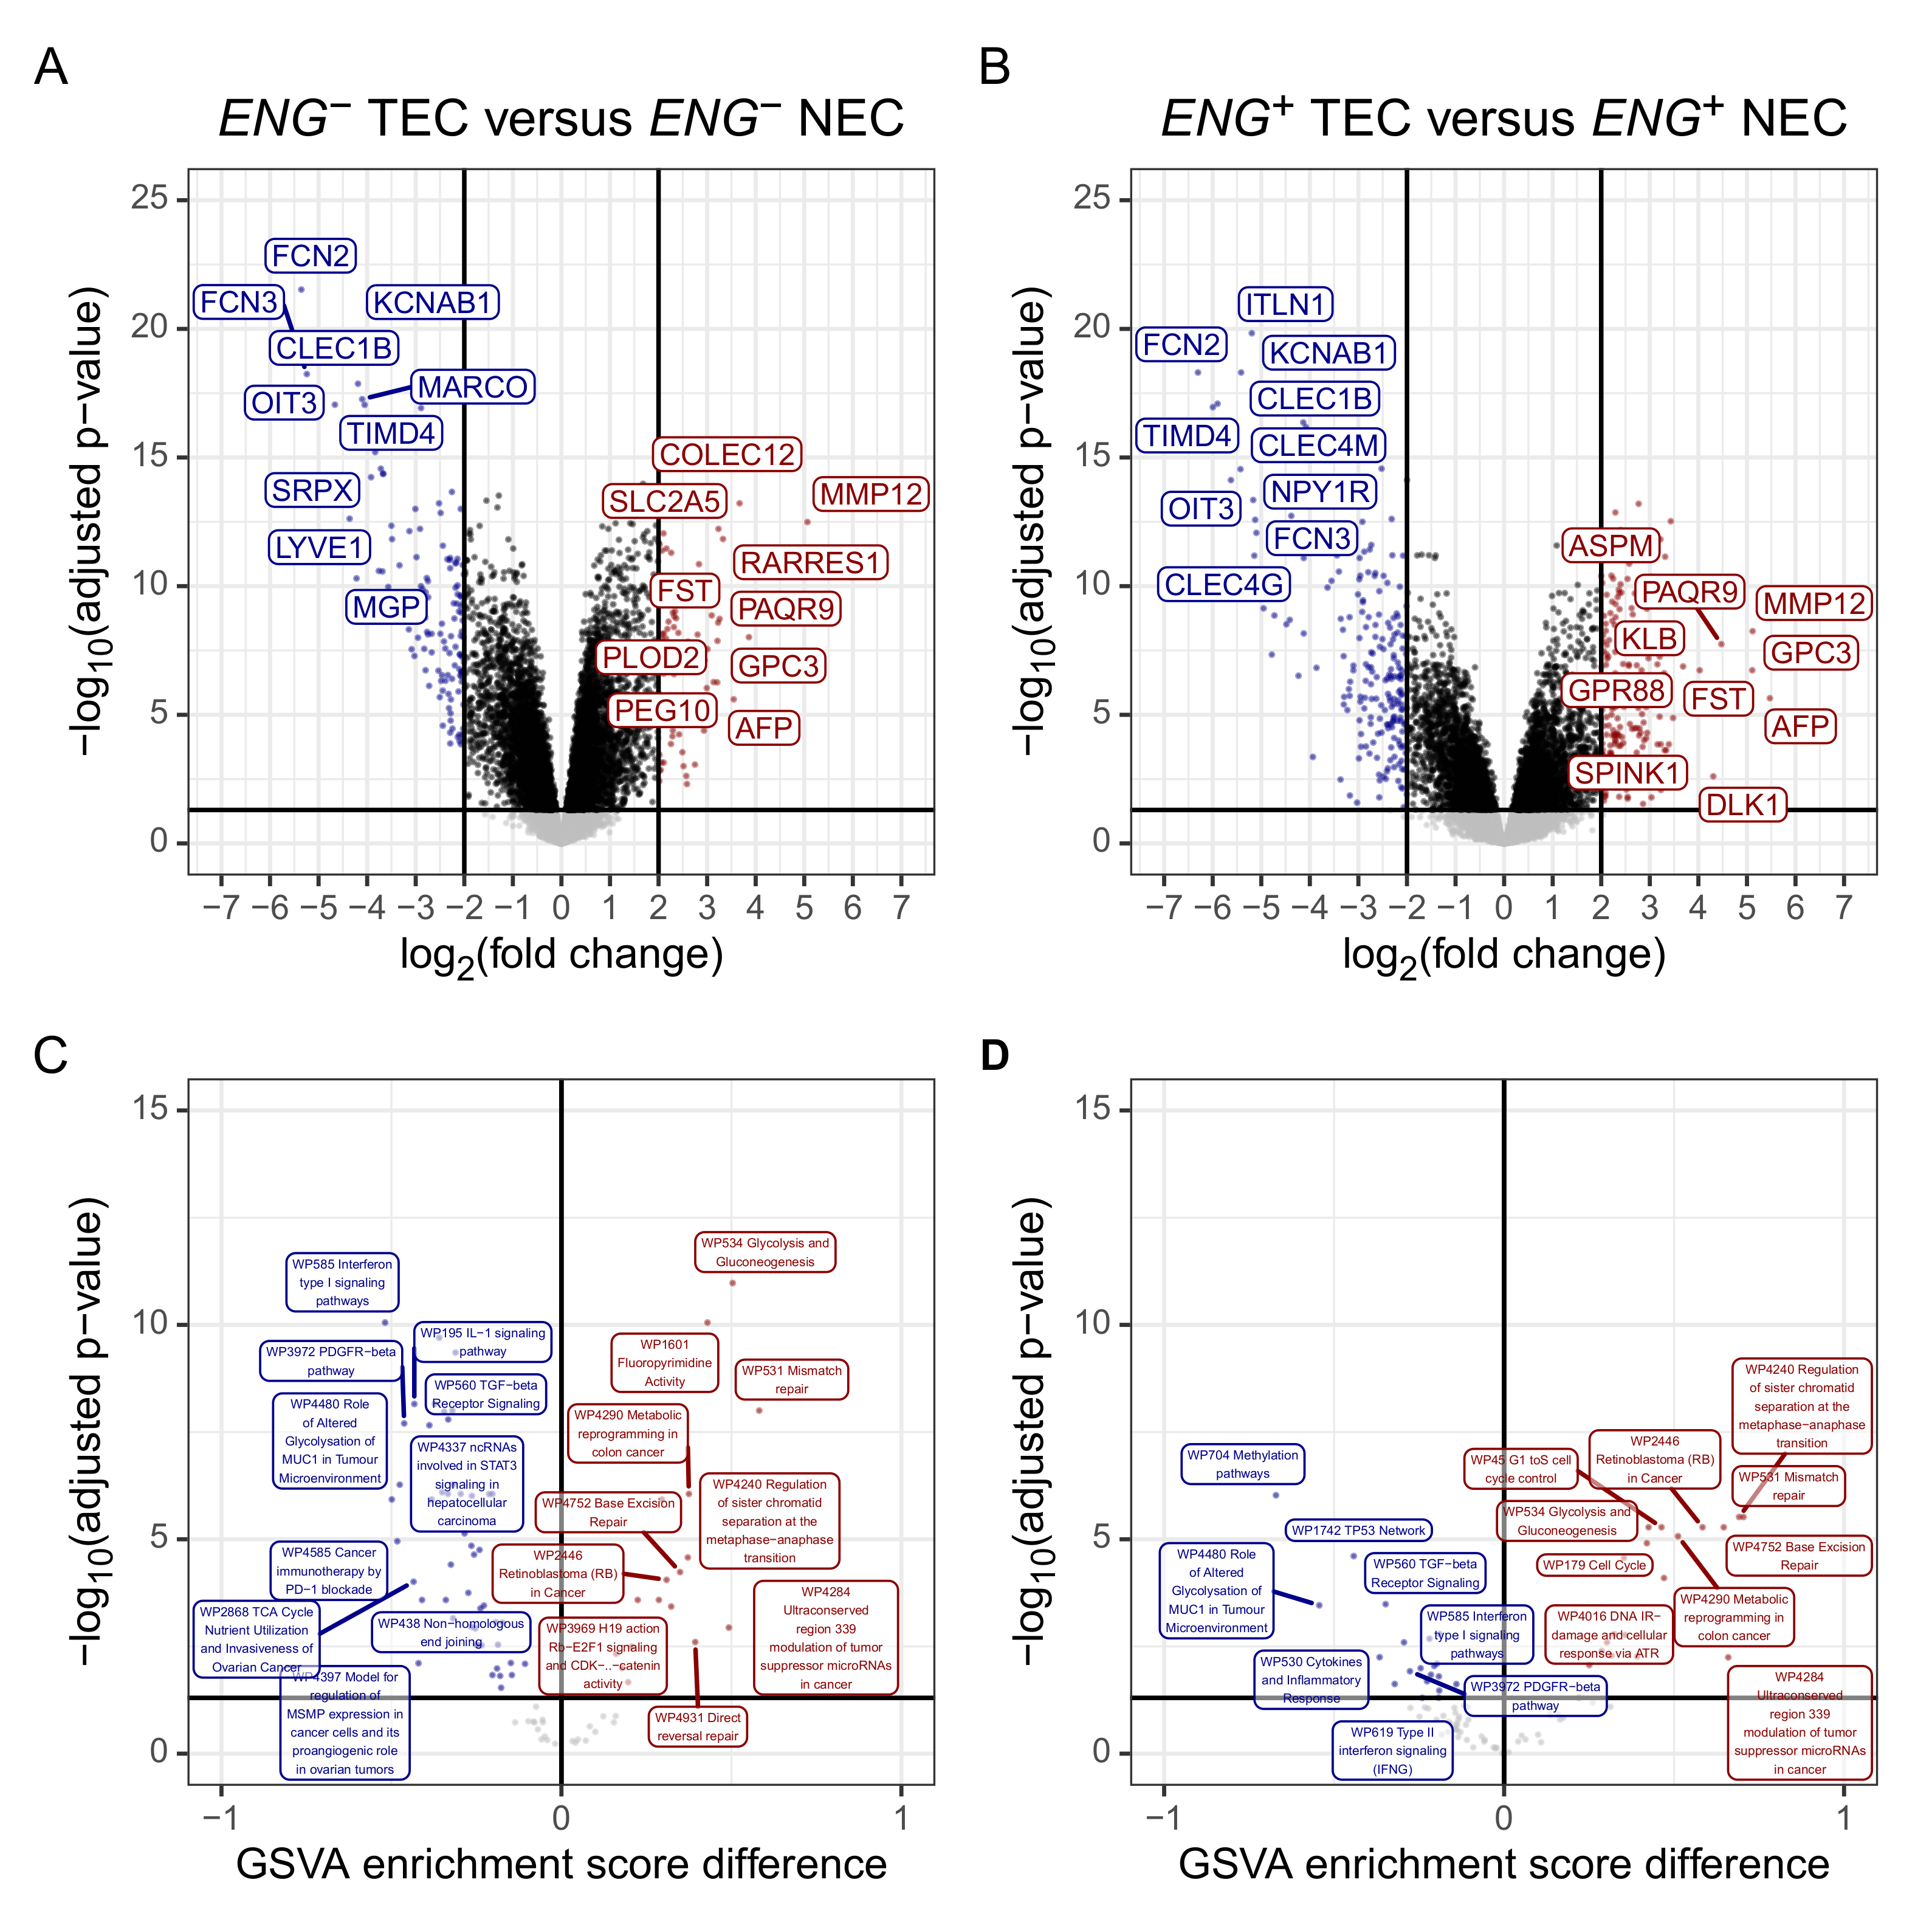
3.3. The Gene Expression Profile of Tumour Endothelial Cells Is Characterised by Upregulated Evasion from Growth Suppressors, Downregulated Immune and Inflammation-Related Pathways, and Resistance to Apoptosis

In ENG TEC, 223 genes were differentially expressed, with 96 being up- and 127 being downregulated (Figure 4A), 395 were differentially expressed in ENG+ TEC, with 196 being up- and 199 being downregulated in ENG+ TEC (Figure 4B). Analysis of pseudo-bulk single-cell RNASeq data confirmed downregulation of. However, only four of the top upregulated genes could be detected in the single-cell RNASeq data. All showed only low expression and could therefore not be used to determine regulation. Single-cell RNASeq, however, has a high gene dropout rate due to technical limitations when performing single-cell experiments, such as RNA degradation during library preparation and limited per-cell sequencing depths [61]. The LIMMA between the ENG+ and ENG in TEC and NEC showed 239 differentially expressed genes in NEC (ENG+ compared to ENG ) and 17 differentially expressed genes in TEC (ENG+ compared to ENG , Supplementary Table S1). Eleven of the 17 differentially expressed genes were differentially expressed in both NEC and TEC. The greater similarity between ENG+ TEC to ENG TEC compared to their counterparts from non-tumour tissue may indicate an angiogenic activation of ENG TEC, which is in line with the literature [13]. The complete results of the LIMMA analysis are available in Supplementary Table S1.
To avoid reliance on arbitrary threshold selection, GSVA, which utilises the entire feature space without prior filtering, was employed in the downstream analysis. Out of 87 pathways, 17 were up and 49 were downregulated in in ENG TEC (Figure 4C). Upregulated pathways were associated with three hallmarks of cancer: “Deregulation of cellular energetics” (for example, Glycolysis and Gluconeogenesis), “Evading growth suppressors” (for example, Cell Cycle and Retinoblastoma (RB) in cancer), and “Genome instability and mutation”. Pathways associated with all other hallmarks of cancer (“Resisting cell death”, “Avoiding immune destruction”, “Sustaining growth signalling”, “Angiogenesis”, and “Tumor promoting inflammation”—Chemokine signalling pathway) were mostly consistently downregulated. Interestingly, pathways associated with “Sustaining proliferative signalling” (for instance, MAPK signalling and Ras signalling were downregulated as well (Supplementary Table S2).
In ENG+ TEC, out of 87 perturbed pathways, were up and 20 were downregulated (Figure 4D). Again, upregulated pathways were primarily associated with “Deregulation of cellular energetics”, “Evading growth suppressors” (for example Cell Cycle), and “Genome instability and mutation”. However, one “Sustaining proliferative signalling”-associated pathway was also upregulated, namely enhancement of MAP/ERK signalling in diffuse large B-cell lymphoma (Supplementary Table S2). In ENG TEC the Cell cycle pathway shows several upregulated key genes, the Cyclin group (CCNB1, 2, and 3) and CDK1. Inhibitors regulating DNA damage checkpoints were downregulated (for example, PRKDC). Activators promoting DNA biosynthesis were upregulated (for example, MCMs, Supplementary Figure S1A,B). The log2 fold change ratio of CCNB1, 2 and CDK1, but not CCNB3, was increased even more in ENG+ TEC. The entry from DNA damage checkpoints (for example, PRKDC) was upregulated as well in ENG+ TEC (Supplementary Figure S1B). Retinoblastoma gene in cancer, another pathway associated with “Evasion of growth suppressors”, was also upregulated, with strong overexpression of pathways members leading to G1/S transition (CCNB1, CDK1) and mitotic spindle association (TTK) (Supplementary Figure S2). Interestingly, RB1 itself was only weakly overexpressed (Supplementary Figure S2). The MAPK signalling pathway, a pathway associated with “Sustaining proliferative signalling”, was found to be downregulated, despite upregulation of several growth factor receptors (for example, EGFR, FGFR3, and FGFR4). The cytokine receptors at the entry of this pathway, however, were found to be downregulated (Supplementary Figure S3) These results indicate that the pro-angiogenic gene expression profile of TEC may depend on the hallmark “Evasion of growth suppressors” rather than sustained “Sustaining proliferative signalling”, or “Angiogenesis”.
In the Chemokine signalling pathway, the cytokine-cytokine receptor interaction ligands were mostly upregulated (for example, CXCL10, CXCL9, and CXCL5). CXCL12, however, was strongly downregulated. The respective receptors (for instance, CXCR2, CXCR6, and XCR1) were generally downregulated, resulting in a downregulation of the entire pathway (except for SHC1, 2, 3, and 4, and HRAS and NRAS (Supplementary Figure S4A). This regulation pattern was also present in ENG+ TEC, with a larger log2FC ratio in several ligands (for example, CXCL13 or CCL20) (Supplementary Figure S4B). Taken together, the observed downregulation of the receptors and downstream genes in the Chemokine signalling pathway may be a contributing factor to tumour endothelial anergy (insensitivity to pro-inflammatory signals) as described in the literature [62].
In the Apoptosis pathway, BIRC5 and HELLS were strongly upregulated in TEC compared to NEC. The logFC ratio of both genes was larger in ENG+ TEC (Supplementary Figure S5). The complete results of the GSVA are available in Supplementary Table S2.

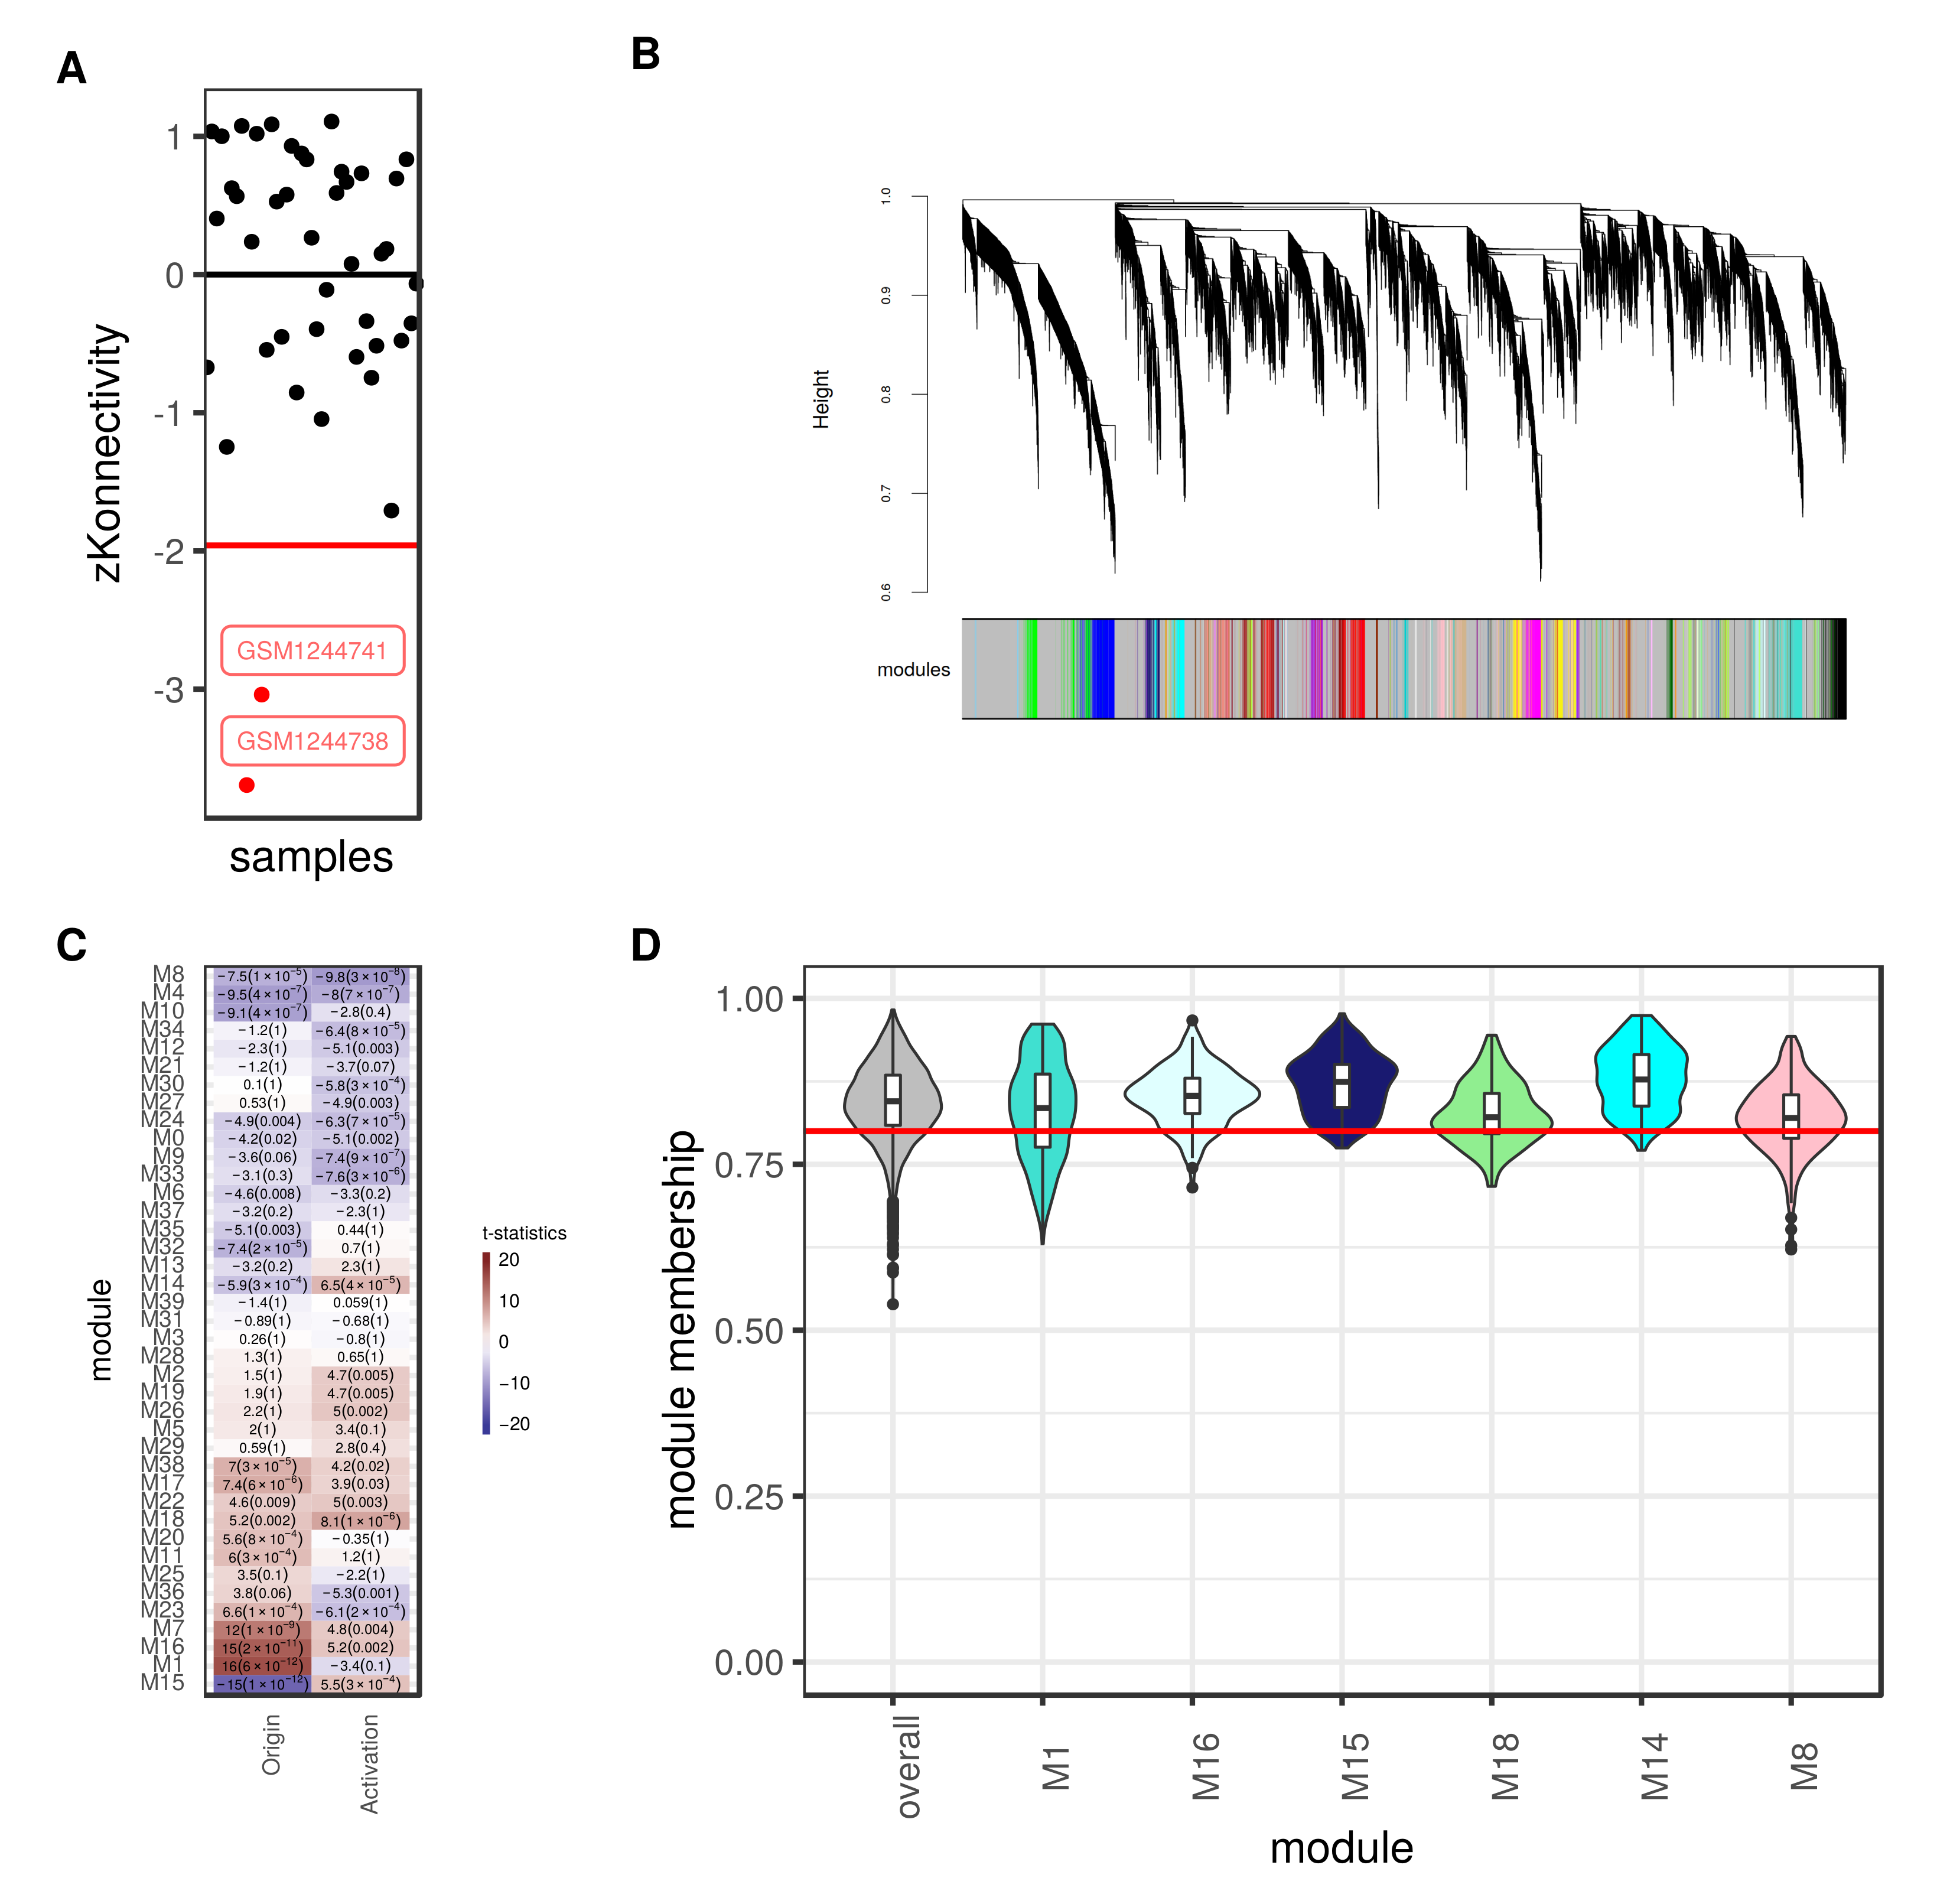
3.4. Weighted Gene Co-Expression Network Analysis Reveals Several Gene Modules Associated Strongly with Cell Origin and Angiogenic Activation

Before WGCNA, samples with a zKonnectivity of less than −1.96 were excluded from analysis (Figure 5A). Next, probes representing genes with low expression levels across all samples were excluded from analysis, yielding a co-expression network of 14,690 genes. The iterative approach described by Allen-Greenfest et al. [43] led to the detection of 39 modules with a size between 33 and 433 genes (Figure 5B). The module detection (assigned module and gene connectivity) are provided in Supplementary Table S1 for all genes.
After clustering and module detection (Figure 5B), the association between the cell origin (tumour vs. non-tumour tissue), angiogenic activation (ENG+ versus ENG cells), and the module eigengenes was calculated(Figure 5C). Based on module association the M1, M16, M15, M18, M14, and M8 modules were selected for further analysis. All selected modules displayed a median module membership of greater than 0.8 (Figure 5D). This high median module membership is indicative of a stabilised module assignment for the genes of the selected modules.
In the M1 module, the eigengenes in ENG and ENG+ TEC are upregulated compared to the respective NEC. No difference is observed between ENG+ and ENG cells of one origin (Figure 6A). In contrast, the eigengenes in the M16 module show a small but significant upregulation between ENG and ENG+ NEC. In ENG TEC, genes are upregulated compared to ENG NEC, but not compared to ENG+ NEC. ENG+ TEC show a further upregulation of the eigengenes (Figure 6B). This upregulation is not significant compared to ENG TEC but significant compared to ENG+ NEC. In the M15 module, ENG+ NEC show significant upregulation of the eigengenes compared to ENG NEC. In both ENG and ENG+ TEC, the eigengenes are downregulated compared to the respective NEC (Figure 6C). In module M18, eigengene expression is upregulated in ENG+ TEC and NEC compared to ENG NEC. both in NEC and TEC. However, eigengene expression in ENG TEC is slightly but not significantly upregulated in ENG TEC compared to ENG NEC. Thus, cell origin’s influence on eigengene expression is small (Figure 6D). In module M14, eigengene expression is upregulated in ENG+ NEC and downregulated in ENG TEC compared to ENG NEC. Interestingly, eigengene upregulation between ENG+ and ENG TEC showed only a trend but failed to reach significance (Figure 6E). In module M8, eigengene expression is downregulated in ENG+ NEC and ENG+ TEC compared to the respective ENG cells. In this module, cell origin seems to play a role in eigengene expression since a distinct downregulation can be seen in ENG TEC compared to the ENG NEC. Interestingly, ENG+ TEC showed the same eigengene expression level as ENG+ NEC. This may reflect phenotypical similarities between TEC and angiogenic activation in NEC as has been reported previously [63] (Figure 6F).

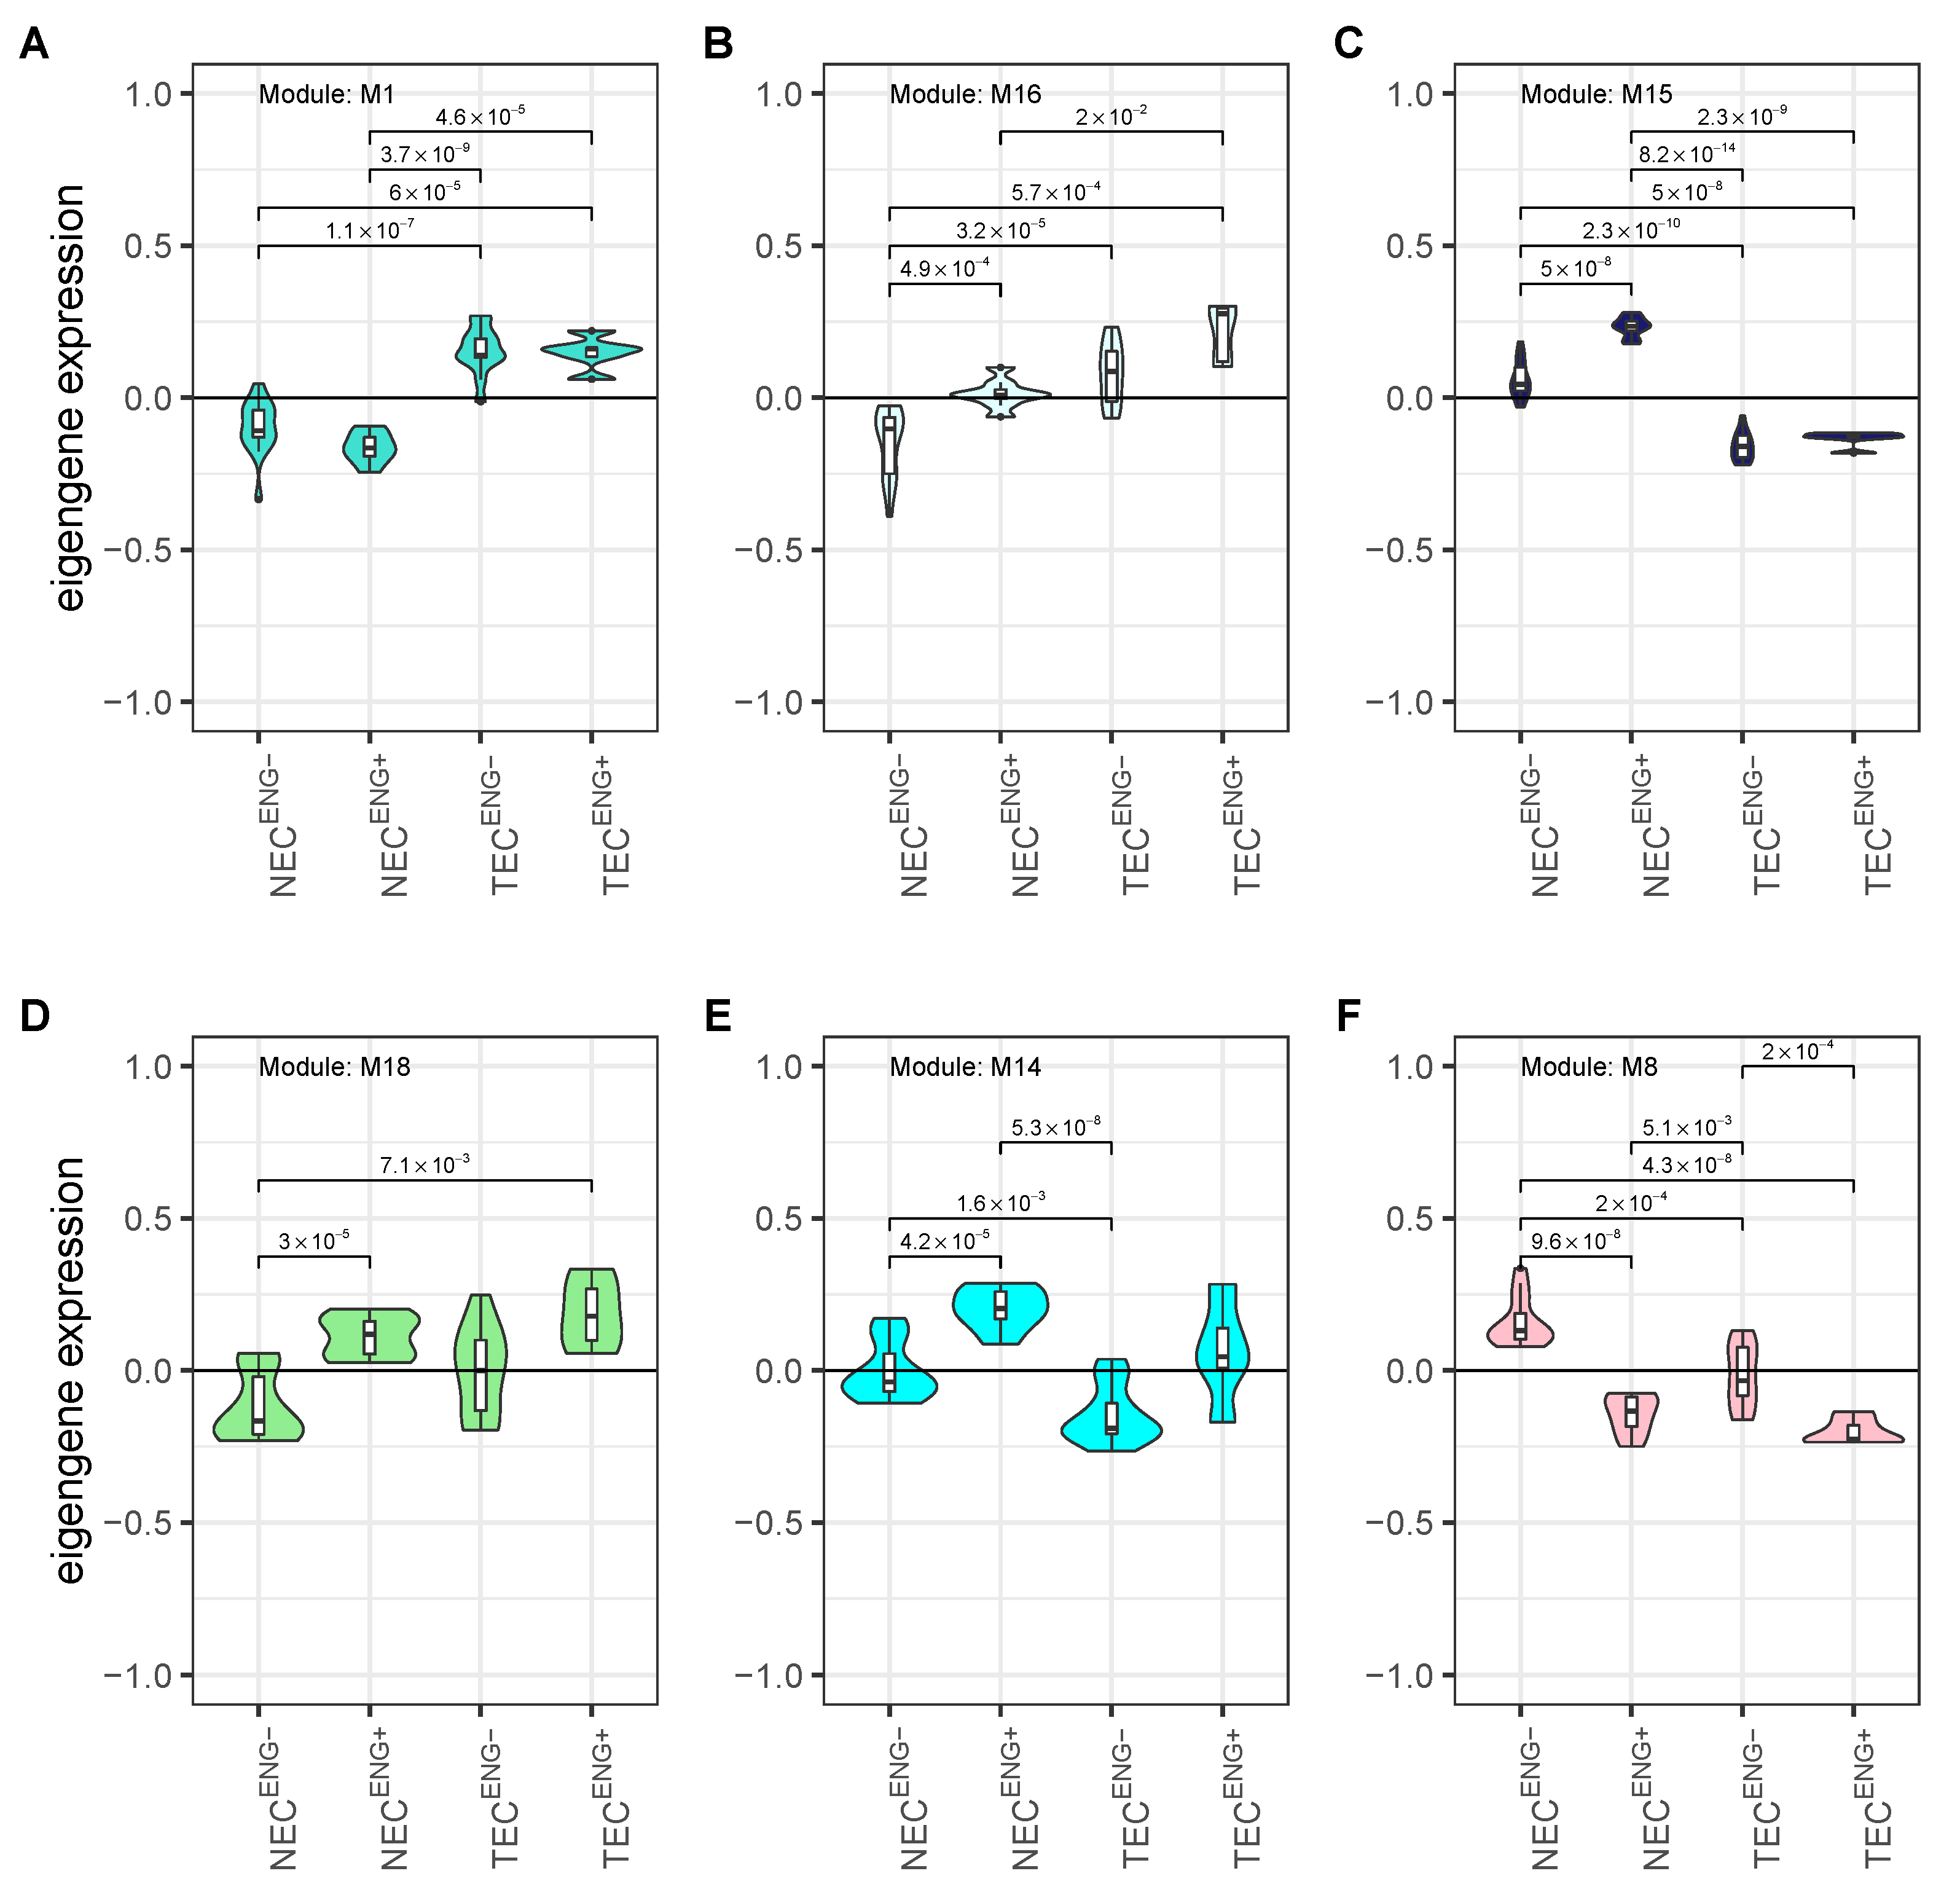
3.5. Cell Origin Related Modules Are Positively Associated with Cell Growth and Survival and Negatively Associated with Immune Functions

The biological context of the M1 module was defined by cell proliferation-related GO terms (for example, DNA replication, Mitotic nuclear division, and Chromosome segregation). The module contains 29 hub genes, with BIRC5, UBE2T, NEK2, CDKN3, TTK, CCNB1, TOP2A, FEN1, AURKA, RNASEH2A, and POLE2 being druggable (Figure 7A,B). Querying the STRING database revealed a dense functional interaction network (FI) between the hub genes, for instance, BIRC5, FEN1, NEK2, TTK, CNB1, and CDKN3, pointing towards an existing FI network underlying this module. It appears that especially the interaction BIRC5TOP2ANEK2 determine module function since the adjacencies between these genes are particularly strong and branch into several other nodes, such as CDKN3, UBE2T, and CCNB1. All of these genes have been proposed as potential drug targets in other cancer entities. The biological context of M16 the module was defined by cell metabolism-related GO terms (oxidative phosphorylation) and mitochondria-related GO terms (mitochondrial translational elongation and inner mitochondrial membrane organisation). Eight hub genes could be detected (PDZD11, ANAPC11, COA3), YIF1A, TXNDC17, MEA1, MRPS17, and PPIL1. No known functional interactions exist and none of these hub genes was found in the DGIdb (Figure 7C,D). In the M15 module, nine hub genes are present (MYO9A, GPM6A, LRRC4, CXCL12, HOXB6, F8, PHKA1, NDST3, and MAN1C1. Of these, CXCL12 and F8 are druggable. Querying the STRING database showed no known FI between these genes. Biologically the module is characterised by complement activation, alternative pathway (Figure 7E,F).

3.6. Activation Related Modules Are Associated with Angiogenesis, Cell Adhesion and Immunologic Functions

The biological context of the M18 module was defined by cell-matrix adhesion and focal adhesion assembly. The module contains seven hub genes, none of which are druggable (Figure 8A,B). Several endothelial cell GO term clusters, for example, vascular endothelial growth factor receptor signalling pathway, endothelial cell migration, and endothelial cell differentiation, define the biological context of the M14. It further contains 10 hub genes, none, however, being drugggable (Figure 8C,D). Finally, the GO term clusters detected in the M8 module are associated with cytokine production (Positive regulation of cytokine production) and immune functions (B cell activation) and cell migration (positive regulation of leukocyte cell-cell adhesion). It contains 13 hub genes, with IDS, NAMPT, and PLK3 being druggable (Figure 8E,F). Despite a strong adjacency between several modules’ hub genes, particularly the M8 module, no known FI have been found. Co-expression networks, however, indicate not only direct functional interactions but also interactions covering several intermediate proteins. The strong adjacencies might indicate that these genes are part of a cross pathway network. The complete GO term enrichment analysis results for all detected modules are provided in Supplementary Table S3.

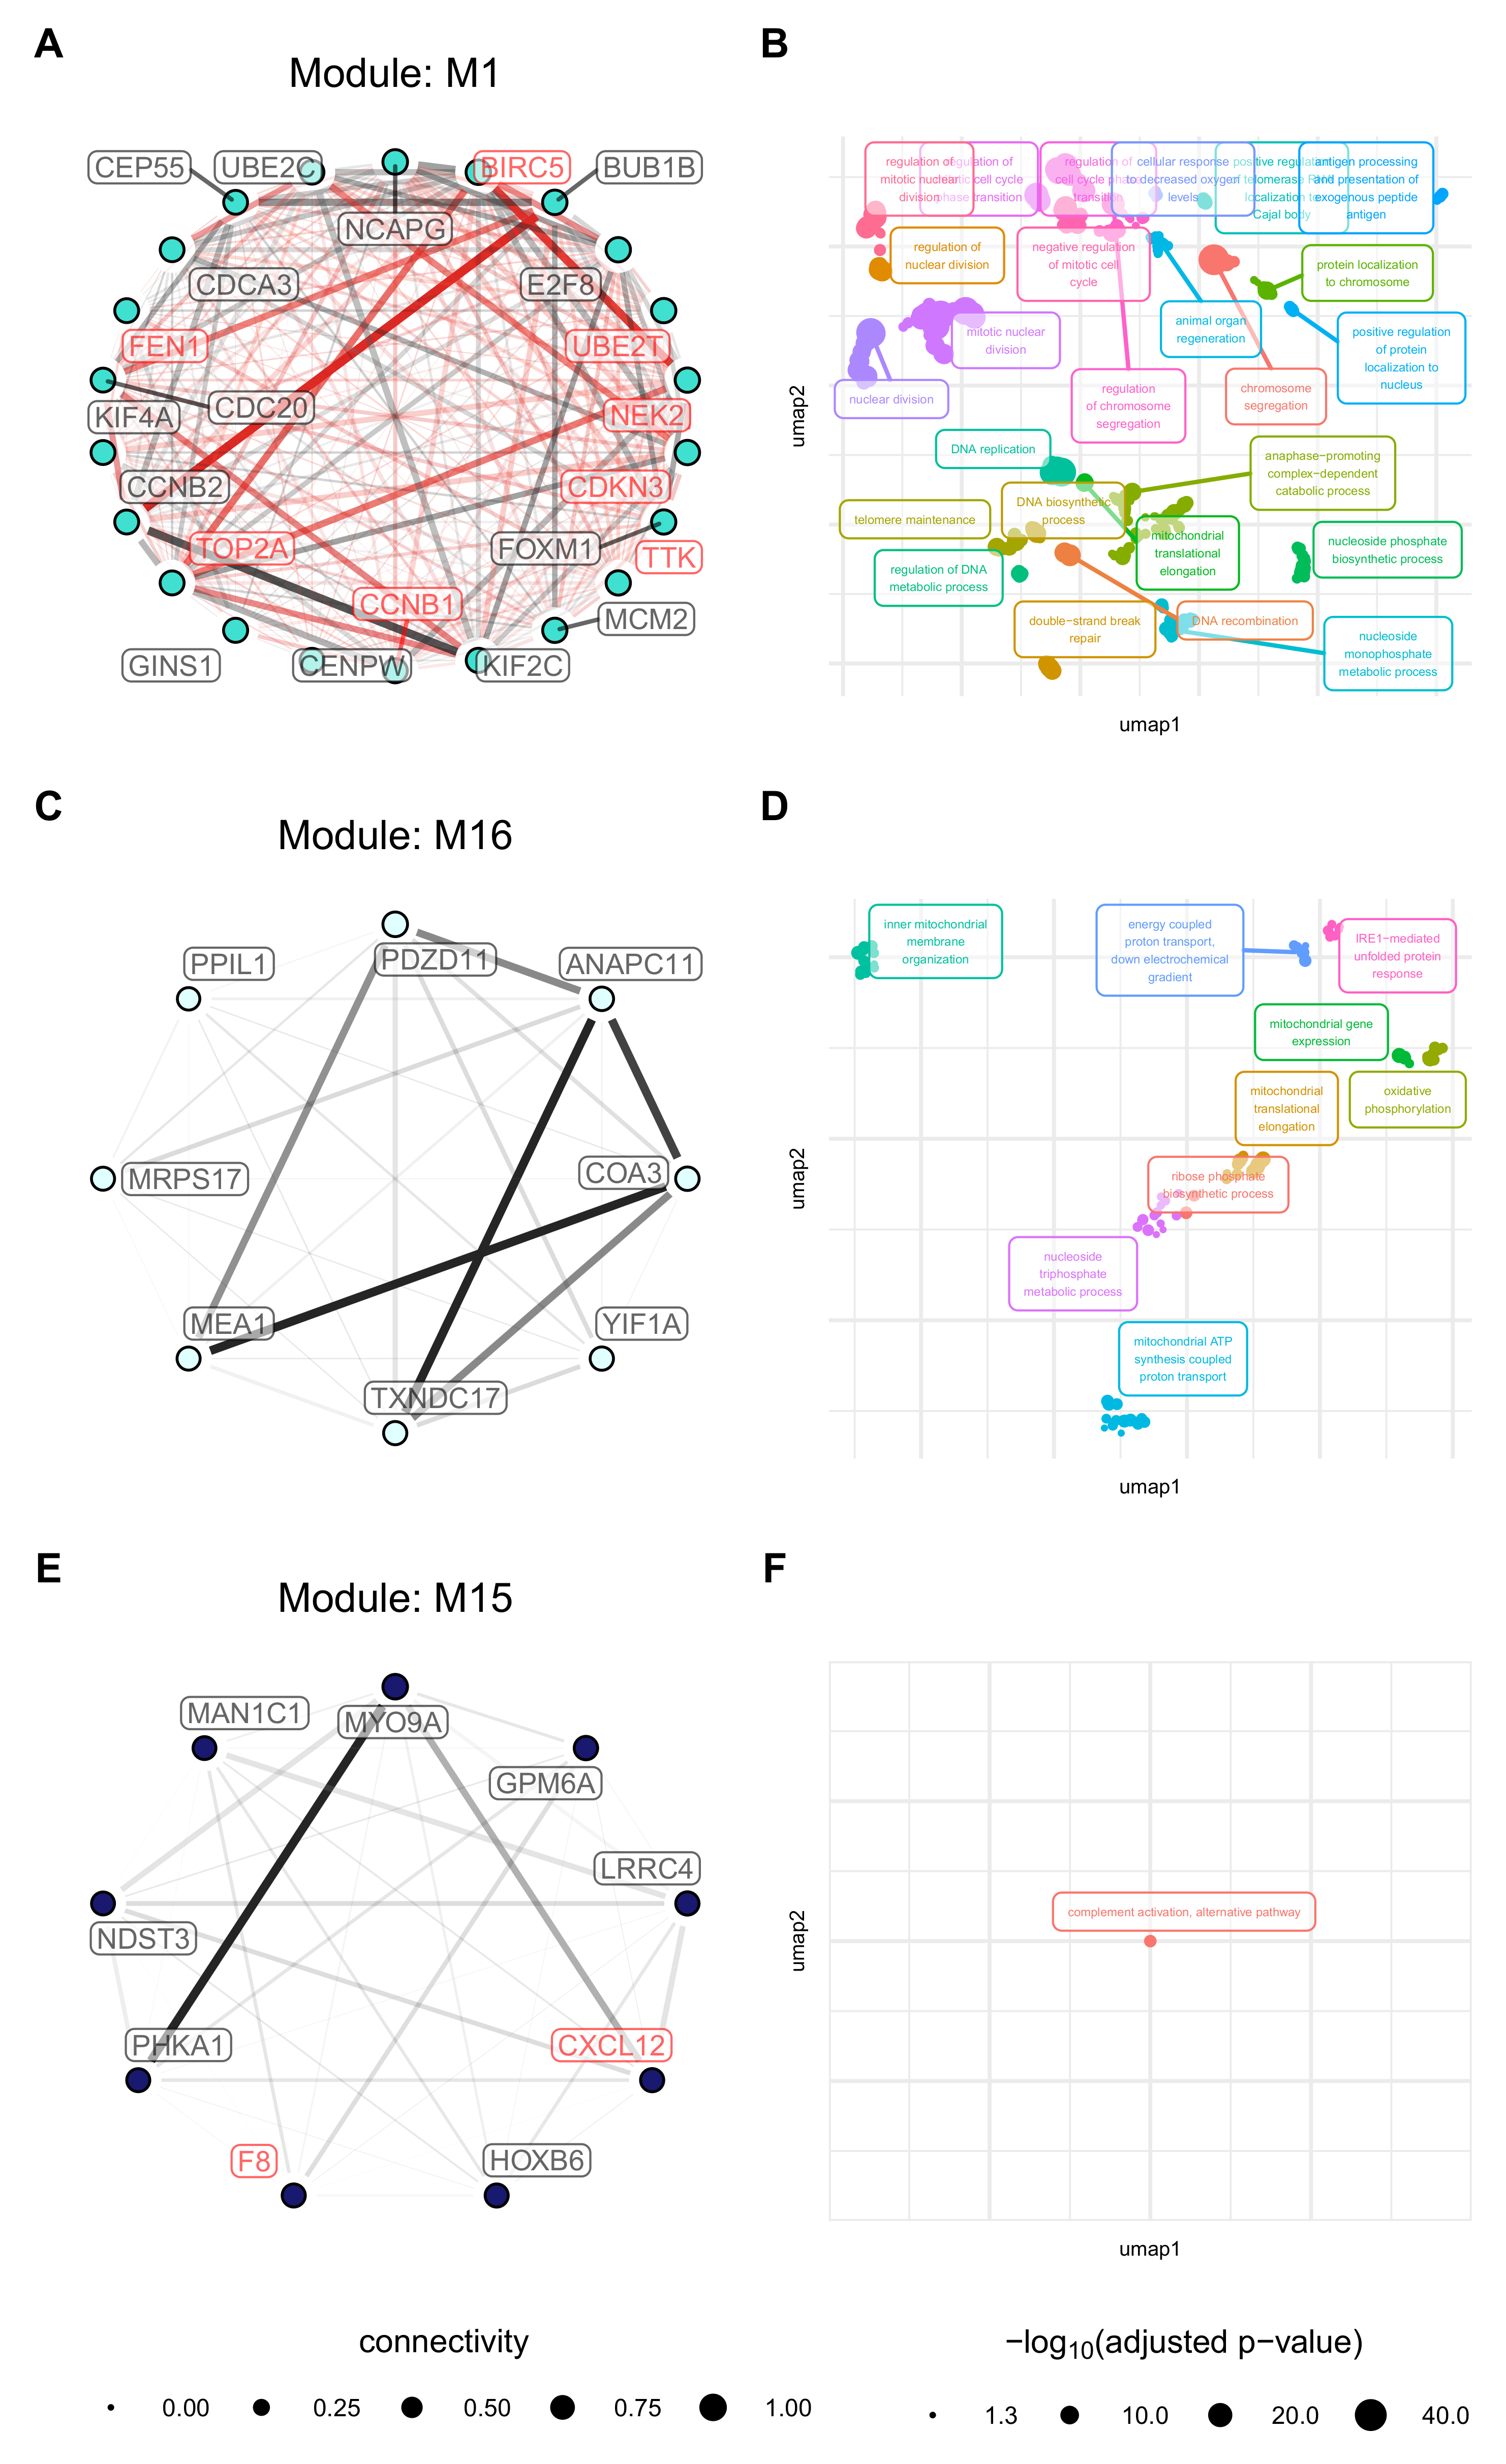
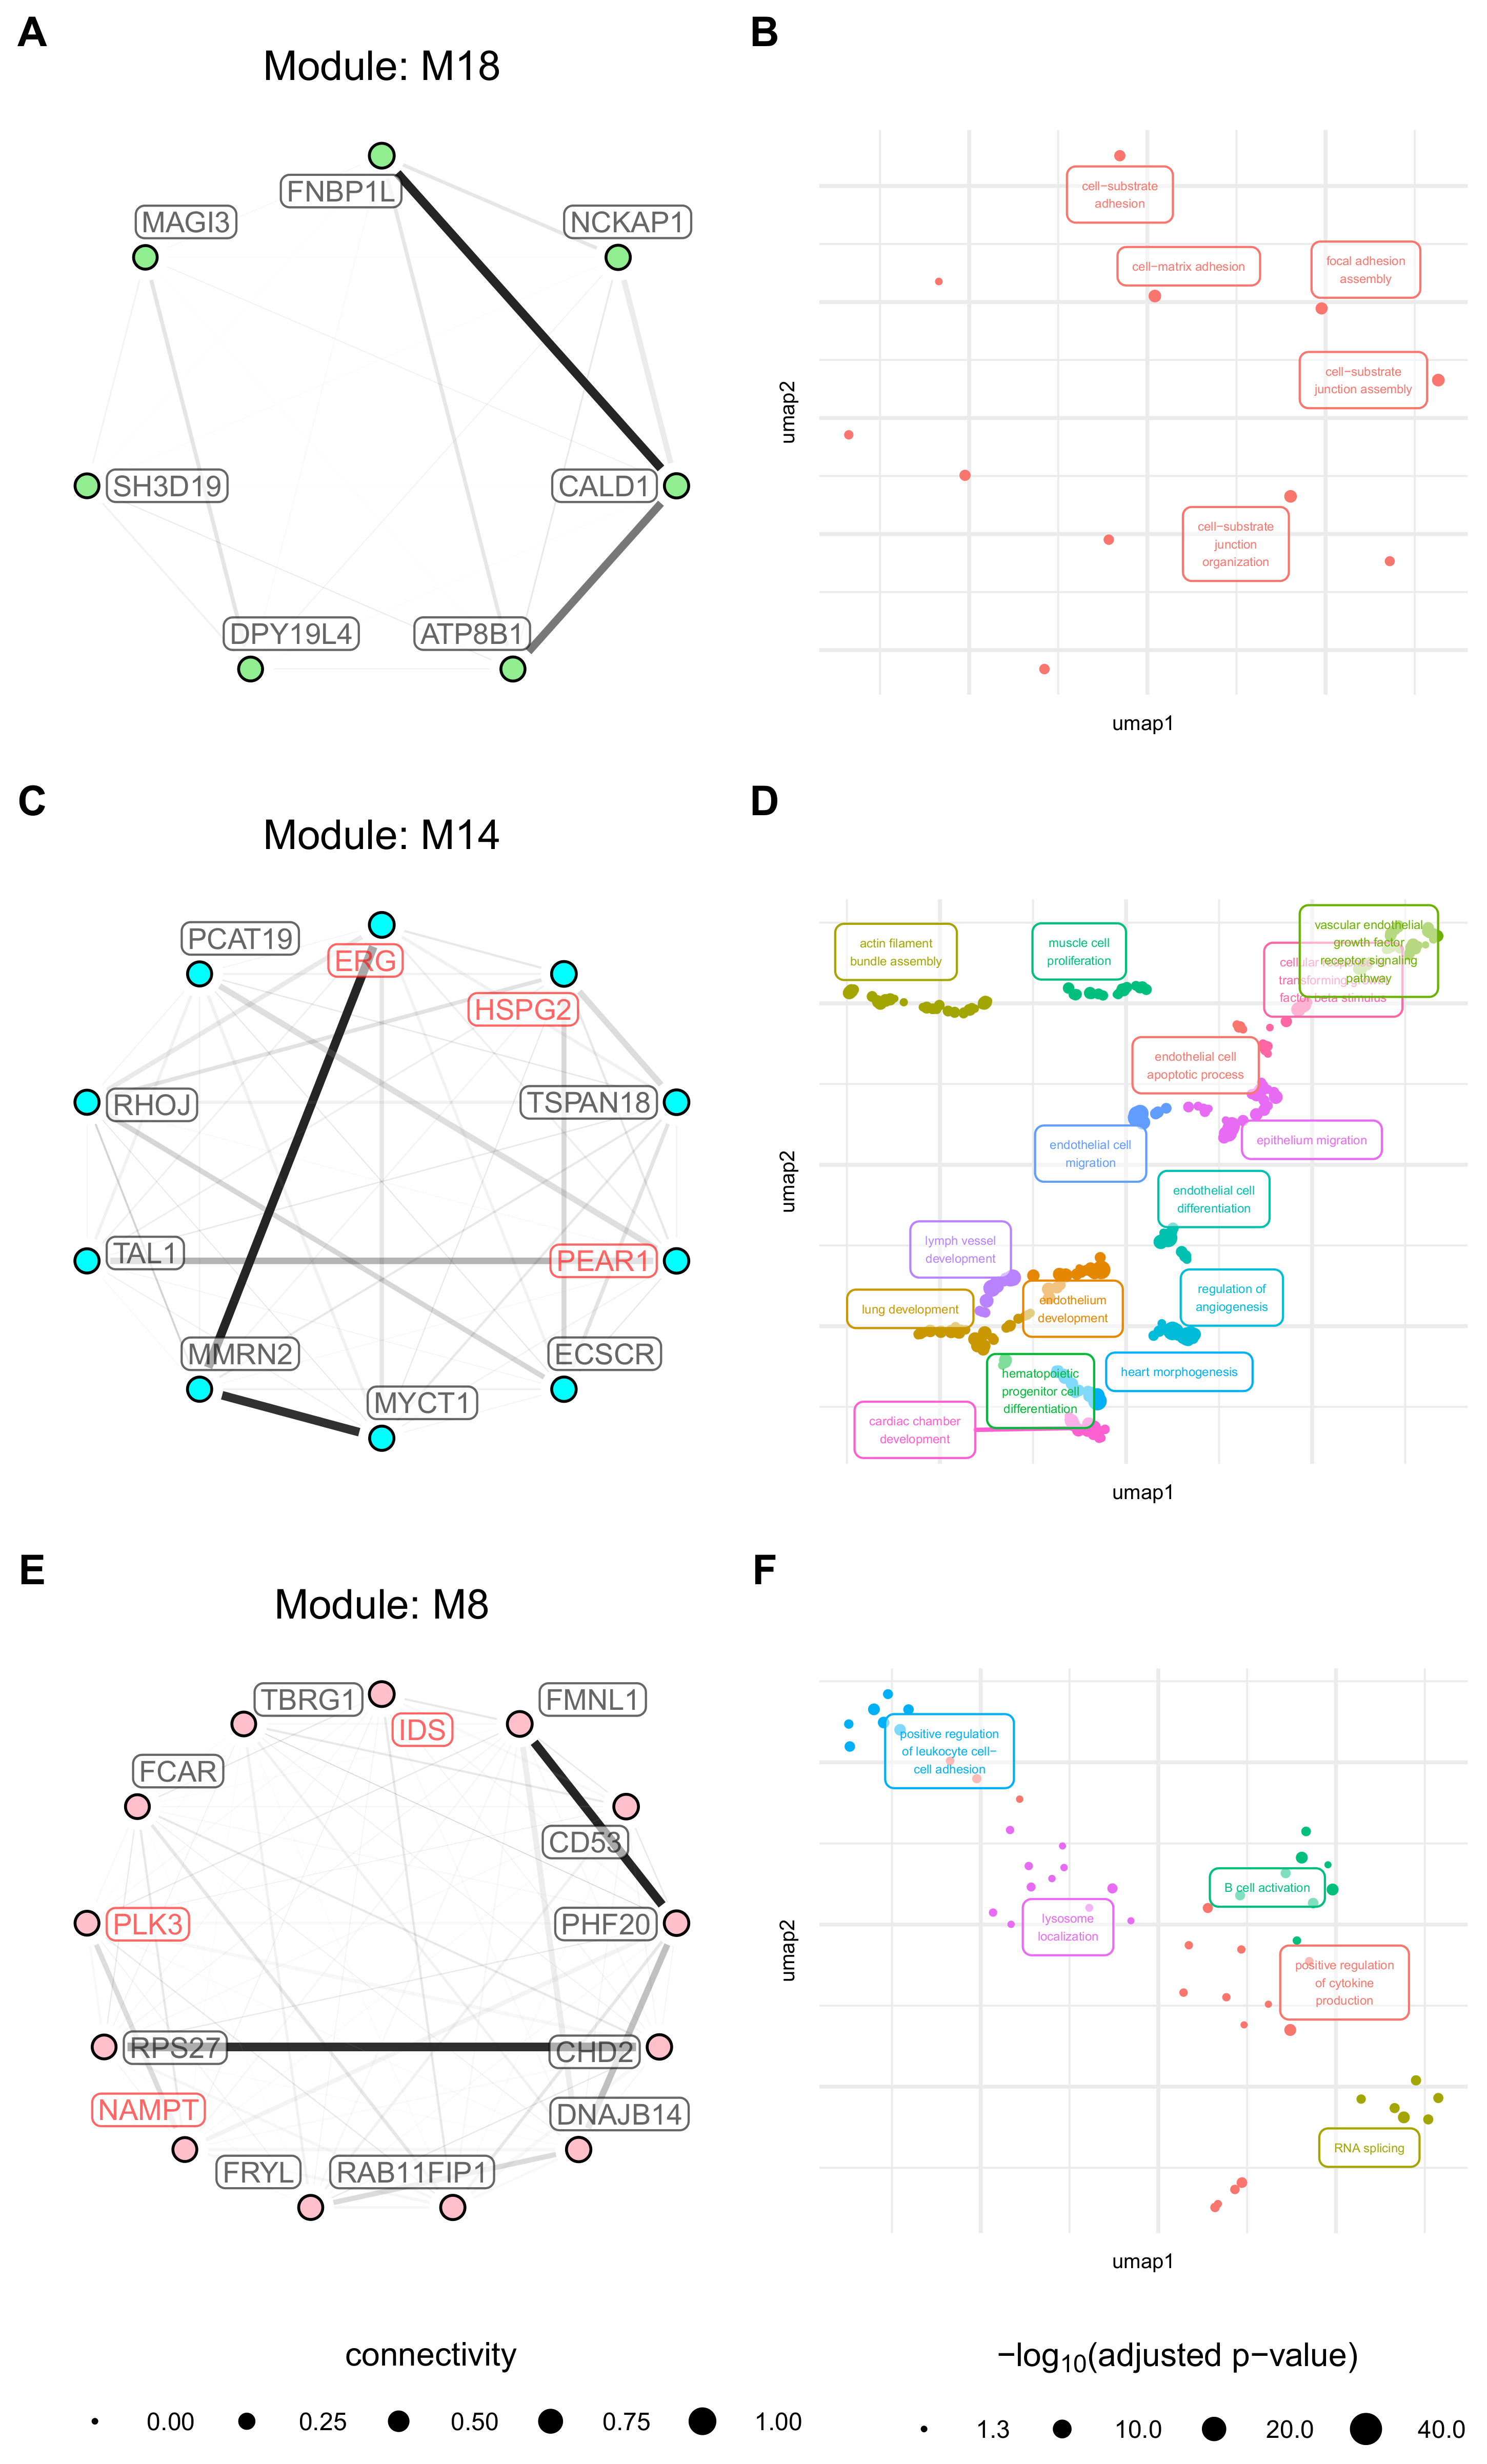
3.7. Modules with a Strong Positive Association with Cell Origin and Angiogenic Activation Contain Several Potentially Druggable Hub Genes

Several hub genes of modules positively associated with cell origin and angiogenic activation could be identified, namely BIRC5, UBE2T, NEK2, CDKN3, TTK, CCNB1, TOP2A, and FEN1 for the M1 module, and ERG, HSPG2, PEAR1, TIE1, IDS, NAMPT, and PLK3 for the M18, M14, and M8 modules. A number of drugs targeting these genes are already under investigation, especially in connection with FEN1, BIRC5, and NEK2 [64]. The associated drugs and PMIDs are listed in Table 2.
The M1 module contained several hub genes interconnected by a known functional interaction network that can be targeted by several drugs (Figure 9). The majority of the functional interactions have been inferred from co-expression, database, and text mining approaches. The interactions BICR5UBE2TFEN1CCNB1CDKN3TTK was confirmed by experimental evidence either in humans or in homologs from other organisms. These findings suggest that a regulatory network may underly module M1. The complete results of the drug-gene interaction database query are provided in Supplementary Table S4.

4. Discussion

Tumour endothelial cells play a decisive role in cancer progression. Numerous studies have been undertaken to investigate the underlying biological processes and identify prognostic markers or therapeutic targets in HCC and other tumour entities [36,65,66,67,68]. However, except for the dataset used in this study (GSE51401), these studies are of too limited size to allow the systematic integration of differential gene expression and pathway perturbation analysis with advanced bioinformatics approaches. Consequently, they focused on differentially expressed genes, resulting in a general picture of perturbed biologic functions. Nowadays, advanced network-based bioinformatics approaches such as Weighted Gene Co-expression Network Analysis (WGCNA) allow gaining a more in-depth insight into the biological context of expression data by identifying gene modules with similar expression patterns across conditions and identifying hitherto unknown gene-gene correlation networks, hub genes, and potential therapeutic targets.
Our study combined differential gene expression analysis, GSVA and WGCNA with querying the Drug–Gene Interaction database and STRING database to re-analyze GSE51401, a dataset containing TEC and NEC derived transcriptomics data. We identified differentially regulated genes, pathways, gene modules and their biologic functions, hub genes, and potential therapeutic targets.
Our results show that the pro-growth phenotype reported for the TEC for this dataset [20] as well as in other studies [69] may be caused by pathways involved in “Evading growth suppressors” rather than “Sustaining proliferative signalling” or “Inducing angiogenesis” patterns. Somewhat surprisingly, the Angiogenesis and MAPK signalling pathway pathways were downregulated despite upregulation of the main ligands (VEGFA and PDGFB) and receptors (EGFR, FGFR3, and FGFR4). The fact that almost all “Sustaining proliferative signalling” and “Inducing angiogenesis” related pathways were consistently downregulated in TEC leads to the conclusion that the sustained cell growth observed in TEC may be driven by signals stemming from other sources. These results raise questions about the origin of these signals and may have implications for the design of anti-angiogenic therapies. Tumour endothelial cells may develop apoptosis resistance [70], as has been demonstrated in the cells of GSE51401 [20]. Our analysis indicates that BIRC5/Survivin and HELLS’s overexpression, two apoptosis inhibitors, may be instrumental in conferring apoptosis resistance in TEC. In the Chemokine signalling pathway, a panel of ligands was upregulated, for example, CXCL5, CXCL11, CXCL9, and CXCL10. The receptors, for example, CXCR2, were generally downregulated in ENG and ENG+ TEC. Particularly CXCR2 is a receptor for angiogenic cytokines [71] and thought to mediate pro-angiogenic signalling [72]. This was again somewhat surprising since upregulation of chemokine receptors has been observed in several other tumour entities and is thought to be supporting TEC [73].
The second result of our study is the identification of modules associated with tumour and angiogenic activated EC. The M1 module was strongly associated with cell cycle-related functions and contained 22 hub genes, for example, FEN1B, BIRC5, UBE2T, NEK2, CDKN3, TTK, CCNB1, and TOP2A. This is confirmed by an HCC-associated network proposed by Xing et al. [74], which was derived from five studies in HCC. This network contains twelve of our hub-genes and has BIRC5 as the central gene as well. The adjacencies between BIRC5NEK2TOP2ACDKN3 ⇔ CCNB1 were found to be particularly strong and are confirmed by an underlying functional-interaction network as determined by querying the STRING database. Experimental evidence from putative homologues in other species suggests the existence of a protein-protein interaction network encompassing the majority of hub genes. Recently, Zhao et al. undertook an in-depth analysis of several datasets (GSE121248, GSE87630, GSE84598, and the TCGA-LIHC project) to identify potential biomarkers in HCC [75,76]. Several of the hub genes we detected (for example, FEN1, TOP2A, and UBE2T) were also identified as hub genes and potential biomarkers in these studies. Survival analysis showed that high expression of these genes, particularly FEN1, is associated with worse outcome [75]. Since we detected these hub genes in endothelial cells, we hypothesise that TEC play a role in mechanisms involving for instance FEN1, TOP2A or UBE2T. The M16 module presents itself as related to mitochondrial functions and may attest to the activated cell metabolism reported in tumour endothelial cells [77]. The findings of the GSVA, namely a downregulation of immunological functions in TEC (complement activation, alternative pathway), are mirrored in module M15. Thus, the M15 module may reflect EC’s impaired immunological function and their role in the cancer hallmark “Evading immune destruction”. The identification of 9 hub genes, for example, CXCL12 and F8, highlights these genes’ role in functions associated with this module. Interestingly, no functional interactions have been found in the STRING database. The strong co-expression in these modules, for example ANAPC1TXND17, COA3 M E A 1 , or PHKA1MYO9A may point towards novel, functionally relevant protein-protein interactions. Somewhat surprisingly, CXCL12, a chemokine with an important role in angiogenesis [78], was found to be a hub gene in a module negatively associated with TEC.
With an enrichment of the GO terms Cell matrix adhesion and Basement membrane organisation, the M18 module may display the “reorganisation of the basement membrane” and “adhesion” properties during angiogenic activation of endothelial cells [77]. No different eigengene expression was observed between NEC and TEC. Functions of angiogenic activated endothelial cells (for example, Vascular endothelial growth receptor signalling pathway, endothelium development, regulation of angiogenesis) characterise the module M14, highlighting this module’s role in angiogenesis and confirming the feasibility of our data. Interestingly, however, this module’s eigengenes were downregulated in ENG TEC, which may point towards a dedifferentiation of tumour endothelial cells. Finally, the enrichment of terms describing immunological functions in module M8 mirrors the findings of the GSVA concerning downregulation of immunological functions in TEC. TEC’s decrease of responsiveness to pro-inflammatory stimuli is well known and has been coined “tumor endothelial anergy” [62]. The association with positive regulation of immunological functions (for example Positive regulation of cytokine production, and Positive regulation of leukocyte cell–cell adhesion), combined with a decreased expression of the module eigengene in TEC highlights again their role in the cancer hallmark “Evading immune destruction”. The strong co-expression between the hub genes of the modules M14 and M8 may indicate novel, potentially relevant protein-protein interactions.
As a further result, querying the Drug–Gene Interaction database identified several potentially druggable genes, for example, FEN1, BIRC5 and NEK2. FEN1 is essential in maintaining genome stability, replication and repair [79,80]. It plays a major role in DNA replication and protection against apoptosis and the development of drug resistance [81], has been suggested as a potential target in a variety of cancers [82], and has also been identified as a potential hub gene in hepatocellular carcinoma [75,83]. BIRC5 which is secreted into the microenvironment [84], acts as an apoptosis inhibitor [85] and may play a significant role in the apoptosis-resistant phenotype observed in TEC [20]. Therefore, our results may point towards a TEC mediated protection against apoptosis for the tumour cells. BIRC5 can be targeted by several drugs, for example, erlotinib, lapatinib, trastuzumab, or 5FU. The SEARCH trial investigated the efficacy of a combination of sorafenib and erlotinib but failed to reach the primary endpoint [86]. Lapatinib, a small-molecule inhibitor of ERBB1/ERBB2 tyrosine kinases, has been shown to inhibit BIRC5 expression via the ERB2 signalling [87]. This inhibition, however, seems to take place at a posttranscriptional rather than transcriptional level [87]. Trastuzumab, which is primarily used in breast cancer [88], interacts via the PI3K pathway with BIRC5 [89] and shows some effectiveness [90]. Several drugs directly targeting BIRC5 are under investigation, employing five different modes of action: disruption of BIRC5 interactions, inhibition of homodimerisation, decrease gene expression, degradation of BIRC5 mRNA, and usage in immune therapy [64]. For example, shepherdin disrupts the binding of BIRC5 to HSP90, resulting in anti-cancer activity [91]. A 5-desflavacin analogue disrupts BIRC5-SMAC interactions [92]. Molecular docking studies identified other BIRC5-SMAC interrupting agents such as withanone or piperine derivates [93,94]. Recently it has been demonstrated that PZ-6-QN, a BIRC5-SMAC interaction disruptor, showed promising anti-cancer activity [95]. Taken together, these data indicate that the disruption of BIRC5 interactions may hold promise in cancer therapy. Interestingly, the M1 module contained only SMAC, but not HSP90. SMAC was not identified as hub-gene in the M1 module. NEK2 plays a role in developing drug resistance against various anti-cancer drugs, including 5-fluorouracil and sorafenib [69,96,97]. A potential role of NEK2 in resistance development against lenvatinib and other anti-angiogenic drugs has not been investigated yet. NEK2 has been proposed as a promising target in cancer therapy [98,99], and various drugs are currently under development. As with BIRC5, these drugs employ several modes of action, namely silencing mRNA expression using siRNA, blocking the ATP binding site, and interruption of protein-interaction [99]. Several small molecular compounds disrupt the interaction HEK-NEK1 resulting in NEK2 degradation and cell death. [100]. In our results, we found HEC1 to be a member of the M1 module. However, as with SMAC, HEC1 was not classified as hub-gene. Other functionally relevant genes, for example, FEN1, NEK2, TOP2A, CCNB1 or CDKN2, displayed greater connectivity and co-expression strength within the module. Further, experimental evidence in other species indicates that some of these observed co-expression patterns may indicate underlying protein-protein interaction networks. According to the centrality-lethality theorem, genes with high connectivity are more likely to be therapeutic targets than genes with low connectivity [27]. We interpret these findings so that the reported co-expression networks could be utilised to identify potential two types of new therapeutic targets, namely among the hub genes themselves and protein-protein interactions associated with strong co-expression values.
Finally, we present an easy-to-implement framework, consisting of identifying differentially perturbed pathways via Gene Set Variation analysis, followed by a co-expression network-based determination of key modules and potential therapeutic targets. While this study successfully identifies differentially expressed genes, perturbed pathways, relevant gene modules and potential therapeutic targets and provides a blueprint for similar questions, it has several limitations. Although unique in study size and design, GSE51401 is a non-recent microarray-based dataset; therefore, it should be validated using newer RNASeq data. Second, the analysis has been done in silico only and requires, therefore, validation, as it should be done with all bioinformatical analyses. Preferably, this should be a combination of proteomic analysis and functional assays. Third, the analysis is restricted to one tumour entity and should be further validated in other tumour entities to allow more general conclusions. It would also be of interest to carry out pan-cancer endothelial profiling to characterise similarities and differences between endothelial cells from different tumour entities.

5. Conclusions

This study systematically investigated the differences between normal and tumour endothelial cells in hepatocellular carcinoma on gene expression level. Gene Set Variation Analysis showed a gene expression profile of tumour endothelial cells characterised by upregulated evasion from growth suppressors pathways, and downregulated tumour-promoting inflammation and resisting cell death pathways. Weighted Gene Co-expression Network Analysis identified several modules strongly associated with cell origin and cell activation. These modules were characterised by GO terms associated with cell proliferation, mitochondrial metabolism and immune functions. Cell proliferation and mitochondrial metabolism associated modules were upregulated, immune function associated modules were downregulated in TEC. Determination of hub genes revealed several druggable hub genes, such as FEN1, BIRC5, and NEK2, which may lead to new therapeutic approaches targeting endothelial cells. Finally, other researchers might use this framework as a blueprint when tackling similar questions in other tumours.

Supplementary Materials

The following are available online at https://www.mdpi.com/article/10.3390/cancers13081768/s1, Figure S1: The “Cell Cycle” Pathway, Figure S2: The “Retinoblastoma gene in cancer” Pathway, Figure S3: The “MAPK signalling Pathway”, Figure S4: The “Chemokine signalling pathways” Pathway, and Figure S5: The “Apoptosis” pathway. Table S1: LIMMA results and connectivity of the genes, Table S2: Results of the GSVA between contrasts, Table S3: Results of the Term Enrichment Analysis of the single modules, and Table S4: Results of the drug gene interaction database query.

Author Contributions

T.M. conceived the study, analyzed the data and wrote, reviewed and corrected the manuscript. S.K. programmed the workflows and analyzed the data. V.P. analyzed the data, reviewed and corrected the manuscript. N.A. provided RNASeq data, reviewed and corrected the manuscript. A.T. analyzed the data and wrote, reviewed and corrected the manuscript. All authors approved of the final version of the submitted manuscript.

Funding

A.T. received funding via the ‘physician researcher pathway scholarship’ program at the Medical University of Vienna. This research was funded in part by the Austrian Science Fund (FWF, project number SFB-F5401).

Institutional Review Board Statement

Not applicable.

Informed Consent Statement

Not applicable.

Data Availability Statement

The data analyzed in this study are openly available in Gene Expression Omnibus, accession number GSE51401.

Acknowledgments

The authors would like to thank Dominic Grün of the Institut für Systemimmunologie, University Freiburg, Freiburg, Germany, for providing sc-RNASeq data of liver endothelial cells. In addition, the authors would like thank Johannes Schmid of the Institute of Vascular Biology and Thrombosis Research, Center of Physiology and Pharmacology, Medical University of Vienna, Vienna, Austria, for proofreading the manuscript and providing valuable insights. Lastly, the authors would like to thank Elisabeth Mohr for her help in manuscript correction and submission. This article is based upon work from COST Action STRATAGEM, CA17104, supported by COST (European Cooperation in Science and Technology).

Conflicts of Interest

The authors declare no conflict of interest.

Abbreviations

The following abbreviations are used in this manuscript:
DGIdbDrug–Gene Interaction database
NECendothelial cells derived from non-tumour tissue
(liver sinusoidal, macrovascular, and other endothelial cells)
TECendothelial cells derived from tumour tissue
(liver sinusoidal, macrovascular endothelial cells, and other endothelial cells)
LSECLiver sinusoidal endothelial cells
LECLiver endothelial cells (liver sinusoidal, macrovascular, and other endothelial cells)
HCCHepatocellular carcinoma
log2FClogarithm of the fold change to the base 2
WGCNAWeighted Gene Network Analysis
GSEAGene Set Enrichment Analysis
GOTEAGO Term Enrichment Analysis
GSVAGene Set Variation Analysis
GOTSSAGO Term Semantic Similarity Analysis
FIFunctional interactions
DEGdifferentially expressed gene
5FU5-fluorouracil

References

  1. Wong, M.C.S.; Jiang, J.Y.; Goggins, W.B.; Liang, M.; Fang, Y.; Fung, F.D.H.; Leung, C.; Wang, H.H.X.; Wong, G.L.H.; Wong, V.W.S.; et al. International Incidence and Mortality Trends of Liver Cancer: A Global Profile. Sci. Rep. 2017, 7, srep45846. [Google Scholar] [CrossRef] [PubMed]
  2. Sakamoto, M. Early HCC: Diagnosis and Molecular Markers. J. Gastroenterol. 2009, 44, 108–111. [Google Scholar] [CrossRef] [PubMed]
  3. Bertuccio, P.; Turati, F.; Carioli, G.; Rodriguez, T.; La Vecchia, C.; Malvezzi, M.; Negri, E. Global Trends and Predictions in Hepatocellular Carcinoma Mortality. J. Hepatol. 2017, 67, 302–309. [Google Scholar] [CrossRef]
  4. Kumar, V.; Rahman, M.; Gahtori, P.; Al-Abbasi, F.; Anwar, F.; Kim, H.S. Current Status and Future Directions of Hepatocellular Carcinoma-Targeted Nanoparticles and Nanomedicine. Expert Opin. Drug Deliv. 2020, 1–22. [Google Scholar] [CrossRef] [PubMed]
  5. Tabrizian, P.; Jibara, G.; Shrager, B.; Schwartz, M.; Roayaie, S. Recurrence of Hepatocellular Cancer After Resection: Patterns, Treatments, and Prognosis. Ann. Surg. 2015, 261, 947–955. [Google Scholar] [CrossRef]
  6. Maslak, E.; Gregorius, A.; Chlopicki, S. Liver Sinusoidal Endothelial Cells (LSECs) Function and NAFLD; NO-Based Therapy Targeted to the Liver. Pharmacol. Rep. 2015, 67, 689–694. [Google Scholar] [CrossRef]
  7. Poisson, J.; Lemoinne, S.; Boulanger, C.; Durand, F.; Moreau, R.; Valla, D.; Rautou, P.E. Liver Sinusoidal Endothelial Cells: Physiology and Role in Liver Diseases. J. Hepatol. 2017, 66, 212–227. [Google Scholar] [CrossRef] [Green Version]
  8. Augustin, H.G.; Kozian, D.H.; Johnson, R.C. Differentiation of Endothelial Cells: Analysis of the Constitutive and Activated Endothelial Cell Phenotypes. Bioessays News Rev. Mol. Cell. Dev. Biol. 1994, 16, 901–906. [Google Scholar] [CrossRef]
  9. Géraud, C.; Evdokimov, K.; Straub, B.K.; Peitsch, W.K.; Demory, A.; Dörflinger, Y.; Schledzewski, K.; Schmieder, A.; Schemmer, P.; Augustin, H.G.; et al. Unique Cell Type-Specific Junctional Complexes in Vascular Endothelium of Human and Rat Liver Sinusoids. PLoS ONE 2012, 7, e34206. [Google Scholar] [CrossRef] [Green Version]
  10. Strauss, O.; Phillips, A.; Ruggiero, K.; Bartlett, A.; Dunbar, P.R. Immunofluorescence Identifies Distinct Subsets of Endothelial Cells in the Human Liver. Sci. Rep. 2017, 7, 1–13. [Google Scholar] [CrossRef] [Green Version]
  11. Shetty, S.; Lalor, P.F.; Adams, D.H. Liver Sinusoidal Endothelial Cells — Gatekeepers of Hepatic Immunity. Nat. Rev. Gastroenterol. Hepatol. 2018, 15, 555–567. [Google Scholar] [CrossRef]
  12. Akiyama, K.; Ohga, N.; Hida, Y.; Kawamoto, T.; Sadamoto, Y.; Ishikawa, S.; Maishi, N.; Akino, T.; Kondoh, M.; Matsuda, A.; et al. Tumor Endothelial Cells Acquire Drug Resistance by MDR1 Up-Regulation via VEGF Signaling in Tumor Microenvironment. Am. J. Pathol. 2012, 180, 1283–1293. [Google Scholar] [CrossRef]
  13. Matsuda, K.; Ohga, N.; Hida, Y.; Muraki, C.; Tsuchiya, K.; Kurosu, T.; Akino, T.; Shih, S.C.; Totsuka, Y.; Klagsbrun, M.; et al. Isolated Tumor Endothelial Cells Maintain Specific Character during Long-Term Culture. Biochem. Biophys. Res. Commun. 2010, 394, 947–954. [Google Scholar] [CrossRef] [PubMed]
  14. St. Croix, B.; Rago, C.; Velculescu, V.; Traverso, G.; Romans, K.E.; Montgomery, E.; Lal, A.; Riggins, G.J.; Lengauer, C.; Vogelstein, B.; et al. Genes Expressed in Human Tumor Endothelium. Science 2000, 289, 1197–1202. [Google Scholar] [CrossRef]
  15. Wu, L.Q.; Zhang, W.J.; Niu, J.X.; Ye, L.Y.; Yang, Z.H.; Grau, G.E.; Lou, J.N. Phenotypic and Functional Differences between Human Liver Cancer Endothelial Cells and Liver Sinusoidal Endothelial Cells. J. Vasc. Res. 2008, 45, 78–86. [Google Scholar] [CrossRef]
  16. Semela, D.; Dufour, J.F. Angiogenesis and Hepatocellular Carcinoma. J. Hepatol. 2004, 41, 864–880. [Google Scholar] [CrossRef]
  17. Hanahan, D.; Weinberg, R.A. Hallmarks of Cancer: The Next Generation. Cell 2011, 144, 646–674. [Google Scholar] [CrossRef] [Green Version]
  18. Li, Y.; Zhai, Z.; Liu, D.; Zhong, X.; Meng, X.; Yang, Q.; Liu, J.; Li, H. CD105 Promotes Hepatocarcinoma Cell Invasion and Metastasis through VEGF. Tumour Biol. J. Int. Soc. Oncodev. Biol. Med. 2015, 36, 737–745. [Google Scholar] [CrossRef] [PubMed]
  19. Maishi, N.; Hida, K. Tumor Endothelial Cells Accelerate Tumor Metastasis. Cancer Sci. 2017, 108, 1921–1926. [Google Scholar] [CrossRef] [PubMed] [Green Version]
  20. Xiong, Y.Q.; Sun, H.C.; Zhang, W.; Zhu, X.D.; Zhuang, P.Y.; Zhang, J.B.; Wang, L.; Wu, W.Z.; Qin, L.X.; Tang, Z.Y. Human Hepatocellular Carcinoma Tumor–Derived Endothelial Cells Manifest Increased Angiogenesis Capability and Drug Resistance Compared with Normal Endothelial Cells. Clin. Cancer Res. 2009, 15, 4838–4846. [Google Scholar] [CrossRef] [PubMed] [Green Version]
  21. Finn, R.S.; Qin, S.; Ikeda, M.; Galle, P.R.; Ducreux, M.; Kim, T.Y.; Kudo, M.; Breder, V.; Merle, P.; Kaseb, A.O.; et al. Atezolizumab plus Bevacizumab in Unresectable Hepatocellular Carcinoma. N. Engl. J. Med. 2020, 382, 1894–1905. [Google Scholar] [CrossRef] [PubMed]
  22. Li, C.; Xu, J. Feature Selection with the Fisher Score Followed by the Maximal Clique Centrality Algorithm Can Accurately Identify the Hub Genes of Hepatocellular Carcinoma. Sci. Rep. 2019, 9, 1–11. [Google Scholar] [CrossRef] [PubMed] [Green Version]
  23. Presson, A.P.; Yoon, N.K.; Bagryanova, L.; Mah, V.; Alavi, M.; Maresh, E.L.; Rajasekaran, A.K.; Goodglick, L.; Chia, D.; Horvath, S. Protein Expression Based Multimarker Analysis of Breast Cancer Samples. BMC Cancer 2011, 11, 230. [Google Scholar] [CrossRef] [PubMed] [Green Version]
  24. Tian, A.; Pu, K.; Li, B.; Li, M.; Liu, X.; Gao, L.; Mao, X. Weighted Gene Coexpression Network Analysis Reveals Hub Genes Involved in Cholangiocarcinoma Progression and Prognosis. Hepatol. Res. 2019, 49, 1195–1206. [Google Scholar] [CrossRef] [Green Version]
  25. Wu, H.; Chen, S.; Yu, J.; Li, Y.; Zhang, X.Y.; Yang, L.; Zhang, H.; Hou, Q.; Jiang, M.; Brunicardi, F.C.; et al. Single-Cell Transcriptome Analyses Reveal Molecular Signals to Intrinsic and Acquired Paclitaxel Resistance in Esophageal Squamous Cancer Cells. Cancer Lett. 2018, 420, 156–167. [Google Scholar] [CrossRef]
  26. Horvath, S. Weighted Network Analysis: Applications in Genomics and Systems Biology; Springer: Berlin/Heidelberg, Germany, 2011. [Google Scholar]
  27. Jeong, H.; Mason, S.P.; Barabási, A.L.; Oltvai, Z.N. Lethality and Centrality in Protein Networks. Nature 2001, 411, 41–42. [Google Scholar] [CrossRef] [Green Version]
  28. Tolios, A.; De Las Rivas, J.; Hovig, E.; Trouillas, P.; Scorilas, A.; Mohr, T. Computational Approaches in Cancer Multidrug Resistance Research: Identification of Potential Biomarkers, Drug Targets and Drug-Target Interactions. Drug Resist. Updat. 2019, 48, 100662. [Google Scholar] [CrossRef]
  29. Lebrin, F.; Goumans, M.J.; Jonker, L.; Carvalho, R.L.; Valdimarsdottir, G.; Thorikay, M.; Mummery, C.; Arthur, H.M.; ten Dijke, P. Endoglin Promotes Endothelial Cell Proliferation and TGF-β/ALK1 Signal Transduction. EMBO J. 2004, 23, 4018–4028. [Google Scholar] [CrossRef] [Green Version]
  30. Jin, Y.; Muhl, L.; Burmakin, M.; Wang, Y.; Duchez, A.C.; Betsholtz, C.; Arthur, H.M.; Jakobsson, L. Endoglin Prevents Vascular Malformation by Regulating Flow-Induced Cell Migration and Specification through VEGFR2 Signalling. Nat. Cell Biol. 2017, 19, 639–652. [Google Scholar] [CrossRef] [Green Version]
  31. Schoonderwoerd, M.J.A.; Goumans, M.J.T.H.; Hawinkels, L.J.A.C. Endoglin: Beyond the Endothelium. Biomolecules 2020, 10, 289. [Google Scholar] [CrossRef] [Green Version]
  32. R Core Team. R: A Language and Environment for Statistical Computing; R Foundation for Statistical Computing: Vienna, Austria, 2018. [Google Scholar]
  33. Gautier, L.; Cope, L.M.; Bolstad, B.M.; Irizarry, R.A. Affy—Analysis of Affymetrix GeneChip data at the probe level. Bioinformatics 2009, 20, 307–315. [Google Scholar] [CrossRef]
  34. Kauffmann, A.; Gentleman, R.; Huber, W. arrayQualityMetrics—A Bioconductor Package for Quality Assessment of Microarray Data. Bioinformatics 2009, 25, 415–416. [Google Scholar] [CrossRef] [Green Version]
  35. Gentleman, R.; Carey, V.; Huber, W.; Hahne, F. Genefilter: Genefilter: Methods for Filtering Genes from Microarray Experiments. R Package Version 1.72.1, 2021. [Google Scholar]
  36. Aizarani, N.; Saviano, A.; Sagar; Mailly, L.; Durand, S.; Herman, J.S.; Pessaux, P.; Baumert, T.F.; Grün, D. A Human Liver Cell Atlas Reveals Heterogeneity and Epithelial Progenitors. Nature 2019, 572, 199–204. [Google Scholar] [CrossRef] [PubMed]
  37. Herman, J.S.; Sagar; Grün, D. FateID Infers Cell Fate Bias in Multipotent Progenitors from Single-Cell RNA-Seq Data. Nat. Methods 2018, 15, 379–386. [Google Scholar] [CrossRef] [PubMed]
  38. Ritchie, M.E.; Phipson, B.; Wu, D.; Hu, Y.; Law, C.W.; Shi, W.; Smyth, G.K. Limma powers differential expression analyses for RNA-sequencing and microarray studies. Nucl. Acids Res. 2015, 43, 379–386. [Google Scholar] [CrossRef] [PubMed]
  39. Hochberg, Y.; Benjamani, Y. More Powerful Procedures for Multiple Significance Testing. Stat. Med. 1990, 9, 811–818. [Google Scholar] [CrossRef] [PubMed]
  40. Hänzelmann, S.; Castelo, R.; Guinney, J. GSVA: Gene Set Variation Analysis for Microarray and RNA-Seq Data. BMC Bioinform. 2013, 14, 7. [Google Scholar] [CrossRef] [Green Version]
  41. Kutmon, M.; Riutta, A.; Nunes, N.; Hanspers, K.; Willighagen, E.L.; Bohler, A.; Mélius, J.; Waagmeester, A.; Sinha, S.R.; Miller, R.; et al. WikiPathways: Capturing the Full Diversity of Pathway Knowledge. Nucleic Acids Res. 2016, 44, D488–D494. [Google Scholar] [CrossRef]
  42. Langfelder, P.; Horvath, S. WGCNA: An R Package for Weighted Correlation Network Analysis. BMC Bioinform. 2008, 9, 559. [Google Scholar] [CrossRef] [Green Version]
  43. Greenfest-Allen, E.; Cartailler, J.P.; Magnuson, M.A.; Stoeckert, C.J. iterativeWGCNA: Iterative Refinement to Improve Module Detection from WGCNA Co-Expression Networks. bioRxiv 2017, 234062. [Google Scholar] [CrossRef] [Green Version]
  44. Benaglia, T.; Chauveau, D.; Hunter, D.R.; Young, D.S. Mixtools: An R Package for Analyzing Finite Mixture Models. J. Stat. Softw. 2009, 32, 1–29. [Google Scholar] [CrossRef] [Green Version]
  45. Oldham, M.C.; Langfelder, P.; Horvath, S. Network Methods for Describing Sample Relationships in Genomic Datasets: Application to Huntington’s Disease. BMC Syst. Biol. 2012, 6, 63. [Google Scholar] [CrossRef] [PubMed] [Green Version]
  46. Bates, D.; Mächler, M.; Bolker, B.; Walker, S. Fitting Linear Mixed-Effects Models Using Lme4. J. Stat. Softw. 2015, 67. [Google Scholar] [CrossRef]
  47. Li, J.; Zhou, D.; Qiu, W.; Shi, Y.; Yang, J.J.; Chen, S.; Wang, Q.; Pan, H. Application of Weighted Gene Co-Expression Network Analysis for Data from Paired Design. Sci. Rep. 2018, 8, 622. [Google Scholar] [CrossRef] [Green Version]
  48. Kuznetsova, A.; Brockhoff, P.B.; Christensen, R.H.B. lmerTest Package: Tests in Linear Mixed Effects Models. J. Stat. Softw. 2017, 82, 1–26. [Google Scholar] [CrossRef] [Green Version]
  49. Szklarczyk, D.; Gable, A.L.; Lyon, D.; Junge, A.; Wyder, S.; Huerta-Cepas, J.; Simonovic, M.; Doncheva, N.T.; Morris, J.H.; Bork, P.; et al. STRING V11: Protein–Protein Association Networks with Increased Coverage, Supporting Functional Discovery in Genome-Wide Experimental Datasets. Nucleic Acids Res. 2019, 47, D607–D613. [Google Scholar] [CrossRef] [Green Version]
  50. Cotto, K.C.; Wagner, A.H.; Feng, Y.Y.; Kiwala, S.; Coffman, A.C.; Spies, G.; Wollam, A.; Spies, N.C.; Griffith, O.L.; Griffith, M. DGIdb 3.0: A Redesign and Expansion of the Drug–Gene Interaction Database. Nucleic Acids Res. 2018, 46, D1068–D1073. [Google Scholar] [CrossRef] [Green Version]
  51. Wagner, A.H.; Coffman, A.C.; Ainscough, B.J.; Spies, N.C.; Skidmore, Z.L.; Campbell, K.M.; Krysiak, K.; Pan, D.; McMichael, J.F.; Eldred, J.M.; et al. DGIdb 2.0: Mining Clinically Relevant Drug–Gene Interactions. Nucleic Acids Res. 2016, 44, D1036–D1044. [Google Scholar] [CrossRef] [Green Version]
  52. Yu, G.; Wang, L.G.; Han, Y.; He, Q.Y. clusterProfiler: An R Package for Comparing Biological Themes Among Gene Clusters. OMICS J. Integr. Biol. 2012, 16, 284–287. [Google Scholar] [CrossRef]
  53. Liberzon, A.; Subramanian, A.; Pinchback, R.; Thorvaldsdóttir, H.; Tamayo, P.; Mesirov, J.P. Molecular Signatures Database (MSigDB) 3.0. Bioinformatics 2011, 27, 1739–1740. [Google Scholar] [CrossRef]
  54. Ashburner, M.; Ball, C.A.; Blake, J.A.; Botstein, D.; Butler, H.; Cherry, J.M.; Davis, A.P.; Dolinski, K.; Dwight, S.S.; Eppig, J.T.; et al. Gene Ontology: Tool for the Unification of Biology. Nat. Genet. 2000, 25, 25–29. [Google Scholar] [CrossRef] [PubMed] [Green Version]
  55. Yu, G.; Li, F.; Qin, Y.; Bo, X.; Wu, Y.; Wang, S. GOSemSim: An R Package for Measuring Semantic Similarity among GO Terms and Gene Products. Bioinformatics 2010, 26, 976–978. [Google Scholar] [CrossRef] [PubMed]
  56. Wang, J.Z.; Du, Z.; Payattakool, R.; Yu, P.S.; Chen, C.F. A New Method to Measure the Semantic Similarity of GO Terms. Bioinformatics 2007, 23, 1274–1281. [Google Scholar] [CrossRef] [PubMed] [Green Version]
  57. McInnes, L.; Healy, J.; Melville, J. UMAP: Uniform Manifold Approximation and Projection for Dimension Reduction. arXiv 2020, arXiv:1802.03426. [Google Scholar]
  58. Ester, M.; Kriegel, H.P.; Sander, J.; Xu, X. A Density-Based Algorithm for Discovering Clusters in Large Spatial Databases with Noise. In Proceedings of the Second International Conference on Knowledge Discovery and Data Mining, KDD’96; AAAI Press: Portland, OR, USA, 1996; pp. 226–231. [Google Scholar]
  59. Sayols, S. Rrvgo: A Bioconductor Package to Reduce and Visualize Gene Ontology Terms. 2020. Available online: https://ssayols.github.io/rrvgo (accessed on 31 March 2021).
  60. Seaman, S.; Stevens, J.; Yang, M.Y.; Logsdon, D.; Graff-Cherry, C.; St. Croix, B. Genes That Distinguish Physiological and Pathological Angiogenesis. Cancer Cell 2007, 11, 539–554. [Google Scholar] [CrossRef] [Green Version]
  61. Li, J.J. A New Bioinformatics Tool to Recover Missing Gene Expression in Single-Cell RNA Sequencing Data. J. Mol. Cell Biol. 2020. [Google Scholar] [CrossRef] [PubMed]
  62. Griffioen, A.W.; Damen, C.A.; Blijham, G.H.; Groenewegen, G. Tumor Angiogenesis Is Accompanied by a Decreased Inflammatory Response of Tumor-Associated Endothelium. Blood 1996, 88, 667–673. [Google Scholar] [CrossRef]
  63. Hida, K.; Maishi, N.; Annan, D.A.; Hida, Y. Contribution of Tumor Endothelial Cells in Cancer Progression. Int. J. Mol. Sci. 2018, 19, 1272. [Google Scholar] [CrossRef] [Green Version]
  64. Li, F.; Aljahdali, I.; Ling, X. Cancer Therapeutics Using Survivin BIRC5 as a Target: What Can We Do after over Two Decades of Study? J. Exp. Clin. Cancer Res. 2019, 38. [Google Scholar] [CrossRef] [Green Version]
  65. Chen, B.; Garmire, L.; Calvisi, D.F.; Chua, M.S.; Kelley, R.K.; Chen, X. Harnessing Big ‘omics’ Data and AI for Drug Discovery in Hepatocellular Carcinoma. Nat. Rev. Gastroenterol. Hepatol. 2020, 17, 238–251. [Google Scholar] [CrossRef]
  66. Kaur, H.; Dhall, A.; Kumar, R.; Raghava, G.P.S. Identification of Platform-Independent Diagnostic Biomarker Panel for Hepatocellular Carcinoma Using Large-Scale Transcriptomics Data. bioRxiv 2019, 758250. [Google Scholar] [CrossRef]
  67. Liu, J.; Hua, P.; Hui, L.; Zhang, L.L.; Hu, Z.; Zhu, Y.W. Identification of Hub Genes and Pathways Associated with Hepatocellular Carcinoma Based on Network Strategy. Exp. Ther. Med. 2016. [Google Scholar] [CrossRef] [PubMed] [Green Version]
  68. Goveia, J.; Rohlenova, K.; Taverna, F.; Treps, L.; Conradi, L.C.; Pircher, A.; Geldhof, V.; de Rooij, L.P.M.H.; Kalucka, J.; Sokol, L.; et al. An Integrated Gene Expression Landscape Profiling Approach to Identify Lung Tumor Endothelial Cell Heterogeneity and Angiogenic Candidates. Cancer Cell 2020, 37, 21–36.e13. [Google Scholar] [CrossRef]
  69. Ohga, N.; Ishikawa, S.; Maishi, N.; Akiyama, K.; Hida, Y.; Kawamoto, T.; Sadamoto, Y.; Osawa, T.; Yamamoto, K.; Kondoh, M.; et al. Heterogeneity of Tumor Endothelial Cells. Am. J. Pathol. 2012, 180, 1294–1307. [Google Scholar] [CrossRef]
  70. Chavakis, E.; Dimmeler, S. Regulation of Endothelial Cell Survival and Apoptosis During Angiogenesis. Arterioscler. Thromb. Vasc. Biol. 2002, 22, 887–893. [Google Scholar] [CrossRef] [PubMed] [Green Version]
  71. Addison, C.L.; Daniel, T.O.; Burdick, M.D.; Liu, H.; Ehlert, J.E.; Xue, Y.Y.; Buechi, L.; Walz, A.; Richmond, A.; Strieter, R.M. The CXC Chemokine Receptor 2, CXCR2, Is the Putative Receptor for ELR+ CXC Chemokine-Induced Angiogenic Activity. J. Immunol. 2000, 165, 5269–5277. [Google Scholar] [CrossRef] [Green Version]
  72. Vandercappellen, J.; Van Damme, J.; Struyf, S. The Role of CXC Chemokines and Their Receptors in Cancer. Cancer Lett. 2008, 267, 226–244. [Google Scholar] [CrossRef] [PubMed]
  73. Salazar, N.; Zabel, B.A. Support of Tumor Endothelial Cells by Chemokine Receptors. Front. Immunol. 2019, 10. [Google Scholar] [CrossRef] [PubMed] [Green Version]
  74. Xing, C.; Xie, H.; Zhou, L.; Zhou, W.; Zhang, W.; Ding, S.; Wei, B.; Yu, X.; Su, R.; Zheng, S. Cyclin-Dependent Kinase Inhibitor 3 Is Overexpressed in Hepatocellular Carcinoma and Promotes Tumor Cell Proliferation. Biochem. Biophys. Res. Commun. 2012, 420, 29–35. [Google Scholar] [CrossRef]
  75. Zhao, Q.; Zhang, Y.; Shao, S.; Sun, Y.; Lin, Z. Identification of Hub Genes and Biological Pathways in Hepatocellular Carcinoma by Integrated Bioinformatics Analysis. PeerJ 2021, 9, e10594. [Google Scholar] [CrossRef]
  76. Zhao, X.; Weng, W.; Jin, M.; Li, S.; Chen, Q.; Li, B.; Zhou, Z.; Lan, C.; Yang, Y. Identification of Biomarkers Based on Bioinformatics Analysis: The Expression of Ubiquitin-Conjugating Enzyme E2T (UBE2T) in the Carcinogenesis and Progression of Hepatocellular Carcinoma. Med Sci. Monit. Int. Med J. Exp. Clin. Res. 2021, 27, e929023-1–e929023-11. [Google Scholar] [CrossRef]
  77. Dudley, A.C. Tumor Endothelial Cells. Cold Spring Harb. Perspect. Med. 2012, 2. [Google Scholar] [CrossRef] [PubMed]
  78. Zheng, H.; Fu, G.; Dai, T.; Huang, H. Migration of Endothelial Progenitor Cells Mediated by Stromal Cell-Derived Factor-1α/CXCR4 via PI3K/Akt/eNOS Signal Transduction Pathway. J. Cardiovasc. Pharmacol. 2007, 50, 274–280. [Google Scholar] [CrossRef] [PubMed]
  79. Cheng, I.C.; Chen, B.C.; Shuai, H.H.; Chien, F.C.; Chen, P.; Hsieh, T.S. Wuho Is a New Member in Maintaining Genome Stability through Its Interaction with Flap Endonuclease 1. PLoS Biol. 2016, 14. [Google Scholar] [CrossRef] [PubMed]
  80. Kathera, C.; Zhang, J.; Janardhan, A.; Sun, H.; Ali, W.; Zhou, X.; He, L.; Guo, Z. Interacting Partners of FEN1 and Its Role in the Development of Anticancer Therapeutics. Oncotarget 2017, 8, 27593–27602. [Google Scholar] [CrossRef] [PubMed] [Green Version]
  81. He, L.; Luo, L.; Zhu, H.; Yang, H.; Zhang, Y.; Wu, H.; Sun, H.; Jiang, F.; Kathera, C.S.; Liu, L.; et al. FEN1 Promotes Tumor Progression and Confers Cisplatin Resistance in Non-Small-Cell Lung Cancer. Mol. Oncol. 2017, 11, 640–654. [Google Scholar] [CrossRef] [PubMed] [Green Version]
  82. He, L.; Zhang, Y.; Sun, H.; Jiang, F.; Yang, H.; Wu, H.; Zhou, T.; Hu, S.; Kathera, C.S.; Wang, X.; et al. Targeting DNA Flap Endonuclease 1 to Impede Breast Cancer Progression. EBioMedicine 2016, 14, 32–43. [Google Scholar] [CrossRef] [Green Version]
  83. Pu, J.; Wang, J.; Qin, Z.; Wang, A.; Zhang, Y.; Wu, X.; Wu, Y.; Li, W.; Xu, Z.; Lu, Y.; et al. IGF2BP2 Promotes Liver Cancer Growth Through an m6A-FEN1-Dependent Mechanism. Front. Oncol. 2020, 10. [Google Scholar] [CrossRef] [PubMed]
  84. Khan, S.; Aspe, J.R.; Asumen, M.G.; Almaguel, F.; Odumosu, O.; Acevedo-Martinez, S.; De Leon, M.; Langridge, W.H.R.; Wall, N.R. Extracellular, Cell-Permeable Survivin Inhibits Apoptosis While Promoting Proliferative and Metastatic Potential. Br. J. Cancer 2009, 100, 1073–1086. [Google Scholar] [CrossRef] [Green Version]
  85. Shin, S.; Sung, B.J.; Cho, Y.S.; Kim, H.J.; Ha, N.C.; Hwang, J.I.; Chung, C.W.; Jung, Y.K.; Oh, B.H. An Anti-Apoptotic Protein Human Survivin Is a Direct Inhibitor of Caspase-3 and -7. Biochemistry 2001, 40, 1117–1123. [Google Scholar] [CrossRef]
  86. Zhu, A.X.; Rosmorduc, O.; Evans, T.R.J.; Ross, P.J.; Santoro, A.; Carrilho, F.J.; Bruix, J.; Qin, S.; Thuluvath, P.J.; Llovet, J.M.; et al. SEARCH: A Phase III, Randomized, Double-Blind, Placebo-Controlled Trial of Sorafenib plus Erlotinib in Patients with Advanced Hepatocellular Carcinoma. J. Clin. Oncol. Off. J. Am. Soc. Clin. Oncol. 2015, 33, 559–566. [Google Scholar] [CrossRef]
  87. Xia, W.; Bisi, J.; Strum, J.; Liu, L.; Carrick, K.; Graham, K.M.; Treece, A.L.; Hardwicke, M.A.; Dush, M.; Liao, Q.; et al. Regulation of Survivin by ErbB2 Signaling: Therapeutic Implications for ErbB2-Overexpressing Breast Cancers. Cancer Res. 2006, 66, 1640–1647. [Google Scholar] [CrossRef] [Green Version]
  88. Collins, D.C.; Cocchiglia, S.; Tibbitts, P.; Solon, G.; Bane, F.T.; McBryan, J.; Treumann, A.; Eustace, A.; Hennessy, B.; Hill, A.D.; et al. Growth Factor Receptor/Steroid Receptor Cross Talk in Trastuzumab-Treated Breast Cancer. Oncogene 2015, 34, 525–530. [Google Scholar] [CrossRef]
  89. Chakrabarty, A.; Bhola, N.E.; Sutton, C.; Ghosh, R.; Kuba, M.G.; Dave, B.; Chang, J.C.; Arteaga, C.L. Trastuzumab-Resistant Cells Rely on a HER2-PI3K-FoxO-Survivin Axis and Are Sensitive to PI3K Inhibitors. Cancer Res. 2013, 73, 1190–1200. [Google Scholar] [CrossRef] [PubMed] [Green Version]
  90. Shi, J.H.; Guo, W.Z.; Jin, Y.; Zhang, H.P.; Pang, C.; Li, J.; Line, P.D.; Zhang, S.J. Recognition of HER2 Expression in Hepatocellular Carcinoma and Its Significance in Postoperative Tumor Recurrence. Cancer Med. 2019, 8, 1269–1278. [Google Scholar] [CrossRef] [PubMed] [Green Version]
  91. Plescia, J.; Salz, W.; Xia, F.; Pennati, M.; Zaffaroni, N.; Daidone, M.G.; Meli, M.; Dohi, T.; Fortugno, P.; Nefedova, Y.; et al. Rational Design of Shepherdin, a Novel Anticancer Agent. Cancer Cell 2005, 7, 457–468. [Google Scholar] [CrossRef] [Green Version]
  92. Oikawa, T.; Unno, Y.; Matsuno, K.; Sawada, J.I.; Ogo, N.; Tanaka, K.; Asai, A. Identification of a Small-Molecule Inhibitor of the Interaction between Survivin and Smac/DIABLO. Biochem. Biophys. Res. Commun. 2010, 393, 253–258. [Google Scholar] [CrossRef]
  93. Wadegaonkar, V.P.; Wadegaonkar, P.A. Withanone as an Inhibitor of Survivin: A Potential Drug Candidate for Cancer Therapy. J. Biotechnol. 2013, 168, 229–233. [Google Scholar] [CrossRef] [PubMed]
  94. Sattarinezhad, E.; Bordbar, A.K.; Fani, N. Piperine Derivatives as Potential Inhibitors of Survivin: An in Silico Molecular Docking. Comput. Biol. Med. 2015, 63, 219–227. [Google Scholar] [CrossRef] [PubMed]
  95. Park, S.H.; Shin, I.; Park, S.H.; Kim, N.D.; Shin, I. An Inhibitor of the Interaction of Survivin with Smac in Mitochondria Promotes Apoptosis. Chem. Asian J. 2019, 14, 4035–4041. [Google Scholar] [CrossRef]
  96. Hida, K.; Akiyama, K.; Ohga, N.; Maishi, N.; Hida, Y. Tumour Endothelial Cells Acquire Drug Resistance in a Tumour Microenvironment. J. Biochem. 2013, 153, 243–249. [Google Scholar] [CrossRef] [PubMed] [Green Version]
  97. Deng, L.; Sun, J.; Chen, X.; Liu, L.; Wu, D. Nek2 Augments Sorafenib Resistance by Regulating the Ubiquitination and Localization of β-Catenin in Hepatocellular Carcinoma. J. Exp. Clin. Cancer Res. 2019, 38, 316. [Google Scholar] [CrossRef] [PubMed] [Green Version]
  98. Kokuryo, T.; Yokoyama, Y.; Yamaguchi, J.; Tsunoda, N.; Ebata, T.; Nagino, M. NEK2 Is an Effective Target for Cancer Therapy With Potential to Induce Regression of Multiple Human Malignancies. Anticancer. Res. 2019, 39, 2251–2258. [Google Scholar] [CrossRef] [PubMed]
  99. Fang, Y.; Zhang, X. Targeting NEK2 as a Promising Therapeutic Approach for Cancer Treatment. Cell Cycle 2016, 15, 895–907. [Google Scholar] [CrossRef] [PubMed] [Green Version]
  100. Hu, C.M.; Zhu, J.; Guo, X.E.; Chen, W.; Qiu, X.L.; Ngo, B.; Chien, R.; Wang, Y.V.; Tsai, C.Y.; Wu, G.; et al. Novel Small Molecules Disrupting Hec1/Nek2 Interaction Ablate Tumor Progression by Triggering Nek2 Degradation through a Death-Trap Mechanism. Oncogene 2015, 34, 1220–1230. [Google Scholar] [CrossRef] [PubMed] [Green Version]
Figure 1. Workflow of the overall analysis.
Cancers 13 01768 g001
Figure 2. Expression of ENG, FLT1, LYVE1, and PECAM1 in TEC and NEC (ENG and ENG+). Violin plots of the expression distribution of (A) ENG, (B) FLT1, (C) LYVE1, and (D) PECAM1 are shown. Numbers above the bars represent adjusted p-values of the comparisons indicated by the bar.
Cancers 13 01768 g002
Figure 3. Expression of ENG, FLT1, LYVE1, and PECAM1 in liver cells. The distribution of the expression of (A) ENG, (B) FLT1, (C) LYVE1, and (D) PECAM1 in sc-RNASeq cluster of liver cells is shown. The cluster association is as follows: (1) Liver sinusoidal endothelial cells, (2) macrovascular liver endothelial cells, (3) other liver endothelial cells, (4) Kupffer cells, (5) NK, NKT, and T-cells. Expression levels are color-coded from blue to red as indicated at the lower right corner.
Cancers 13 01768 g003
Figure 4. Differential gene expression and pathway perturbation in ENG and ENG+ TEC. (A) Differentially expressed genes in ENG TEC and (B) in ENG+ TEC. (C) Perturbed Wikipathways in ENG TEC and (D) in ENG+ TEC. Negative GSVA score difference (blue) indicates down-, positive GSVA score difference (red) indicates upregulation of the respective pathway in TEC. Horizontal lines indicate an FDR of 0.05. The top ten up and down-regulated genes (in term of log2FC) and pathways (in terms of GSVA score difference) are labelled. The controls for ENG TEC and ENG+ TEC were ENG NEC and ENG+ NEC, respectively.
Cancers 13 01768 g004
Figure 5. Identification of modules that are associated with either origin (tumour vs. non-tumour endothelial cells) or angiogenic activation. (A) Outlier identification based on the z-normalized intersample connectivity (zK). The red line denotes a zK of 1.96. Potential outliers are labelled red. (B) Dendrogram showing detected modules. Each branch of the dendrogram represents a gene assigned to one of the modules. Grey areas represent genes not assigned to any module. (C) Heatmap showing the association between a module and either cell origin or angiogenic activation. The top number represents the t-statistic, the number in brackets the associated adjusted p-value. A positive t-statistics indicates up-, a negative t-statistics represents downregulation in the TEC (indicated by “cell origin”), and ENG+ cells (indicated by “activation”). (D) Module membership for the entire network (overall), for the M1, M16, M15, M18, M14, and M8 module. The red line denotes a membership of 0.8.
Cancers 13 01768 g005
Figure 6. Eigengene plots of modules with strong association to cell origin and angiogenic activation. (AC) Eigengene plots for modules with a strong association to cell origin (M1, M16, and M15). (DF) Eigengene plots for modules with a strong association to angiogenic activation (M18, M14, and M8. Plots are coloured according to the module colour. Numbers represent adjusted p-values for the respective comparisons.
Cancers 13 01768 g006
Figure 7. Network and GO Term enrichment plots the hub genes of modules with strong association to cell origin. Network plots (A,C,E) are coloured according to the original module color. Read labels indicate druggability, and edge thickness represents connection strengths (red indicating known FI). GO term Enrichment plots (B,D,F) are coloured according to term clusters and labelled with the most significant term of the respective clusters.
Cancers 13 01768 g007
Figure 8. Network and GO Term enrichment plots the hub genes of modules with strong association to cell origin. Network plots (A,C,E) are coloured according to the original module color. Read labels indicate druggability, and edge thickness represents connection strengths (red indicating known FI). GO term Enrichment plots (B,D,F) are coloured according to term clusters and labelled with the most significant term of the respective clusters.
Cancers 13 01768 g008
Figure 9. Functional Interaction network underlying the potentially druggable hub genes in module M1. The functional interaction network between potentially druggable hub-genes is shown. Edge color represents interaction type. The number indicates the number of drugs targeting the gene.
Cancers 13 01768 g009
Table 1. Characteristics of the study cohort. Numbers before the slash represent the number of used samples, numbers after the slash represent the number of total samples.
GendernMedian Age (Years)Non-Tumour Endothelial Cells (NEC)Tumour Endothelial Cells (TEC)
ENGENG+ENGENG+
F3643/32/22/3 12/2
M135212/13 26/612/13 34/6 4
Total165315/168/814/166/8
1 Sample GSM1244757 (from Patient 8) was excluded due to unequal hybridization, as detected in spatial distribution plots. 2 Sample GSM1244761 (from Patient 9) was excluded due to excessive spans of the relative log expression (RLE) distribution and the normalized unscaled standard error (NUSE) distribution. 3 Sample GSM1244763 (from Patient 9) was excluded due to excessive distance to the other samples in the PCA as well as an excessive NUSE. 4 Sample GSM1244737 (from Patient 3) was excluded due to excessive distance to the other samples in the PCA. Sample GSM1244746 (from Patient 5) was excluded due to excessive spans of the relative log expression (RLE) distribution and the normalized unscaled standard error (NUSE) distribution.
Table 2. Potentially drugable hub genes in network modules positively associated with cell origin or angiogenic activation and the respective drugs.
Gene SymbolGene NameDrugPMIDs
Module: M1
BIRC5baculoviral IAP repeat containing 5UCN-01, STAUROSPORINE, ROMIDEPSIN, VALDECOXIB, ERLOTINIB, OPRELVEKIN, VORINOSTAT, IMATINIB, TRASTUZUMAB, PACLITAXEL, FLUTAMIDE, CALCITONIN, GATAPARSEN, DEXAMETHASONE, ROFECOXIB, PLICAMYCIN, IRINOTECAN HYDROCHLORIDE, REGRAMOSTIM, EPIRUBICIN, TRETINOIN, SULINDAC, CARBOPLATIN, AMMONIUM TRICHLOROTELLURATE, DOCETAXEL, RESVERATROL, OMACETAXINE MEPESUCCINATE, METHOTREXATE, DOXORUBICIN, EPOETIN ALFA, LAPATINIB, INDOMETHACIN, CAMPTOTHECIN, PRASTERONE, GENISTEIN, FLUOROURACIL, RESERPINE, BERBERINE15255949, 17255535, 14767553, 16707021, 17047074, 14734714, 16951239, 16254145, 23204226, 16452223, 15347474, 16211241, 15735703, 16222118, 16787583, 14627349, 17124180, 15956246, 16403261, 16608080, 14587026, 16950207, 16889755, 14729643, 15837718, 17270149, 15854289, 15670151, 16211302, 17112829, 16461558, 17375591, 15067352, 17968851
CCNB1cyclin B1KENPAULLONE, PROTOAPIGENONE, SELICICLIB21080703
CDKN3cyclin-dependent kinase inhibitor 3PHA-793887, RONICICLIB, AZD-5438, AT-7519
FEN1flap structure-specific endonuclease 1TYRPHOSTIN 23, APOMORPHINE HYDROCHLORIDE HEMIHYDRATE, STREPTONIGRIN, ISOTHYMONIN, CALMIDAZOLIUM CHLORIDE, PIRARUBICIN, MYRICETIN, PROTOPORPHYRIN DISODIUM, CIANIDANOL, DEOXIEPINEPHRINE, TRANSPLATIN, SLAZINIC ACID, OXIDOPAMINE HYDROCHLORIDE, PENTABROMOPHENOL, AMINODIMETHOXYQUINAZOLINYLPIPERAZINE, 4-CHLOROMERCURIBENZOIC ACID, ELLIPTECINE, PINAFIDE, HYDROXYZINE PAMOATE, CLINAFLOXACIN, SENNOSIDE B, 3-O-METHYLQUERCETIN, PHENYLSTIBONIC ACID, PURPUROGALLIN, IDARUBICIN, CLOSANTEL, OXOPURPUREINE, THUNBERGINOL B, DIOTYROSINE, TYRPHOSTIN 51, DAPHNETIN, TETRAIDOFLUORESCEIN, EBSELEN, MITONAFIDE, QUINACRINE, LEVODOPA, STICTIC ACID, DEMECLOCYCLINE, DOXYCYCLINE, ATHRAQUINONES A, AMARANTH, THIMEROSAL, CEPHALOCHROMIN, HAEMATOXYLIN, METHOXSALEN, COUMESTROL, AURINTRICARBOXYLIC ACID, GW305074X, FERROUS FUMARATE, FERROUS GLYCINE SULFATE, GOSSYPOL, NOREPINEPHRINE, CETYLPYRIDINIUM BROMIDE, BENSERAZIDE HYDROCHLORIDE, METHACYCLINE HYDROCHLORIDE, SURAMIN, QUERCETIN, ASTERRIC ACID, METHYLENE BLUE, EMODIN, LUTEOLIN, SANGUINARINE SULFATE, RHEIN, METHYLDOPA (RACEMIC), ELLAGIC ACID, HOMIDIUM, DEPHOSTATIN, HOMIDIUM BROMIDE, EPINEPHRINE, AMINACRINE HYDROCHLORIDE, DITHIAZANINE, ACRIFLAVINE, CARMINE, AMENTOFLAVONE, DEQUALINIUM, LAVENDUSTIN C, TOLONIUM CHLORIDE, PROTOPORPHYRIN, HEXAMETHYL PARAROSANILINE, TAXIFOLIN, ALEXIDINE HYDROCHLORIDE, PICEATANNOL, METHYLTHIONINIUM CHLORIDE, OXOGLAUCINE, FAGARONINE, ACID BLUE 129, MORIN, DAUNORUBICIN HYDROCHLORIDE, CEFSULODIN SODIUM, HISPIDIN, METHYLDOPA, PAMOIC ACID, FRAXETIN, LOMOFUNGIN, ISOKAEMPFERIDE, NORDIHYDROGUAIARETIC ACID, EUPAFOLIN, FURAMIDINE, SANGUINARIUM CHLORIDE, MITOXANTRONE, HYCANTHONE, PYRONIN Y, CHARTREUSIN, CARMINIC ACID, 2-METHOXY-1, 4-NAPHTHOQUINONE, ERBSTATIN, MITOXANTRONE HYDROCHLORIDE, BAICALEIN, CATECHOL, PURPURIN, OXYTETRACYCLINE, DOPAMINE, INDOCYANINE GREEN3319774, 20622253
NEK2NIMA related kinase 2ADAVOSERTIB, HESPERADIN, R-406, DACTOLISIB, PAZOPANIB, DOVITINIB, FOSTAMATINIB, GW441756X, TAE-684, CENISERTIB, GW843682X, ILORASERTIB, PALBOCICLIB, CYC-116, SP-600125, GSK-579289A19035792, 26516587
TOP2Atopoisomerase (DNA) II alphaDOXORUBICIN, BECATECARIN, C-1311, CARINATIN G, ETOPOSIDE, AMSACRINE, PODOFILOX, VALRUBICIN, EPIRUBICIN, IDRONOXIL, AMONAFIDE, 13-DEOXYDOXORUBICIN, AMRUBICIN HYDROCHLORIDE, HYDROQUINONE, DIAZIRINE, LUPEOL, DOXORUBICIN HYDROCHLORIDE, UNGEREMINE, DAUNORUBICIN HYDROCHLORIDE, SPARFLOXACIN, ANNAMYCIN, ELSAMITRUCIN, LOMEFLOXACIN, NORFLOXACIN, DACTINOMYCIN, FLEROXACIN, LUCANTHONE, AMRUBICIN, VOSAROXIN, TENIPOSIDE, DAUNORUBICIN, MITOXANTRONE, DAUNORUBICIN CITRATE, DEXRAZOXANE, BETULIN, IDARUBICIN, KAEMPFERITRIN, GANCOTAMAB, BERUBICIN HYDROCHLORIDE, ELINAFIDE, ETOPOSIDE PHOSPHATE, MYRICETIN, DEMETHYLZEYLASTERONE, FRANGULIN B, IDARUBICIN HYDROCHLORIDE, PACLITAXEL, FLUOROURACIL, SECAUBRYOLIDE, MITOXANTRONE HYDROCHLORIDE, GENISTEIN, QUERCETIN, HURATOXIN, FISETIN, DIGITOXIN, MOXIFLOXACIN, PEFLOXACIN, TROVAFLOXACIN, ENOXACIN, DECLOPRAMIDE, CIPROFLOXACIN, OFLOXACIN, ELLIPTECINE, ADRIAMYCIN, 4’-O-ACETYLPATENTIFLORIN B, MAKALUVAMINE E, DIPHYLLIN, SIMOCYCLINONE D8, BANOXANTRONE, FINAFLOXACIN, MAKALUVAMINE C TFA SALT, CAMPTOTHECIN, MAKALUVAMINE A, MAKALUVAMINE F, ALDOXORUBICIN, LYCOBETAINE, VINCRISTINE, TRICITRINOL B, OLEANDEROLIDE26211460, 17089011, 11752352, 17578914, 17010609, 20170164, 22276998, 21388138, 17351394, 17016621, 16377807, 16309315, 16271071, 8823806, 8870683, 23711769, 22867019, 25466187, 23968711, 23920485, 11678653, 25003995, 23566520, 21644529, 18258442, 25941559, 20863598, 22364746, 25922181, 23353750, 24931277, 24012683, 23360284, 20006518, 26216018, 17361331, 17514873, 9426516, 9485461, 9494516, 16759114, 25945730, 19691293, 24326278, 22620261, 26264845, 19783445, 26291037, 19386396, 24334150, 21435753, 25815139, 22867097, 25799376, 25800514, 25240702, 24775914, 18816045, 26292628, 24507920, 24095018, 1311390, 11473732, 17911018, 19155103, 25626146, 22537681, 19725581, 11006484, 11716434, 10691026, 1322791, 8519659, 8632768, 1845848, 10783066, 16061385, 1331331, 1334447, 16019763, 16234514, 17639997, 14728934, 17658777, 24054489, 15833037, 11754608, 22014547, 7756657, 3015015, 1323952, 9169823, 10487533, 17628745, 16480143, 8702194, 22260166, 1963303, 6380596, 11004693, 9631585, 10451375, 11278845, 18687447, 11046078, 12911317, 10194547, 17115008, 11179439, 17652819, 11984069, 11332155, 10203104, 12034365, 11836027, 8036155, 10523799, 22014228, 21880496, 7769390, 8759170, 20561793, 17139284, 17016423, 20596674, 20802486, 18471102, 10089819, 2847647, 22119124, 8691207, 17340571, 25808831, 11205246, 25312684, 23266176, 21761866
TTKTTK protein kinaseHESPERADIN, BAY-1217389, FOSTAMATINIB, BAY-116190919035792, 26516587
UBE2Tubiquitin conjugating enzyme E2TMK-2206
Module: M14
HSPG2heparan sulfate proteoglycan 2HALOPERIDOL, PALIFERMIN, CYCLOSPORINE27023437, 10593896, 16989989, 14753849, 9788974, 14974815
PEAR1platelet endothelial aggregation receptor 1ASPIRIN, CLOPIDOGREL, PRASUGREL, TICAGRELOR23392654, 23859572, 28820077, 26962983, 27937053
ERGv-ets avian erythroblastosis virus E26 oncogene homologDOFETILIDE, SOTALOL HYDROCHLORIDE, AZD1305, NERISPIRDINE, IDARUBICIN HYDROCHLORIDE, MITONAFIDE, N-ACETYLASPARTIC ACID, GUANIDINE HYDROCHLORIDE, DALFAMPRIDINE, AZD7009, AMIODARONE HYDROCHLORIDE, MEDROXYPROGESTERONE ACETATE, HOMIDIUM BROMIDE, DAUNORUBICIN HYDROCHLORIDE, PERGOLIDE MESYLATE, 1, 4-DIMETHOXYANTHRAQUINONE, TEDISAMIL
Publisher’s Note: MDPI stays neutral with regard to jurisdictional claims in published maps and institutional affiliations.

