
Evaluation of FET PET Radiomics Feature Repeatability in Glioma Patients


 , , ,
, , ,
Abstract
:Simple Summary
Abstract
1. Introduction
2. Patients and Methods
2.1. Patients
2.2. Determination of the IDH Genotype and 1p/19q Co-Deletion
2.3. FET PET Imaging
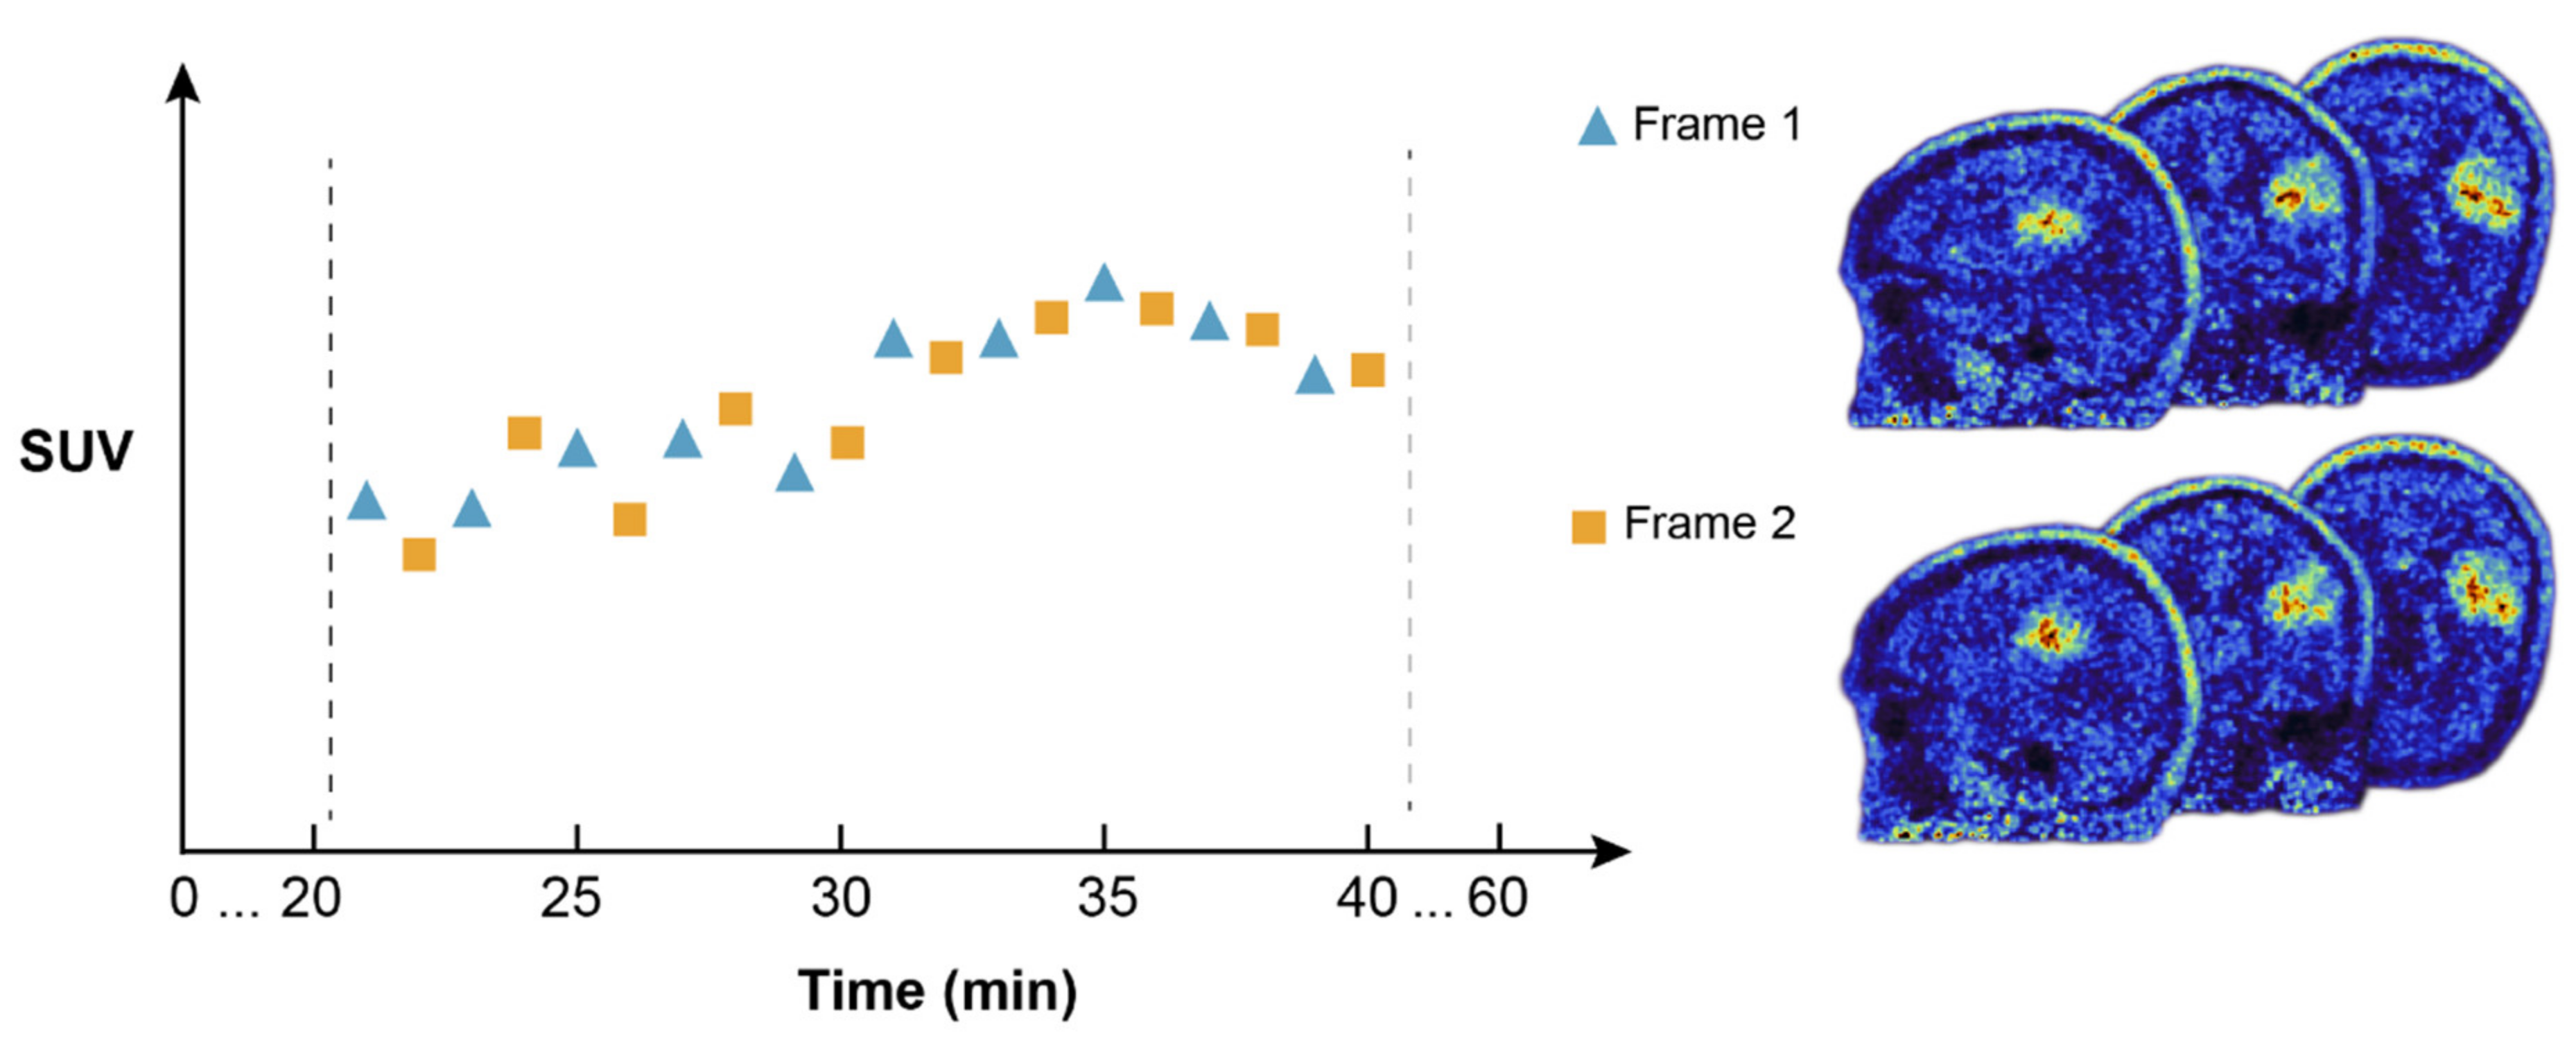
2.4. Dual FET PET Image Reconstruction for Test–Retest Analysis
2.5. Image Segmentation for Test–Retest Analysis
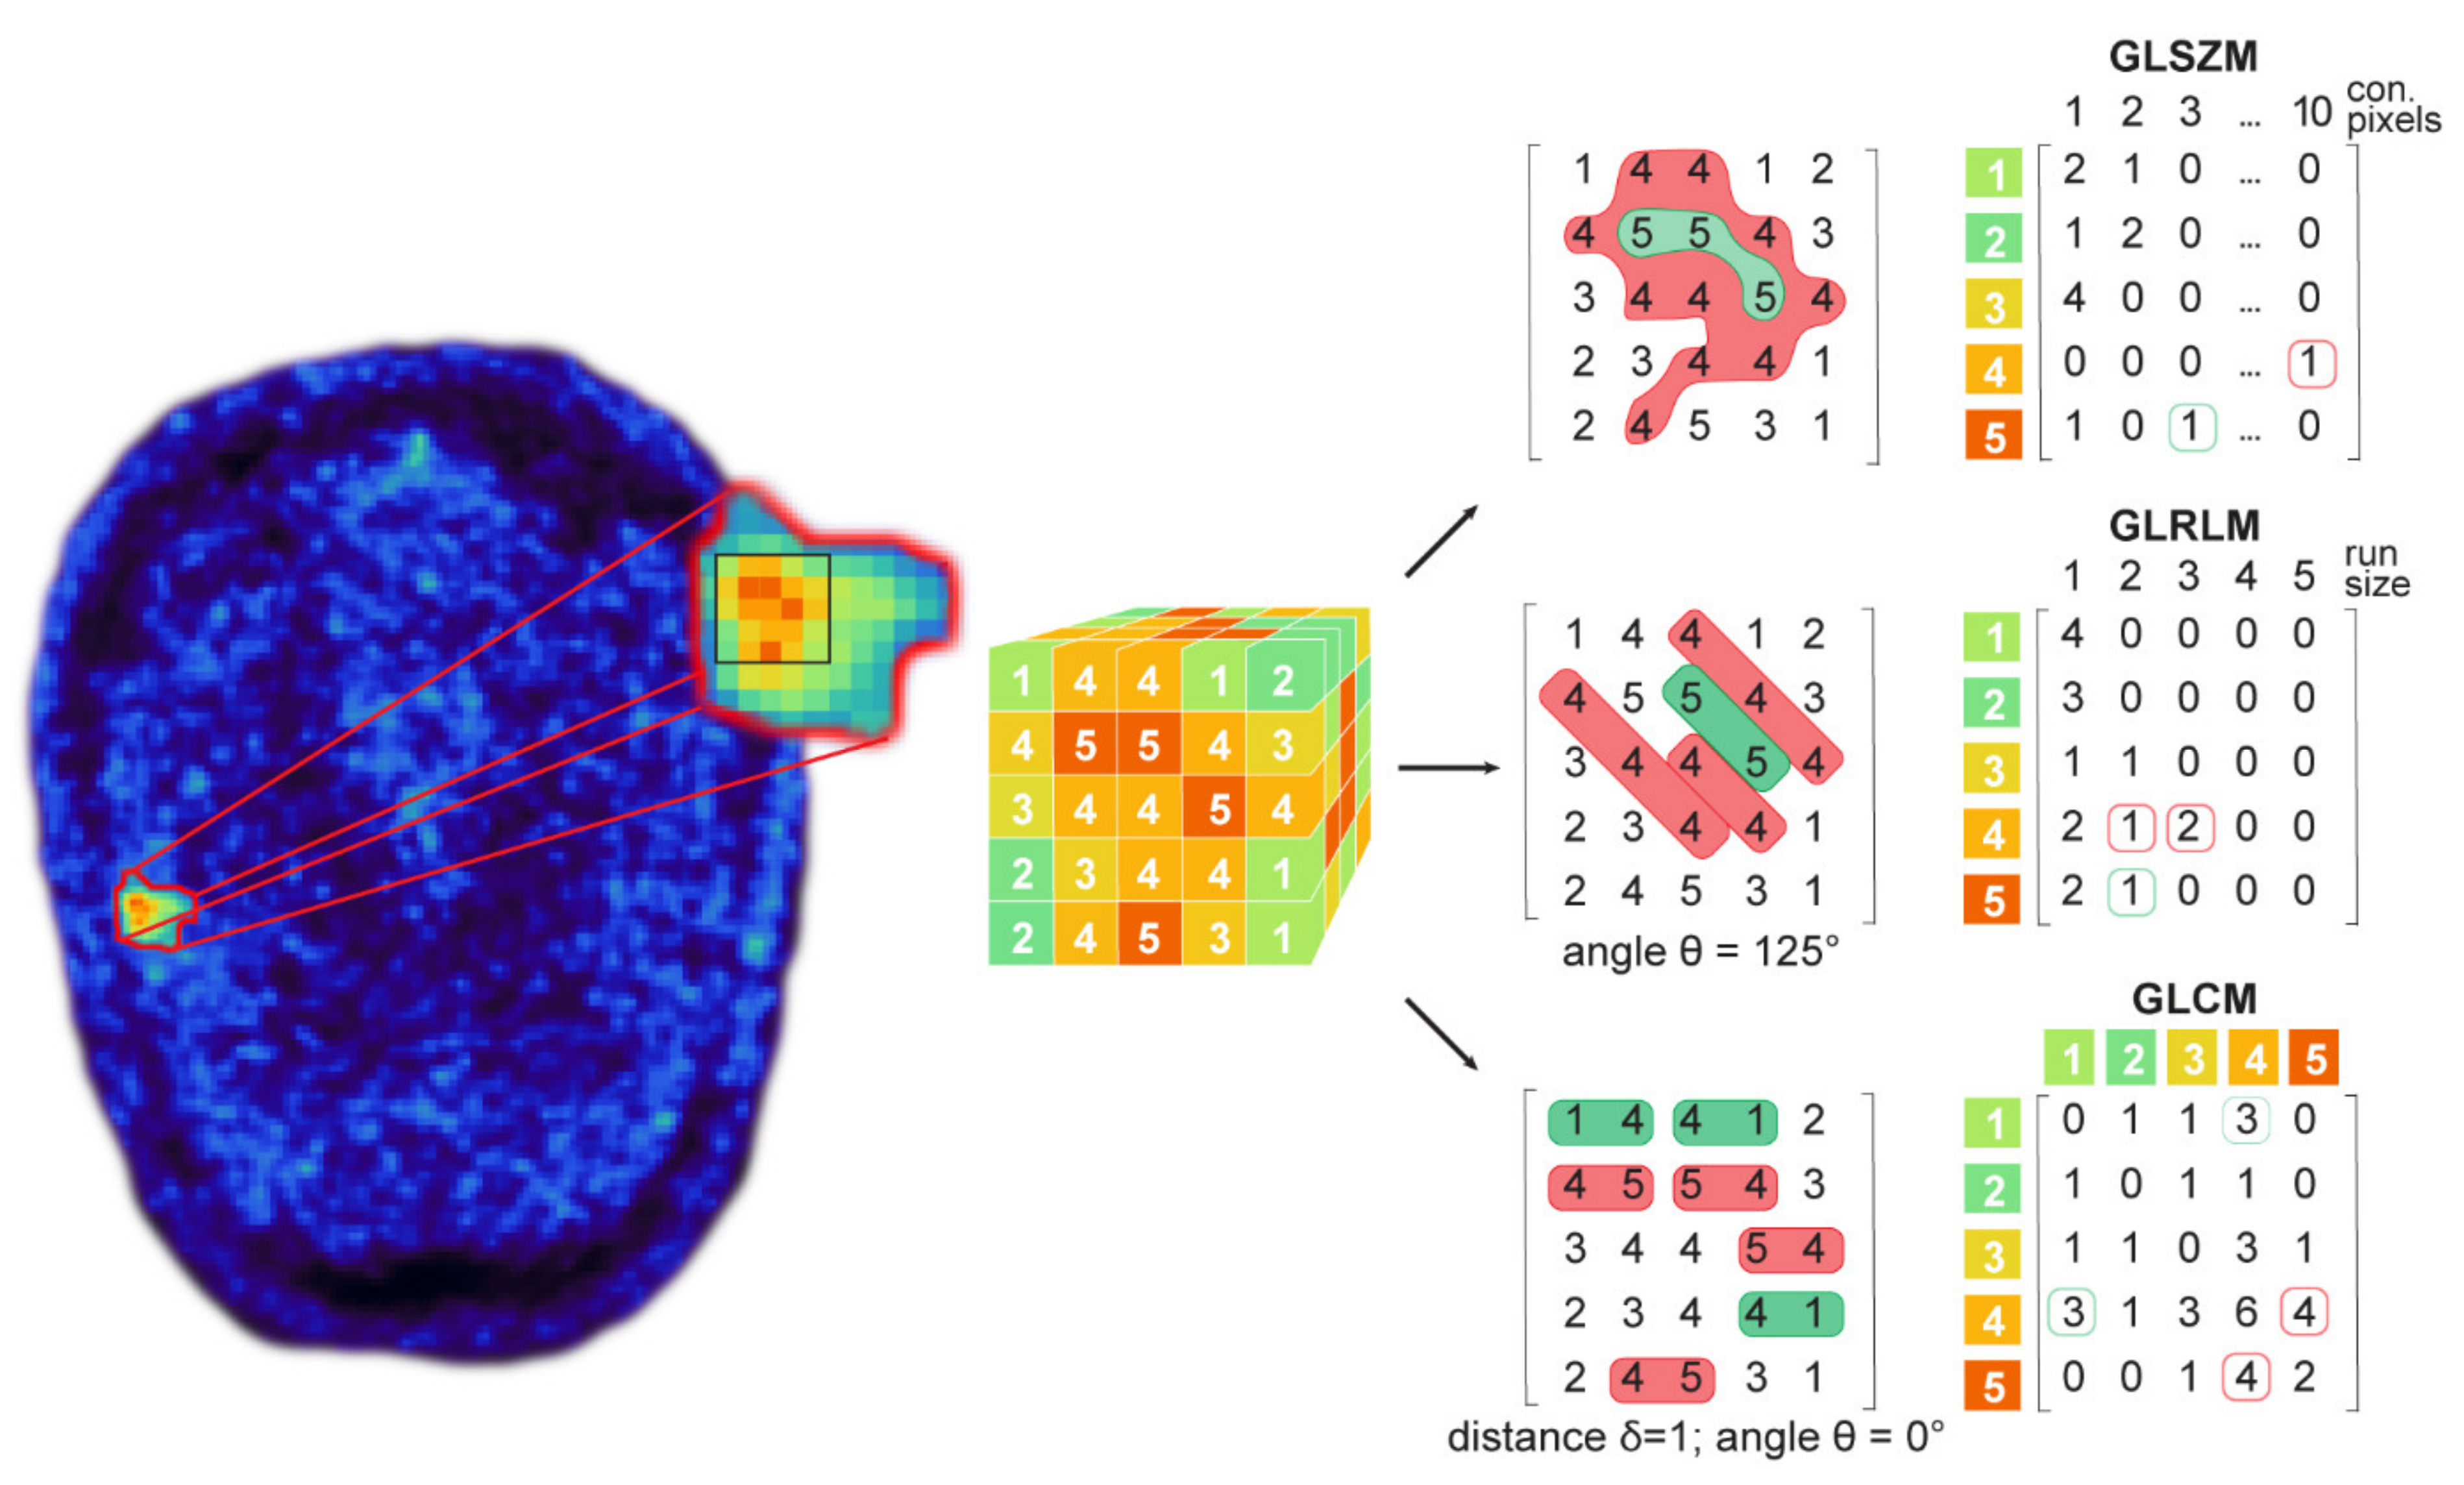
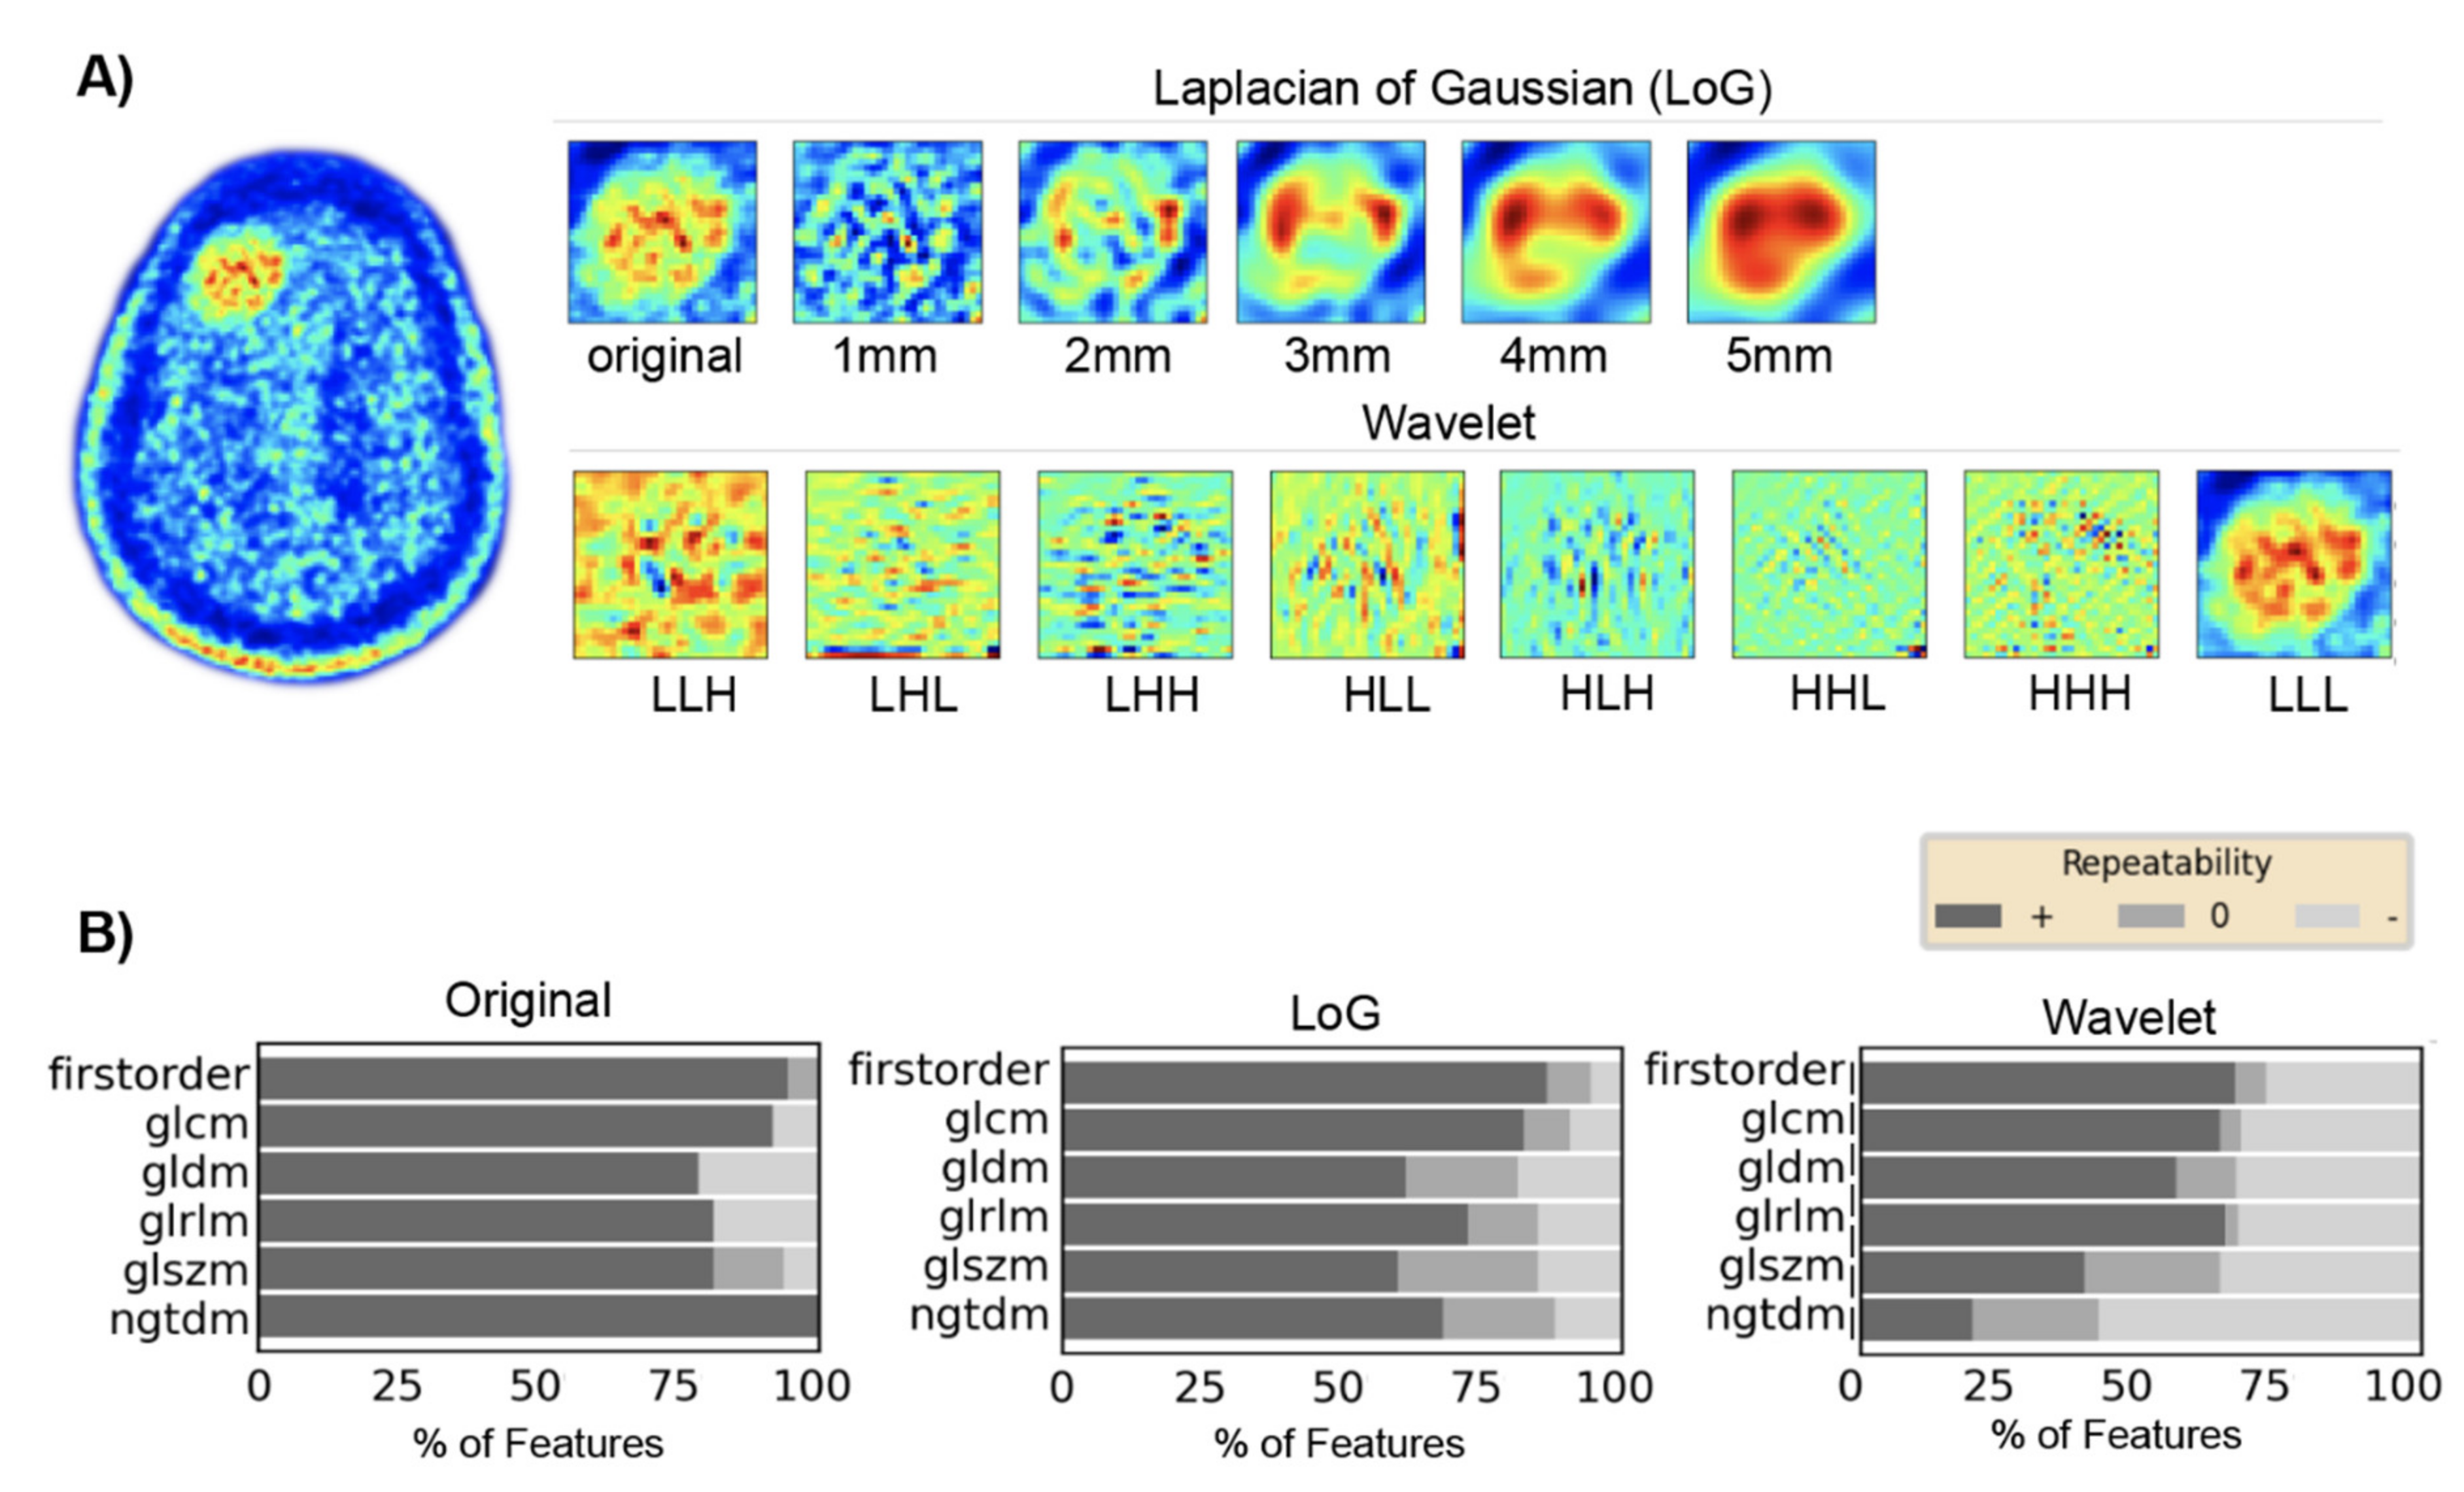
2.6. Feature Extraction for Test–Retest Analysis
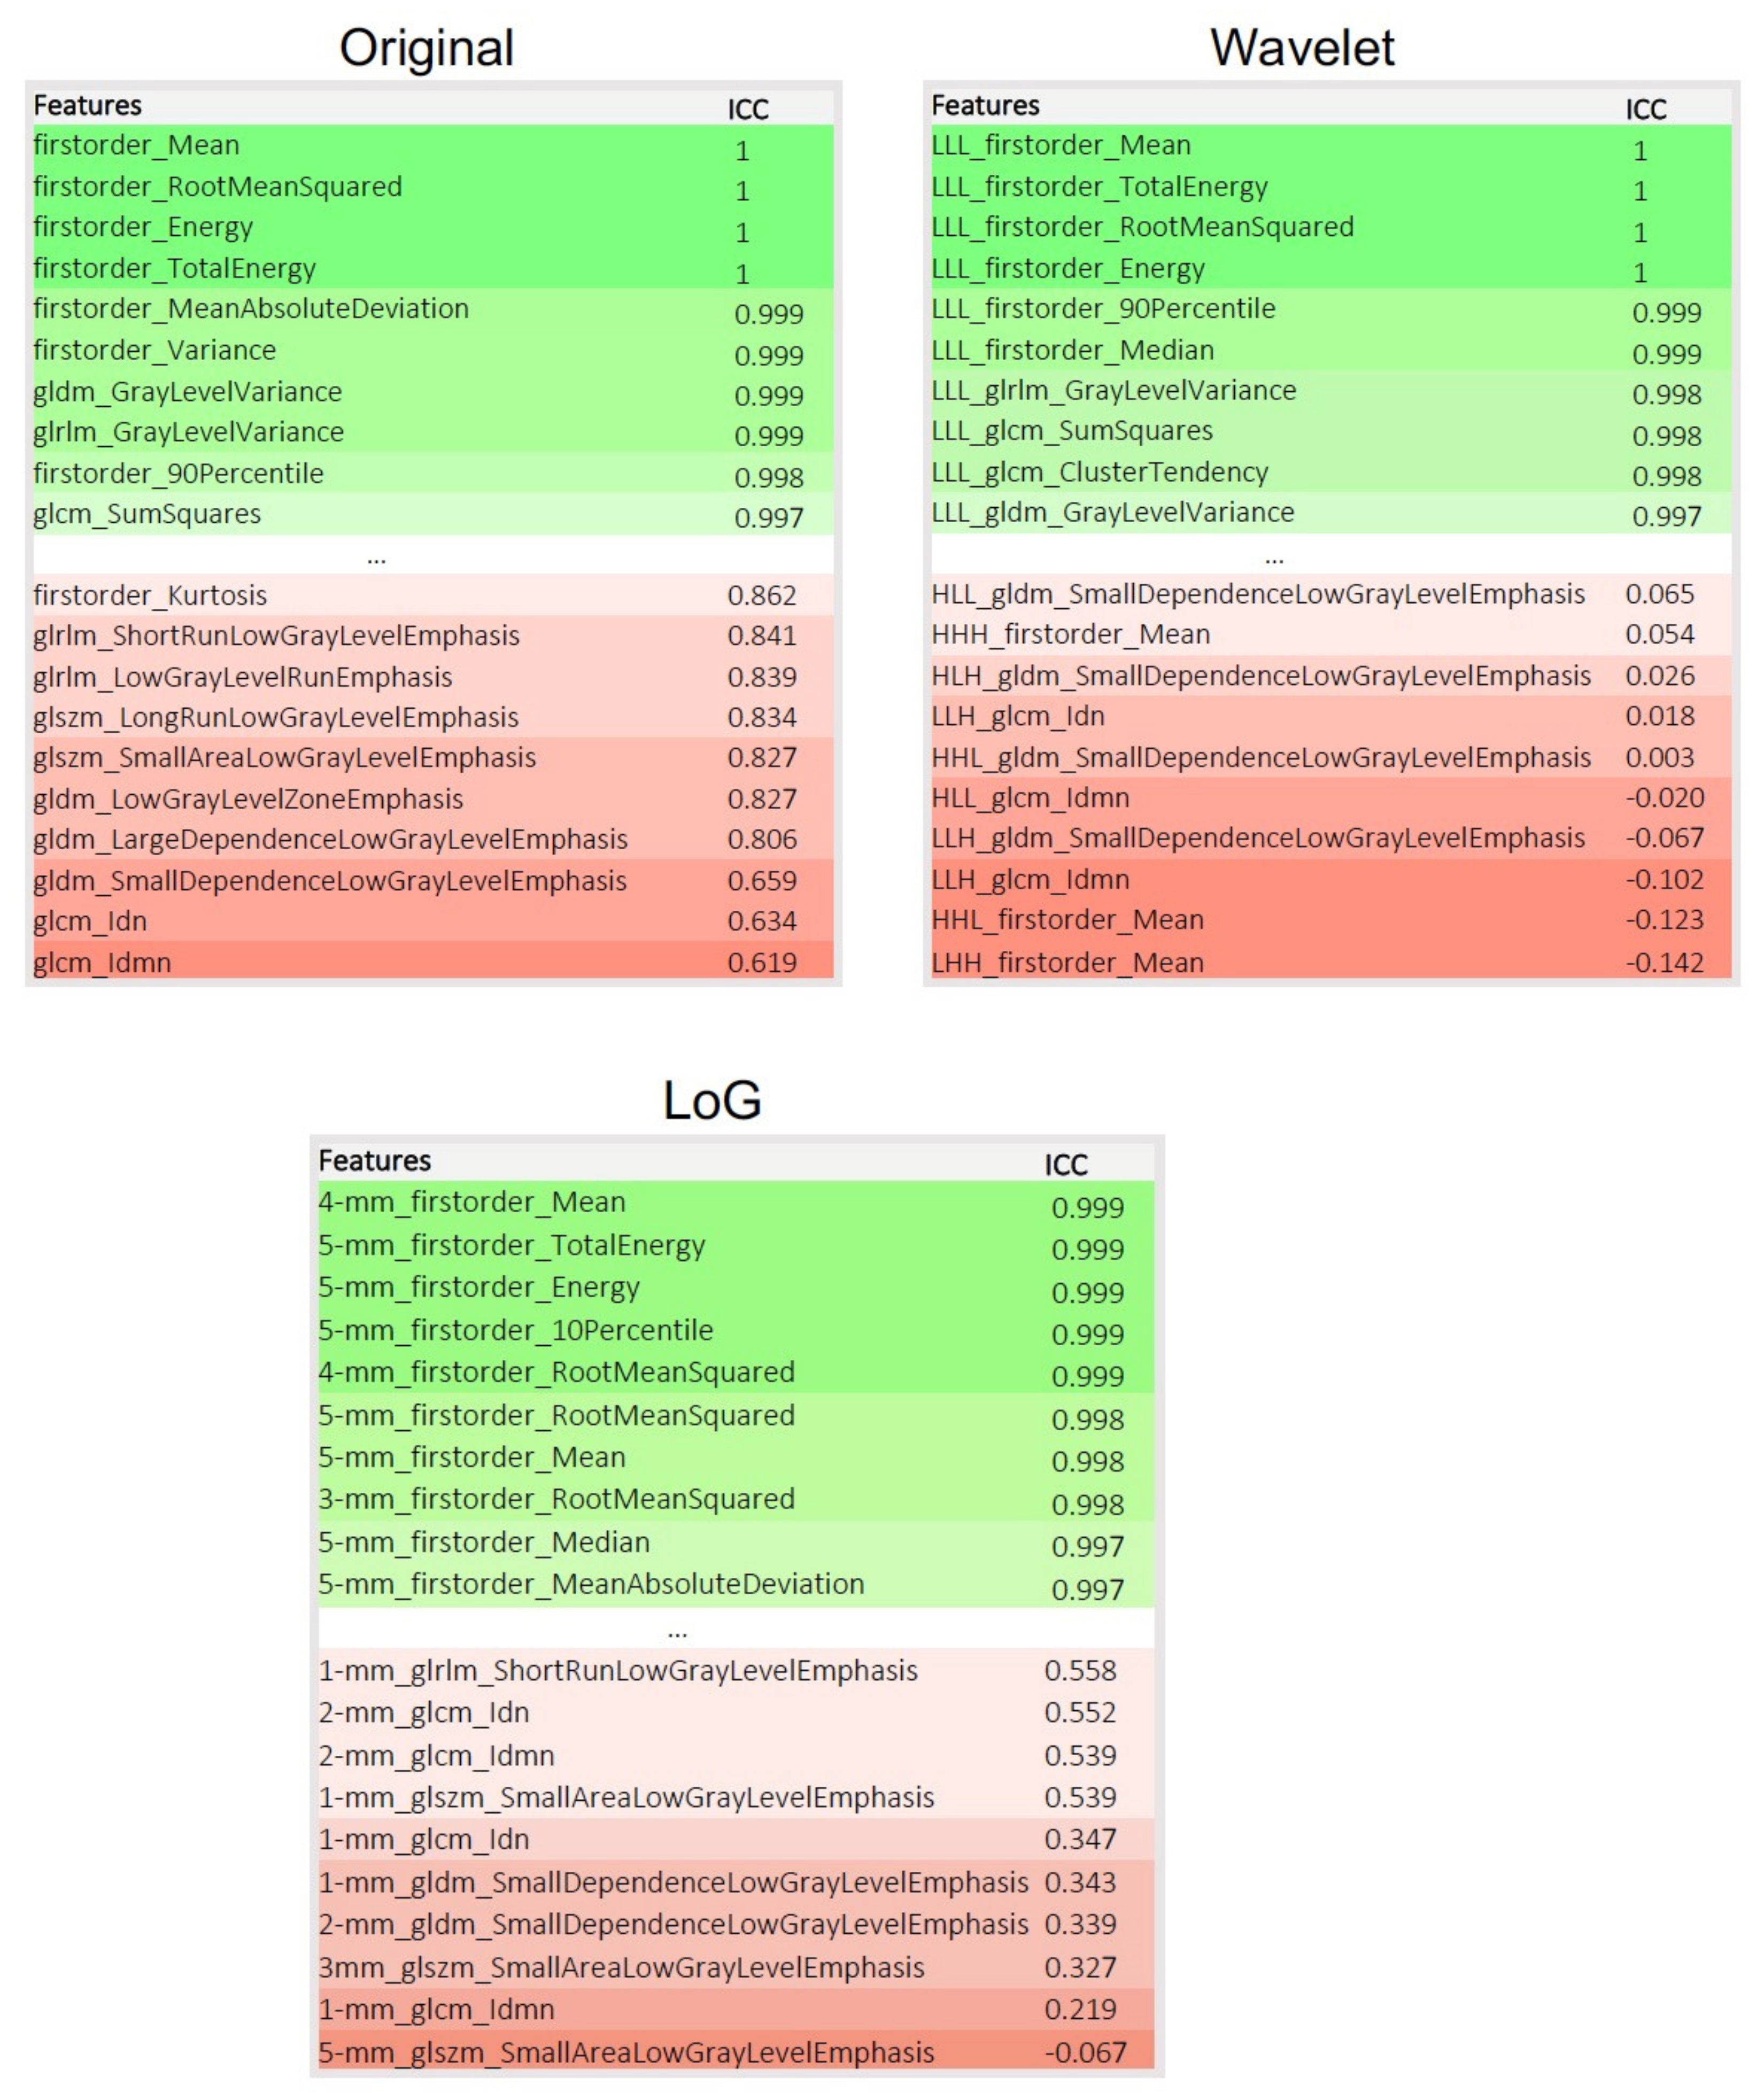
2.7. Statistical Analysis
3. Results
4. Discussion
5. Conclusions
Author Contributions
Funding
Institutional Review Board Statement
Informed Consent Statement
Data Availability Statement
Acknowledgments
Conflicts of Interest
References
- Zwanenburg, A. Radiomics in nuclear medicine: Robustness, reproducibility, standardization, and how to avoid data analysis traps and replication crisis. Eur. J. Nucl. Med. Mol. Imaging 2019, 46, 2638–2655. [Google Scholar] [CrossRef] [PubMed]
- Van Timmeren, J.E.; Leijenaar, R.T.H.; van Elmpt, W.; Wang, J.; Zhang, Z.; Dekker, A.; Lambin, P. Test-Retest Data for Radiomics Feature Stability Analysis: Generalizable or Study-Specific? Tomography 2016, 2, 361–365. [Google Scholar]
- Zwanenburg, A.; Leger, S.; Agolli, L.; Pilz, K.; Troost, E.G.C.; Richter, C.; Lock, S. Assessing robustness of radiomic features by image perturbation. Sci. Rep. 2019, 9, 614. [Google Scholar] [CrossRef] [PubMed] [Green Version]
- Gotz, M.; Maier-Hein, K.H. Optimal Statistical Incorporation of Independent Feature Stability Information into Radiomics Studies. Sci. Rep. 2020, 10, 737. [Google Scholar] [CrossRef] [PubMed]
- Zwanenburg, A.; Vallieres, M.; Abdalah, M.A.; Aerts, H.; Andrearczyk, V.; Apte, A.; Ashrafinia, S.; Bakas, S.; Beukinga, R.J.; Boellaard, R.; et al. The Image Biomarker Standardization Initiative: Standardized Quantitative Radiomics for High-Throughput Image-based Phenotyping. Radiology 2020, 295, 328–338. [Google Scholar] [CrossRef] [Green Version]
- Nioche, C.; Orlhac, F.; Boughdad, S.; Reuze, S.; Goya-Outi, J.; Robert, C.; Pellot-Barakat, C.; Soussan, M.; Frouin, F.; Buvat, I. LIFEx: A Freeware for Radiomic Feature Calculation in Multimodality Imaging to Accelerate Advances in the Characterization of Tumor Heterogeneity. Cancer Res. 2018, 78, 4786–4789. [Google Scholar] [CrossRef] [PubMed] [Green Version]
- Van Griethuysen, J.J.M.; Fedorov, A.; Parmar, C.; Hosny, A.; Aucoin, N.; Narayan, V.; Beets-Tan, R.G.H.; Fillion-Robin, J.C.; Pieper, S.; Aerts, H. Computational Radiomics System to Decode the Radiographic Phenotype. Cancer Res. 2017, 77, e104–e107. [Google Scholar] [CrossRef] [Green Version]
- Gillies, R.J.; Kinahan, P.E.; Hricak, H. Radiomics: Images Are More than Pictures, They Are Data. Radiology 2016, 278, 563–577. [Google Scholar] [CrossRef] [Green Version]
- Zhang, Z.; Yang, J.; Ho, A.; Jiang, W.; Logan, J.; Wang, X.; Brown, P.D.; McGovern, S.L.; Guha-Thakurta, N.; Ferguson, S.D.; et al. A predictive model for distinguishing radiation necrosis from tumour progression after gamma knife radiosurgery based on radiomic features from MR images. Eur. Radiol. 2018, 28, 2255–2263. [Google Scholar] [CrossRef]
- Peng, L.; Parekh, V.; Huang, P.; Lin, D.D.; Sheikh, K.; Baker, B.; Kirschbaum, T.; Silvestri, F.; Son, J.; Robinson, A.; et al. Distinguishing True Progression From Radionecrosis After Stereotactic Radiation Therapy for Brain Metastases With Machine Learning and Radiomics. Int. J. Radiat. Oncol. Biol. Phys. 2018, 102, 1236–1243. [Google Scholar] [CrossRef] [PubMed]
- Lohmann, P.; Kocher, M.; Ceccon, G.; Bauer, E.K.; Stoffels, G.; Viswanathan, S.; Ruge, M.I.; Neumaier, B.; Shah, N.J.; Fink, G.R.; et al. Combined FET PET/MRI radiomics differentiates radiation injury from recurrent brain metastasis. Neuroimage Clin. 2018, 20, 537–542. [Google Scholar] [CrossRef]
- Shofty, B.; Artzi, M.; Ben Bashat, D.; Liberman, G.; Haim, O.; Kashanian, A.; Bokstein, F.; Blumenthal, D.T.; Ram, Z.; Shahar, T. MRI radiomics analysis of molecular alterations in low-grade gliomas. Int. J. Comput. Assist. Radiol. Surg. 2018, 13, 563–571. [Google Scholar] [CrossRef] [PubMed]
- Zhou, H.; Chang, K.; Bai, H.X.; Xiao, B.; Su, C.; Bi, W.L.; Zhang, P.J.; Senders, J.T.; Vallieres, M.; Kavouridis, V.K.; et al. Machine learning reveals multimodal MRI patterns predictive of isocitrate dehydrogenase and 1p/19q status in diffuse low- and high-grade gliomas. J. Neurooncol. 2019, 142, 299–307. [Google Scholar] [CrossRef] [PubMed]
- Lohmann, P.; Lerche, C.; Bauer, E.K.; Steger, J.; Stoffels, G.; Blau, T.; Dunkl, V.; Kocher, M.; Viswanathan, S.; Filss, C.P.; et al. Predicting IDH genotype in gliomas using FET PET radiomics. Sci. Rep. 2018, 8, 13328. [Google Scholar] [CrossRef] [PubMed]
- Shiri, I.; Hajianfar, G.; Sohrabi, A.; Abdollahi, H.; Shayesteh, S.; Geramifar, P.; Zaidi, H.; Oveisi, M.; Rahmim, A. Repeatability of radiomic features in magnetic resonance imaging of glioblastoma: Test-retest and image registration analyses. Med. Phys. 2020, 47, 4265–4280. [Google Scholar] [CrossRef] [PubMed]
- Najjar, A.M.; Johnson, J.M.; Schellingerhout, D. The Emerging Role of Amino Acid PET in Neuro-Oncology. Bioengineering 2018, 5, 104. [Google Scholar] [CrossRef] [PubMed] [Green Version]
- Galldiks, N.; Lohmann, P.; Albert, N.L.; Tonn, J.C.; Langen, K.J. Current status of PET imaging in neuro-oncology. Neuro-Oncol. Adv. 2019, 1, vdz010. [Google Scholar] [CrossRef] [Green Version]
- Langen, K.J.; Galldiks, N.; Hattingen, E.; Shah, N.J. Advances in neuro-oncology imaging. Nat. Rev. Neurol. 2017, 13, 279–289. [Google Scholar] [CrossRef]
- Galldiks, N.; Langen, K.J.; Albert, N.L.; Chamberlain, M.; Soffietti, R.; Kim, M.M.; Law, I.; Le Rhun, E.; Chang, S.; Schwarting, J.; et al. PET imaging in patients with brain metastasis-report of the RANO/PET group. Neuro-Oncology 2019, 21, 585–595. [Google Scholar] [CrossRef]
- Law, I.; Albert, N.L.; Arbizu, J.; Boellaard, R.; Drzezga, A.; Galldiks, N.; la Fougere, C.; Langen, K.J.; Lopci, E.; Lowe, V.; et al. Joint EANM/EANO/RANO practice guidelines/SNMMI procedure standards for imaging of gliomas using PET with radiolabelled amino acids and [(18)F]FDG: Version 1.0. Eur. J. Nucl. Med. Mol. Imaging 2019, 46, 540–557. [Google Scholar] [CrossRef] [Green Version]
- Galldiks, N.; Albert, N.L.; Sommerauer, M.; Grosu, A.L.; Ganswindt, U.; Law, I.; Preusser, M.; Le Rhun, E.; Vogelbaum, M.A.; Zadeh, G.; et al. PET imaging in patients with meningioma-report of the RANO/PET Group. Neuro-Oncology 2017, 19, 1576–1587. [Google Scholar] [CrossRef]
- Albert, N.L.; Weller, M.; Suchorska, B.; Galldiks, N.; Soffietti, R.; Kim, M.M.; la Fougere, C.; Pope, W.; Law, I.; Arbizu, J.; et al. Response Assessment in Neuro-Oncology working group and European Association for Neuro-Oncology recommendations for the clinical use of PET imaging in gliomas. Neuro-Oncology 2016, 18, 1199–1208. [Google Scholar] [CrossRef]
- Pyka, T.; Gempt, J.; Hiob, D.; Ringel, F.; Schlegel, J.; Bette, S.; Wester, H.J.; Meyer, B.; Forster, S. Textural analysis of pre-therapeutic [18F]-FET-PET and its correlation with tumor grade and patient survival in high-grade gliomas. Eur. J. Nucl. Med. Mol. Imaging 2016, 43, 133–141. [Google Scholar] [CrossRef] [PubMed]
- Lohmann, P.; Elahmadawy, M.A.; Gutsche, R.; Werner, J.-M.; Bauer, E.K.; Ceccon, G.; Kocher, M.; Lerche, C.W.; Rapp, M.; Fink, G.R.; et al. FET PET Radiomics for Differentiating Pseudoprogression from Early Tumor Progression in Glioma Patients Post-Chemoradiation. Cancers 2020, 12, 3835. [Google Scholar] [CrossRef] [PubMed]
- Debus, C.; Waltenberger, M.; Floca, R.; Afshar-Oromieh, A.; Bougatf, N.; Adeberg, S.; Heiland, S.; Bendszus, M.; Wick, W.; Rieken, S.; et al. Impact of (18)F-FET PET on Target Volume Definition and Tumor Progression of Recurrent High Grade Glioma Treated with Carbon-Ion Radiotherapy. Sci. Rep. 2018, 8, 7201. [Google Scholar] [CrossRef] [PubMed]
- Dissaux, G.; Dissaux, B.; Kabbaj, O.E.; Gujral, D.M.; Pradier, O.; Salaun, P.Y.; Seizeur, R.; Bourhis, D.; Ben Salem, D.; Querellou, S.; et al. Radiotherapy target volume definition in newly diagnosed high grade glioma using (18)F-FET PET imaging and multiparametric perfusion MRI: A prospective study (IMAGG). Radiother. Oncol. 2020, 150, 164–171. [Google Scholar] [CrossRef]
- Fleischmann, D.F.; Unterrainer, M.; Schon, R.; Corradini, S.; Maihofer, C.; Bartenstein, P.; Belka, C.; Albert, N.L.; Niyazi, M. Margin reduction in radiotherapy for glioblastoma through (18)F-fluoroethyltyrosine PET?—A recurrence pattern analysis. Radiother. Oncol. 2020, 145, 49–55. [Google Scholar] [CrossRef] [PubMed]
- Hayes, A.R.; Jayamanne, D.; Hsiao, E.; Schembri, G.P.; Bailey, D.L.; Roach, P.J.; Khasraw, M.; Newey, A.; Wheeler, H.R.; Back, M. Utilizing 18F-fluoroethyltyrosine (FET) positron emission tomography (PET) to define suspected nonenhancing tumor for radiation therapy planning of glioblastoma. Pract. Radiat. Oncol. 2018, 8, 230–238. [Google Scholar] [CrossRef]
- Louis, D.N.; Perry, A.; Reifenberger, G.; von Deimling, A.; Figarella-Branger, D.; Cavenee, W.K.; Ohgaki, H.; Wiestler, O.D.; Kleihues, P.; Ellison, D.W. The 2016 World Health Organization Classification of Tumors of the Central Nervous System: A summary. Acta Neuropathol. 2016, 131, 803–820. [Google Scholar] [CrossRef] [PubMed] [Green Version]
- Capper, D.; Zentgraf, H.; Balss, J.; Hartmann, C.; von Deimling, A. Monoclonal antibody specific for IDH1 R132H mutation. Acta Neuropathol. 2009, 118, 599–601. [Google Scholar] [CrossRef]
- Capper, D.; Weissert, S.; Balss, J.; Habel, A.; Meyer, J.; Jager, D.; Ackermann, U.; Tessmer, C.; Korshunov, A.; Zentgraf, H.; et al. Characterization of R132H mutation-specific IDH1 antibody binding in brain tumors. Brain Pathol. 2010, 20, 245–254. [Google Scholar] [CrossRef]
- Woehrer, A.; Sander, P.; Haberler, C.; Kern, S.; Maier, H.; Preusser, M.; Hartmann, C.; Kros, J.M.; Hainfellner, J.A. Research Committee of the European Confederation of Neuropathological, S. FISH-based detection of 1p 19q codeletion in oligodendroglial tumors: Procedures and protocols for neuropathological practice—A publication under the auspices of the Research Committee of the European Confederation of Neuropathological Societies (Euro-CNS). Clin. Neuropathol. 2011, 30, 47–55. [Google Scholar]
- Hamacher, K.; Coenen, H.H. Efficient routine production of the 18F-labelled amino acid O-2-18F fluoroethyl-L-tyrosine. Appl. Radiat. Isot. 2002, 57, 853–856. [Google Scholar] [CrossRef]
- Langen, K.J.; Bartenstein, P.; Boecker, H.; Brust, P.; Coenen, H.H.; Drzezga, A.; Grunwald, F.; Krause, B.J.; Kuwert, T.; Sabri, O.; et al. German guidelines for brain tumour imaging by PET and SPECT using labelled amino acids. Nuklearmedizin 2011, 50, 167–173. [Google Scholar] [PubMed]
- Caldeira, L.; Kops, E.R.; Yun, S.D.; Da Silva, N.; Mauler, J.; Weirich, C.; Scheins, J.; Herzog, H.; Tellmann, L.; Lohmann, P.; et al. The Julich Experience With Simultaneous 3T MR-BrainPET: Methods and Technology. IEEE Trans. Radiat. Plasma Med. Sci. 2019, 3, 352–362. [Google Scholar] [CrossRef]
- Rota Kops, E.; Herzog, H. Template based attenuation correction for PET in MR-PET scanners. In Proceedings of the IEEE Nuclear Science Symposium Conference, Dresden, Germany, 19–25 October 2008; pp. 3786–3789. [Google Scholar] [CrossRef]
- Pauleit, D.; Floeth, F.; Hamacher, K.; Riemenschneider, M.J.; Reifenberger, G.; Muller, H.W.; Zilles, K.; Coenen, H.H.; Langen, K.J. O-(2-[18F]fluoroethyl)-L-tyrosine PET combined with MRI improves the diagnostic assessment of cerebral gliomas. Brain 2005, 128, 678–687. [Google Scholar] [CrossRef] [PubMed] [Green Version]
- Leijenaar, R.T.; Nalbantov, G.; Carvalho, S.; van Elmpt, W.J.; Troost, E.G.; Boellaard, R.; Aerts, H.J.; Gillies, R.J.; Lambin, P. The effect of SUV discretization in quantitative FDG-PET Radiomics: The need for standardized methodology in tumor texture analysis. Sci. Rep. 2015, 5, 11075. [Google Scholar] [CrossRef]
- Shrout, P.E.; Fleiss, J.L. Intraclass correlations: Uses in assessing rater reliability. Psychol. Bull. 1979, 86, 420–428. [Google Scholar] [CrossRef]
- McGraw, K.O.; Wong, S.P. Forming Inferences About Some Intraclass Correlation Coefficients. Psychol. Methods 1996, 1, 30–46. [Google Scholar] [CrossRef]
- Koo, T.K.; Li, M.Y. A Guideline of Selecting and Reporting Intraclass Correlation Coefficients for Reliability Research. J. Chiropr. Med. 2016, 15, 155–163. [Google Scholar] [CrossRef] [Green Version]
- Vallat, R. Pingouin: Statistics in Python. J. Open Source Softw. 2018, 3, 1026. [Google Scholar] [CrossRef]
- Virtanen, P.; Gommers, R.; Oliphant, T.E.; Haberland, M.; Reddy, T.; Cournapeau, D.; Burovski, E.; Peterson, P.; Weckesser, W.; Bright, J.; et al. SciPy 1.0: Fundamental algorithms for scientific computing in Python. Nat. Methods 2020, 17, 261–272. [Google Scholar] [CrossRef] [Green Version]
- Fiset, S.; Welch, M.L.; Weiss, J.; Pintilie, M.; Conway, J.L.; Milosevic, M.; Fyles, A.; Traverso, A.; Jaffray, D.; Metser, U.; et al. Repeatability and reproducibility of MRI-based radiomic features in cervical cancer. Radiother. Oncol. 2019, 135, 107–114. [Google Scholar] [CrossRef]
- Klaassen, R.; Bennink, R.J.; van Tienhoven, G.; Bijlsma, M.F.; Besselink, M.G.; van Berge Henegouwen, M.I.; Wilmink, J.W.; Nederveen, A.J.; Windhorst, A.D.; Hulshof, M.C.; et al. Feasibility and repeatability of PET with the hypoxia tracer [(18)F]HX4 in oesophageal and pancreatic cancer. Radiother. Oncol. 2015, 116, 94–99. [Google Scholar] [CrossRef] [Green Version]
- Traverso, A.; Wee, L.; Dekker, A.; Gillies, R. Repeatability and Reproducibility of Radiomic Features: A Systematic Review. Int. J. Radiat. Oncol. Biol. Phys. 2018, 102, 1143–1158. [Google Scholar] [CrossRef] [Green Version]
- Pfaehler, E.; Beukinga, R.J.; de Jong, J.R.; Slart, R.; Slump, C.H.; Dierckx, R.; Boellaard, R. Repeatability of (18) F-FDG PET radiomic features: A phantom study to explore sensitivity to image reconstruction settings, noise, and delineation method. Med. Phys. 2019, 46, 665–678. [Google Scholar] [CrossRef] [PubMed] [Green Version]
- Doumou, G.; Siddique, M.; Tsoumpas, C.; Goh, V.; Cook, G.J. The precision of textural analysis in (18)F-FDG-PET scans of oesophageal cancer. Eur. Radiol. 2015, 25, 2805–2812. [Google Scholar] [CrossRef] [PubMed] [Green Version]
- Saha, G.B. Basics of PET Imaging: Physics, Chemistry and Regulations; Springer: Cham, Switzerland, 2010; p. 314. [Google Scholar]
- Razifar, P.; Sandstrom, M.; Schnieder, H.; Langstrom, B.; Maripuu, E.; Bengtsson, E.; Bergstrom, M. Noise correlation in PET, CT, SPECT and PET/CT data evaluated using autocorrelation function: A phantom study on data, reconstructed using FBP and OSEM. BMC Med. Imaging 2005, 5, 5. [Google Scholar] [CrossRef] [PubMed] [Green Version]
- Oliver, J.A.; Budzevich, M.; Hunt, D.; Moros, E.G.; Latifi, K.; Dilling, T.J.; Feygelman, V.; Zhang, G. Sensitivity of Image Features to Noise in Conventional and Respiratory-Gated PET/CT Images of Lung Cancer: Uncorrelated Noise Effects. Technol. Cancer Res. Treat. 2017, 16, 595–608. [Google Scholar] [CrossRef] [Green Version]


| Patients (Total) | 50 |
|---|---|
| Gender | |
| Female | 17 |
| Male | 33 |
| Age | |
| Mean ± standard deviation | 50 ± 15 years |
| Range | 21–82 years |
| Tumor type | |
| Glioblastoma (IDH wt/mut) | 24/2 |
| AA III (IDH wt/mut) | 4/11 |
| A II (IDH wt/mut) | 2/2 |
| AO III | 5 |
| IDH genotype | |
| Wildtype | 30 |
| Mutant | 20 |
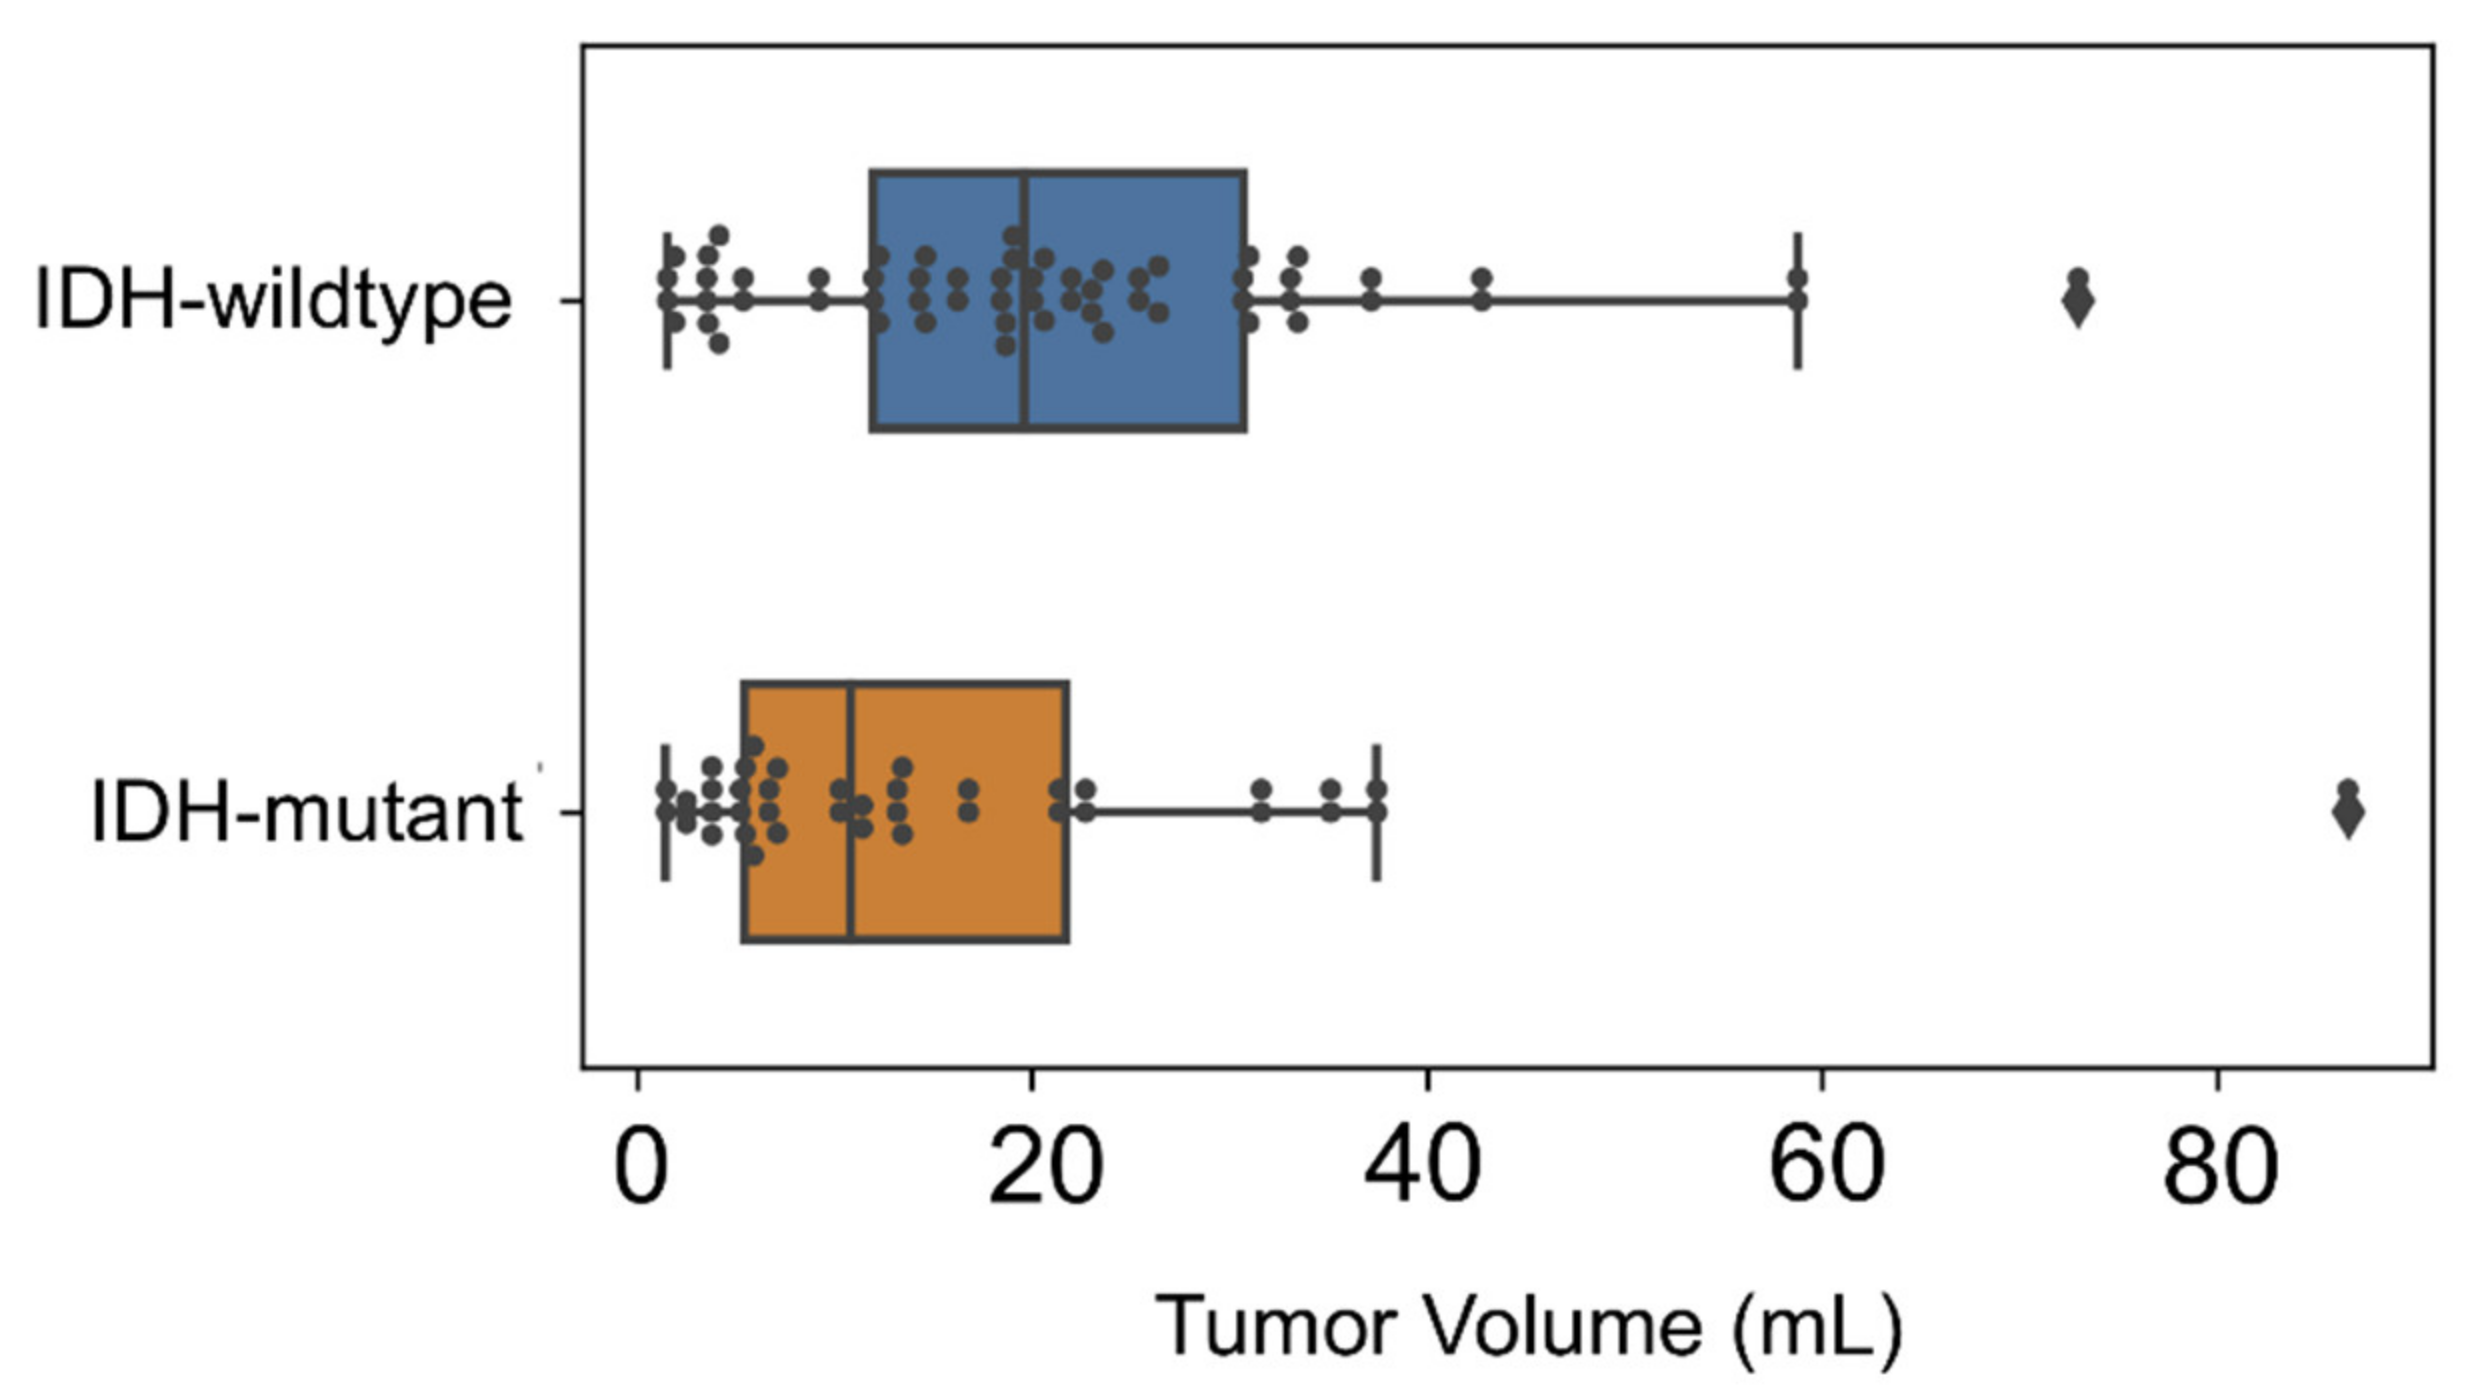
| Tumor volume | |
| Median | 16.2 mL |
| Mean | 12.5 mL |
| Range | 1.4–85.2 mL |
Publisher’s Note: MDPI stays neutral with regard to jurisdictional claims in published maps and institutional affiliations. |
© 2021 by the authors. Licensee MDPI, Basel, Switzerland. This article is an open access article distributed under the terms and conditions of the Creative Commons Attribution (CC BY) license (http://creativecommons.org/licenses/by/4.0/).
Share and Cite
Gutsche, R.; Scheins, J.; Kocher, M.; Bousabarah, K.; Fink, G.R.; Shah, N.J.; Langen, K.-J.; Galldiks, N.; Lohmann, P. Evaluation of FET PET Radiomics Feature Repeatability in Glioma Patients. Cancers 2021, 13, 647. https://doi.org/10.3390/cancers13040647
Gutsche R, Scheins J, Kocher M, Bousabarah K, Fink GR, Shah NJ, Langen K-J, Galldiks N, Lohmann P. Evaluation of FET PET Radiomics Feature Repeatability in Glioma Patients. Cancers. 2021; 13(4):647. https://doi.org/10.3390/cancers13040647
Chicago/Turabian StyleGutsche, Robin, Jürgen Scheins, Martin Kocher, Khaled Bousabarah, Gereon R. Fink, Nadim J. Shah, Karl-Josef Langen, Norbert Galldiks, and Philipp Lohmann. 2021. "Evaluation of FET PET Radiomics Feature Repeatability in Glioma Patients" Cancers 13, no. 4: 647. https://doi.org/10.3390/cancers13040647
APA StyleGutsche, R., Scheins, J., Kocher, M., Bousabarah, K., Fink, G. R., Shah, N. J., Langen, K.-J., Galldiks, N., & Lohmann, P. (2021). Evaluation of FET PET Radiomics Feature Repeatability in Glioma Patients. Cancers, 13(4), 647. https://doi.org/10.3390/cancers13040647