
Prediction of Neoadjuvant Chemoradiotherapy Response in Rectal Cancer with Metric Learning Using Pretreatment 18F-Fluorodeoxyglucose Positron Emission Tomography

 ,
,
Abstract
:Simple Summary
Abstract
1. Introduction
2. Methods
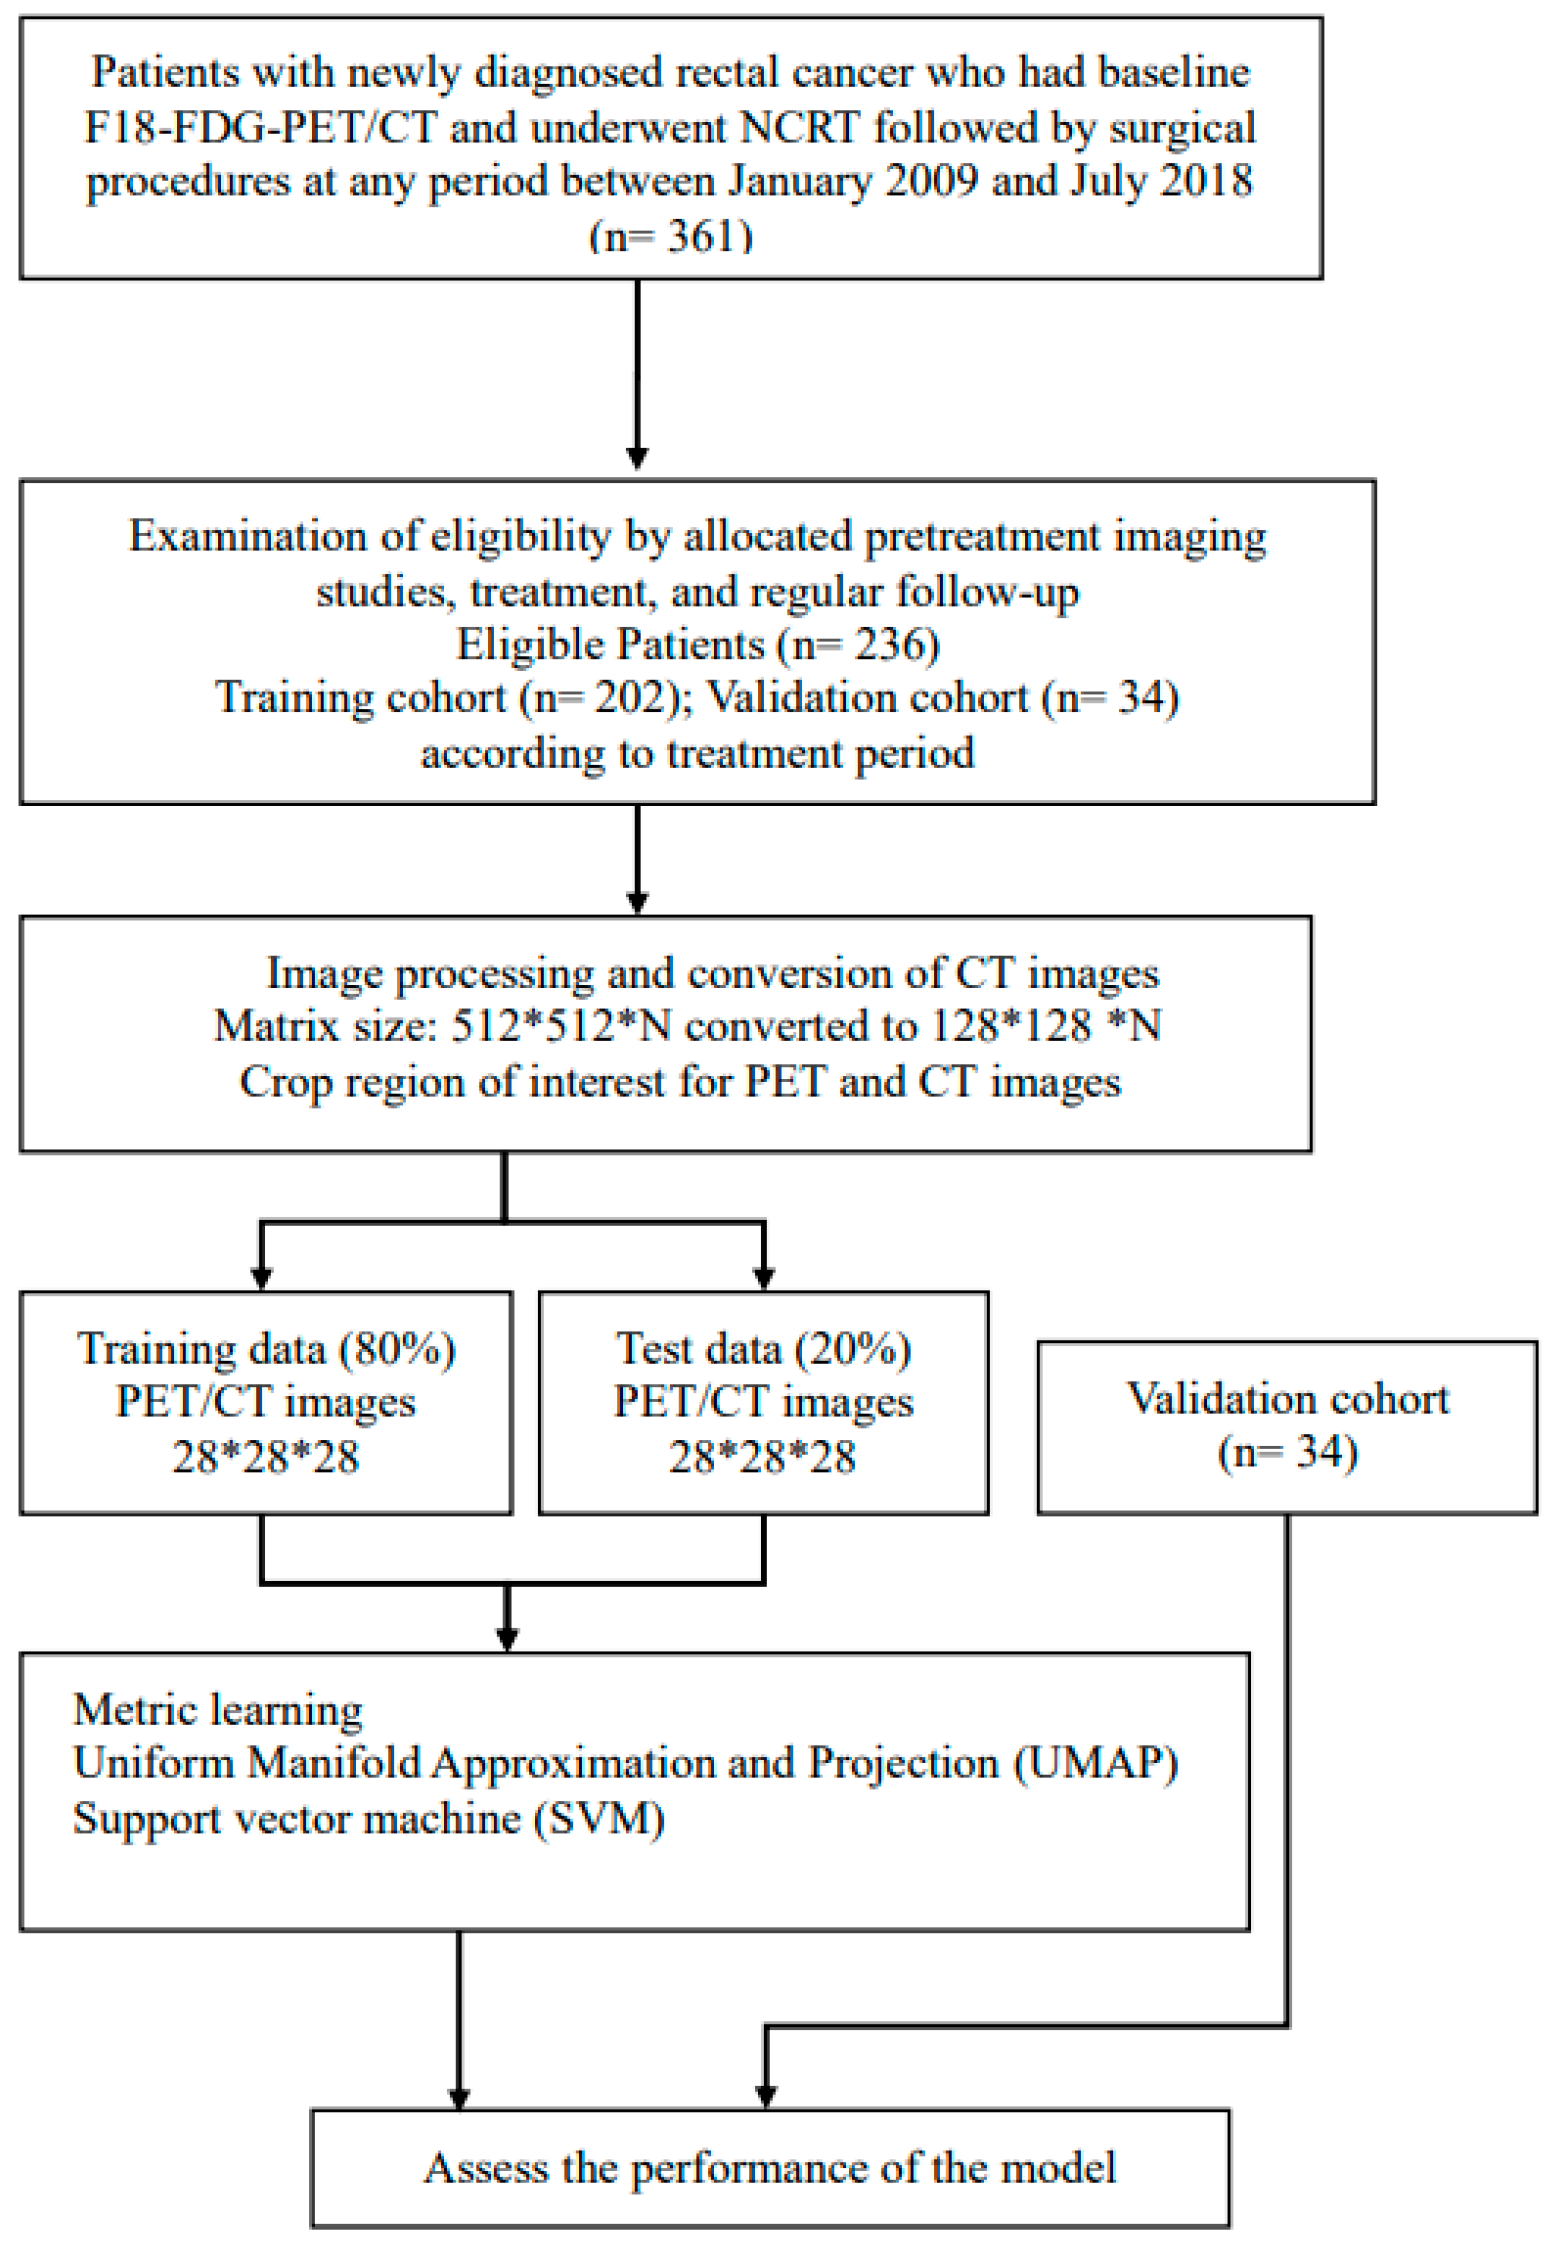
2.1. Study Design and Patient Population
2.2. NCRT
2.3. Pathological Assessment
2.4. PET/CT Image Acquisition
2.5. Data Pre-Processing
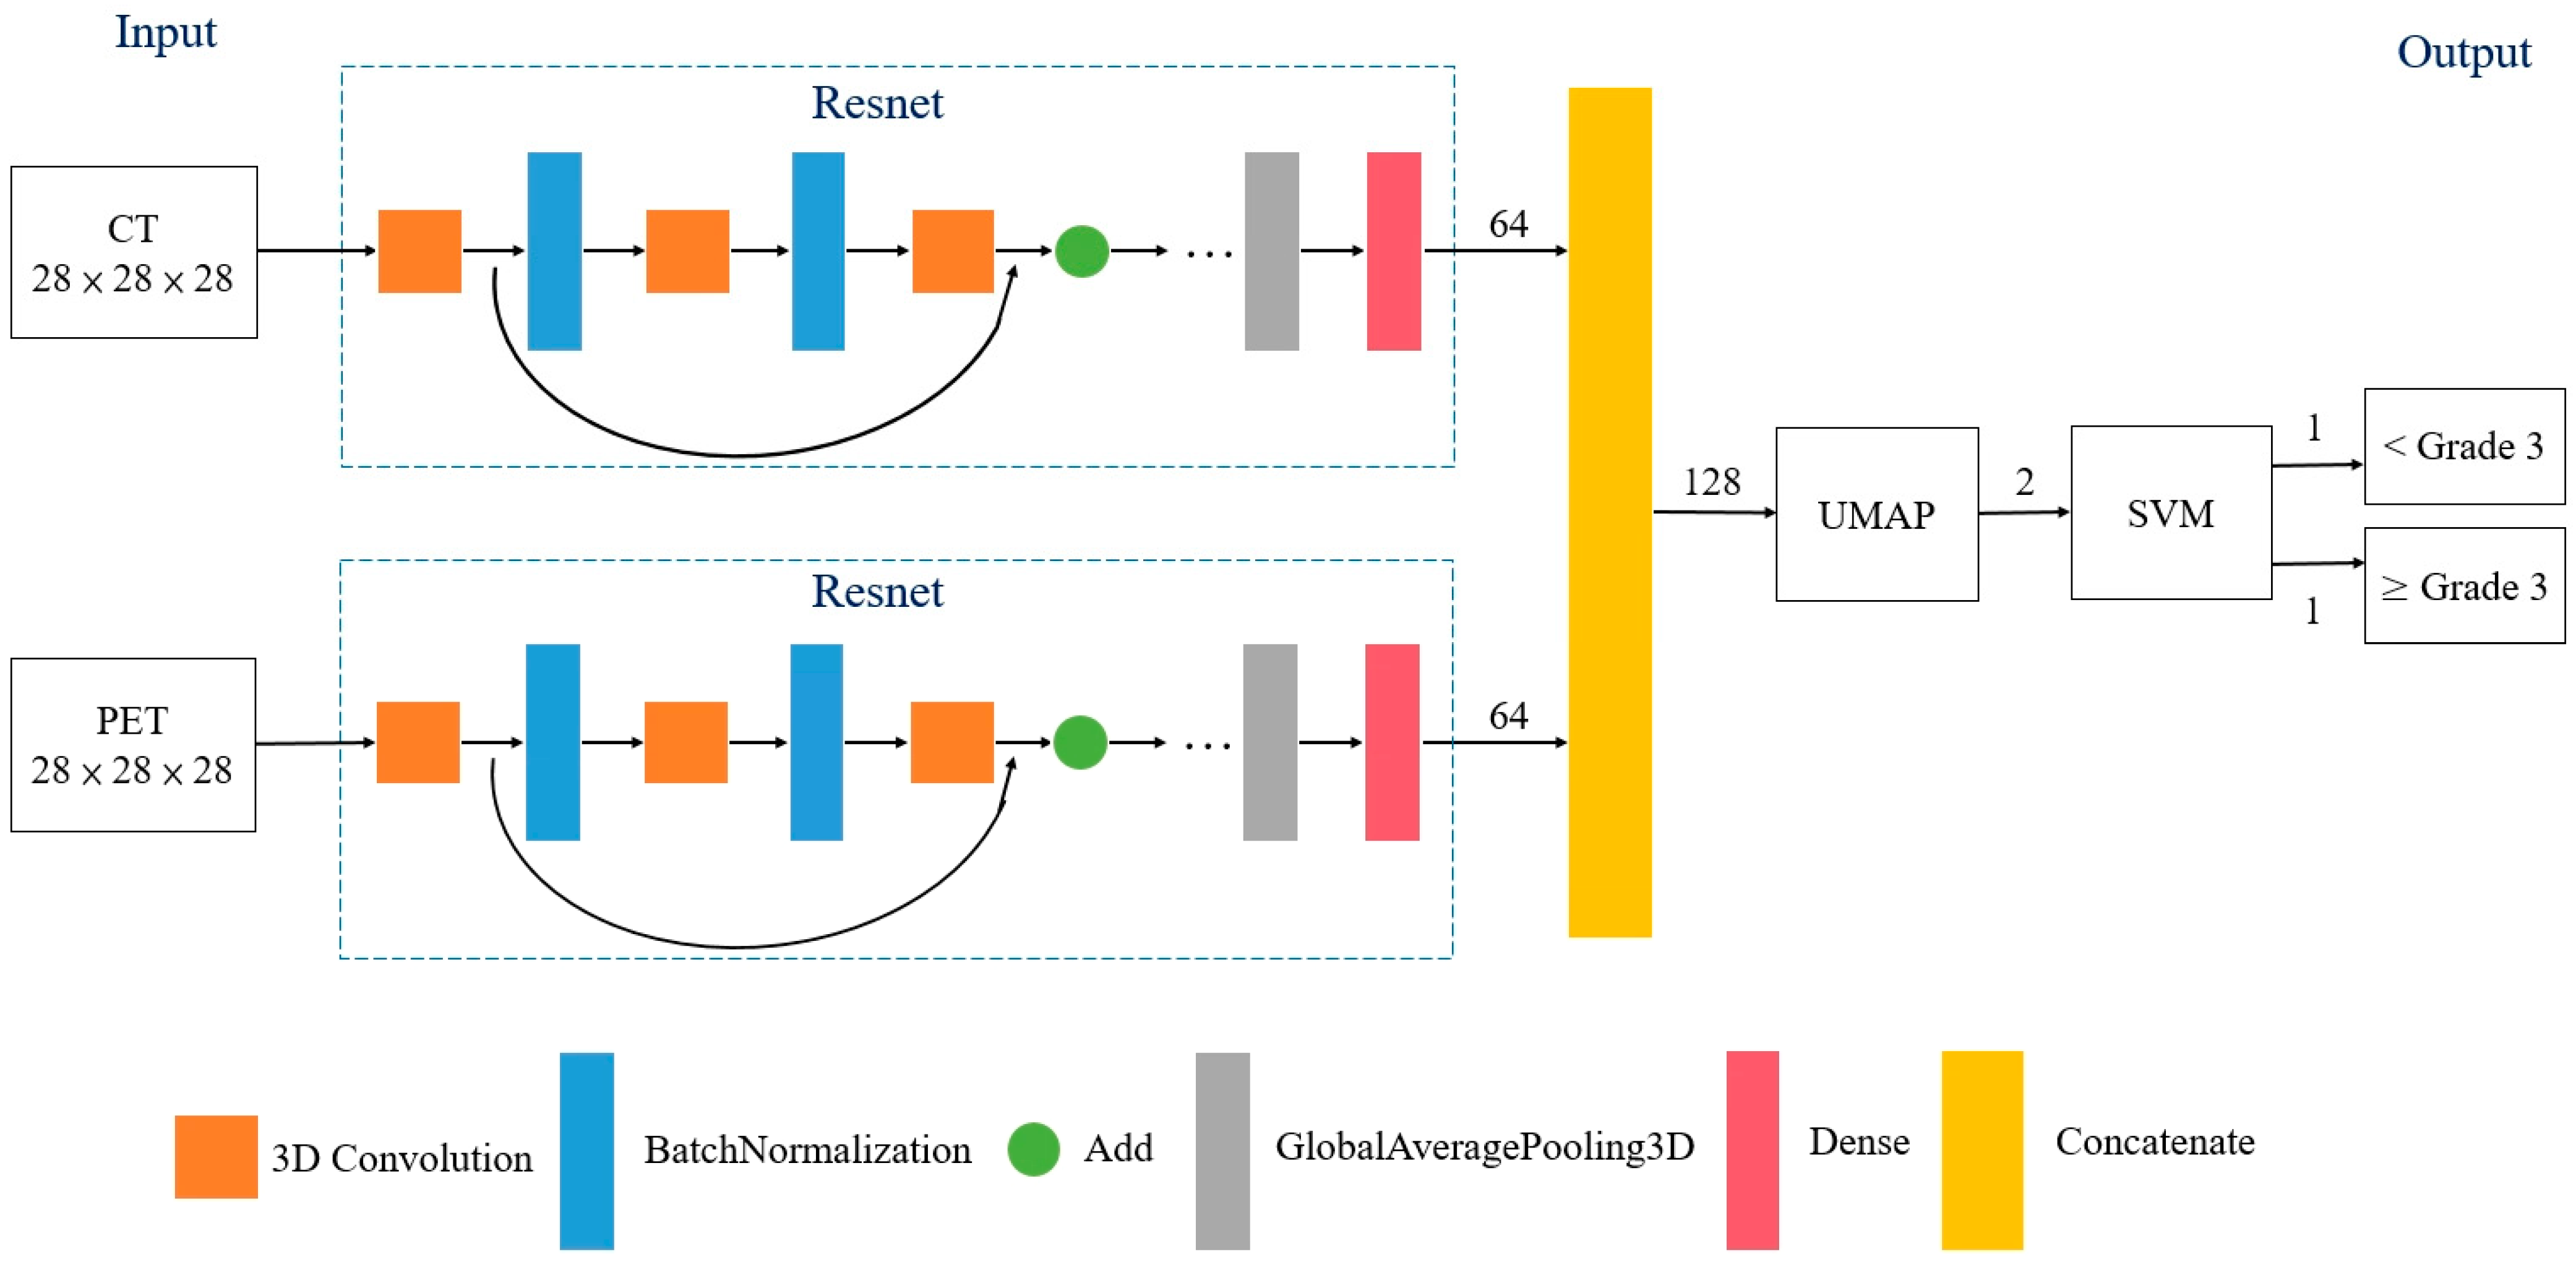
2.6. Metric Learning
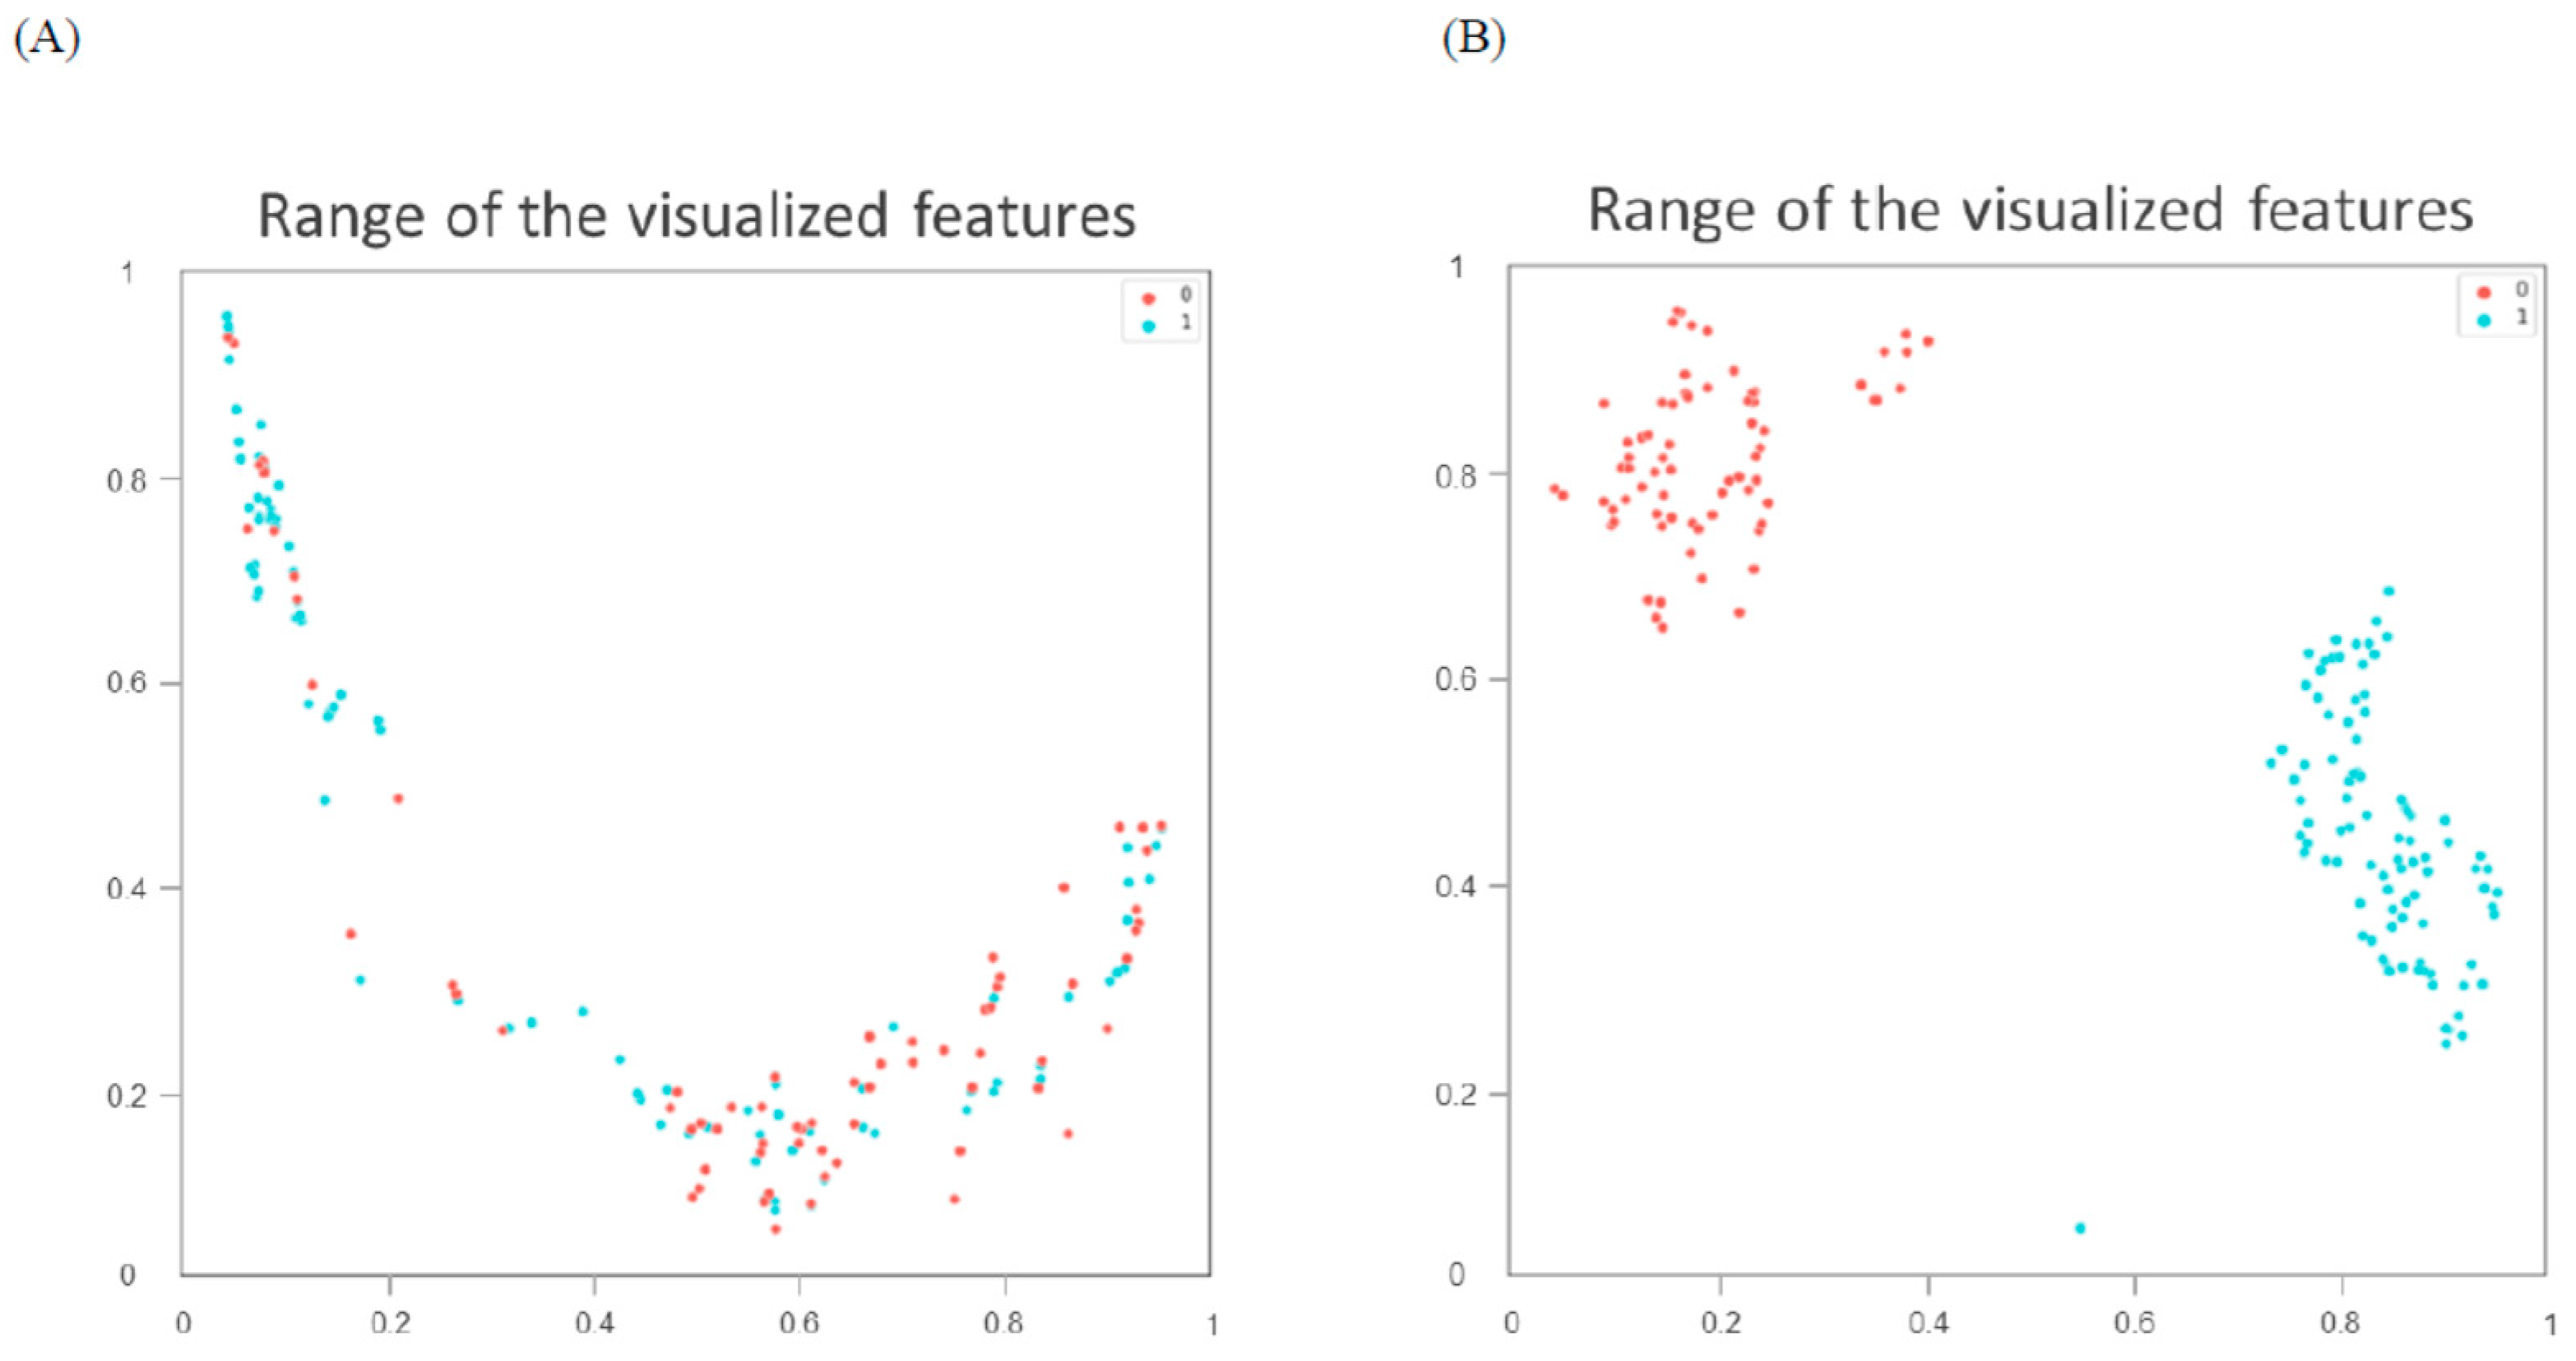
2.7. Uniform Manifold Approximation and Projection for Dimensionality Reduction
2.8. Support Vector Machine
2.9. Statistical Analysis
3. Results
3.1. Patient Characteristics
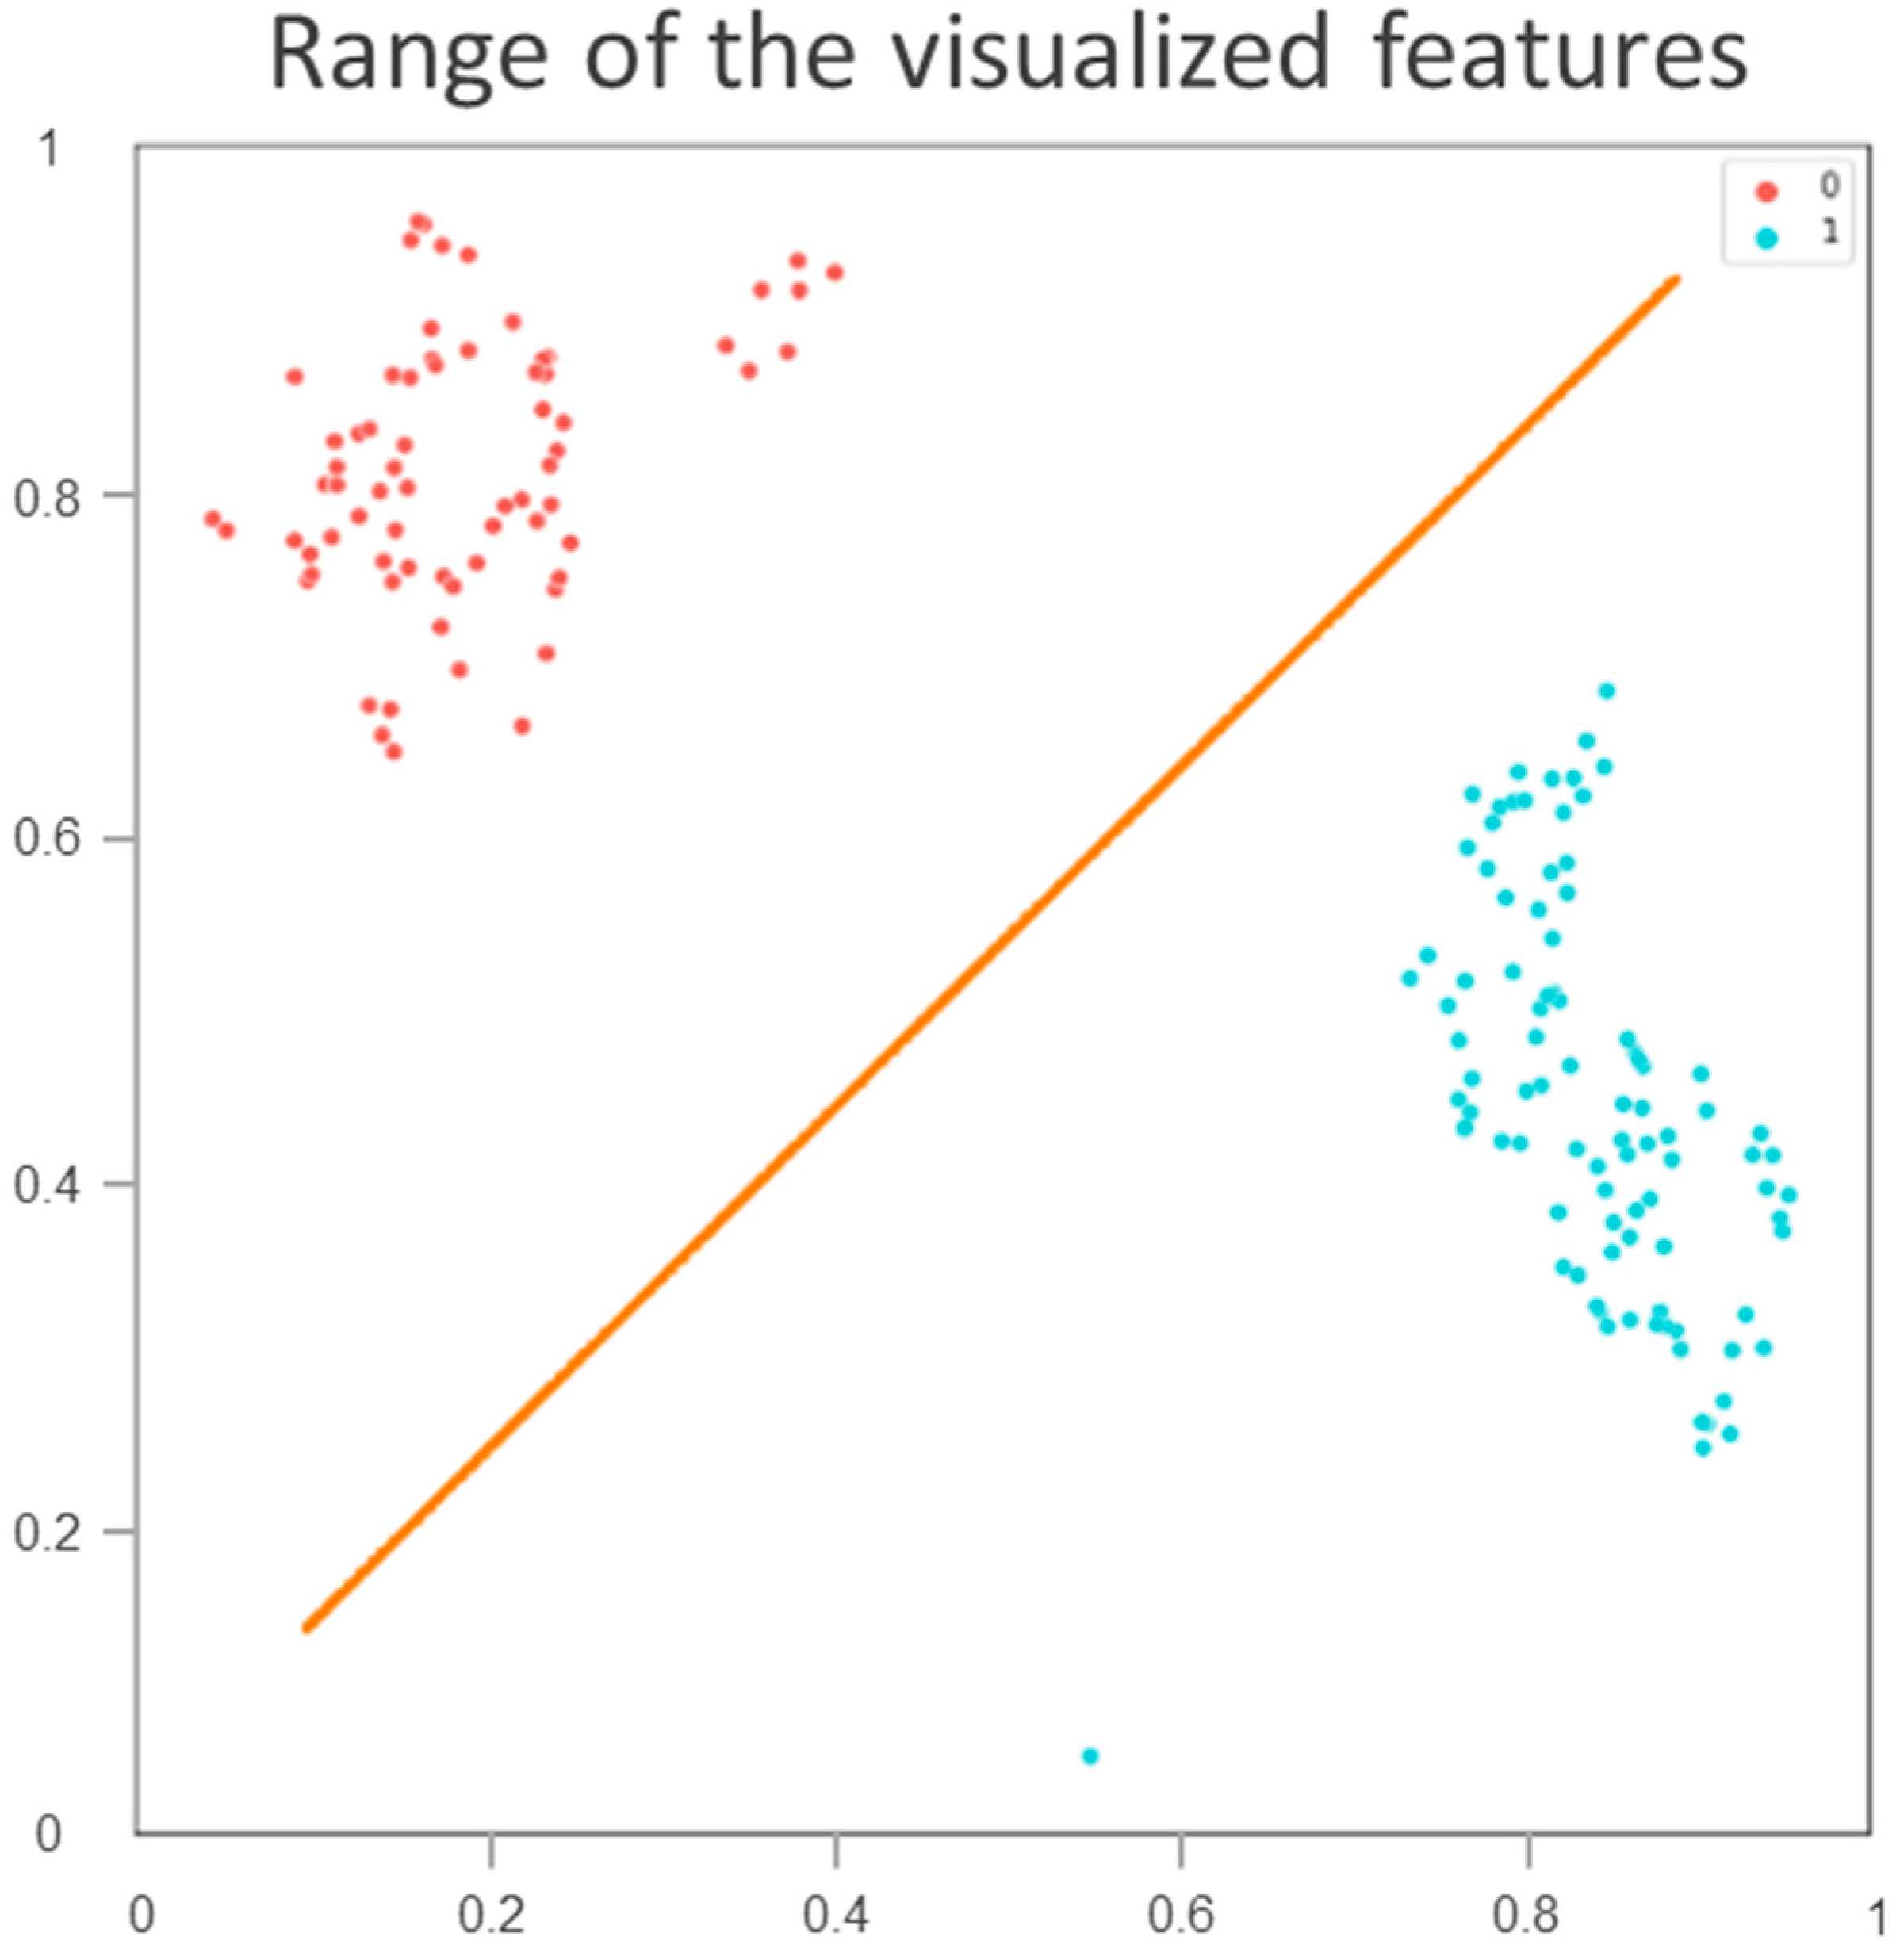
3.2. Partitioning of Patients in the Training Cohort
3.3. Image-Based Prediction
3.4. Validation and Comparison
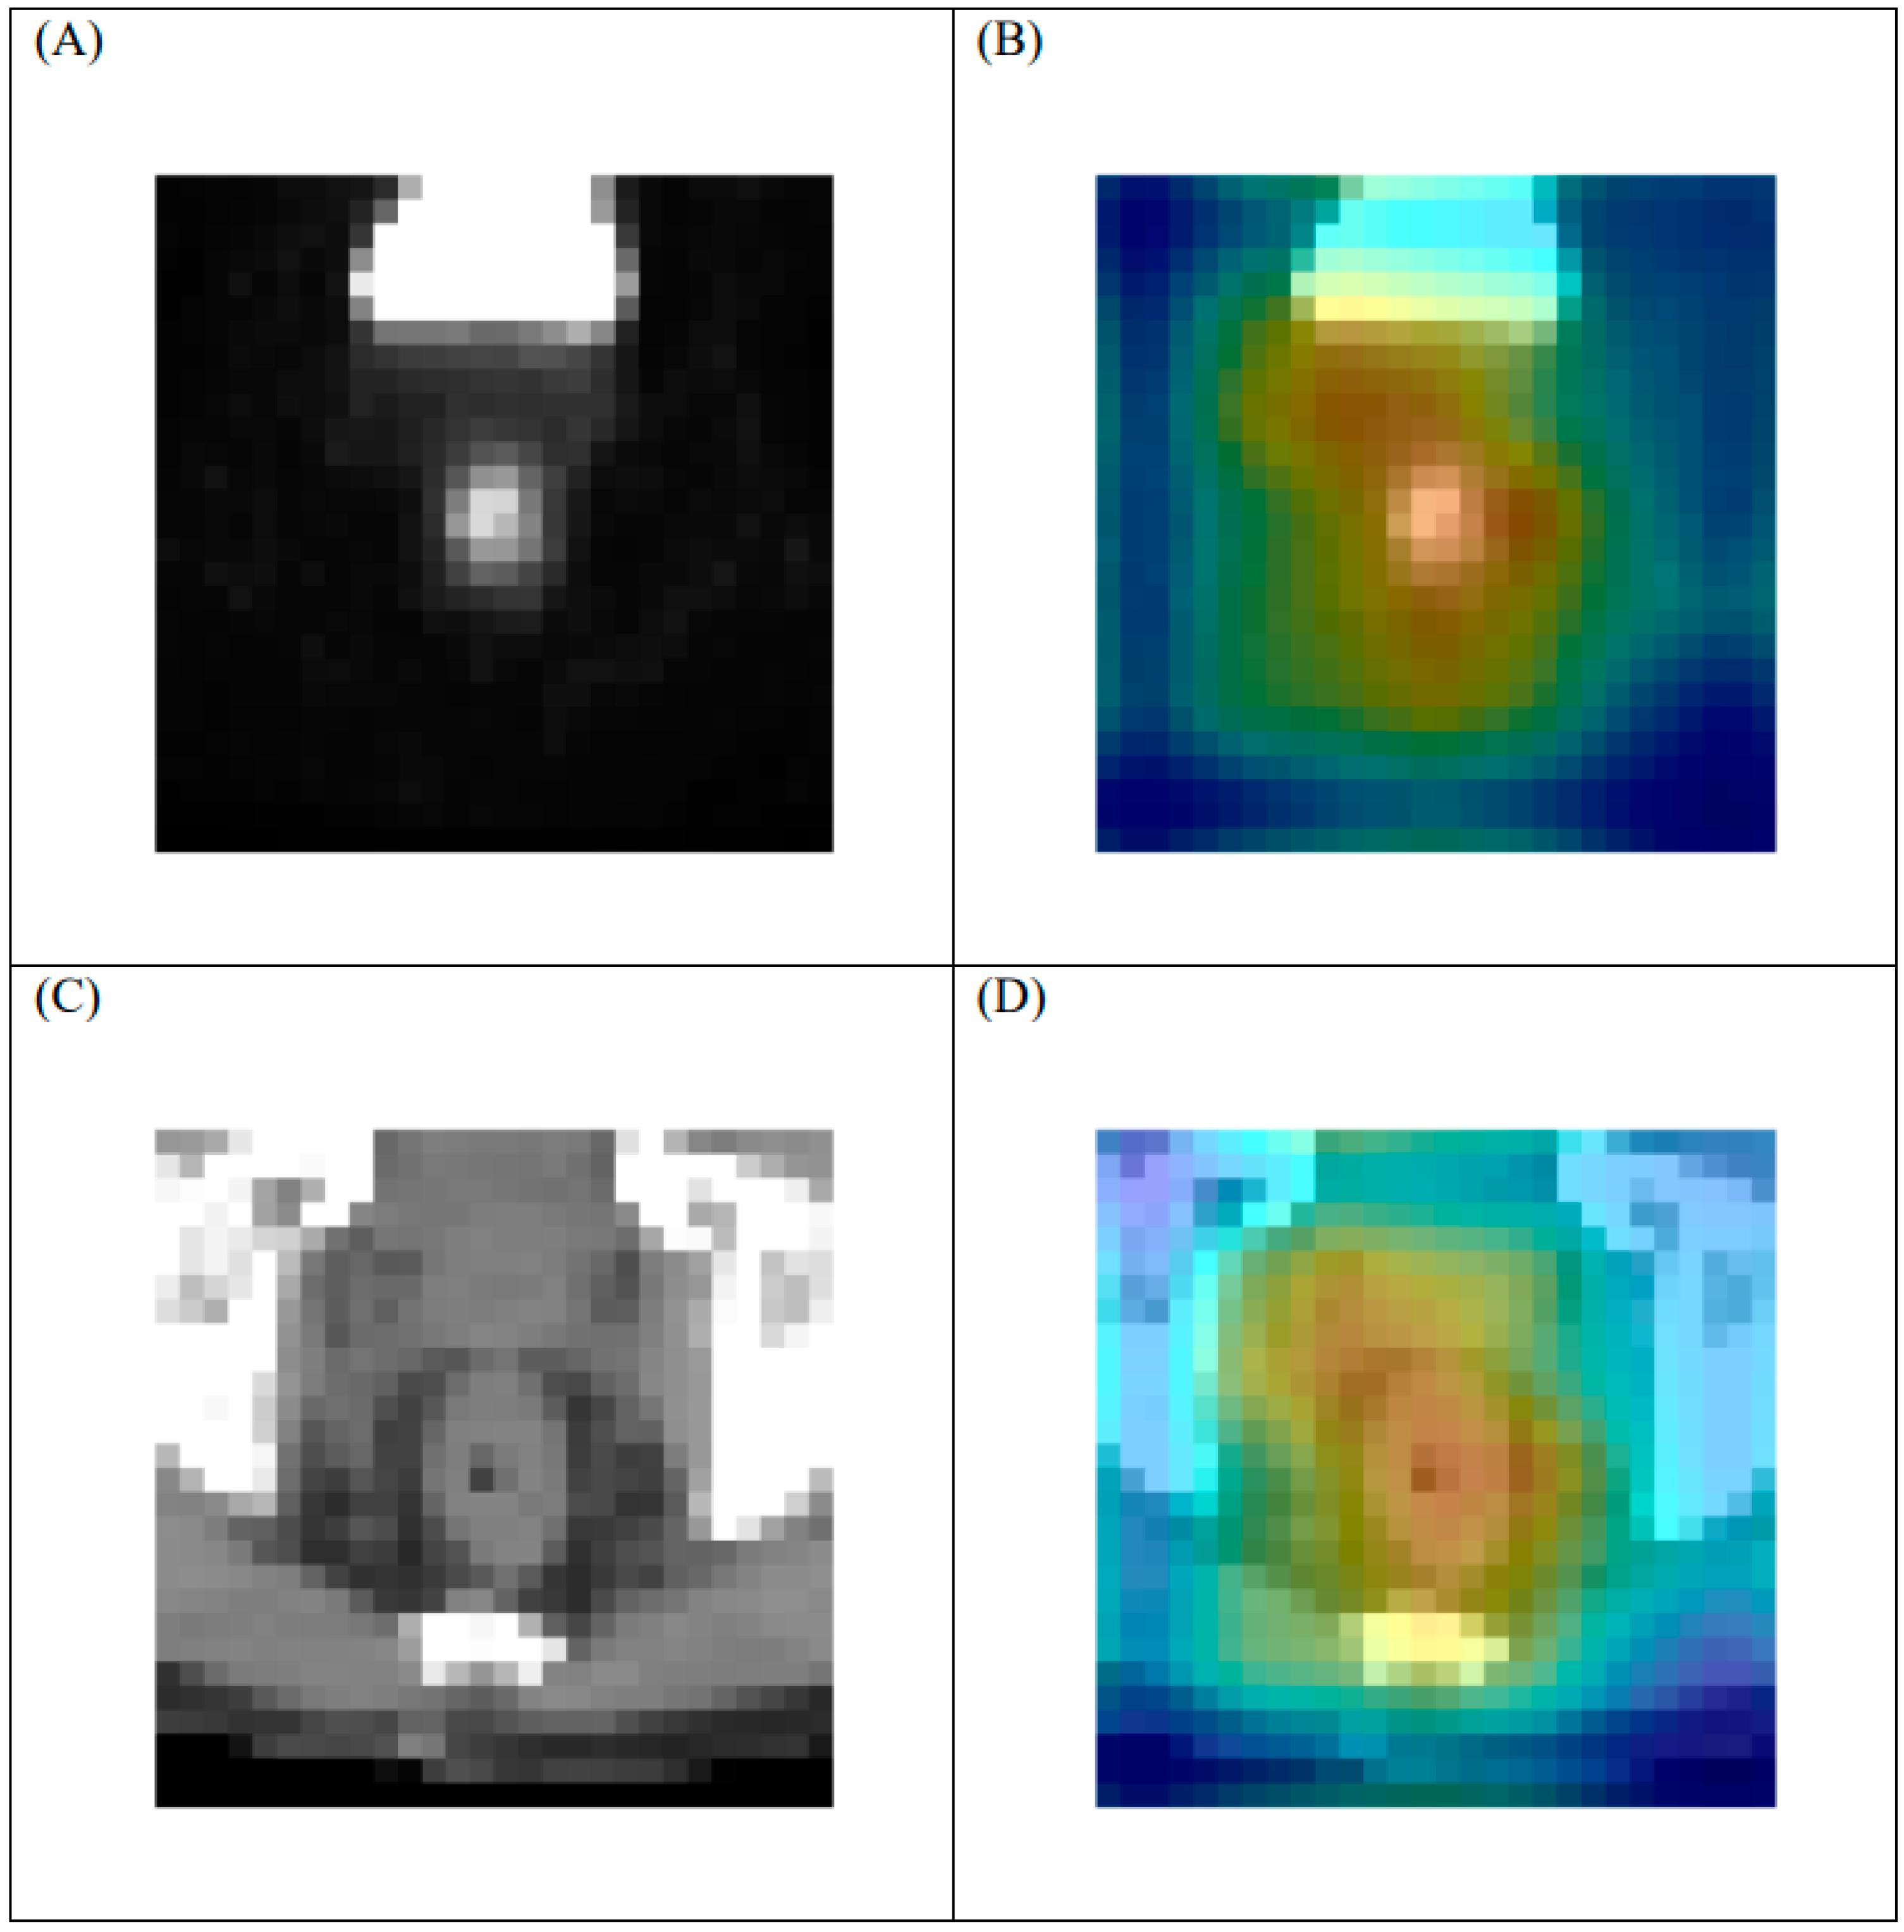
3.5. Heat Map
4. Discussion
5. Conclusions
Author Contributions
Funding
Institutional Review Board Statement
Informed Consent Statement
Data Availability Statement
Conflicts of Interest
Abbreviations
Appendix A

Appendix B

| AUC (95% CI) | Sensitivity (95% CI) | Specificity (95% CI) | Accuracy (95% CI) | |||||
|---|---|---|---|---|---|---|---|---|
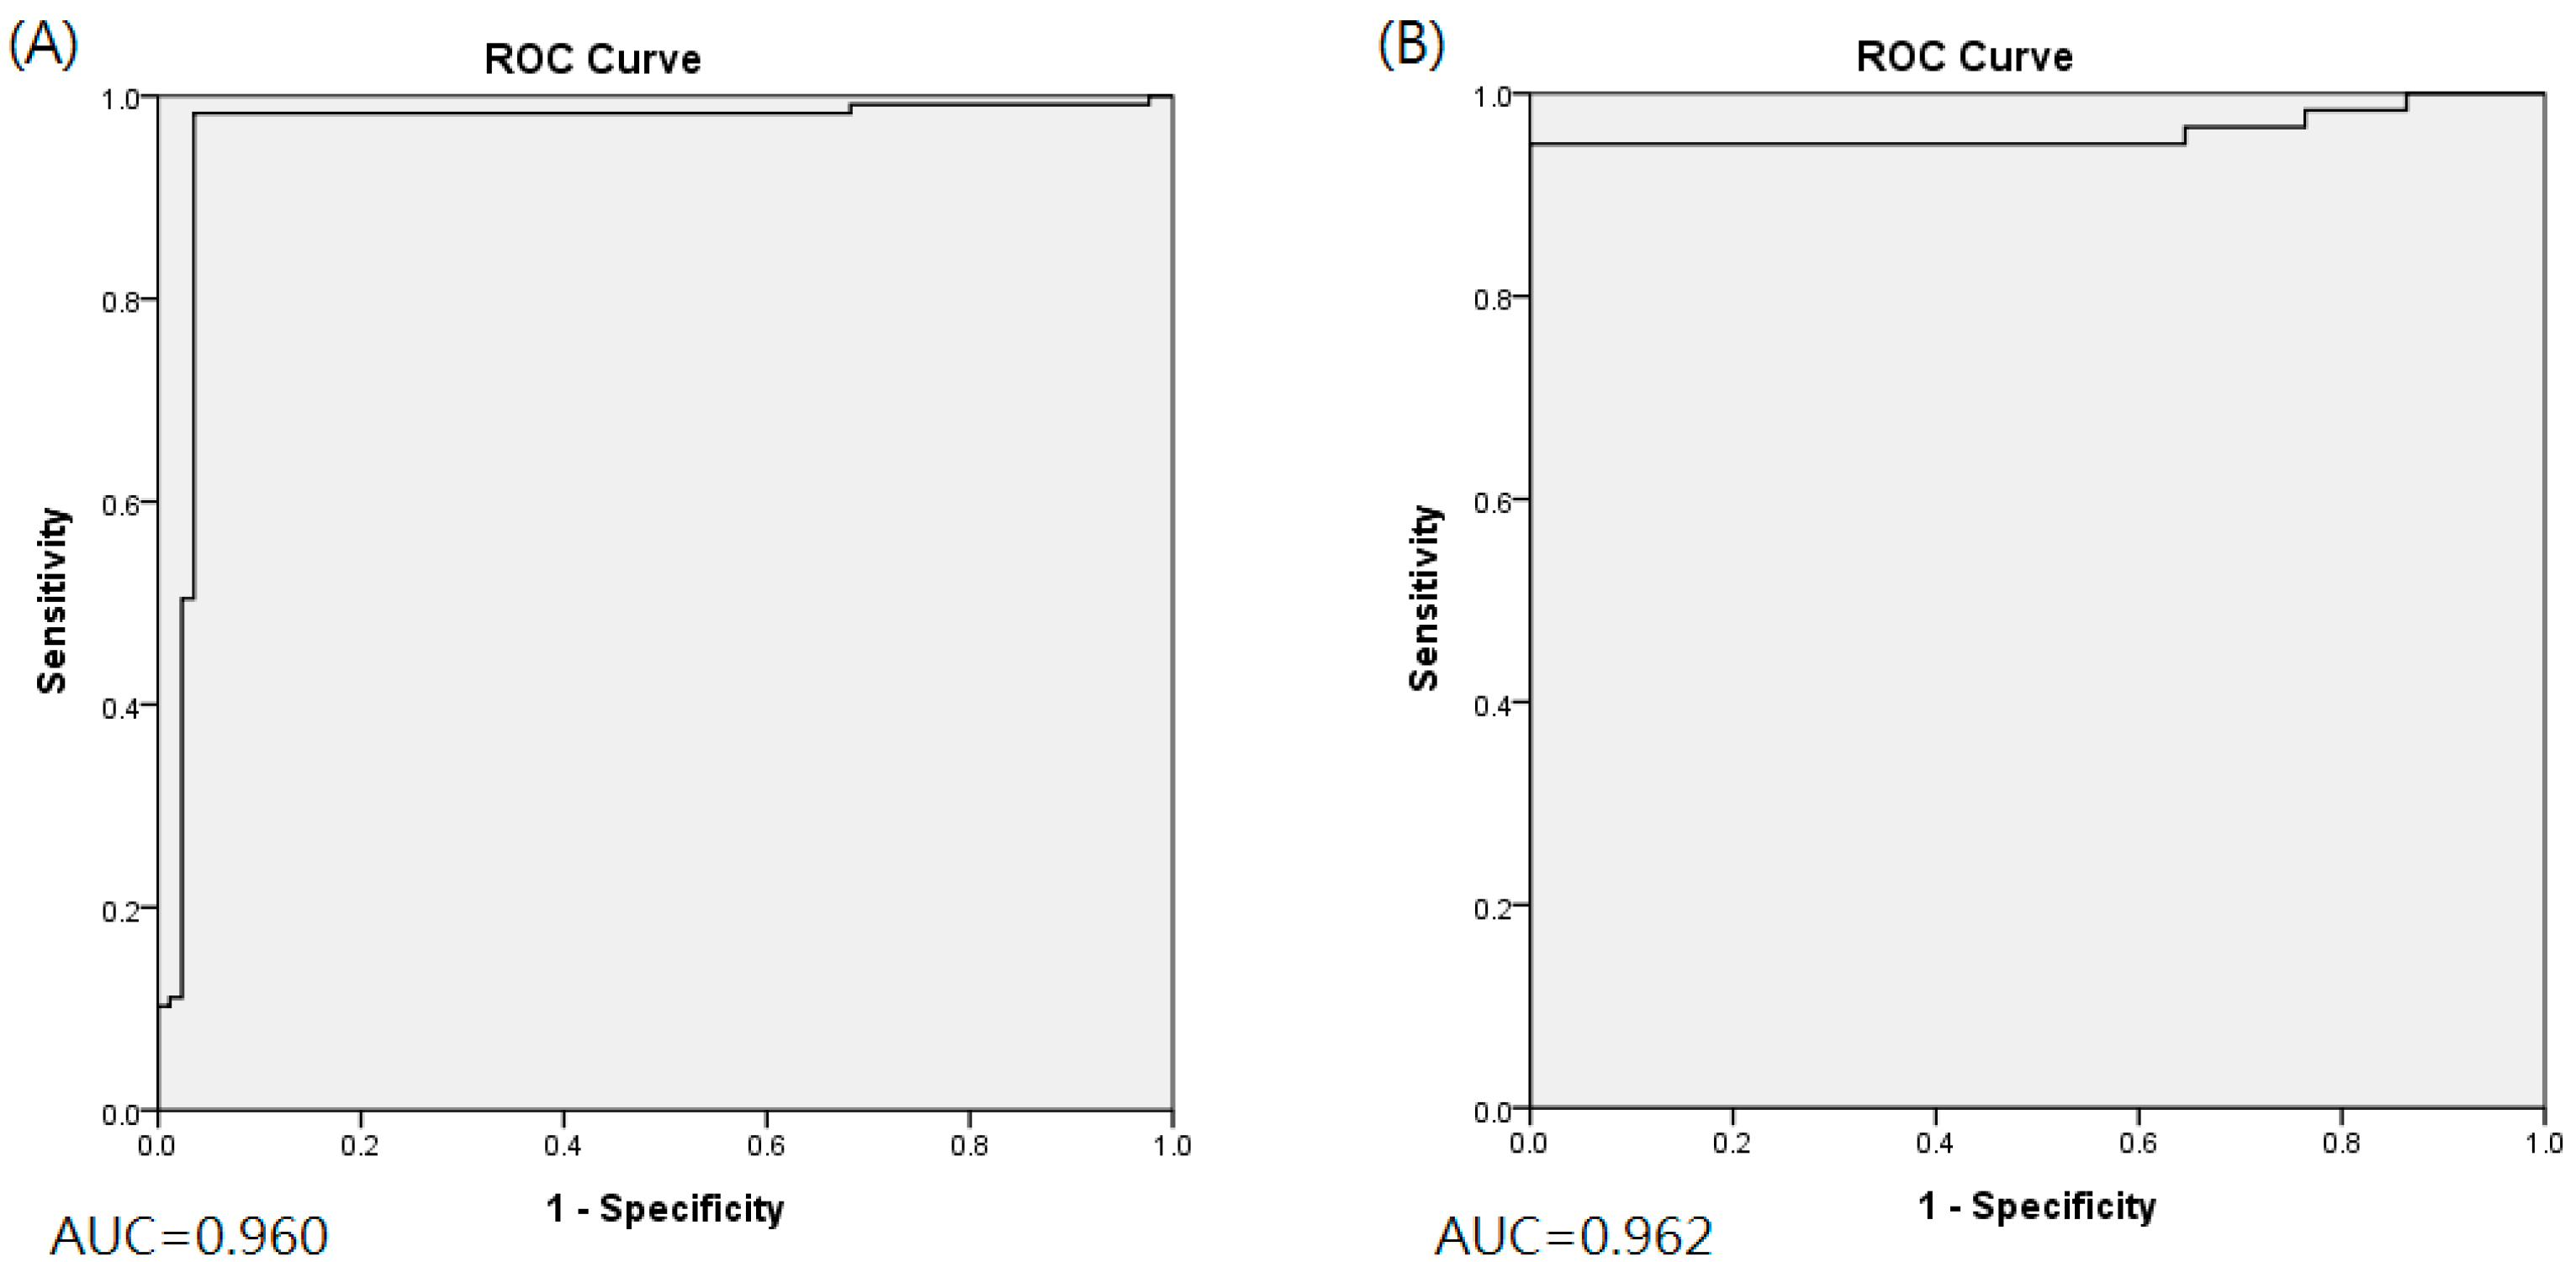
| Training cohort (n = 202) | 0.960 (0.951–0.993) | 0.983 (0.962–1.000) | 0.965 (0.936–0.993) | 0.975 (0.960–0.991) | ||||
| Validation cohort (n = 34) | 0.962 (0.935–0.999) | 0.950 (0.910–0.990) | 1.000 (1.000–1.000) | 0.982 (0.969–0.997) | ||||
| Fold_1 | Fold_2 | Fold_3 | Fold_4 | Fold_5 | Summation | |||
| Training AUC | 0.993 | 0.944 | 1.000 | 0.964 | 0.959 | 0.972 | ||
| Validation AUC | 1.000 | 0.92 | 0.939 | 0.977 | 1.000 | 0.967 | ||
| Training accuracy | 0.976 | 0.976 | 1.000 | 0.950 | 0.975 | 0.975 | ||
| Validation accuracy | 1.000 | 0.971 | 0.971 | 0.971 | 1.000 | 0.982 | ||
| Training sensitivity | 1.000 | 1.000 | 1.000 | 0.957 | 0.957 | 0.983 | ||
| Validation sensitivity | 1.000 | 0.917 | 0.917 | 0.917 | 1.000 | 0.950 | ||
| Training specificity | 0.941 | 0.941 | 1.000 | 0.941 | 1.000 | 0.965 | ||
| Validation specificity | 1.000 | 1.000 | 1.000 | 1.000 | 1.000 | 1.000 | ||
| AUC (95% CI) | Sensitivity (95% CI) | Specificity (95% CI) | Accuracy (95% CI) | |||||
|---|---|---|---|---|---|---|---|---|
| Training cohort (n = 202) | 0.618 (0.576–0.704) | 0.630 (0.449–0.810) | 0.588 (0.349–0.827) | 0.614 (0.591–0.636) | ||||
| Validation cohort (n = 34) | 0.606 (0.511–0.704) | 0.467 (0.238–0.695) | 0.745 (0.645–0.846) | 0.647 (0.611–0.683) | ||||
| Fold_1 | Fold_2 | Fold_3 | Fold_4 | Fold_5 | Summation SUM | |||
| Training AUC | 0.645 | 0.588 | 0.573 | 0.760 | 0.634 | 0.640 | ||
| Validation AUC | 0.542 | 0.614 | 0.716 | 0.458 | 0.708 | 0.608 | ||
| Training accuracy | 0.634 | 0.634 | 0.575 | 0.625 | 0.600 | 0.614 | ||
| Validation accuracy | 0.618 | 0.618 | 0.706 | 0.618 | 0.676 | 0.647 | ||
| Training sensitivity | 0.625 | 0.958 | 0.565 | 0.391 | 0.609 | 0.630 | ||
| Validation sensitivity | 0.333 | 0.583 | 0.583 | 0.083 | 0.750 | 0.467 | ||
| Training specificity | 0.647 | 0.176 | 0.588 | 0.941 | 0.588 | 0.588 | ||
| Validation specificity | 0.773 | 0.636 | 0.773 | 0.909 | 0.636 | 0.745 | ||
| Number | Correlation | p-Value | |
|---|---|---|---|
| Training cohort | 202 | 0.215 | 0.002 |
| Test cohort | 34 | 0.308 | 0.076 |
References
- Sauer, R.; Becker, H.; Hohenberger, W.; Rodel, C.; Wittekind, C.; Fietkau, R.; Martus, P.; Tschmelitsch, J.; Hager, E.; Hess, C.F.; et al. Preoperative versus Postoperative Chemoradiotherapy for Rectal Cancer. N. Engl. J. Med. 2004, 351, 1731–1740. [Google Scholar] [CrossRef] [Green Version]
- Bosset, J.-F.; Collette, L.; Calais, G.; Mineur, L.; Maingon, P.; Radosevic-Jelic, L.; Daban, A.; Bardet, E.; Beny, A.; Ollier, J.-C. Chemotherapy with Preoperative Radiotherapy in Rectal Cancer. N. Engl. J. Med. 2006, 355, 1114–1123. [Google Scholar] [CrossRef]
- Maas, M.; Nelemans, P.J.; Valentini, V.; Das, P.; Rödel, C.; Kuo, L.-J.; Calvo, F.A.; García-Aguilar, J.; Glynne-Jones, R.; Haustermans, K.; et al. Long-term outcome in patients with a pathological complete response after chemoradiation for rectal cancer: A pooled analysis of individual patient data. Lancet Oncol. 2010, 11, 835–844. [Google Scholar] [CrossRef]
- Deng, Y.; Chi, P.; Lan, P.; Wang, L.; Chen, W.; Cui, L.; Chen, D.; Cao, J.; Wei, H.; Peng, X.; et al. Neoadjuvant Modified FOLFOX6 With or Without Radiation Versus Fluorouracil Plus Radiation for Locally Advanced Rectal Cancer: Final Results of the Chinese FOWARC Trial. J. Clin. Oncol. 2019, 37, 3223–3233. [Google Scholar] [CrossRef]
- Calvo, F.A.; Domper, M.; Matute, R.; Martínez-Lázaro, R.; Arranz, J.A.; Desco, M.; Álvarez, E.; Carreras, J.L. 18F-FDG positron emission tomography staging and restaging in rectal cancer treated with preoperative chemoradiation. Int. J. Radiat. Oncol. 2004, 58, 528–535. [Google Scholar] [CrossRef] [PubMed]
- Capirci, C.; Rampin, L.; Erba, P.A.; Galeotti, F.; Crepaldi, G.; Banti, E.; Gava, M.; Fanti, S.; Mariani, G.; Muzzio, P.C.; et al. Sequential FDG-PET/CT reliably predicts response of locally advanced rectal cancer to neo-adjuvant chemo-radiation therapy. Eur. J. Nucl. Med. Mol. Imaging 2007, 34, 1583–1593. [Google Scholar] [CrossRef]
- Cascini, G.L.; Avallone, A.; DelRio, P.; Guida, C.; Tatangelo, F.; Marone, P.; Aloj, L.; De Martinis, F.; Comella, P.; Parisi, V.; et al. 18F-FDG PET is an early predictor of pathologic tumor response to preoperative radiochemotherapy in locally advanced rectal cancer. J. Nucl. Med. 2006, 47, 1241–1248. [Google Scholar]
- Guillem, J.G.; Moore, H.G.; Akhurst, T.; Klimstra, D.S.; Ruo, L.; Mazumdar, M.; Minsky, B.D.; Saltz, L.; Wong, W.D.; Larson, S. Sequential preoperative fluorodeoxyglucose-positron emission tomography assessment of response to preoperative chemoradiation: A means for determining long term outcomes of rectal cancer. J. Am. Coll. Surg. 2004, 199, 1–7. [Google Scholar] [CrossRef]
- Konski, A.; Hoffman, J.; Sigurdson, E.; Haluszka, O.; Engstrom, P.; Cheng, J.D.; Cohen, S.J.; Watson, J.C.; Eisenberg, D.; McGarrity, E. Can Molecular Imaging Predict Response to Preoperative Chemoradiation in Patients with Rectal Cancer? A Fox Chase Cancer Center Prospective Experience. Semin. Oncol. 2005, 32, 63–67. [Google Scholar] [CrossRef]
- Lovinfosse, P.; Polus, M.; Van Daele, D.; Martinive, P.; Daenen, F.; Hatt, M.; Visvikis, D.; Koopmansch, B.; Lambert, F.; Coimbra, C.; et al. FDG PET/CT radiomics for predicting the outcome of locally advanced rectal cancer. Eur. J. Nucl. Med. Mol. Imaging 2018, 45, 365–375. [Google Scholar] [CrossRef]
- Bang, J.-I.; Ha, S.; Kang, S.-B.; Lee, K.-W.; Lee, H.S.; Kim, J.-S.; Oh, H.-K.; Lee, H.-Y.; Kim, S.E. Prediction of neoadjuvant radiation chemotherapy response and survival using pretreatment [18F]FDG PET/CT scans in locally advanced rectal cancer. Eur. J. Nucl. Med. Mol. Imaging 2016, 43, 422–431. [Google Scholar] [CrossRef]
- Shen, W.-C.; Chen, S.-W.; Wu, K.-C.; Lee, P.-Y.; Feng, C.-L.; Hsieh, T.-C.; Yen, K.-Y.; Kao, C.-H. Predicting pathological complete response in rectal cancer after chemoradiotherapy with a random forest using 18F-fluorodeoxyglucose positron emission tomography and computed tomography radiomics. Ann. Transl. Med. 2020, 8, 207. [Google Scholar] [CrossRef]
- Weinberger, K.Q.; Saul, L.K. Distance metric learning for large margin nearest neighbor classification. J. Mach. Learn Res. 2009, 10, 207–244. [Google Scholar]
- Lu, J.; Hu, J.; Zhou, J. Deep Metric Learning for Visual Understanding: An Overview of Recent Advances. IEEE Signal Process. Mag. 2017, 34, 76–84. [Google Scholar] [CrossRef]
- Samuelian, J.M.; Callister, M.D.; Ashman, J.B.; Young-Fadok, T.M.; Borad, M.J.; Gunderson, L.L. Reduced Acute Bowel Toxicity in Patients Treated with Intensity-Modulated Radiotherapy for Rectal Cancer. Int. J. Radiat. Oncol. 2012, 82, 1981–1987. [Google Scholar] [CrossRef]
- Dworak, O.; Keilholz, L.; Hoffmann, A. Pathological features of rectal cancer after preoperative radiochemotherapy. Int. J. Colorectal. Dis. 1997, 12, 19–23. [Google Scholar] [CrossRef]
- Kaya, M.; Bilge, H. Deep Metric Learning: A Survey. Symmetry 2019, 11, 1066. [Google Scholar] [CrossRef] [Green Version]
- McInnes, L.; Healy, J.; Melville, J. UMAP: Uniform Manifold Approximation and Projection for Dimension Reduction. arXiv 2018, arXiv:1802.03426. [Google Scholar]
- Becht, E.; McInnes, L.; Healy, J.; Dutertre, C.-A.; Kwok, I.W.H.; Ng, L.G.; Ginhoux, F.; Newell, E.W. Dimensionality reduction for visualizing single-cell data using UMAP. Nat. Biotechnol. 2018, 37, 38–44. [Google Scholar] [CrossRef]
- Roweis, S.T.; Saul, L.K. Nonlinear Dimensionality Reduction by Locally Linear Embedding. Science 2000, 290, 2323–2326. [Google Scholar] [CrossRef] [PubMed] [Green Version]
- Zhang, X.-Y.; Wang, L.; Zhu, H.-T.; Li, Z.-W.; Ye, M.; Li, X.-T.; Shi, Y.-J.; Zhu, H.-C.; Sun, Y.-S. Predicting Rectal Cancer Response to Neoadjuvant Chemoradiotherapy Using Deep Learning of Diffusion Kurtosis MRI. Radiology 2020, 296, 56–64. [Google Scholar] [CrossRef] [PubMed]
- Fu, J.; Zhong, X.; Li, N.; Van Dams, R.; Lewis, J.; Sung, K.; Raldow, A.C.; Jin, J.; Qi, X.S. Deep learning-based radiomic features for improving neoadjuvant chemoradiation response prediction in locally advanced rectal cancer. Phys. Med. Biol. 2020, 65, 075001. [Google Scholar] [CrossRef] [PubMed] [Green Version]
- Bibault, J.E.; Giraud, P.; Housset, M.; Durdux, C.; Taieb, J.; Berger, A.; Coriat, R.; Chaussade, S.; Dousset, B.; Nordlinger, B.; et al. Deep learning and radiomics predict complete response after neo-adjuvant chemoradiation for locally advanced rectal cancer. Sci. Rep. 2018, 8, 16914. [Google Scholar] [CrossRef]
- Horvat, N.; Veeraraghavan, H.; Khan, M.; Blazic, I.; Zheng, J.; Capanu, M.; Sala, E.; Garcia-Aguilar, J.; Gollub, M.J.; Petkovska, I. MR Imaging of Rectal Cancer: Radiomics Analysis to Assess Treatment Response after Neoadjuvant Therapy. Radiology 2018, 287, 833–843. [Google Scholar] [CrossRef] [PubMed] [Green Version]
- Jethanandani, A.; Lin, T.A.; Volpe, S.; Elhalawani, H.; Mohamed, A.; Yang, P.; Fuller, C.D. Exploring Applications of Radiomics in Magnetic Resonance Imaging of Head and Neck Cancer: A Systematic Review. Front. Oncol. 2018, 8, 131. [Google Scholar] [CrossRef] [Green Version]


| Characteristic | Value |
|---|---|
| Age (years) | 31–86 (median, 58) |
| Gender | Male:139, Female:63 |
| Primary lesion location | |
| low rectum | 83 |
| middle rectum | 103 |
| upper rectum or rectosigmoid junction | 16 |
| CEA (ng/dL) | 17.08 ± 37.92(0.48–241.88) |
| Pretreatment clinical staging (AJCC 7th ed.) | |
| T stage | T2:26, T3:148, T4:28 |
| N stage | N0:60, N1:80; N2:62 |
| M stage | M0:198, M1:4 |
| Differentiation | |
| W-D | 5 |
| M-D | 39 |
| P-D | 4 |
| unknown | 154 |
| Concurrent chemotherapy regimen (%) | |
| Capecitabine | 174 |
| Uracil-Tegafur | 21 |
| Intravenous 5-Fluorouracil based regimen | 7 |
| Interval from the end of radiation to surgery | |
| >4 and <8 week | 102 |
| ≥8 and <12 week | 100 |
| Tumor regression grade (%) | |
| Grade 0 | 0 |
| Grade 1 | 31 |
| Grade 2 | 54 |
| Grade 3 | 93 |
| Grade 4 | 24 |
| Prediction | RG Grade 3 or 4 Response | Indices | |
|---|---|---|---|
| Positive | Negative | ||
| Positive | 115 | 2 | 98.3% |
| Negative | 3 | 82 | 96.5% |
| Indices | 97.5% | 97.6% | 97.5% |
Publisher’s Note: MDPI stays neutral with regard to jurisdictional claims in published maps and institutional affiliations. |
© 2021 by the authors. Licensee MDPI, Basel, Switzerland. This article is an open access article distributed under the terms and conditions of the Creative Commons Attribution (CC BY) license (https://creativecommons.org/licenses/by/4.0/).
Share and Cite
Wu, K.-C.; Chen, S.-W.; Hsieh, T.-C.; Yen, K.-Y.; Law, K.-M.; Kuo, Y.-C.; Chang, R.-F.; Kao, C.-H. Prediction of Neoadjuvant Chemoradiotherapy Response in Rectal Cancer with Metric Learning Using Pretreatment 18F-Fluorodeoxyglucose Positron Emission Tomography. Cancers 2021, 13, 6350. https://doi.org/10.3390/cancers13246350
Wu K-C, Chen S-W, Hsieh T-C, Yen K-Y, Law K-M, Kuo Y-C, Chang R-F, Kao C-H. Prediction of Neoadjuvant Chemoradiotherapy Response in Rectal Cancer with Metric Learning Using Pretreatment 18F-Fluorodeoxyglucose Positron Emission Tomography. Cancers. 2021; 13(24):6350. https://doi.org/10.3390/cancers13246350
Chicago/Turabian StyleWu, Kuo-Chen, Shang-Wen Chen, Te-Chun Hsieh, Kuo-Yang Yen, Kin-Man Law, Yu-Chieh Kuo, Ruey-Feng Chang, and Chia-Hung Kao. 2021. "Prediction of Neoadjuvant Chemoradiotherapy Response in Rectal Cancer with Metric Learning Using Pretreatment 18F-Fluorodeoxyglucose Positron Emission Tomography" Cancers 13, no. 24: 6350. https://doi.org/10.3390/cancers13246350
APA StyleWu, K.-C., Chen, S.-W., Hsieh, T.-C., Yen, K.-Y., Law, K.-M., Kuo, Y.-C., Chang, R.-F., & Kao, C.-H. (2021). Prediction of Neoadjuvant Chemoradiotherapy Response in Rectal Cancer with Metric Learning Using Pretreatment 18F-Fluorodeoxyglucose Positron Emission Tomography. Cancers, 13(24), 6350. https://doi.org/10.3390/cancers13246350