
MR-Guided Adaptive Radiotherapy for Head and Neck Cancer: Prospective Evaluation of Migration and Anatomical Changes of the Major Salivary Glands

 , , ,
, , ,
Abstract
:Simple Summary
Abstract
1. Introduction
2. Materials and Methods
2.1. Patients
2.2. Pretreatment
2.3. Treatment Planning
2.4. Treatment
2.5. Imaging during Treatment
2.6. Weekly Adaptation
2.7. Evaluation in MIM
2.8. Anatomical Changes
2.9. Weight Loss
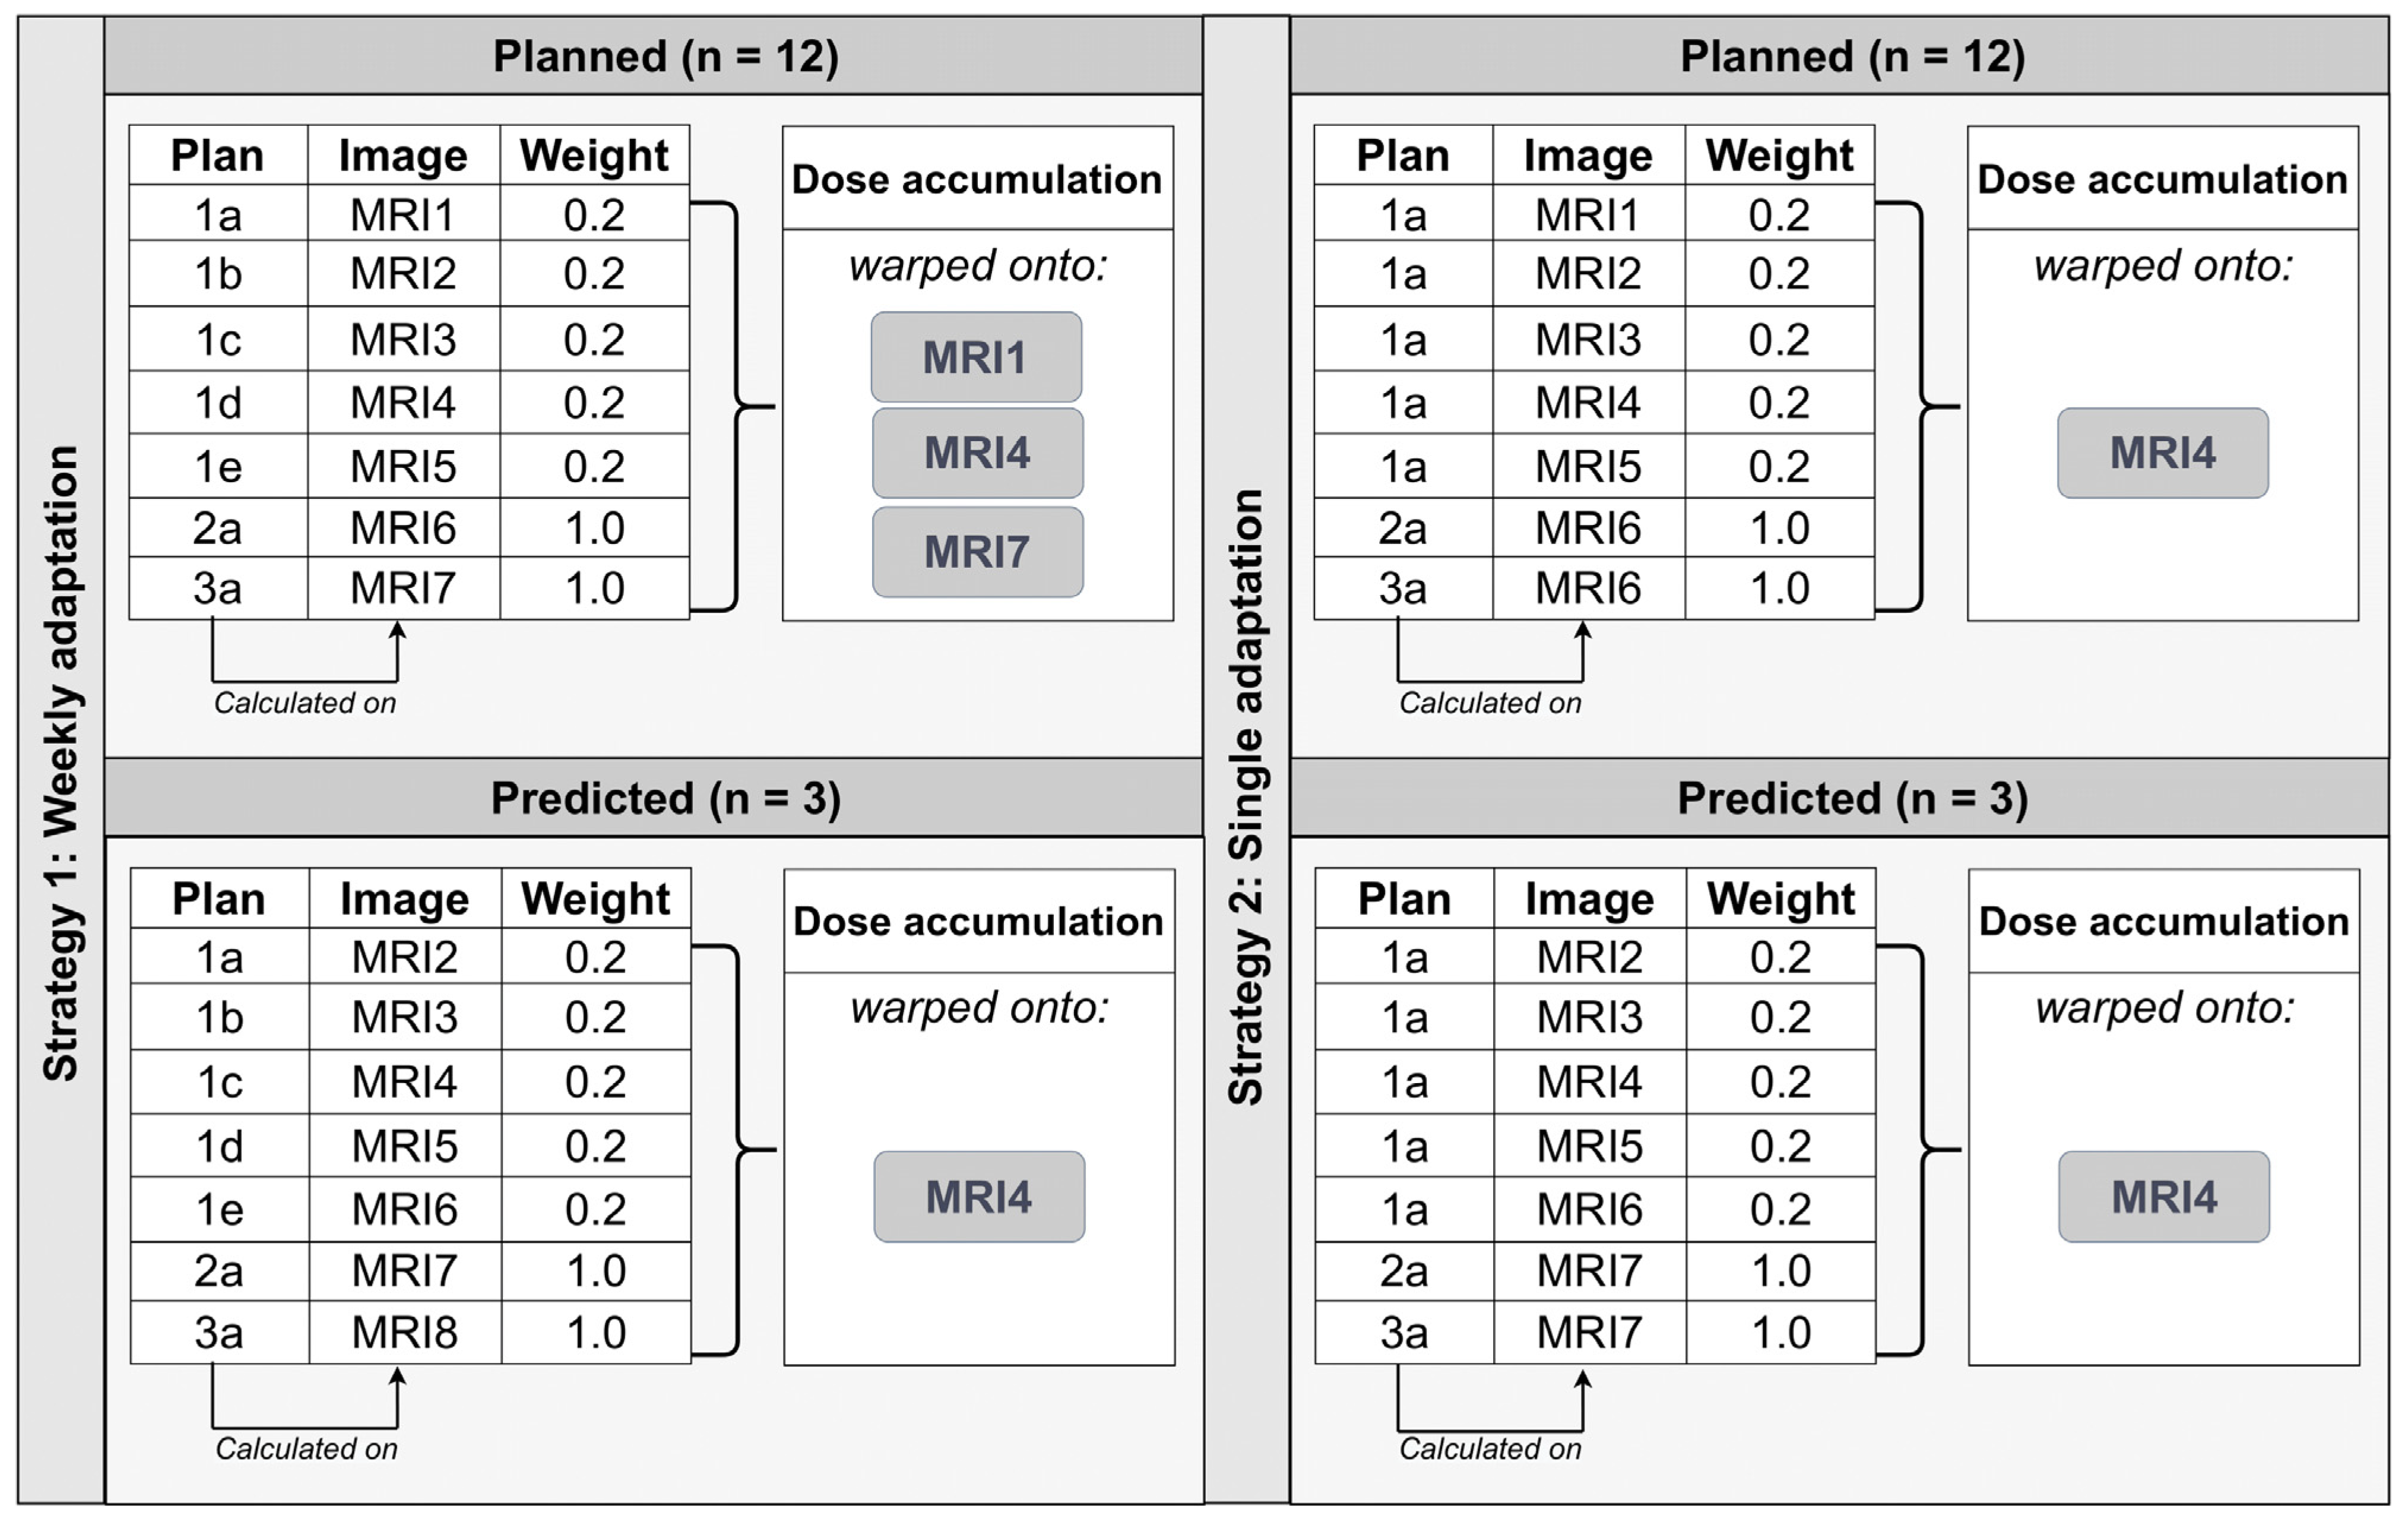
2.10. Dose Accumulation
2.11. Modeling
3. Results
3.1. Treatment
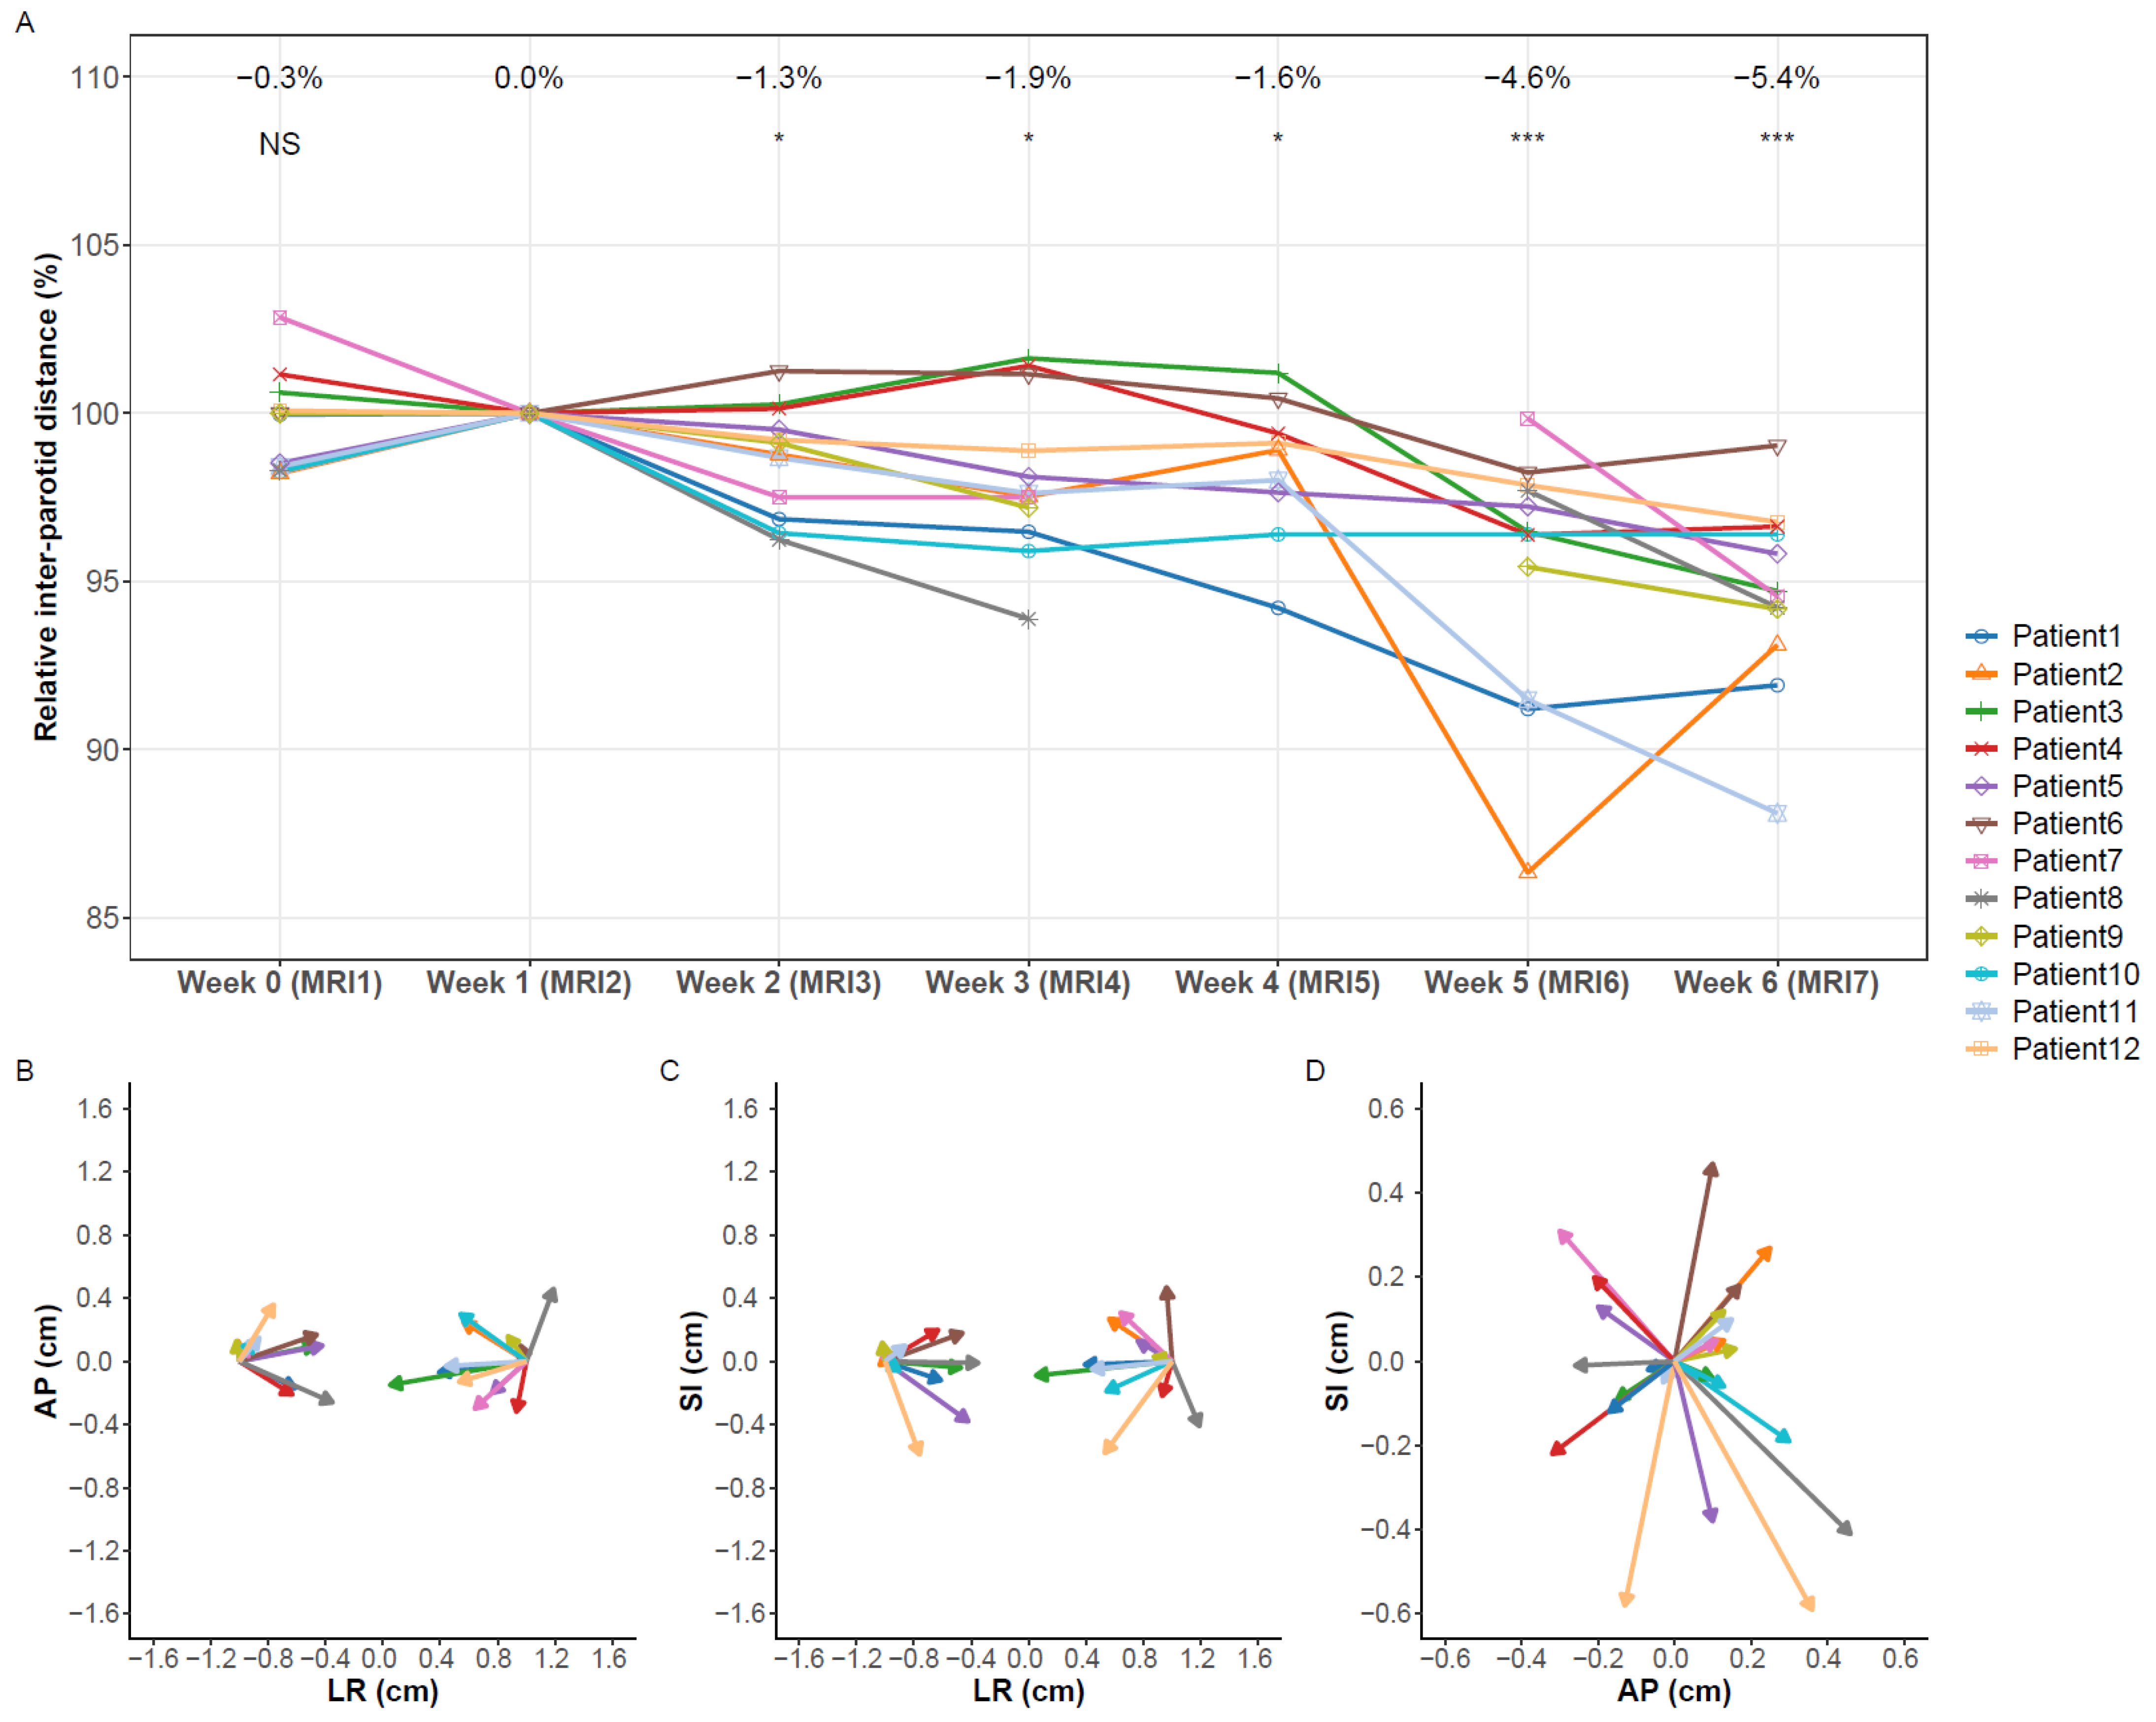
3.2. Volume Changes
3.3. Migration
3.4. Weight Loss
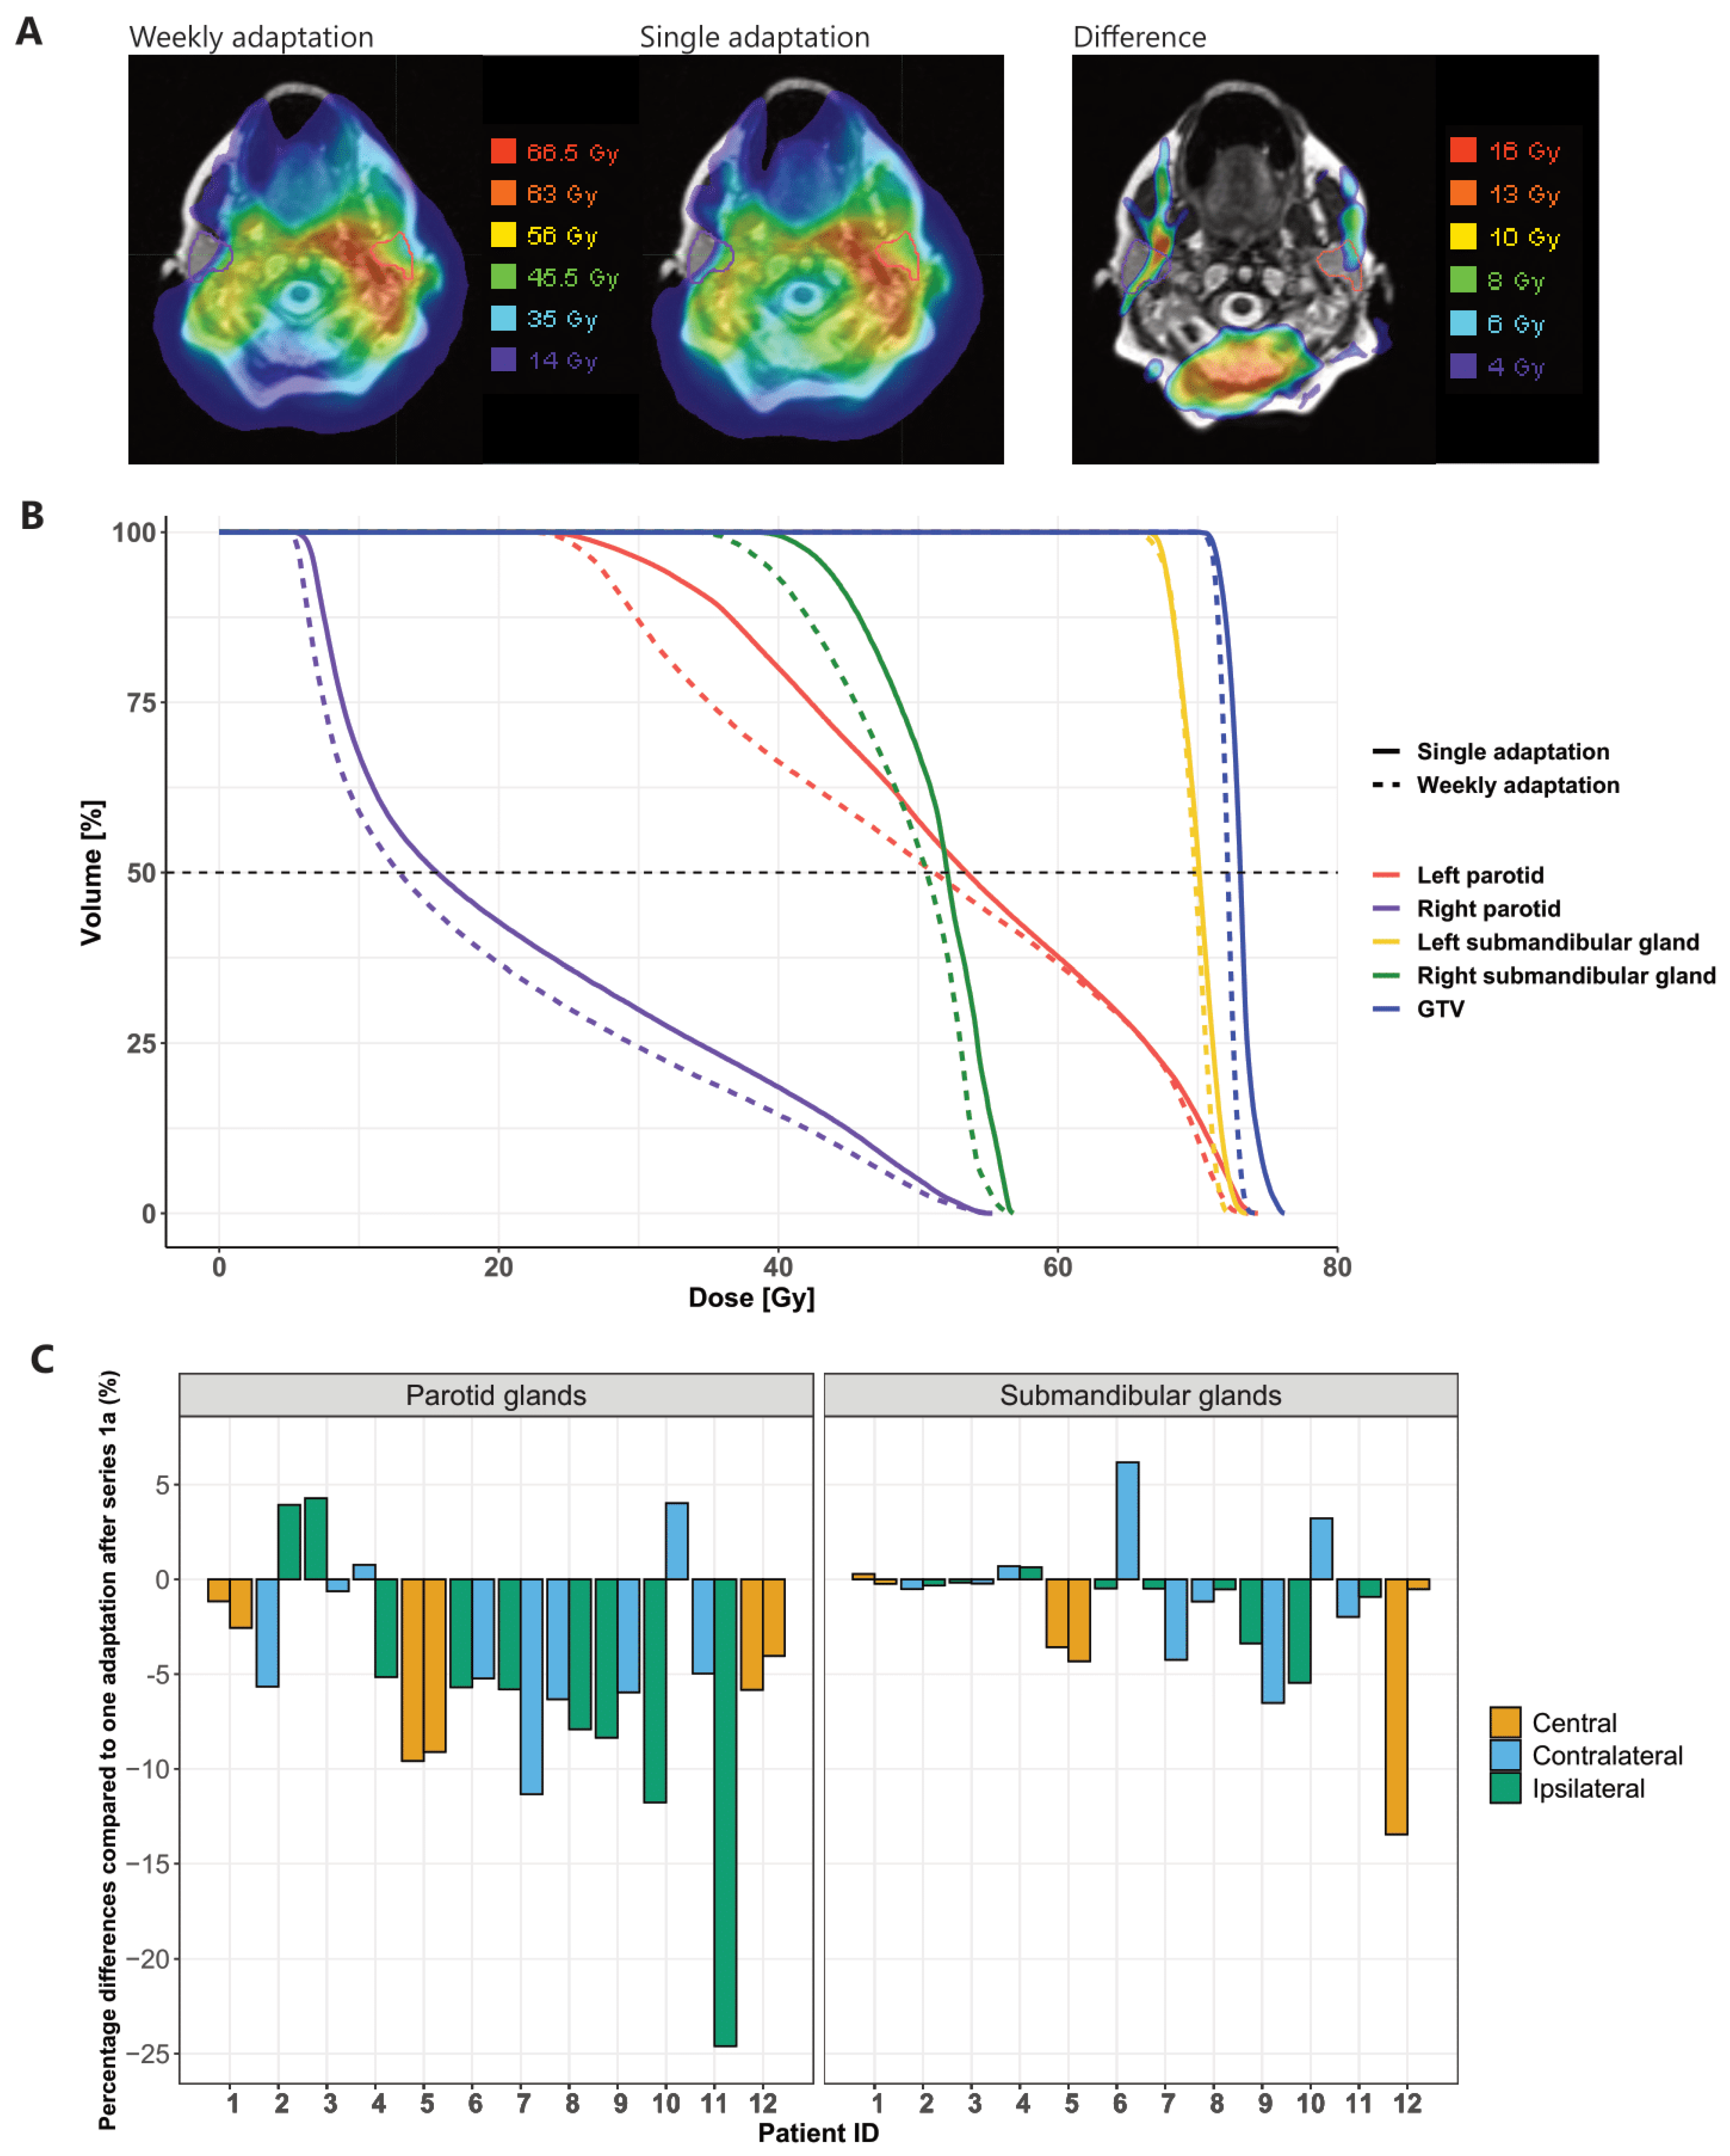
3.5. Dose Accumulation
3.5.1. Planned vs. Predicted Dose
3.5.2. Weekly Adaptation vs. Single Adaptation
3.5.3. Choice of Reference MRI for Dose Mapping
3.5.4. Dice Similarity Coefficient
3.6. Modeling
4. Discussion
5. Conclusions
Supplementary Materials
Author Contributions
Funding
Institutional Review Board Statement
Informed Consent Statement
Data Availability Statement
Conflicts of Interest
References
- Strojan, P.; Hutcheson, K.A.; Eisbruch, A.; Beitler, J.J.; Langendijk, J.A.; Lee, A.W.M.; Corry, J.; Mendenhall, W.M.; Smee, R.; Rinaldo, A.; et al. Treatment of late sequelae after radiotherapy for head and neck cancer. Cancer Treat. Rev. 2017, 59, 79–92. [Google Scholar] [CrossRef] [Green Version]
- Nutting, C.M.; Morden, J.P.; Harrington, K.J.; Urbano, T.G.; Bhide, S.A.; Clark, C.; Miles, E.A.; Miah, A.B.; Newbold, K.; Tanay, M.; et al. Parotid-sparing intensity modulated versus conventional radiotherapy in head and neck cancer (parsport): A phase 3 multicentre randomised controlled trial. Lancet Oncol. 2011, 12, 127–136. [Google Scholar] [CrossRef] [Green Version]
- Morgan, H.E.; Sher, D.J. Adaptive radiotherapy for head and neck cancer. Cancers Head Neck 2020, 5, 1. [Google Scholar] [CrossRef] [PubMed]
- Boeke, S.; Mönnich, D.; van Timmeren, J.E.; Balermpas, P. Mr-guided radiotherapy for head and neck cancer: Current developments, perspectives, and challenges. Front. Oncol. 2021, 11, 429. [Google Scholar] [CrossRef]
- Bhide, S.A.; Davies, M.; Burke, K.; McNair, H.A.; Hansen, V.; Barbachano, Y.; El-Hariry, I.A.; Newbold, K.; Harrington, K.J.; Nutting, C.M. Weekly volume and dosimetric changes during chemoradiotherapy with intensity-modulated radiation therapy for head and neck cancer: A prospective observational study. Int. J. Radiat. Oncol. Biol. Phys. 2010, 76, 1360–1368. [Google Scholar] [CrossRef]
- Zhang, P.; Simon, A.; Rigaud, B.; Castelli, J.; Ospina Arango, J.D.; Nassef, M.; Henry, O.; Zhu, J.; Haigron, P.; Li, B.; et al. Optimal adaptive imrt strategy to spare the parotid glands in oropharyngeal cancer. Radiother Oncol. 2016, 120, 41–47. [Google Scholar] [CrossRef] [PubMed] [Green Version]
- Chen, A.M.; Cao, M.; Hsu, S.; Lamb, J.; Mikaeilian, A.; Yang, Y.; Agazaryan, N.; Low, D.A.; Steinberg, M.L. Magnetic resonance imaging guided reirradiation of recurrent and second primary head and neck cancer. Adv. Radiat. Oncol. 2017, 2, 167–175. [Google Scholar] [CrossRef] [Green Version]
- Chen, A.M.; Hsu, S.; Lamb, J.; Yang, Y.; Agazaryan, N.; Steinberg, M.L.; Low, D.A.; Cao, M. Mri-guided radiotherapy for head and neck cancer: Initial clinical experience. Clin. Transl. Oncol. 2018, 20, 160–168. [Google Scholar] [CrossRef]
- Li, H.; Chen, H.C.; Dolly, S.; Li, H.; Fischer-Valuck, B.; Victoria, J.; Dempsey, J.; Ruan, S.; Anastasio, M.; Mazur, T.; et al. An integrated model-driven method for in-treatment upper airway motion tracking using cine mri in head and neck radiation therapy. Med. Phys. 2016, 43, 4700. [Google Scholar] [CrossRef]
- Thomas, D.H.; Santhanam, A.; Kishan, A.U.; Cao, M.; Lamb, J.; Min, Y.; O’Connell, D.; Yang, Y.; Agazaryan, N.; Lee, P.; et al. Initial clinical observations of intra- and interfractional motion variation in mr-guided lung sbrt. Br. J. Radiol. 2018, 91, 20170522. [Google Scholar] [CrossRef] [PubMed]
- Levin-Epstein, R.; Cao, M.; Lee, P.; Steinberg, M.L.; Lamb, J.; Raldow, A.C. Magnetic resonance-guided inter-fraction monitoring opens doors to delivering safer reirradiation: An illustrative case report and discussion. Cureus 2018, 10, e2479. [Google Scholar] [CrossRef] [PubMed] [Green Version]
- McDonald, B.A.; Vedam, S.; Yang, J.; Wang, J.; Castillo, P.; Lee, B.; Sobremonte, A.; Ahmed, S.; Ding, Y.; Mohamed, A.S.R.; et al. Initial feasibility and clinical implementation of daily mr-guided adaptive head and neck cancer radiation therapy on a 1.5 t mr-linac system: Prospective r-ideal 2a/2b systematic clinical evaluation of technical innovation. Int. J. Radiat. Oncol. Biol. Phys. 2021, 109, 1606–1618. [Google Scholar] [CrossRef]
- Balermpas, P. MRI-Guided Adaptive Radiotherapy for Reducing XerostomiA in Head and Neck Cancer (MARTHA-Trial) (MARTHA). Available online: https://clinicaltrials.gov/ct2/show/NCT03972072 (accessed on 12 July 2021).
- Kluter, S. Technical design and concept of a 0.35 t mr-linac. Clin. Transl. Radiat. Oncol. 2019, 18, 98–101. [Google Scholar] [CrossRef] [PubMed] [Green Version]
- Grégoire, V.; Evans, M.; Le, Q.-T.; Bourhis, J.; Budach, V.; Chen, A.; Eisbruch, A.; Feng, M.; Giralt, J.; Gupta, T.; et al. Delineation of the primary tumour clinical target volumes (ctv-p) in laryngeal, hypopharyngeal, oropharyngeal and oral cavity squamous cell carcinoma: Airo, caca, dahanca, eortc, georcc, gortec, hknpcsg, hncig, iag-kht, lprhht, ncic ctg, ncri, nrg oncology, phns, sbrt, somera, sro, sshno, trog consensus guidelines. Radiother Oncol. 2018, 126, 3–24. [Google Scholar]
- Biau, J.; Lapeyre, M.; Troussier, I.; Budach, W.; Giralt, J.; Grau, C.; Kazmierska, J.; Langendijk, J.A.; Ozsahin, M.; O’Sullivan, B.; et al. Selection of lymph node target volumes for definitive head and neck radiation therapy: A 2019 update. Radiother Oncol. 2019, 134, 1–9. [Google Scholar] [CrossRef]
- Grégoire, V.; Ang, K.; Budach, W.; Grau, C.; Hamoir, M.; Langendijk, J.A.; Lee, A.; Le, Q.-T.; Maingon, P.; Nutting, C.; et al. Delineation of the neck node levels for head and neck tumors: A 2013 update. Dahanca, eortc, hknpcsg, ncic ctg, ncri, rtog, trog consensus guidelines. Radiother Oncol. 2014, 110, 172–181. [Google Scholar] [CrossRef]
- Navran, A.; Heemsbergen, W.; Janssen, T.; Hamming-Vrieze, O.; Jonker, M.; Zuur, C.; Verheij, M.; Remeijer, P.; Sonke, J.J.; van den Brekel, M.; et al. The impact of margin reduction on outcome and toxicity in head and neck cancer patients treated with image-guided volumetric modulated arc therapy (vmat). Radiother Oncol. 2019, 130, 25–31. [Google Scholar] [CrossRef] [Green Version]
- Pignon, J.P.; le Maître, A.; Maillard, E.; Bourhis, J. Meta-analysis of chemotherapy in head and neck cancer (mach-nc): An update on 93 randomised trials and 17,346 patients. Radiother Oncol. 2009, 92, 4–14. [Google Scholar] [CrossRef] [PubMed]
- Lacas, B.; Bourhis, J.; Overgaard, J.; Zhang, Q.; Grégoire, V.; Nankivell, M.; Zackrisson, B.; Szutkowski, Z.; Suwiński, R.; Poulsen, M.; et al. Role of radiotherapy fractionation in head and neck cancers (march): An updated meta-analysis. Lancet Oncol. 2017, 18, 1221–1237. [Google Scholar] [CrossRef] [Green Version]
- Miah, A.B.; Gulliford, S.L.; Morden, J.; Newbold, K.L.; Bhide, S.A.; Zaidi, S.H.; Hall, E.; Harrington, K.J.; Nutting, C.M. Recovery of salivary function: Contralateral parotid-sparing intensity-modulated radiotherapy versus bilateral superficial lobe parotid-sparing intensity-modulated radiotherapy. Clin. Oncol. (R Coll. Radiol.) 2016, 28, e69–e76. [Google Scholar] [CrossRef] [PubMed] [Green Version]
- Jensen, K.; Friborg, J.; Hansen, C.R.; Samsøe, E.; Johansen, J.; Andersen, M.; Smulders, B.; Andersen, E.; Nielsen, M.S.; Eriksen, J.G.; et al. The danish head and neck cancer group (dahanca) 2020 radiotherapy guidelines. Radiother Oncol. 2020, 151, 149–151. [Google Scholar] [CrossRef]
- R Core Team. R: A Language and Environment for Statistical Computing; R Foundation for Statistical Computing: Vienna, Austria, 2020; Available online: https://www.R-project.org/ (accessed on 25 August 2021).
- Fiorino, C.; Rizzo, G.; Scalco, E.; Broggi, S.; Belli, M.L.; Dell’Oca, I.; Dinapoli, N.; Ricchetti, F.; Rodriguez, A.M.; Di Muzio, N.; et al. Density variation of parotid glands during imrt for head-neck cancer: Correlation with treatment and anatomical parameters. Radiother Oncol. 2012, 104, 224–229. [Google Scholar] [CrossRef] [PubMed]
- Thomas Lumley Based on Fortran Code by Alan Miller. Leaps: Regression Subset Selection. R Package Version 3.1. 2020. Available online: https://CRAN.R-project.org/package=leaps (accessed on 25 August 2021).
- Marzi, S.; Farneti, A.; Vidiri, A.; Di Giuliano, F.; Marucci, L.; Spasiano, F.; Terrenato, I.; Sanguineti, G. Radiation-induced parotid changes in oropharyngeal cancer patients: The role of early functional imaging and patient−/treatment-related factors. Radiat. Oncol. 2018, 13, 189. [Google Scholar] [CrossRef] [PubMed]
- Chamberlain, M.; Krayenbuehl, J.; van Timmeren, J.E.; Wilke, L.; Andratschke, N.; Garcia Schüler, H.; Tanadini-Lang, S.; Guckenberger, M.; Balermpas, P. Head and neck radiotherapy on the mr linac: A multicenter planning challenge amongst mridian platform users. Strahlenther Oncol. 2021. [Google Scholar] [CrossRef]
- Heukelom, J.; Kantor, M.E.; Mohamed, A.S.R.; Elhalawani, H.; Kocak-Uzel, E.; Lin, T.; Yang, J.; Aristophanous, M.; Rasch, C.R.; Fuller, C.D.; et al. Differences between planned and delivered dose for head and neck cancer, and their consequences for normal tissue complication probability and treatment adaptation. Radiother Oncol. 2020, 142, 100–106. [Google Scholar] [CrossRef] [PubMed] [Green Version]
- Brouwer, C.L.; Steenbakkers, R.J.; Langendijk, J.A.; Sijtsema, N.M. Identifying patients who may benefit from adaptive radiotherapy: Does the literature on anatomic and dosimetric changes in head and neck organs at risk during radiotherapy provide information to help? Radiother Oncol. 2015, 115, 285–294. [Google Scholar] [CrossRef] [Green Version]
- van Timmeren, J.E.; Chamberlain, M.; Krayenbuehl, J.; Wilke, L.; Ehrbar, S.; Bogowicz, M.; Zamburlini, M.; Garcia Schüler, H.; Pavic, M.; Balermpas, P.; et al. Comparison of beam segment versus full plan re-optimization in daily magnetic resonance imaging-guided online-adaptive radiotherapy. Phys. Imag. Radiat. Oncol. 2021, 17, 43–46. [Google Scholar] [CrossRef] [PubMed]
- Broggi, S.; Fiorino, C.; Dell’Oca, I.; Dinapoli, N.; Paiusco, M.; Muraglia, A.; Maggiulli, E.; Ricchetti, F.; Valentini, V.; Sanguineti, G.; et al. A two-variable linear model of parotid shrinkage during imrt for head and neck cancer. Radiother Oncol. 2010, 94, 206–212. [Google Scholar] [CrossRef]
- Brock, K.K.; Mutic, S.; McNutt, T.R.; Li, H.; Kessler, M.L. Use of image registration and fusion algorithms and techniques in radiotherapy: Report of the aapm radiation therapy committee task group no. 132. Med. Phys. 2017, 44, e43–e76. [Google Scholar] [CrossRef] [Green Version]


| Patient | Age | Gender | HPV Status | Tumor Site | Tumor Stage | Overall Stage ** | Tumor Location | Left Parotid Gland | Right Parotid Gland | Left Submandibular Gland | Right Submandibular Gland | ||||||||
|---|---|---|---|---|---|---|---|---|---|---|---|---|---|---|---|---|---|---|---|
| Mean Dose | Volume | Overlap PTV1 | Mean Dose | Volume | Overlap PTV1 | Mean Dose | Volume | Overlap PTV1 | Mean Dose | Volume | Overlap PTV1 | ||||||||
| 1 | 39 | male | - | H,O * | T2N3bM0 | IVB | Central | 17.1 Gy | 28.3 mL | 8.3% | 25.3 Gy | 31.1 mL | 20.5% | 50.3 Gy | 9.4 mL | 96.8% | 50.7 Gy | 7.5 mL | 97.9% |
| 2 | 67 | male | + | H | T2N1M0 | I | Right | 16.9 Gy | 31.8 mL | 0.0% | 24.8 Gy | 29.5 mL | 7.2% | 43.9 Gy | 11.9 mL | 7.7% | 51.2 Gy | 13.9 mL | 99.3% |
| 3 | 66 | female | + | O | T4N2M0 | III | Left | 16.5 Gy | 18.5 mL | 4.4% | 25.8 Gy | 19.3 mL | 13.1% | 50.3 Gy | 6.7 mL | 94.2% | 50.1 Gy | 6.5 mL | 73.3% |
| 4 | 67 | female | - | Or | T3N2cM0 | IVA | Right | 16.3 Gy | 20.7 mL | 0.1% | 17.9 Gy | 21.6 mL | 1.2% | 50.8 Gy | 8.0 mL | 87.9% | 50.5 Gy | 7.3 mL | 98.6% |
| 5 | 61 | male | - | H | T4N2cM0 | IVA | Central | 16.8 Gy | 18.3 mL | 0.6% | 17.0 Gy | 28.1 mL | 0.7% | 51.0 Gy | 8.6 mL | 93.0% | 50.7 Gy | 7.9 mL | 99.1% |
| 6 | 65 | male | NA | L | T3N0M0 | III | Left | 16.4 Gy | 19.0 mL | 0.0% | 15.3 Gy | 21.2 mL | 0.2% | 32.7 Gy | 7.7 mL | 32.6% | 25.5 Gy | 6.4 mL | 5.4% |
| 7 | 56 | female | + | O | T1N1M0 | I | Left | 42.9 Gy | 19.0 mL | 27.4% | 16.2 Gy | 19.0 mL | 4.0% | 50.6 Gy | 6.1 mL | 100% | 48.2 Gy | 6.0 mL | 51.6% |
| 8 | 74 | male | - | O | T4bN1M0 | IVB | Right | 18.4 Gy | 35.0 mL | 2.9% | 32.2 Gy | 33.4 mL | 5.2% | 50.2 Gy | 7.1 mL | 96.9% | 50.5 Gy | 6.8 mL | 100% |
| 9 | 69 | male | - | O | T2N0M0 | II | Left | 22.2 Gy | 31.8 mL | 0.5% | 16.6 Gy | 33.4 mL | 0.0% | 50.5 Gy | 10.9 mL | 99.5% | 25.6 Gy | 9.4 mL | 0.1% |
| 10 | 60 | male | + | O | T4N2M0 | III | Left | 39.7 Gy | 25.7 mL | 24.0% | 16.2 Gy | 22.9 mL | 0.8% | 51.0 Gy | 8.8 mL | 100% | 26.7 Gy | 9.1 mL | 17.5% |
| 11 | 57 | male | - | O | T4N2bM0 | IVA | Right | 16.6 Gy | 27.2 mL | 0.0% | 38.3 Gy | 29.6 mL | 8.2% | 29.1 Gy | 8.4 mL | 0.1% | 52.2 Gy | 6.4 mL | 100% |
| 12 | 51 | male | NA | L | T3N0M0 | III | Central | 15.6 Gy | 41.0 mL | 0.0% | 16.7 Gy | 46.9 mL | 0.0% | 25.6 Gy | 8.4 mL | 0.1% | 26.8 Gy | 14.1 mL | 1.7% |
Publisher’s Note: MDPI stays neutral with regard to jurisdictional claims in published maps and institutional affiliations. |
© 2021 by the authors. Licensee MDPI, Basel, Switzerland. This article is an open access article distributed under the terms and conditions of the Creative Commons Attribution (CC BY) license (https://creativecommons.org/licenses/by/4.0/).
Share and Cite
van Timmeren, J.E.; Chamberlain, M.; Bogowicz, M.; Ehrbar, S.; Dal Bello, R.; Garcia Schüler, H.; Krayenbuehl, J.; Wilke, L.; Andratschke, N.; Guckenberger, M.; et al. MR-Guided Adaptive Radiotherapy for Head and Neck Cancer: Prospective Evaluation of Migration and Anatomical Changes of the Major Salivary Glands. Cancers 2021, 13, 5404. https://doi.org/10.3390/cancers13215404
van Timmeren JE, Chamberlain M, Bogowicz M, Ehrbar S, Dal Bello R, Garcia Schüler H, Krayenbuehl J, Wilke L, Andratschke N, Guckenberger M, et al. MR-Guided Adaptive Radiotherapy for Head and Neck Cancer: Prospective Evaluation of Migration and Anatomical Changes of the Major Salivary Glands. Cancers. 2021; 13(21):5404. https://doi.org/10.3390/cancers13215404
Chicago/Turabian Stylevan Timmeren, Janita E., Madalyne Chamberlain, Marta Bogowicz, Stefanie Ehrbar, Riccardo Dal Bello, Helena Garcia Schüler, Jérôme Krayenbuehl, Lotte Wilke, Nicolaus Andratschke, Matthias Guckenberger, and et al. 2021. "MR-Guided Adaptive Radiotherapy for Head and Neck Cancer: Prospective Evaluation of Migration and Anatomical Changes of the Major Salivary Glands" Cancers 13, no. 21: 5404. https://doi.org/10.3390/cancers13215404
APA Stylevan Timmeren, J. E., Chamberlain, M., Bogowicz, M., Ehrbar, S., Dal Bello, R., Garcia Schüler, H., Krayenbuehl, J., Wilke, L., Andratschke, N., Guckenberger, M., Tanadini-Lang, S., & Balermpas, P. (2021). MR-Guided Adaptive Radiotherapy for Head and Neck Cancer: Prospective Evaluation of Migration and Anatomical Changes of the Major Salivary Glands. Cancers, 13(21), 5404. https://doi.org/10.3390/cancers13215404