Tumor Microenvironment Features as Predictive Biomarkers of Response to Immune Checkpoint Inhibitors (ICI) in Metastatic Clear Cell Renal Cell Carcinoma (mccRCC)

 , ,
, , 
Abstract
Simple Summary
Abstract
1. Introduction
2. Tumor Microenvironment: Definition and Available Study Methods
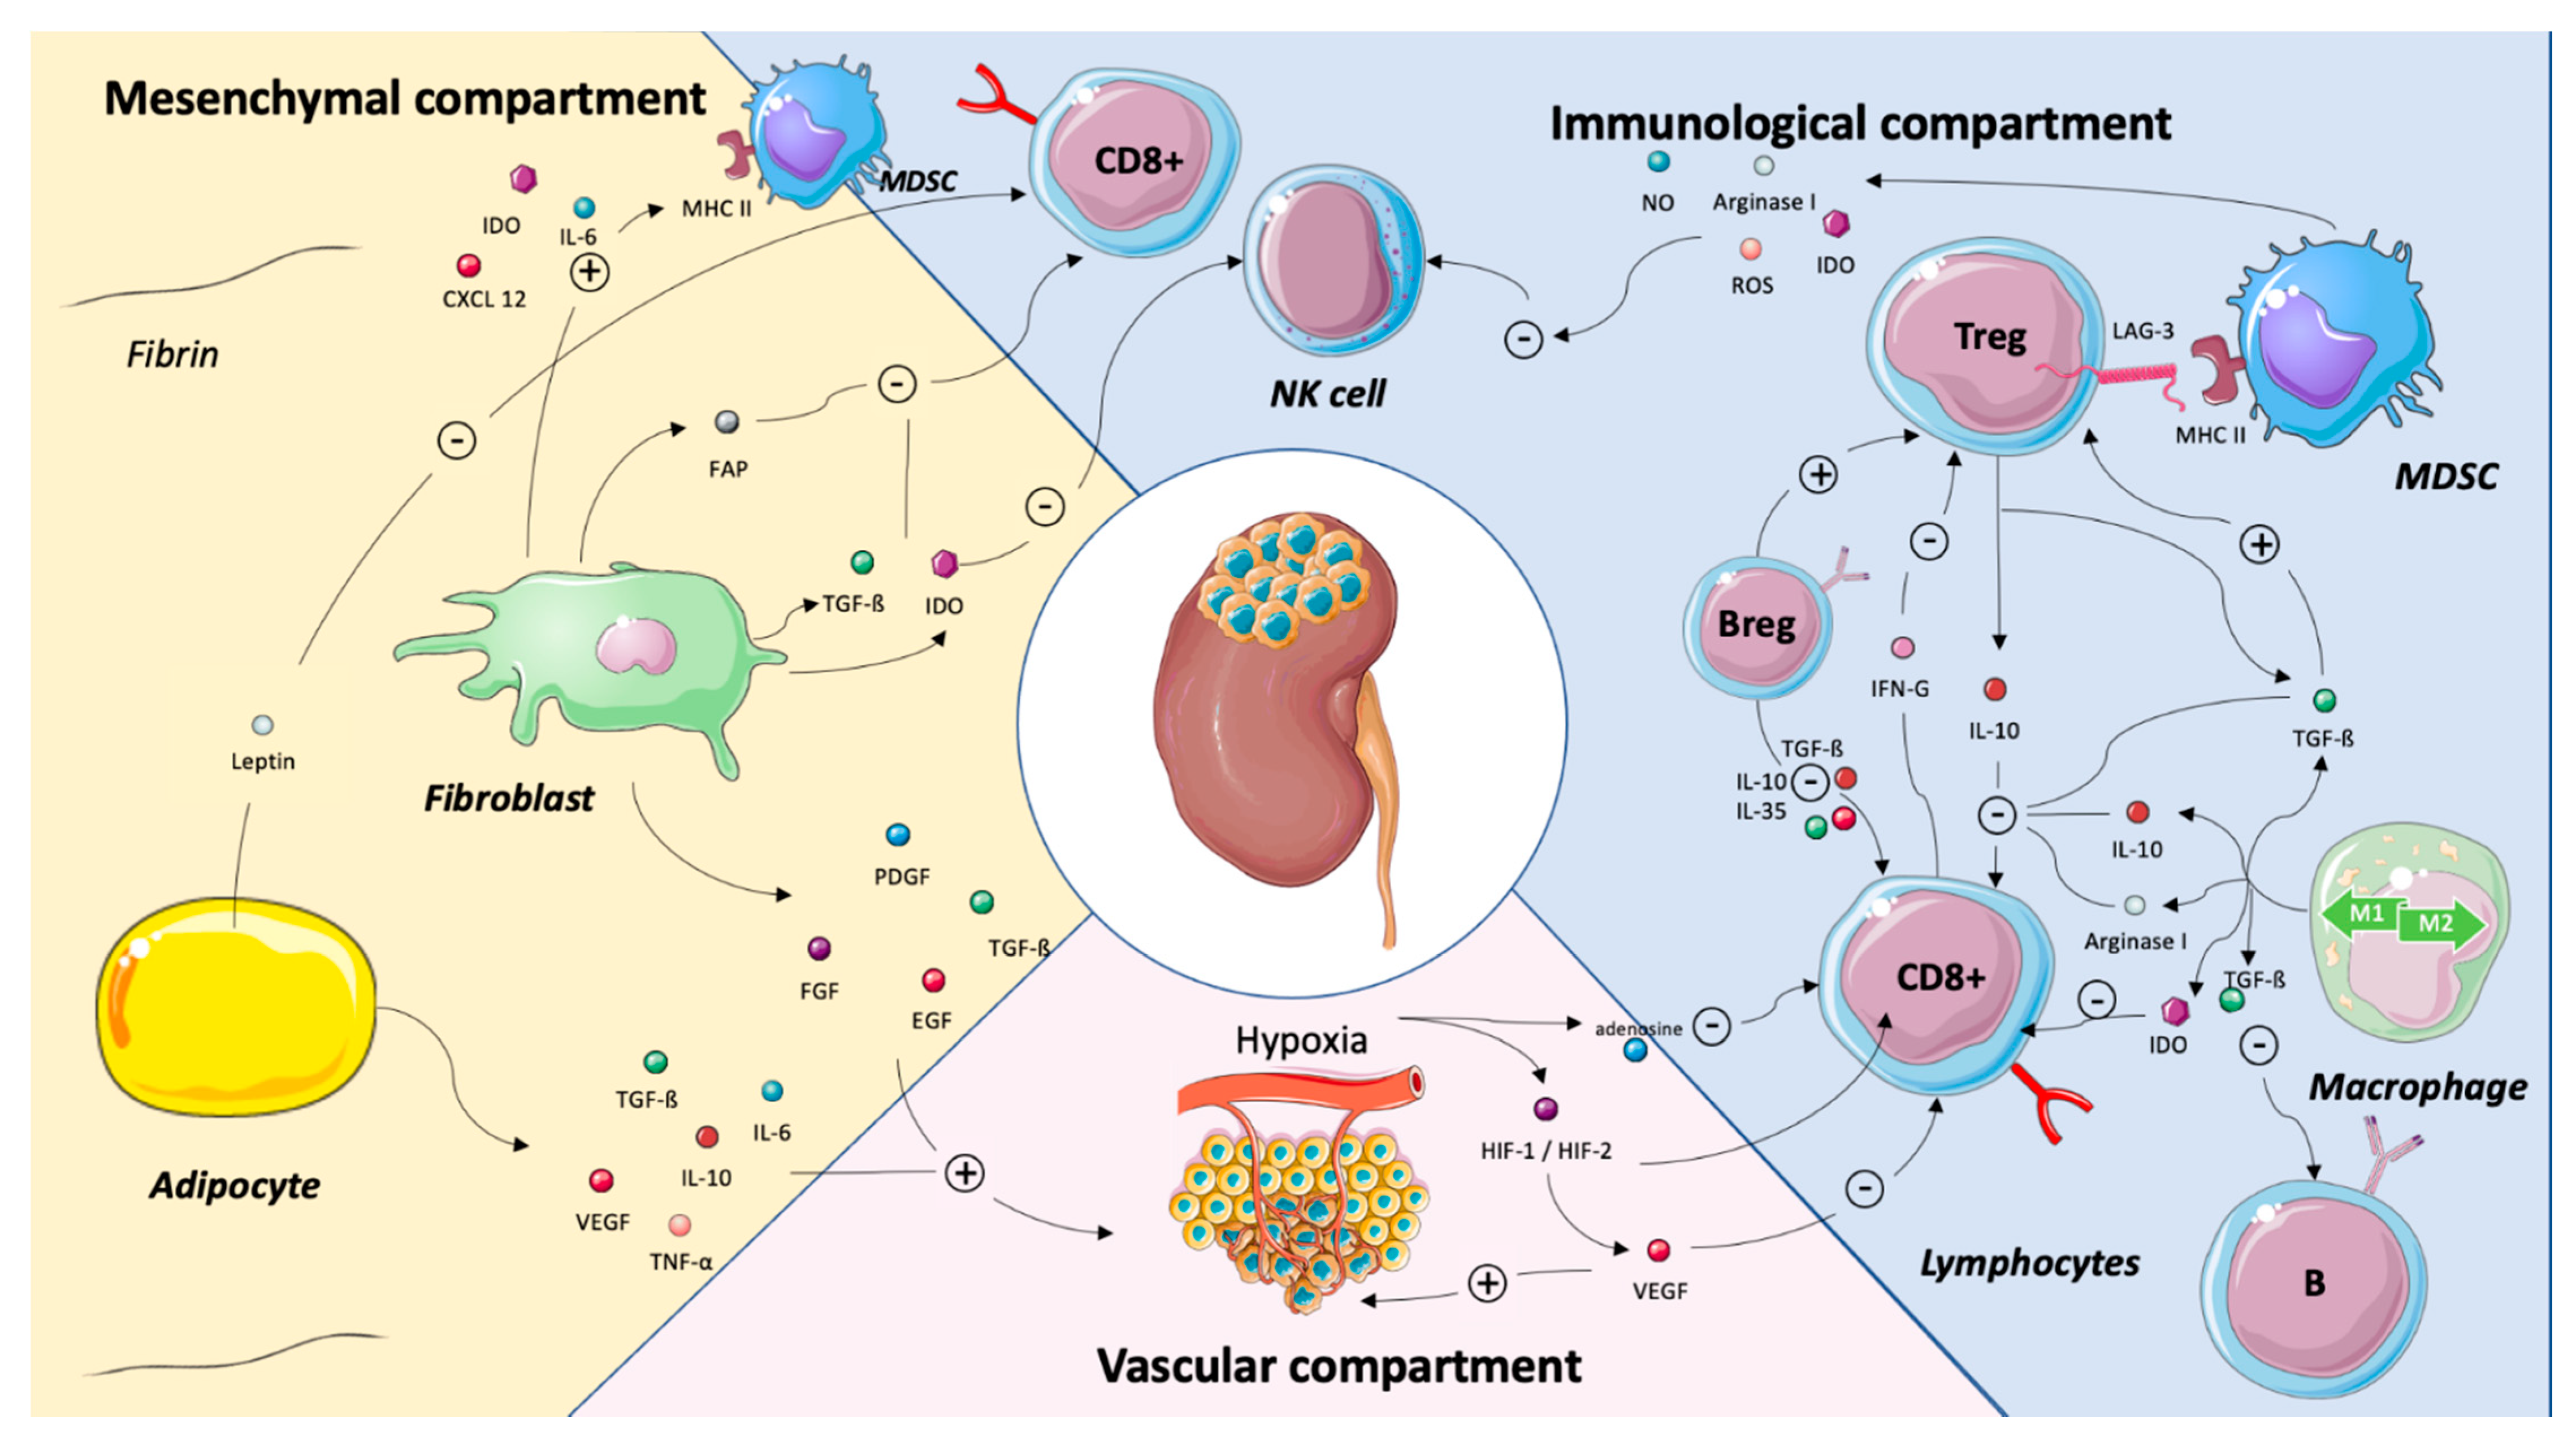
2.1. Definition
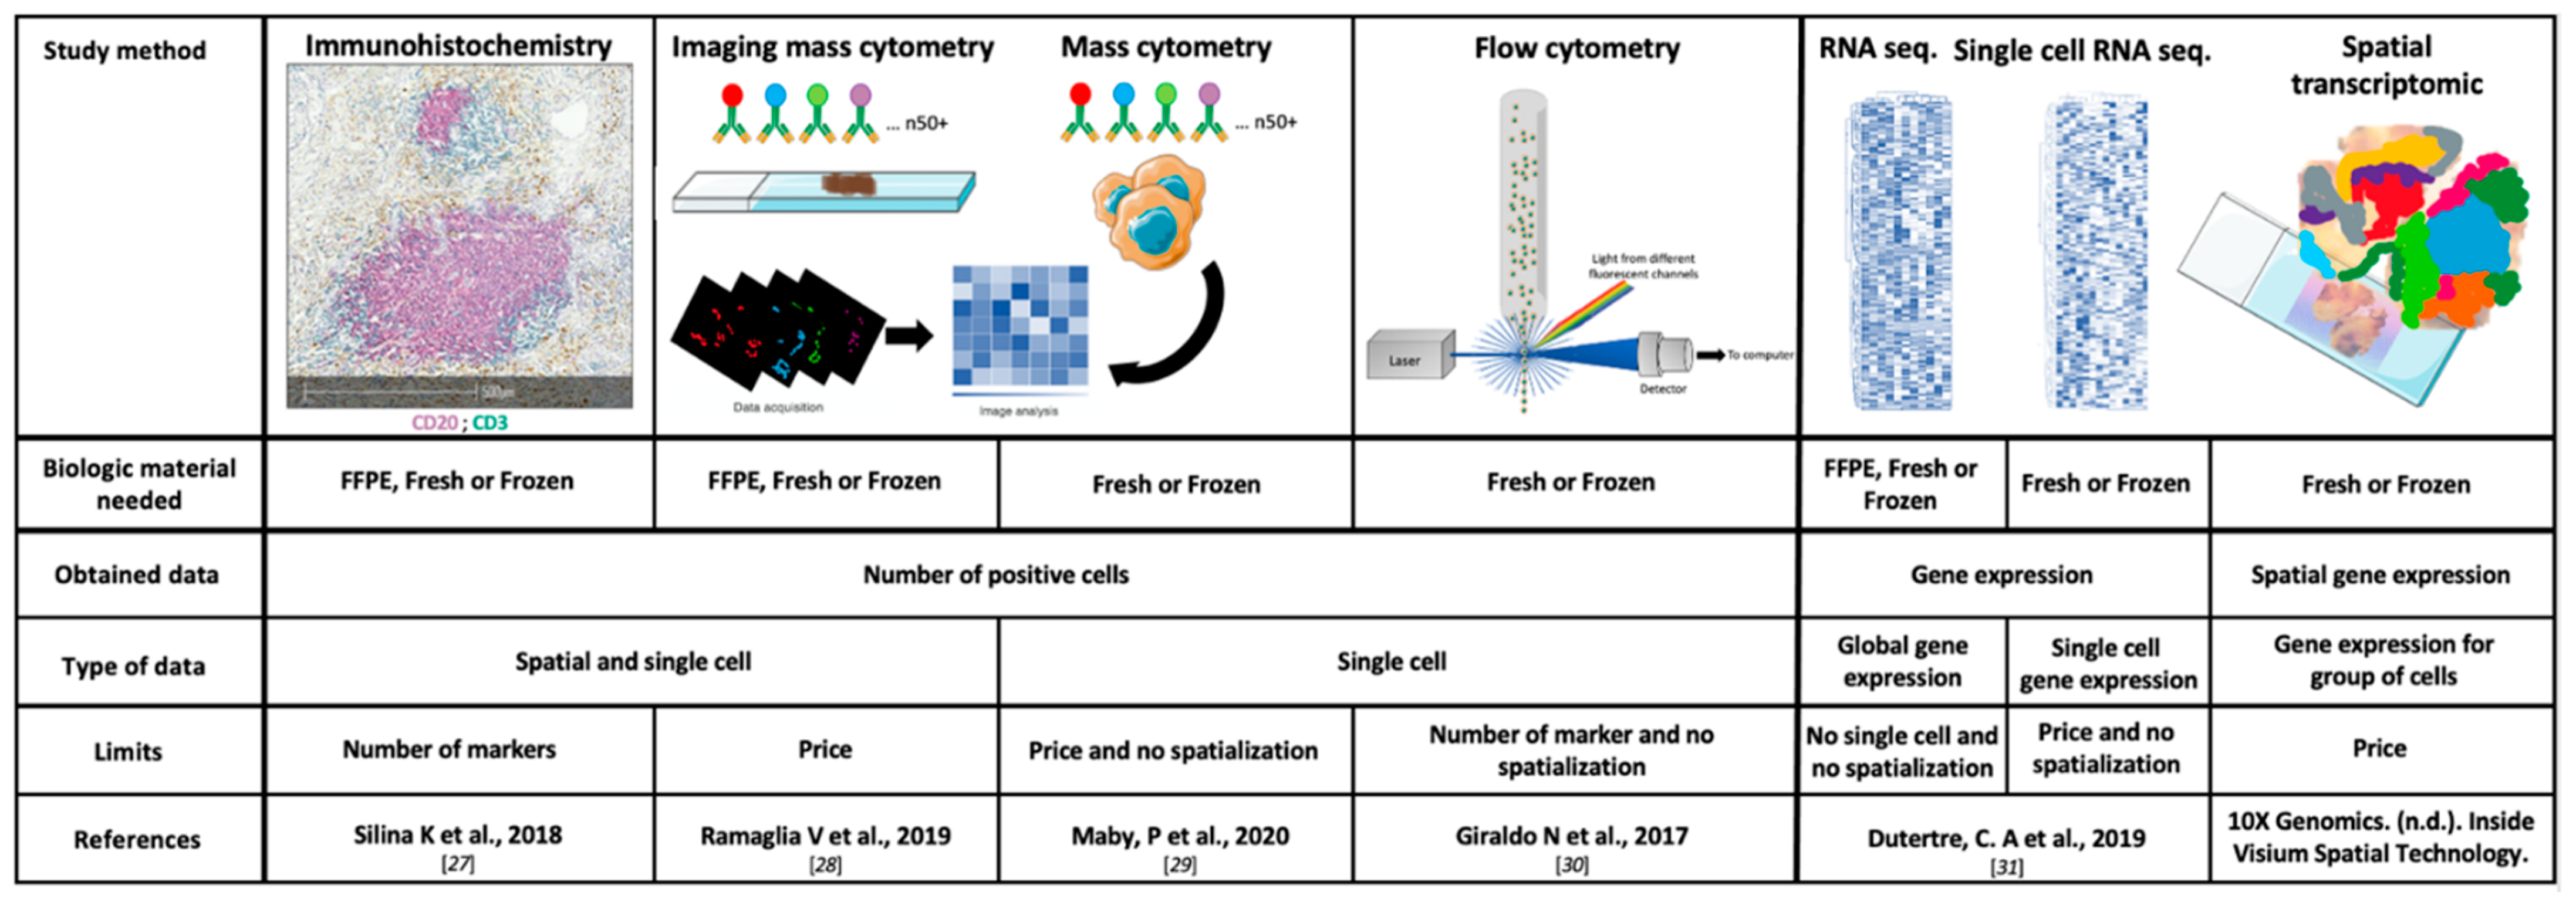
2.2. Study Methods
2.2.1. Immunohistochemistry (IHC) and Scoring
2.2.2. Flow Cytometry
2.2.3. Transcriptomic Data and Deconvolution Tools
3. TME Components as Predictors of Systemic Treatment Efficacy
3.1. Vascular Compartment
Endothelial Cells and Hypoxia
3.2. Immune Compartment
3.2.1. CD8+ T Cells
3.2.2. Tumor-Associated Macrophage (TAM)
3.2.3. Regulatory T Cells (Tregs)
3.2.4. B cells and Tertiary Lymphoid Structures (TLS)
3.3. Stromal Compartment
3.3.1. Myeloid-Derived Suppressor Cells (MDSCs)
3.3.2. Cancer-Associated Fibroblasts (CAFs)
3.3.3. Cancer-Associated Adipocytes (CAAs)
3.4. PD-L1
4. TME-Related mRNA Signatures to Predict Systemic Treatment Efficacy
4.1. Angiogenesis Signature (IMmotion)
4.2. Immune Signatures
4.2.1. T-Effector and Myeloid Signatures (IMmotion and Javelin Renal)
4.2.2. Post-Hoc Analysis from the Phase III Checkmate 214
4.3. Strengths and Weaknesses of Genomic Signatures
5. Perspectives: The BIONIKK Trial as an Example of Integrative TME Analyses
6. Conclusions
Author Contributions
Funding
Institutional Review Board Statement
Informed Consent Statement
Data Availability Statement
Conflicts of Interest
References
- Siegel, R.L.; Miller, K.D.; Jemal, A. Cancer statistics. CA Cancer J. Clin. 2018, 68, 7–30. [Google Scholar] [CrossRef] [PubMed]
- Yagoda, A.; Abi-Rached, B.; Petrylak, D. Chemotherapy for advanced renal-cell carcinoma: 1983–1993. Semin. Oncol. 1995, 22, 42–60. [Google Scholar] [PubMed]
- Rosenberg, S.A. Interleukin 2 for patients with renal cancer. Nat. Clin. Pract. Oncol. 2007, 4, 497. [Google Scholar] [CrossRef] [PubMed]
- Interferon-alpha and survival in metastatic renal carcinoma: Early results of a randomised controlled trial. Medical Research Council Renal Cancer Collaborators. Lancet Lond. Engl. 1999, 353, 14–17. [CrossRef]
- Motzer, R.J.; Hutson, T.E.; Tomczak, P.; Michaelson, M.D.; Bukowski, R.M.; Oudard, S.; Negrier, S.; Szczylik, C.; Pili, R.; Bjarnason, G.A.; et al. Overall survival and updated results for sunitinib compared with interferon alfa in patients with metastatic renal cell carcinoma. J. Clin. Oncol. Off. J. Am. Soc. Clin. Oncol. 2009, 27, 3584–3590. [Google Scholar] [CrossRef] [PubMed]
- Sternberg, C.N.; Hawkins, R.E.; Wagstaff, J.; Salman, P.; Mardiak, J.; Barrios, C.H.; Zarba, J.J.; Gladkov, O.A.; Lee, E.; Szczylik, C.; et al. A randomised, double-blind phase III study of pazopanib in patients with advanced and/or metastatic renal cell carcinoma: Final overall survival results and safety update. Eur. J. Cancer Oxf. Engl. 2013, 49, 1287–1296. [Google Scholar] [CrossRef]
- Choueiri, T.K.; Escudier, B.; Powles, T.; Tannir, N.M.; Mainwaring, P.N.; Rini, B.I.; Hammers, H.J.; Donskov, F.; Roth, B.J.; Peltola, K.; et al. Cabozantinib versus everolimus in advanced renal cell carcinoma (METEOR): Final results from a randomised, open-label, phase 3 trial. Lancet Oncol. 2016, 17, 917–927. [Google Scholar] [CrossRef]
- Motzer, R.J.; Hutson, T.E.; Cella, D.; Reeves, J.; Hawkins, R.; Guo, J.; Nathan, P.; Staehler, M.; de Souza, P.; Merchan, J.R.; et al. Pazopanib versus Sunitinib in Metastatic Renal-Cell Carcinoma. N. Engl. J. Med. 2013, 369, 722–731. [Google Scholar] [CrossRef]
- Escudier, B.; Porta, C.; Schmidinger, M.; Rioux-Leclercq, N.; Bex, A.; Khoo, V.; Grünwald, V.; Gillessen, S.; Horwich, A.; ESMO Guidelines Committee. Electronic address: Clinicalguidelines@esmo.org Renal cell carcinoma: ESMO Clinical Practice Guidelines for diagnosis, treatment and follow-up. Ann. Oncol. Off. J. Eur. Soc. Med. Oncol. 2019, 30, 706–720. [Google Scholar] [CrossRef]
- Rini, B.I.; Plimack, E.R.; Stus, V.; Gafanov, R.; Hawkins, R.; Nosov, D.; Pouliot, F.; Alekseev, B.; Soulières, D.; Melichar, B.; et al. Pembrolizumab plus Axitinib versus Sunitinib for Advanced Renal-Cell Carcinoma. N. Engl. J. Med. 2019, 380, 1116–1127. [Google Scholar] [CrossRef]
- Motzer, R.J.; Rini, B.I.; McDermott, D.F.; Arén Frontera, O.; Hammers, H.J.; Carducci, M.A.; Salman, P.; Escudier, B.; Beuselinck, B.; Amin, A.; et al. Nivolumab plus ipilimumab versus sunitinib in first-line treatment for advanced renal cell carcinoma: Extended follow-up of efficacy and safety results from a randomised, controlled, phase 3 trial. Lancet Oncol. 2019, 20, 1370–1385. [Google Scholar] [CrossRef]
- Heidegger, I.; Pircher, A.; Pichler, R. Targeting the Tumor Microenvironment in Renal Cell Cancer Biology and Therapy. Front. Oncol. 2019, 9. [Google Scholar] [CrossRef] [PubMed]
- Grivennikov, S.I.; Greten, F.R.; Karin, M. Immunity, inflammation, and cancer. Cell 2010, 140, 883–899. [Google Scholar] [CrossRef] [PubMed]
- Chevrier, S.; Levine, J.H.; Zanotelli, V.R.T.; Silina, K.; Schulz, D.; Bacac, M.; Ries, C.H.; Ailles, L.; Jewett, M.A.S.; Moch, H.; et al. An Immune Atlas of Clear Cell Renal Cell Carcinoma. Cell 2017, 169, 736–749.e18. [Google Scholar] [CrossRef] [PubMed]
- Galon, J.; Mlecnik, B.; Bindea, G.; Angell, H.K.; Berger, A.; Lagorce, C.; Lugli, A.; Zlobec, I.; Hartmann, A.; Bifulco, C.; et al. Towards the introduction of the ‘Immunoscore’ in the classification of malignant tumours. J. Pathol. 2014, 232, 199–209. [Google Scholar] [CrossRef] [PubMed]
- Zeitoun, G.; Sissy, C.E.; Kirilovsky, A.; Anitei, G.; Todosi, A.-M.; Marliot, F.; Haicheur, N.; Lagorce, C.; Berger, A.; Zinzindohoué, F.; et al. The Immunoscore in the Clinical Practice of Patients with Colon and Rectal Cancers. Chir. Buchar. Rom. 1990 2019, 114, 152–161. [Google Scholar] [CrossRef] [PubMed]
- Selvi, I.; Demirci, U.; Bozdogan, N.; Basar, H. The prognostic effect of immunoscore in patients with clear cell renal cell carcinoma: Preliminary results. Int. Urol. Nephrol. 2020, 52, 21–34. [Google Scholar] [CrossRef]
- Stack, E.C.; Wang, C.; Roman, K.A.; Hoyt, C.C. Multiplexed immunohistochemistry, imaging, and quantitation: A review, with an assessment of Tyramide signal amplification, multispectral imaging and multiplex analysis. Methods San Diego Calif. 2014, 70, 46–58. [Google Scholar] [CrossRef]
- Feng, Z.; Puri, S.; Moudgil, T.; Wood, W.; Hoyt, C.C.; Wang, C.; Urba, W.J.; Curti, B.D.; Bifulco, C.B.; Fox, B.A. Multispectral imaging of formalin-fixed tissue predicts ability to generate tumor-infiltrating lymphocytes from melanoma. J. Immunother. Cancer 2015, 3, 47. [Google Scholar] [CrossRef]
- Becht, E.; Giraldo, N.A.; Lacroix, L.; Buttard, B.; Elarouci, N.; Petitprez, F.; Selves, J.; Laurent-Puig, P.; Sautès-Fridman, C.; Fridman, W.H.; et al. Estimating the population abundance of tissue-infiltrating immune and stromal cell populations using gene expression. Genome Biol. 2016, 17, 218. [Google Scholar] [CrossRef]
- Petitprez, F.; Vano, Y.A.; Becht, E.; Giraldo, N.A.; de Reyniès, A.; Sautès-Fridman, C.; Fridman, W.H. Transcriptomic analysis of the tumor microenvironment to guide prognosis and immunotherapies. Cancer Immunol. Immunother. CII 2018, 67, 981–988. [Google Scholar] [CrossRef] [PubMed]
- Charoentong, P.; Finotello, F.; Angelova, M.; Mayer, C.; Efremova, M.; Rieder, D.; Hackl, H.; Trajanoski, Z. Pan-cancer Immunogenomic Analyses Reveal Genotype-Immunophenotype Relationships and Predictors of Response to Checkpoint Blockade. Cell Rep. 2017, 18, 248–262. [Google Scholar] [CrossRef] [PubMed]
- Şenbabaoğlu, Y.; Gejman, R.S.; Winer, A.G.; Liu, M.; Van Allen, E.M.; de Velasco, G.; Miao, D.; Ostrovnaya, I.; Drill, E.; Luna, A.; et al. Tumor immune microenvironment characterization in clear cell renal cell carcinoma identifies prognostic and immunotherapeutically relevant messenger RNA signatures. Genome Biol. 2016, 17, 231. [Google Scholar] [CrossRef] [PubMed]
- Sung, J.; Wang, Y.; Chandrasekaran, S.; Witten, D.M.; Price, N.D. Molecular signatures from omics data: From chaos to consensus. Biotechnol. J. 2012, 7, 946–957. [Google Scholar] [CrossRef] [PubMed]
- Sparano, J.A.; Gray, R.J.; Makower, D.F.; Pritchard, K.I.; Albain, K.S.; Hayes, D.F.; Geyer, C.E.; Dees, E.C.; Perez, E.A.; Olson, J.A.; et al. Prospective Validation of a 21-Gene Expression Assay in Breast Cancer. N. Engl. J. Med. 2015, 373, 2005–2014. [Google Scholar] [CrossRef] [PubMed]
- Sparano, J.A.; Gray, R.J.; Makower, D.F.; Pritchard, K.I.; Albain, K.S.; Hayes, D.F.; Geyer, C.E.; Dees, E.C.; Goetz, M.P.; Olson, J.A.; et al. Adjuvant Chemotherapy Guided by a 21-Gene Expression Assay in Breast Cancer. N. Engl. J. Med. 2018, 379, 111–121. [Google Scholar] [CrossRef] [PubMed]
- Siliņa, K.; Soltermann, A.; Attar, F.M.; Casanova, R.; Uckeley, Z.M.; Thut, H.; Wandres, M.; Isajevs, S.; Cheng, P.; Curioni-Fontecedro, A.; et al. Germinal Centers Determine the Prognostic Relevance of Tertiary Lymphoid Structures and Are Impaired by Corticosteroids in Lung Squamous Cell Carcinoma. Cancer Res. 2018, 78, 1308–1320. [Google Scholar] [CrossRef]
- Ramaglia, V.; Sheikh-Mohamed, S.; Legg, K.; Park, C.; Rojas, O.L.; Zandee, S.; Fu, F.; Ornatsky, O.; Swanson, E.C.; Pitt, D.; et al. Multiplexed imaging of immune cells in staged multiple sclerosis lesions by mass cytometry. eLife 2019, 8. [Google Scholar] [CrossRef]
- Maby, P.; Corneau, A.; Galon, J. Phenotyping of tumor infiltrating immune cells using mass-cytometry (CyTOF). Methods Enzymol. 2020, 632, 339–368. [Google Scholar] [CrossRef]
- Giraldo, N.A.; Becht, E.; Vano, Y.; Petitprez, F.; Lacroix, L.; Validire, P.; Sanchez-Salas, R.; Ingels, A.; Oudard, S.; Moatti, A.; et al. Tumor-Infiltrating and Peripheral Blood T-cell Immunophenotypes Predict Early Relapse in Localized Clear Cell Renal Cell Carcinoma. Clin. Cancer Res. Off. J. Am. Assoc. Cancer Res. 2017, 23, 4416–4428. [Google Scholar] [CrossRef]
- Dutertre, C.-A.; Becht, E.; Irac, S.E.; Khalilnezhad, A.; Narang, V.; Khalilnezhad, S.; Ng, P.Y.; van den Hoogen, L.L.; Leong, J.Y.; Lee, B.; et al. Single-Cell Analysis of Human Mononuclear Phagocytes Reveals Subset-Defining Markers and Identifies Circulating Inflammatory Dendritic Cells. Immunity 2019, 51, 573–589. [Google Scholar] [CrossRef] [PubMed]
- Stubbs, M.; McSheehy, P.M.; Griffiths, J.R.; Bashford, C.L. Causes and consequences of tumour acidity and implications for treatment. Mol. Med. Today 2000, 6, 15–19. [Google Scholar] [CrossRef]
- Sormendi, S.; Wielockx, B. Hypoxia Pathway Proteins as Central Mediators of Metabolism in the Tumor Cells and Their Microenvironment. Front. Immunol. 2018, 9, 40. [Google Scholar] [CrossRef] [PubMed]
- Garcia-Lora, A.; Algarra, I.; Garrido, F. MHC class I antigens, immune surveillance, and tumor immune escape. J. Cell. Physiol. 2003, 195, 346–355. [Google Scholar] [CrossRef] [PubMed]
- Zhang, J.; Shi, Z.; Xu, X.; Yu, Z.; Mi, J. The influence of microenvironment on tumor immunotherapy. FEBS J. 2019, 286, 4160–4175. [Google Scholar] [CrossRef] [PubMed]
- Khan, K.A.; Kerbel, R.S. Improving immunotherapy outcomes with anti-angiogenic treatments and vice versa. Nat. Rev. Clin. Oncol. 2018, 15, 310–324. [Google Scholar] [CrossRef]
- Romero-Garcia, S.; Moreno-Altamirano, M.M.B.; Prado-Garcia, H.; Sánchez-García, F.J. Lactate Contribution to the Tumor Microenvironment: Mechanisms, Effects on Immune Cells and Therapeutic Relevance. Front. Immunol. 2016, 7, 52. [Google Scholar] [CrossRef] [PubMed]
- Fridman, W.H.; Zitvogel, L.; Sautès-Fridman, C.; Kroemer, G. The immune contexture in cancer prognosis and treatment. Nat. Rev. Clin. Oncol. 2017, 14, 717–734. [Google Scholar] [CrossRef]
- Giraldo, N.A.; Becht, E.; Pagès, F.; Skliris, G.; Verkarre, V.; Vano, Y.; Mejean, A.; Saint-Aubert, N.; Lacroix, L.; Natario, I.; et al. Orchestration and Prognostic Significance of Immune Checkpoints in the Microenvironment of Primary and Metastatic Renal Cell Cancer. Clin. Cancer Res. Off. J. Am. Assoc. Cancer Res. 2015, 21, 3031–3040. [Google Scholar] [CrossRef]
- Long, L.; Zhang, X.; Chen, F.; Pan, Q.; Phiphatwatchara, P.; Zeng, Y.; Chen, H. The promising immune checkpoint LAG-3: From tumor microenvironment to cancer immunotherapy. Genes Cancer 2018, 9, 176–189. [Google Scholar] [CrossRef]
- Brignone, C.; Escudier, B.; Grygar, C.; Marcu, M.; Triebel, F. A phase I pharmacokinetic and biological correlative study of IMP321, a novel MHC class II agonist, in patients with advanced renal cell carcinoma. Clin. Cancer Res. Off. J. Am. Assoc. Cancer Res. 2009, 15, 6225–6231. [Google Scholar] [CrossRef] [PubMed]
- Granier, C.; Dariane, C.; Combe, P.; Verkarre, V.; Urien, S.; Badoual, C.; Roussel, H.; Mandavit, M.; Ravel, P.; Sibony, M.; et al. Tim-3 Expression on Tumor-Infiltrating PD-1+CD8+ T Cells Correlates with Poor Clinical Outcome in Renal Cell Carcinoma. Cancer Res. 2017, 77, 1075–1082. [Google Scholar] [CrossRef] [PubMed]
- Evaluation of predictive biomarkers for nivolumab in patients (pts) with metastatic clear cell renal cell carcinoma (mccRCC) from the CheckMate-025 (CM-025) trial. J. Clin. Oncol. 2020, 38, 5023. [CrossRef]
- Pignon, J.-C.; Jegede, O.; Shukla, S.A.; Braun, D.A.; Horak, C.E.; Wind-Rotolo, M.; Ishii, Y.; Catalano, P.J.; Grosha, J.; Flaifel, A.; et al. irRECIST for the Evaluation of Candidate Biomarkers of Response to Nivolumab in Metastatic Clear Cell Renal Cell Carcinoma: Analysis of a Phase II Prospective Clinical Trial. Clin. Cancer Res. Off. J. Am. Assoc. Cancer Res. 2019, 25, 2174–2184. [Google Scholar] [CrossRef] [PubMed]
- Biswas, S.K.; Allavena, P.; Mantovani, A. Tumor-associated macrophages: Functional diversity, clinical significance, and open questions. Semin. Immunopathol. 2013, 35, 585–600. [Google Scholar] [CrossRef] [PubMed]
- Wynn, T.A.; Chawla, A.; Pollard, J.W. Macrophage biology in development, homeostasis and disease. Nature 2013, 496, 445–455. [Google Scholar] [CrossRef]
- Kadomoto, S.; Izumi, K.; Hiratsuka, K.; Nakano, T.; Naito, R.; Makino, T.; Iwamoto, H.; Yaegashi, H.; Shigehara, K.; Kadono, Y.; et al. Tumor-Associated Macrophages Induce Migration of Renal Cell Carcinoma Cells via Activation of the CCL20-CCR6 Axis. Cancers 2019, 12, 89. [Google Scholar] [CrossRef]
- Santoni, M.; Massari, F.; Amantini, C.; Nabissi, M.; Maines, F.; Burattini, L.; Berardi, R.; Santoni, G.; Montironi, R.; Tortora, G.; et al. Emerging role of tumor-associated macrophages as therapeutic targets in patients with metastatic renal cell carcinoma. Cancer Immunol. Immunother. CII 2013, 62, 1757–1768. [Google Scholar] [CrossRef]
- Daurkin, I.; Eruslanov, E.; Stoffs, T.; Perrin, G.Q.; Algood, C.; Gilbert, S.M.; Rosser, C.J.; Su, L.-M.; Vieweg, J.; Kusmartsev, S. Tumor-associated macrophages mediate immunosuppression in the renal cancer microenvironment by activating the 15-lipoxygenase-2 pathway. Cancer Res. 2011, 71, 6400–6409. [Google Scholar] [CrossRef]
- Ries, C.H.; Cannarile, M.A.; Hoves, S.; Benz, J.; Wartha, K.; Runza, V.; Rey-Giraud, F.; Pradel, L.P.; Feuerhake, F.; Klaman, I.; et al. Targeting tumor-associated macrophages with anti-CSF-1R antibody reveals a strategy for cancer therapy. Cancer Cell 2014, 25, 846–859. [Google Scholar] [CrossRef]
- Yan, X.; Sheng, X.; Tang, B.; Chi, Z.; Cui, C.; Si, L.; Mao, L.L.; Lian, B.; Li, S.; Zhou, L.; et al. Anti-VEGFR, PDGFR, and CSF1R tyrosine kinase inhibitor CM082 (X-82) in combination with everolimus for treatment of metastatic renal cell carcinoma: A phase 1 clinical trial. Lancet Oncol. 2017, 18, S8. [Google Scholar] [CrossRef]
- Voss, M.H.; Buros Novik, J.; Hellmann, M.D.; Ball, M.; Hakimi, A.A.; Miao, D.; Margolis, C.; Horak, C.; Wind-Rotolo, M.; De Velasco, G.; et al. Correlation of degree of tumor immune infiltration and insertion-and-deletion (indel) burden with outcome on programmed death 1 (PD1) therapy in advanced renal cell cancer (RCC). J. Clin. Oncol. 2018, 36, 4518. [Google Scholar] [CrossRef]
- Togashi, Y.; Shitara, K.; Nishikawa, H. Regulatory T cells in cancer immunosuppression—Implications for anticancer therapy. Nat. Rev. Clin. Oncol. 2019, 16, 356–371. [Google Scholar] [CrossRef] [PubMed]
- Vignali, D.A.A.; Collison, L.W.; Workman, C.J. How regulatory T cells work. Nat. Rev. Immunol. 2008, 8, 523–532. [Google Scholar] [CrossRef]
- Comprehensive molecular characterization of clear cell renal cell carcinoma. Nature 2013, 499, 43–49. [CrossRef] [PubMed]
- Huijts, C.M.; Lougheed, S.M.; Bodalal, Z.; van Herpen, C.M.; Hamberg, P.; Tascilar, M.; Haanen, J.B.; Verheul, H.M.; de Gruijl, T.D.; van der Vliet, H.J.; et al. The effect of everolimus and low-dose cyclophosphamide on immune cell subsets in patients with metastatic renal cell carcinoma: Results from a phase I clinical trial. Cancer Immunol. Immunother. CII 2019, 68, 503–515. [Google Scholar] [CrossRef]
- Bruno, T.C. New predictors for immunotherapy responses sharpen our view of the tumour microenvironment. Nature 2020, 577, 474–476. [Google Scholar] [CrossRef]
- Rosser, E.C.; Mauri, C. Regulatory B cells: Origin, phenotype, and function. Immunity 2015, 42, 607–612. [Google Scholar] [CrossRef]
- DeFalco, J.; Harbell, M.; Manning-Bog, A.; Baia, G.; Scholz, A.; Millare, B.; Sumi, M.; Zhang, D.; Chu, F.; Dowd, C.; et al. Non-progressing cancer patients have persistent B cell responses expressing shared antibody paratopes that target public tumor antigens. Clin. Immunol. Orlando Fla 2018, 187, 37–45. [Google Scholar] [CrossRef]
- Gunderson, A.J.; Coussens, L.M. B cells and their mediators as targets for therapy in solid tumors. Exp. Cell Res. 2013, 319, 1644–1649. [Google Scholar] [CrossRef]
- Sarvaria, A.; Madrigal, J.A.; Saudemont, A. B cell regulation in cancer and anti-tumor immunity. Cell. Mol. Immunol. 2017, 14, 662–674. [Google Scholar] [CrossRef] [PubMed]
- Helmink, B.A.; Reddy, S.M.; Gao, J.; Zhang, S.; Basar, R.; Thakur, R.; Yizhak, K.; Sade-Feldman, M.; Blando, J.; Han, G.; et al. B cells and tertiary lymphoid structures promote immunotherapy response. Nature 2020, 577, 549–555. [Google Scholar] [CrossRef] [PubMed]
- Cabrita, R.; Lauss, M.; Sanna, A.; Donia, M.; Skaarup Larsen, M.; Mitra, S.; Johansson, I.; Phung, B.; Harbst, K.; Vallon-Christersson, J.; et al. Tertiary lymphoid structures improve immunotherapy and survival in melanoma. Nature 2020, 577, 561–565. [Google Scholar] [CrossRef] [PubMed]
- Petitprez, F.; de Reyniès, A.; Keung, E.Z.; Chen, T.W.-W.; Sun, C.-M.; Calderaro, J.; Jeng, Y.-M.; Hsiao, L.-P.; Lacroix, L.; Bougoüin, A.; et al. B cells are associated with survival and immunotherapy response in sarcoma. Nature 2020, 577, 556–560. [Google Scholar] [CrossRef]
- Finkin, S.; Yuan, D.; Stein, I.; Taniguchi, K.; Weber, A.; Unger, K.; Browning, J.L.; Goossens, N.; Nakagawa, S.; Gunasekaran, G.; et al. Ectopic lymphoid structures function as microniches for tumor progenitor cells in hepatocellular carcinoma. Nat. Immunol. 2015, 16, 1235–1244. [Google Scholar] [CrossRef]
- Dieu-Nosjean, M.-C.; Goc, J.; Giraldo, N.A.; Sautès-Fridman, C.; Fridman, W.H. Tertiary lymphoid structures in cancer and beyond. Trends Immunol. 2014, 35, 571–580. [Google Scholar] [CrossRef]
- Veglia, F.; Perego, M.; Gabrilovich, D. Myeloid-derived suppressor cells coming of age. Nat. Immunol. 2018, 19, 108–119. [Google Scholar] [CrossRef]
- Dumitru, C.A.; Moses, K.; Trellakis, S.; Lang, S.; Brandau, S. Neutrophils and granulocytic myeloid-derived suppressor cells: Immunophenotyping, cell biology and clinical relevance in human oncology. Cancer Immunol. Immunother. CII 2012, 61, 1155–1167. [Google Scholar] [CrossRef]
- Gabrilovich, D.I.; Bronte, V.; Chen, S.-H.; Colombo, M.P.; Ochoa, A.; Ostrand-Rosenberg, S.; Schreiber, H. The terminology issue for myeloid-derived suppressor cells. Cancer Res. 2007, 67, 425, author reply 426. [Google Scholar] [CrossRef]
- Gabrilovich, D.I.; Ostrand-Rosenberg, S.; Bronte, V. Coordinated regulation of myeloid cells by tumours. Nat. Rev. Immunol. 2012, 12, 253–268. [Google Scholar] [CrossRef]
- Weber, R.; Fleming, V.; Hu, X.; Nagibin, V.; Groth, C.; Altevogt, P.; Utikal, J.; Umansky, V. Myeloid-Derived Suppressor Cells Hinder the Anti-Cancer Activity of Immune Checkpoint Inhibitors. Front. Immunol. 2018, 9, 1310. [Google Scholar] [CrossRef] [PubMed]
- Prognostic Role of Pretreatment Circulating MDSCs in Patients with Solid Malignancies: A Meta-Analysis of 40 Studies. Available online: https://www.ncbi.nlm.nih.gov/pmc/articles/PMC6169582/ (accessed on 29 March 2020).
- Najjar, Y.G.; Rayman, P.; Jia, X.; Pavicic, P.G.; Rini, B.I.; Tannenbaum, C.; Ko, J.; Haywood, S.; Cohen, P.; Hamilton, T.; et al. Myeloid-Derived Suppressor Cell Subset Accumulation in Renal Cell Carcinoma Parenchyma Is Associated with Intratumoral Expression of IL1β, IL8, CXCL5, and Mip-1α. Clin. Cancer Res. Off. J. Am. Assoc. Cancer Res. 2017, 23, 2346–2355. [Google Scholar] [CrossRef] [PubMed]
- Kroesen, M.; Gielen, P.; Brok, I.C.; Armandari, I.; Hoogerbrugge, P.M.; Adema, G.J. HDAC inhibitors and immunotherapy; a double edged sword? Oncotarget 2014, 5, 6558–6572. [Google Scholar] [CrossRef] [PubMed]
- Youn, J.-I.; Kumar, V.; Collazo, M.; Nefedova, Y.; Condamine, T.; Cheng, P.; Villagra, A.; Antonia, S.; McCaffrey, J.C.; Fishman, M.; et al. Epigenetic silencing of retinoblastoma gene regulates pathologic differentiation of myeloid cells in cancer. Nat. Immunol. 2013, 14, 211–220. [Google Scholar] [CrossRef]
- Orillion, A.; Hashimoto, A.; Damayanti, N.; Shen, L.; Adelaiye-Ogala, R.; Arisa, S.; Chintala, S.; Ordentlich, P.; Kao, C.; Elzey, B.; et al. Entinostat Neutralizes Myeloid-Derived Suppressor Cells and Enhances the Antitumor Effect of PD-1 Inhibition in Murine Models of Lung and Renal Cell Carcinoma. Clin. Cancer Res. Off. J. Am. Assoc. Cancer Res. 2017, 23, 5187–5201. [Google Scholar] [CrossRef]
- Kojima, Y.; Acar, A.; Eaton, E.N.; Mellody, K.T.; Scheel, C.; Ben-Porath, I.; Onder, T.T.; Wang, Z.C.; Richardson, A.L.; Weinberg, R.A.; et al. Autocrine TGF-β and stromal cell-derived factor-1 (SDF-1) signaling drives the evolution of tumor-promoting mammary stromal myofibroblasts. Proc. Natl. Acad. Sci. USA 2010, 107, 20009–20014. [Google Scholar] [CrossRef]
- Kawada, M.; Seno, H.; Kanda, K.; Nakanishi, Y.; Akitake, R.; Komekado, H.; Kawada, K.; Sakai, Y.; Mizoguchi, E.; Chiba, T. Chitinase 3-like 1 promotes macrophage recruitment and angiogenesis in colorectal cancer. Oncogene 2012, 31, 3111–3123. [Google Scholar] [CrossRef]
- Bauer, M.; Su, G.; Casper, C.; He, R.; Rehrauer, W.; Friedl, A. Heterogeneity of gene expression in stromal fibroblasts of human breast carcinomas and normal breast. Oncogene 2010, 29, 1732–1740. [Google Scholar] [CrossRef]
- Pidsley, R.; Lawrence, M.G.; Zotenko, E.; Niranjan, B.; Statham, A.; Song, J.; Chabanon, R.M.; Qu, W.; Wang, H.; Richards, M.; et al. Enduring epigenetic landmarks define the cancer microenvironment. Genome Res. 2018, 28, 625–638. [Google Scholar] [CrossRef]
- Liu, T.; Zhou, L.; Li, D.; Andl, T.; Zhang, Y. Cancer-Associated Fibroblasts Build and Secure the Tumor Microenvironment. Front. Cell Dev. Biol. 2019, 7, 60. [Google Scholar] [CrossRef]
- Bellomo, C.; Caja, L.; Moustakas, A. Transforming growth factor β as regulator of cancer stemness and metastasis. Br. J. Cancer 2016, 115, 761–769. [Google Scholar] [CrossRef] [PubMed]
- Ostman, A.; Augsten, M. Cancer-associated fibroblasts and tumor growth--bystanders turning into key players. Curr. Opin. Genet. Dev. 2009, 19, 67–73. [Google Scholar] [CrossRef] [PubMed]
- López, J.I.; Errarte, P.; Erramuzpe, A.; Guarch, R.; Cortés, J.M.; Angulo, J.C.; Pulido, R.; Irazusta, J.; Llarena, R.; Larrinaga, G. Fibroblast activation protein predicts prognosis in clear cell renal cell carcinoma. Hum. Pathol. 2016, 54, 100–105. [Google Scholar] [CrossRef] [PubMed]
- D’Esposito, V.; Liguoro, D.; Ambrosio, M.R.; Collina, F.; Cantile, M.; Spinelli, R.; Raciti, G.A.; Miele, C.; Valentino, R.; Campiglia, P.; et al. Adipose microenvironment promotes triple negative breast cancer cell invasiveness and dissemination by producing CCL5. Oncotarget 2016, 7, 24495–24509. [Google Scholar] [CrossRef] [PubMed]
- Iyengar, P.; Combs, T.P.; Shah, S.J.; Gouon-Evans, V.; Pollard, J.W.; Albanese, C.; Flanagan, L.; Tenniswood, M.P.; Guha, C.; Lisanti, M.P.; et al. Adipocyte-secreted factors synergistically promote mammary tumorigenesis through induction of anti-apoptotic transcriptional programs and proto-oncogene stabilization. Oncogene 2003, 22, 6408–6423. [Google Scholar] [CrossRef] [PubMed]
- Castellot, J.J.; Karnovsky, M.J.; Spiegelman, B.M. Differentiation-dependent stimulation of neovascularization and endothelial cell chemotaxis by 3T3 adipocytes. Proc. Natl. Acad. Sci. USA 1982, 79, 5597–5601. [Google Scholar] [CrossRef]
- Hosogai, N.; Fukuhara, A.; Oshima, K.; Miyata, Y.; Tanaka, S.; Segawa, K.; Furukawa, S.; Tochino, Y.; Komuro, R.; Matsuda, M.; et al. Adipose tissue hypoxia in obesity and its impact on adipocytokine dysregulation. Diabetes 2007, 56, 901–911. [Google Scholar] [CrossRef]
- Muoio, D.M.; Lynis Dohm, G. Peripheral metabolic actions of leptin. Best Pract. Res. Clin. Endocrinol. Metab. 2002, 16, 653–666. [Google Scholar] [CrossRef]
- Campo-Verde-Arbocco, F.; López-Laur, J.D.; Romeo, L.R.; Giorlando, N.; Bruna, F.A.; Contador, D.E.; López-Fontana, G.; Santiano, F.E.; Sasso, C.V.; Zyla, L.E.; et al. Human renal adipose tissue induces the invasion and progression of renal cell carcinoma. Oncotarget 2017, 8, 94223–94234. [Google Scholar] [CrossRef]
- Reck, M.; Rodríguez-Abreu, D.; Robinson, A.G.; Hui, R.; Csőszi, T.; Fülöp, A.; Gottfried, M.; Peled, N.; Tafreshi, A.; Cuffe, S.; et al. Pembrolizumab versus Chemotherapy for PD-L1-Positive Non-Small-Cell Lung Cancer. N. Engl. J. Med. 2016, 375, 1823–1833. [Google Scholar] [CrossRef]
- Motzer, R.J.; Penkov, K.; Haanen, J.; Rini, B.; Albiges, L.; Campbell, M.T.; Venugopal, B.; Kollmannsberger, C.; Negrier, S.; Uemura, M.; et al. Avelumab plus Axitinib versus Sunitinib for Advanced Renal-Cell Carcinoma. N. Engl. J. Med. 2019, 380, 1103–1115. [Google Scholar] [CrossRef] [PubMed]
- Ilie, M.; Long-Mira, E.; Bence, C.; Butori, C.; Lassalle, S.; Bouhlel, L.; Fazzalari, L.; Zahaf, K.; Lalvée, S.; Washetine, K.; et al. Comparative study of the PD-L1 status between surgically resected specimens and matched biopsies of NSCLC patients reveal major discordances: A potential issue for anti-PD-L1 therapeutic strategies. Ann. Oncol. 2016, 27, 147–153. [Google Scholar] [CrossRef] [PubMed]
- Stenzel, P.J.; Schindeldecker, M.; Tagscherer, K.E.; Foersch, S.; Herpel, E.; Hohenfellner, M.; Hatiboglu, G.; Alt, J.; Thomas, C.; Haferkamp, A.; et al. Prognostic and Predictive Value of Tumor-infiltrating Leukocytes and of Immune Checkpoint Molecules PD1 and PDL1 in Clear Cell Renal Cell Carcinoma. Transl. Oncol. 2020, 13, 336–345. [Google Scholar] [CrossRef] [PubMed]
- McDermott, D.F.; Huseni, M.A.; Atkins, M.B.; Motzer, R.J.; Rini, B.I.; Escudier, B.; Fong, L.; Joseph, R.W.; Pal, S.K.; Reeves, J.A.; et al. Clinical activity and molecular correlates of response to atezolizumab alone or in combination with bevacizumab versus sunitinib in renal cell carcinoma. Nat. Med. 2018, 24, 749–757. [Google Scholar] [CrossRef] [PubMed]
- The Human Tumor Microenvironment|SpringerLink. Available online: http://link-springer-com-443.webvpn.fjmu.edu.cn/chapter/10.1007%2F978-3-319-62431-0_2 (accessed on 17 December 2020).
- Rini, B.I.; Powles, T.; Atkins, M.B.; Escudier, B.; McDermott, D.F.; Suarez, C.; Bracarda, S.; Stadler, W.M.; Donskov, F.; Lee, J.L.; et al. Atezolizumab plus bevacizumab versus sunitinib in patients with previously untreated metastatic renal cell carcinoma (IMmotion151): A multicentre, open-label, phase 3, randomised controlled trial. Lancet Lond. Engl. 2019, 393, 2404–2415. [Google Scholar] [CrossRef]
- Rini, B.I.; Huseni, M.; Atkins, M.B.; McDermott, D.F.; Powles, T.B.; Escudier, B.; Banchereau, R.; Liu, L.-F.; Leng, N.; Fan, J.; et al. Molecular correlates differentiate response to atezolizumab (atezo) + bevacizumab (bev) vs sunitinib (sun): Results from a phase III study (IMmotion151) in untreated metastatic renal cell carcinoma (mRCC). Ann. Oncol. 2018, 29, viii724–viii725. [Google Scholar] [CrossRef]
- Hakimi, A.A.; Voss, M.H.; Kuo, F.; Sanchez, A.; Liu, M.; Nixon, B.G.; Vuong, L.; Ostrovnaya, I.; Chen, Y.-B.; Reuter, V.; et al. Transcriptomic Profiling of the Tumor Microenvironment Reveals Distinct Subgroups of Clear Cell Renal Cell Cancer: Data from a Randomized Phase III Trial. Cancer Discov. 2019, 9, 510–525. [Google Scholar] [CrossRef]
- Choueiri, T.K.; Albiges, L.; Haanen, J.B.A.G.; Larkin, J.M.G.; Uemura, M.; Pal, S.K.; Gravis, G.; Campbell, M.T.; Penkov, K.; Lee, J.-L.; et al. Biomarker analyses from JAVELIN Renal 101: Avelumab + axitinib (A+Ax) versus sunitinib (S) in advanced renal cell carcinoma (aRCC). J. Clin. Oncol. 2019, 37, 101. [Google Scholar] [CrossRef]
- Biomarker Analyses from the Phase III CheckMate 214 Trial of Nivolumab Plus Ipilimumab (N+I) or Sunitinib (S) in Advanced Renal Cell Carcinoma (aRCC). J. Clin. Oncol. Available online: https://ascopubs.org/doi/abs/10.1200/JCO.2020.38.15_suppl.5009 (accessed on 4 June 2020).
- Haas, N.B.; Manola, J.; Uzzo, R.G.; Flaherty, K.T.; Wood, C.G.; Kane, C.; Jewett, M.; Dutcher, J.P.; Atkins, M.B.; Pins, M.; et al. Adjuvant sunitinib or sorafenib for high-risk, non-metastatic renal-cell carcinoma (ECOG-ACRIN E2805): A double-blind, placebo-controlled, randomised, phase 3 trial. Lancet Lond. Engl. 2016, 387, 2008–2016. [Google Scholar] [CrossRef]
- Miao, D.; Margolis, C.A.; Gao, W.; Voss, M.H.; Li, W.; Martini, D.J.; Norton, C.; Bossé, D.; Wankowicz, S.M.; Cullen, D.; et al. Genomic correlates of response to immune checkpoint therapies in clear cell renal cell carcinoma. Science 2018, 359, 801–806. [Google Scholar] [CrossRef]
- Ravaud, A.; Motzer, R.J.; Pandha, H.S.; George, D.J.; Pantuck, A.J.; Patel, A.; Chang, Y.-H.; Escudier, B.; Donskov, F.; Magheli, A.; et al. Adjuvant Sunitinib in High-Risk Renal-Cell Carcinoma after Nephrectomy. N. Engl. J. Med. 2016, 375, 2246–2254. [Google Scholar] [CrossRef] [PubMed]
- Gerlinger, M.; Rowan, A.J.; Horswell, S.; Math, M.; Larkin, J.; Endesfelder, D.; Gronroos, E.; Martinez, P.; Matthews, N.; Stewart, A.; et al. Intratumor heterogeneity and branched evolution revealed by multiregion sequencing. N. Engl. J. Med. 2012, 366, 883–892. [Google Scholar] [CrossRef] [PubMed]
- Gerlinger, M.; Horswell, S.; Larkin, J.; Rowan, A.J.; Salm, M.P.; Varela, I.; Fisher, R.; McGranahan, N.; Matthews, N.; Santos, C.R.; et al. Genomic architecture and evolution of clear cell renal cell carcinomas defined by multiregion sequencing. Nat. Genet. 2014, 46, 225–233. [Google Scholar] [CrossRef] [PubMed]
- Serie, D.J.; Joseph, R.W.; Cheville, J.C.; Ho, T.H.; Parasramka, M.; Hilton, T.; Thompson, R.H.; Leibovich, B.C.; Parker, A.S.; Eckel-Passow, J.E. Clear Cell Type A and B Molecular Subtypes in Metastatic Clear Cell Renal Cell Carcinoma: Tumor Heterogeneity and Aggressiveness. Eur. Urol. 2017, 71, 979–985. [Google Scholar] [CrossRef] [PubMed]
- Krieg, C.; Nowicka, M.; Guglietta, S.; Schindler, S.; Hartmann, F.J.; Weber, L.M.; Dummer, R.; Robinson, M.D.; Levesque, M.P.; Becher, B. High-dimensional single-cell analysis predicts response to anti-PD-1 immunotherapy. Nat. Med. 2018, 24, 144–153. [Google Scholar] [CrossRef]
- Epaillard, N.; Simonaggio, A.; Elaidi, R.; Azzouz, F.; Braychenko, E.; Thibault, C.; Sun, C.-M.; Moreira, M.; Oudard, S.; Vano, Y.-A. BIONIKK: A phase 2 biomarker driven trial with nivolumab and ipilimumab or VEGFR tyrosine kinase inhibitor (TKI) in naïve metastatic kidney cancer. Bull. Cancer 2020, 107, eS22–eS27. [Google Scholar] [CrossRef]
- Vano, Y.; Elaidi, R.T.; Bennamoun, M.; Chevreau, C.M.; Borchiellini, D.; Pannier, D.; Maillet, D.; Gross-Goupil, M.; Tournigand, C.; Laguerre, B.; et al. LBA25 Results from the phase II biomarker driven trial with nivolumab (N) and ipilimumab or VEGFR tyrosine kinase inhibitor (TKI) in naïve metastatic kidney cancer (m-ccRCC) patients (pts): The BIONIKK trial. Ann. Oncol. 2020, 31, S1157. [Google Scholar] [CrossRef]
- Verbiest, A.; Renders, I.; Caruso, S.; Couchy, G.; Job, S.; Laenen, A.; Verkarre, V.; Rioux-Leclercq, N.; Schöffski, P.; Vano, Y.; et al. Clear-cell Renal Cell Carcinoma: Molecular Characterization of IMDC Risk Groups and Sarcomatoid Tumors. Clin. Genitourin. Cancer 2019, 17, e981–e994. [Google Scholar] [CrossRef]


| TME Element | Status | Associated Prognostic in RCC | Predictive Value for Response to ICI in ccRCC |
|---|---|---|---|
| Cells | |||
| CD8+ T cells [37,38]. | High density | Poor | Insufficient data |
| Regulatory CD4+ T cells [54] | High density | Poor | No |
| Tumor-associated Macrophages [50] | High density | Poor | Insufficient data |
| B cells [61] | High density | Good | Insufficient data |
| Tertiary Lymphoid Structure [56,61] | High density | Good | Insufficient data |
| Immune checkpoints | |||
| LAG3 [42,43] | Overexpression | Poor | Insufficient data |
| TIM3 [42,43] | Overexpression | Poor * | Insufficient data |
| PD-L1 [9,10,91,94,95] | Overexpression | Poor | No ** |
| Signatures | Study Design | Number of Patients | Genes Involved in the Signature | Treatments | Biological Material Needed | Study Method | Predictive Value of Response | |
|---|---|---|---|---|---|---|---|---|
| TKI | ICI | |||||||
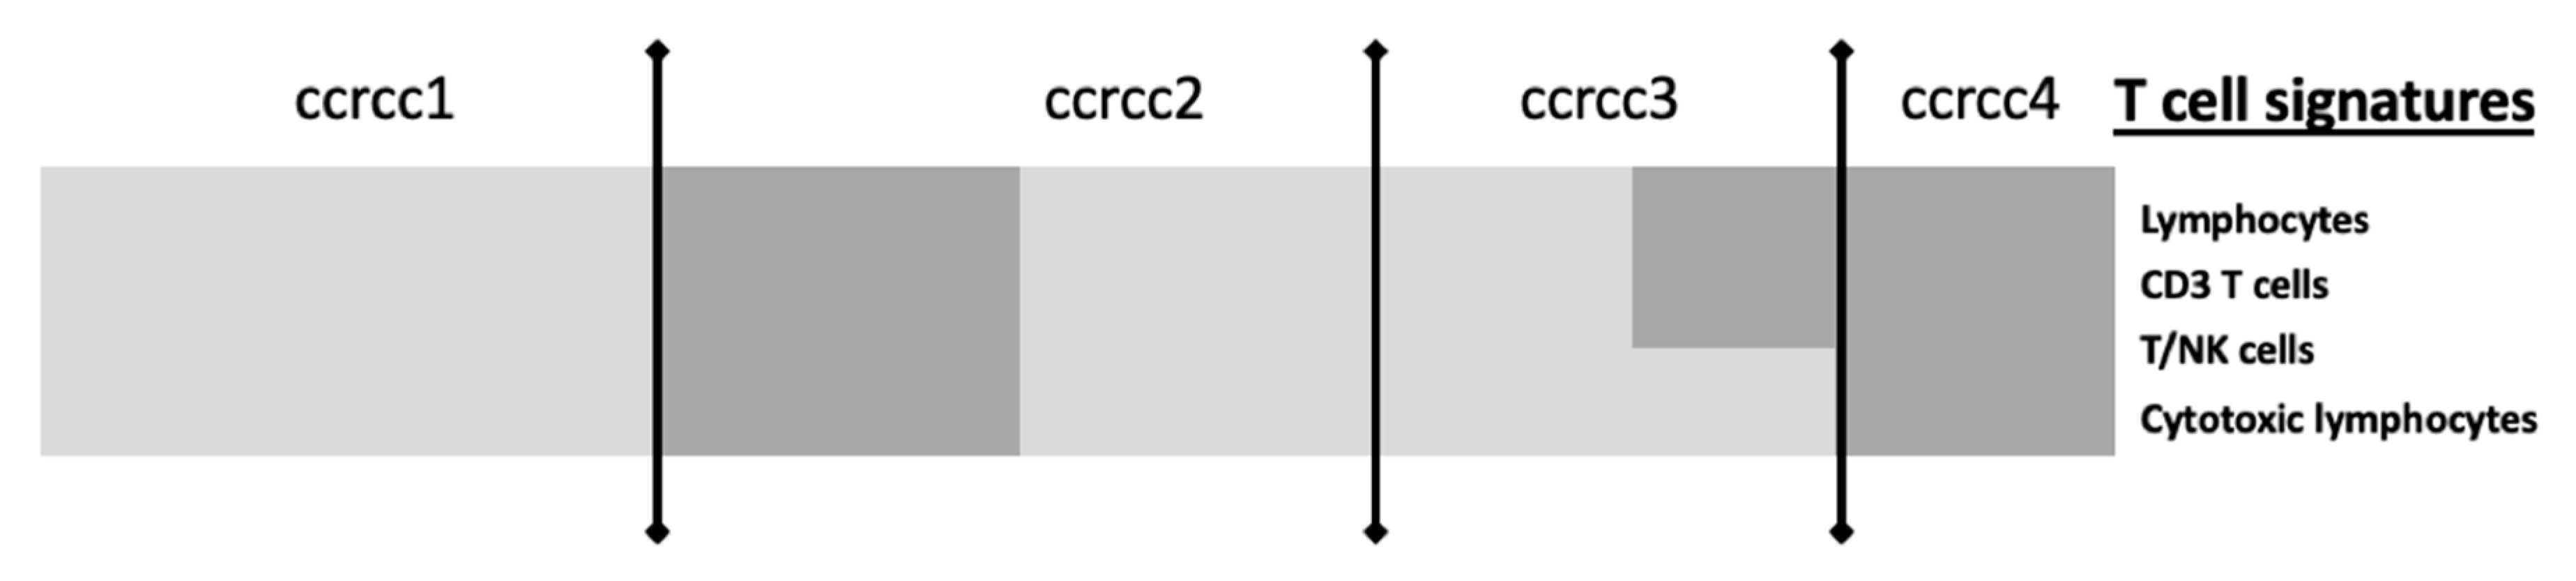
| CIT: classification ccrcc 1-2-3-4 Beuselinck et al. [93] | Retrospective study | 53 (exploratory cohort) 47 (validation cohort) | Inflammation, myeloid activation, myeloid cells migration, Th1/ Th2 polarization, T cell, CMH I, TGFb, IL10, IL17 | Sunitinib | Frozen samples | micro-array (exploratory cohort) RT-qPCR (validation cohort) | YES improved ORR, PFS and OS for ccrcc2 et 3 groups | On going (BIONIKK phase II clinical trial NCT 02960906) |
| IMmotion 150 McDermott et al. [62] IMmotion 151 Rini et al. [103] | Randomized phase II and phase III prospective studies | 300 (IMmotion 150) 851 (IMmotion 151) | Angiogenesis, immune response, IFNg, inflammation, myeloid cells | Atezolizumab-bevacizumab vs sunitinib (Atezolizumab-bevacizumab vs atezolizumab pour la phase II) | FFPE samples | RNAseq | YES Improved PFS with sunitinib for Angiohigh | YES Improved PFS with atezolizumab-bevacizumab for Angiolow et Teffhigh |
| JAVELIN Renal 101 Choueiri et al. [96] | Randomized phase III prospective study | 886 | Immune response (TcR signalisation, activation-proliferation and T cells differentiation), chimiokines, NK | Avelumab-axitinib vs sunitinib | FFPE samples | RNAseq | NO | YES Improved PFS with avelumab-axitinib for pts with high expression |
Publisher’s Note: MDPI stays neutral with regard to jurisdictional claims in published maps and institutional affiliations. |
© 2021 by the authors. Licensee MDPI, Basel, Switzerland. This article is an open access article distributed under the terms and conditions of the Creative Commons Attribution (CC BY) license (http://creativecommons.org/licenses/by/4.0/).
Share and Cite
Simonaggio, A.; Epaillard, N.; Pobel, C.; Moreira, M.; Oudard, S.; Vano, Y.-A. Tumor Microenvironment Features as Predictive Biomarkers of Response to Immune Checkpoint Inhibitors (ICI) in Metastatic Clear Cell Renal Cell Carcinoma (mccRCC). Cancers 2021, 13, 231. https://doi.org/10.3390/cancers13020231
Simonaggio A, Epaillard N, Pobel C, Moreira M, Oudard S, Vano Y-A. Tumor Microenvironment Features as Predictive Biomarkers of Response to Immune Checkpoint Inhibitors (ICI) in Metastatic Clear Cell Renal Cell Carcinoma (mccRCC). Cancers. 2021; 13(2):231. https://doi.org/10.3390/cancers13020231
Chicago/Turabian StyleSimonaggio, Audrey, Nicolas Epaillard, Cédric Pobel, Marco Moreira, Stéphane Oudard, and Yann-Alexandre Vano. 2021. "Tumor Microenvironment Features as Predictive Biomarkers of Response to Immune Checkpoint Inhibitors (ICI) in Metastatic Clear Cell Renal Cell Carcinoma (mccRCC)" Cancers 13, no. 2: 231. https://doi.org/10.3390/cancers13020231
APA StyleSimonaggio, A., Epaillard, N., Pobel, C., Moreira, M., Oudard, S., & Vano, Y.-A. (2021). Tumor Microenvironment Features as Predictive Biomarkers of Response to Immune Checkpoint Inhibitors (ICI) in Metastatic Clear Cell Renal Cell Carcinoma (mccRCC). Cancers, 13(2), 231. https://doi.org/10.3390/cancers13020231