
Circulating Levels of the Interferon-γ-Regulated Chemokines CXCL10/CXCL11, IL-6 and HGF Predict Outcome in Metastatic Renal Cell Carcinoma Patients Treated with Antiangiogenic Therapy

 , , ,
, , ,  , ,
, ,
Abstract
Simple Summary
Abstract
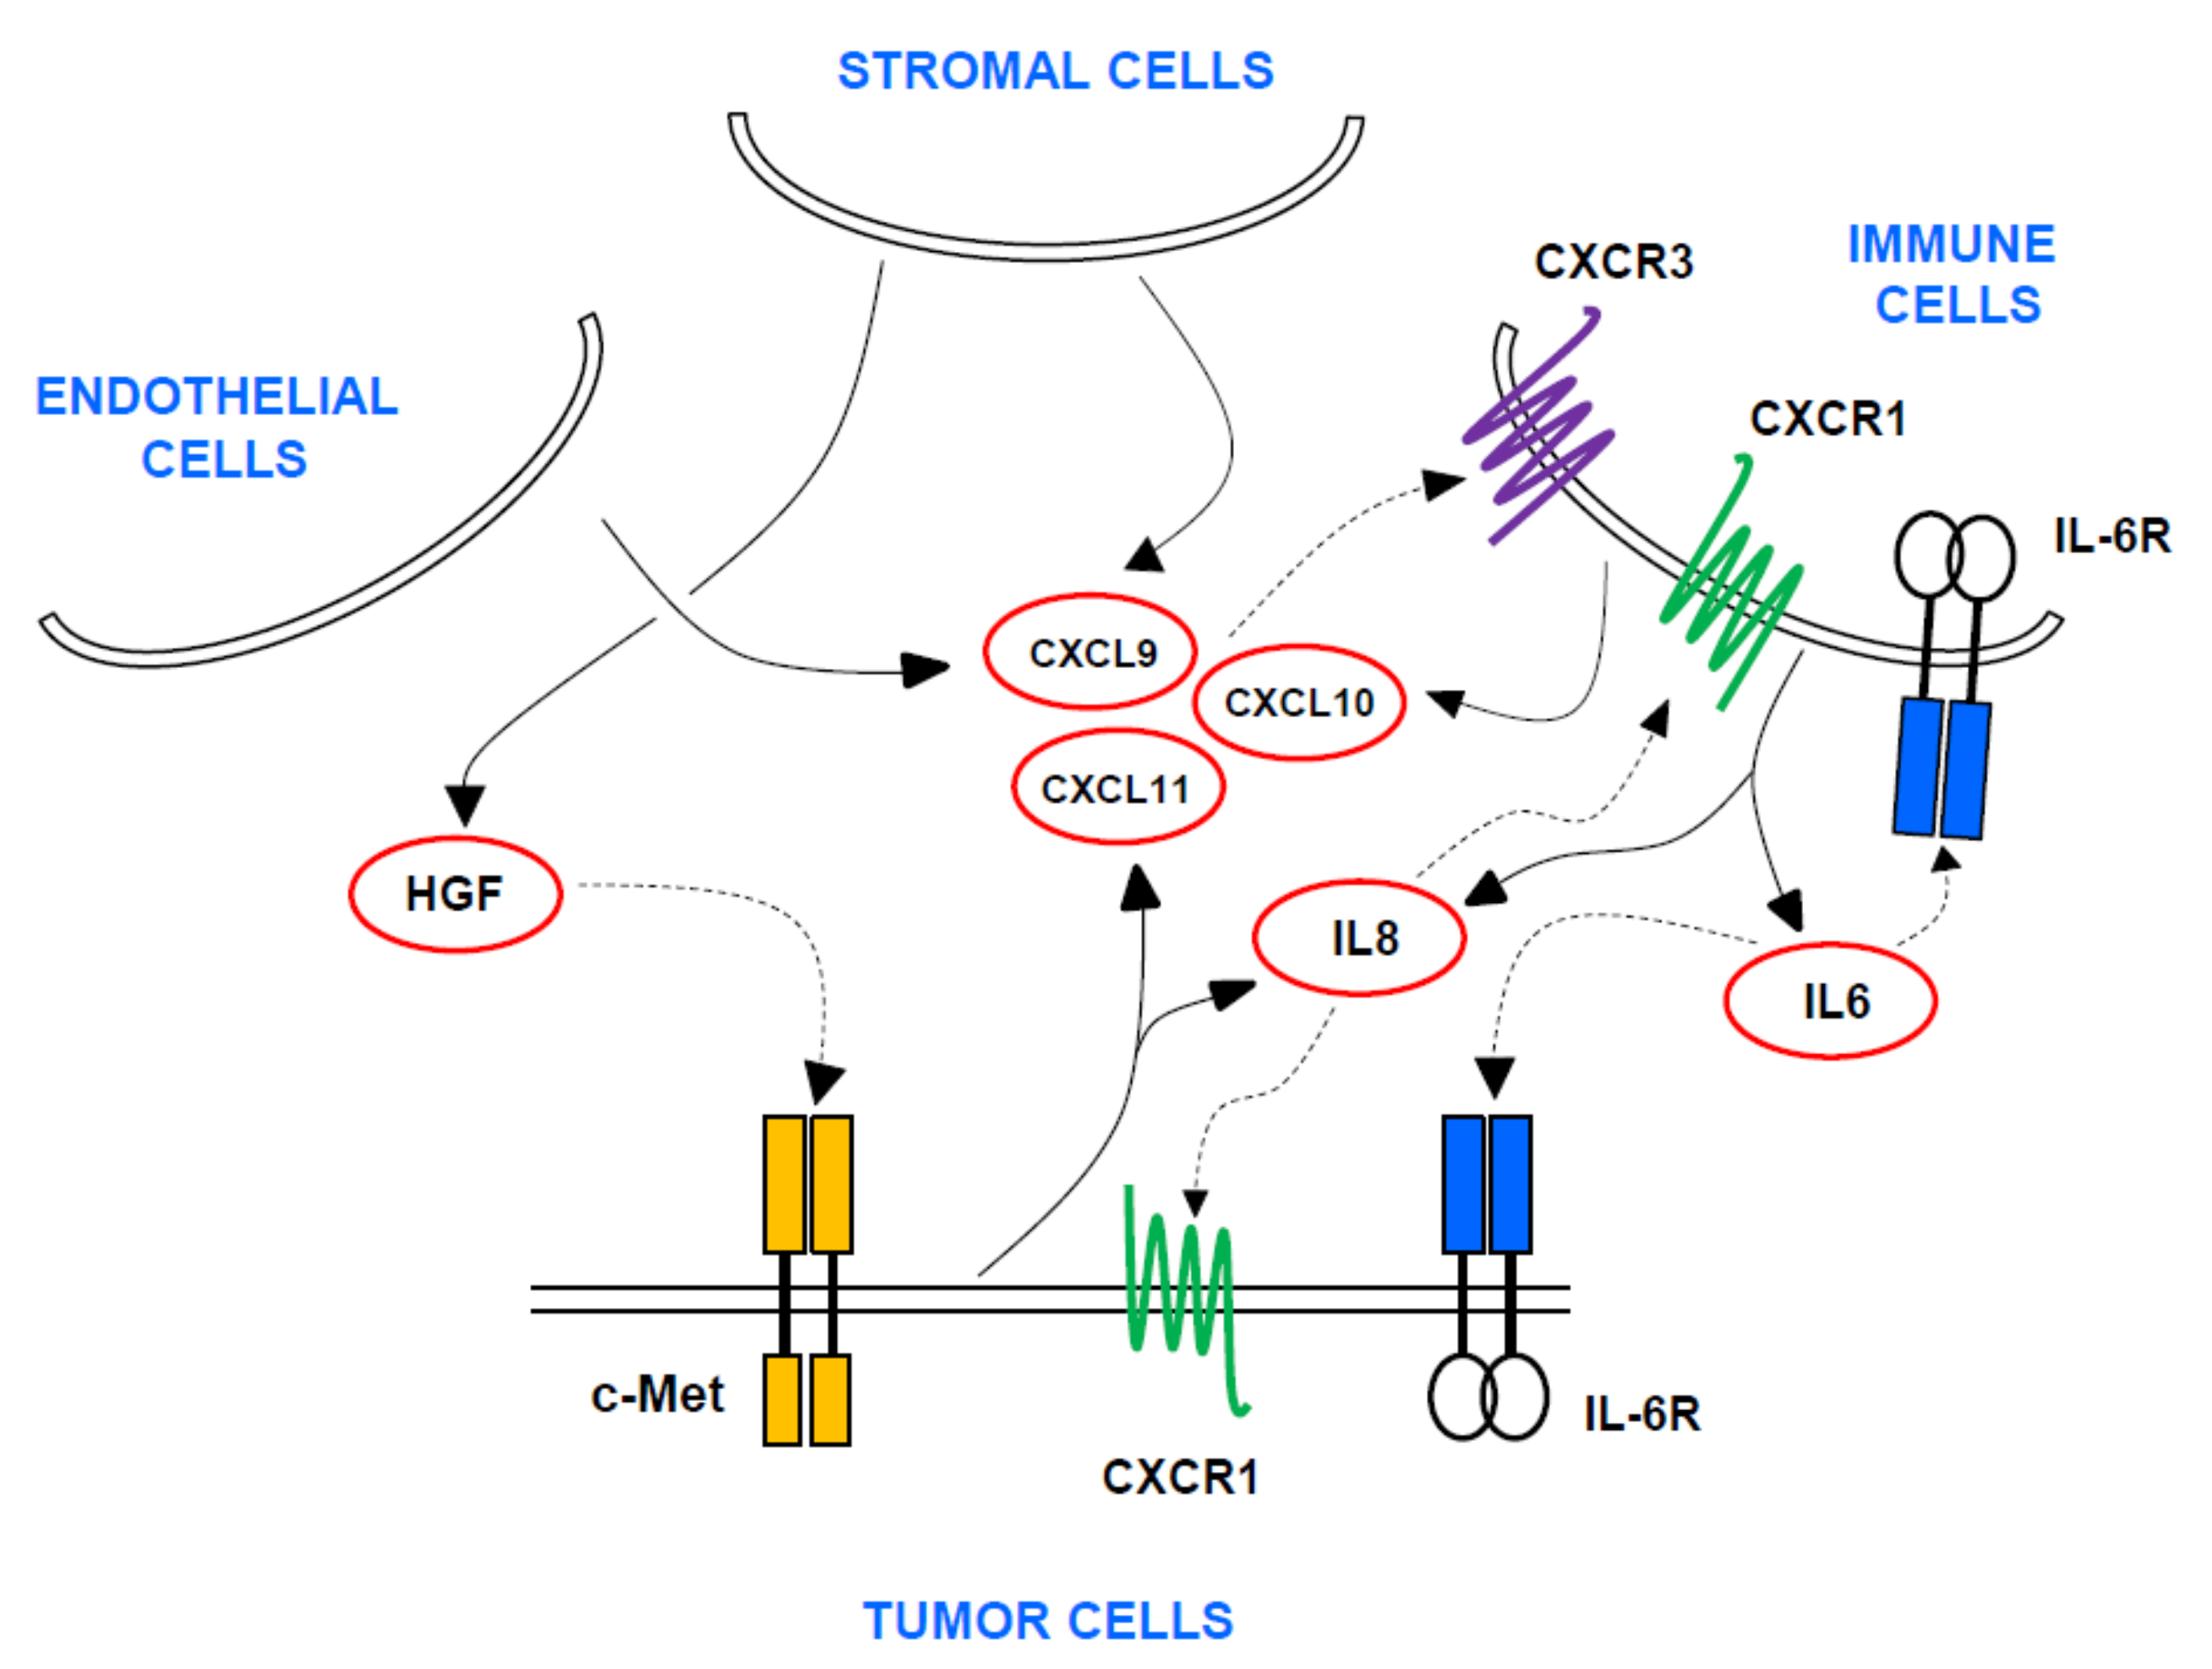
1. Introduction
2. Patients and Methods
2.1. Study Design and Patients
2.2. Immunohistochemistry in Tumor Samples
2.3. Analysis of Circulating Cytokines/Chemokines in Blood
2.4. Single Nucleotide Polymorphisms (SNPs) in Whole Blood Samples
2.5. Bioinformatic and Statistical Analysis
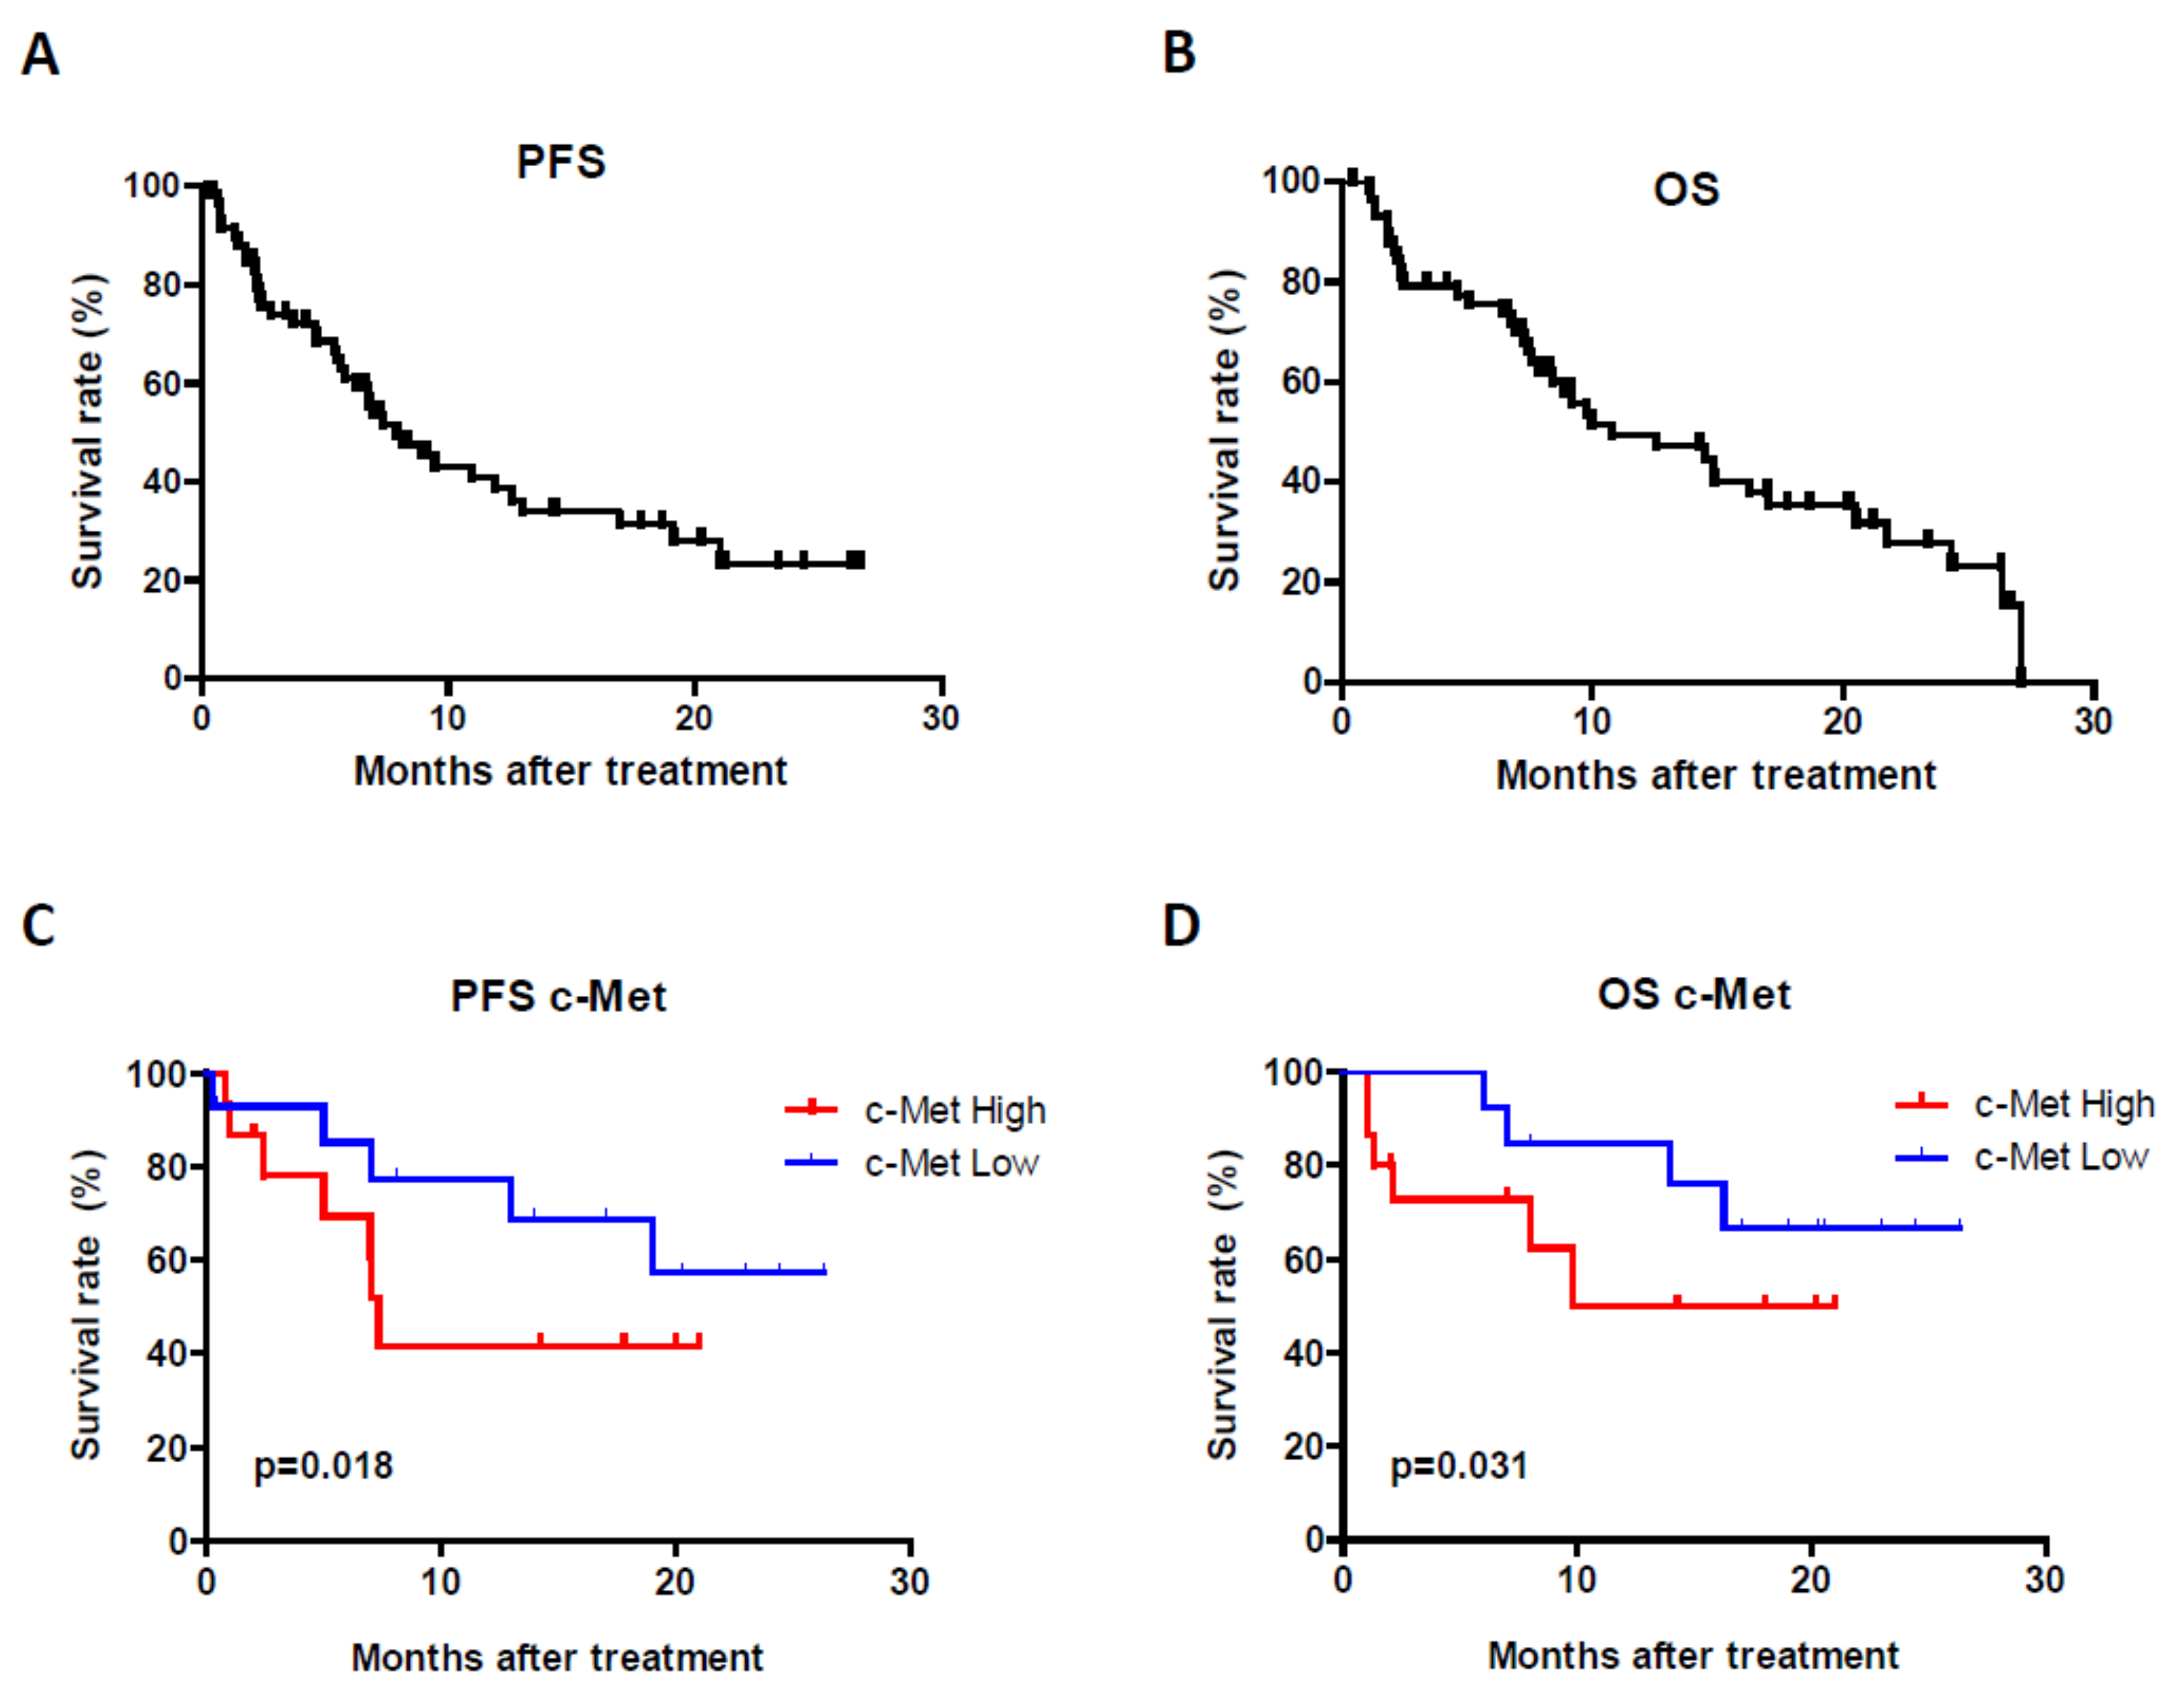
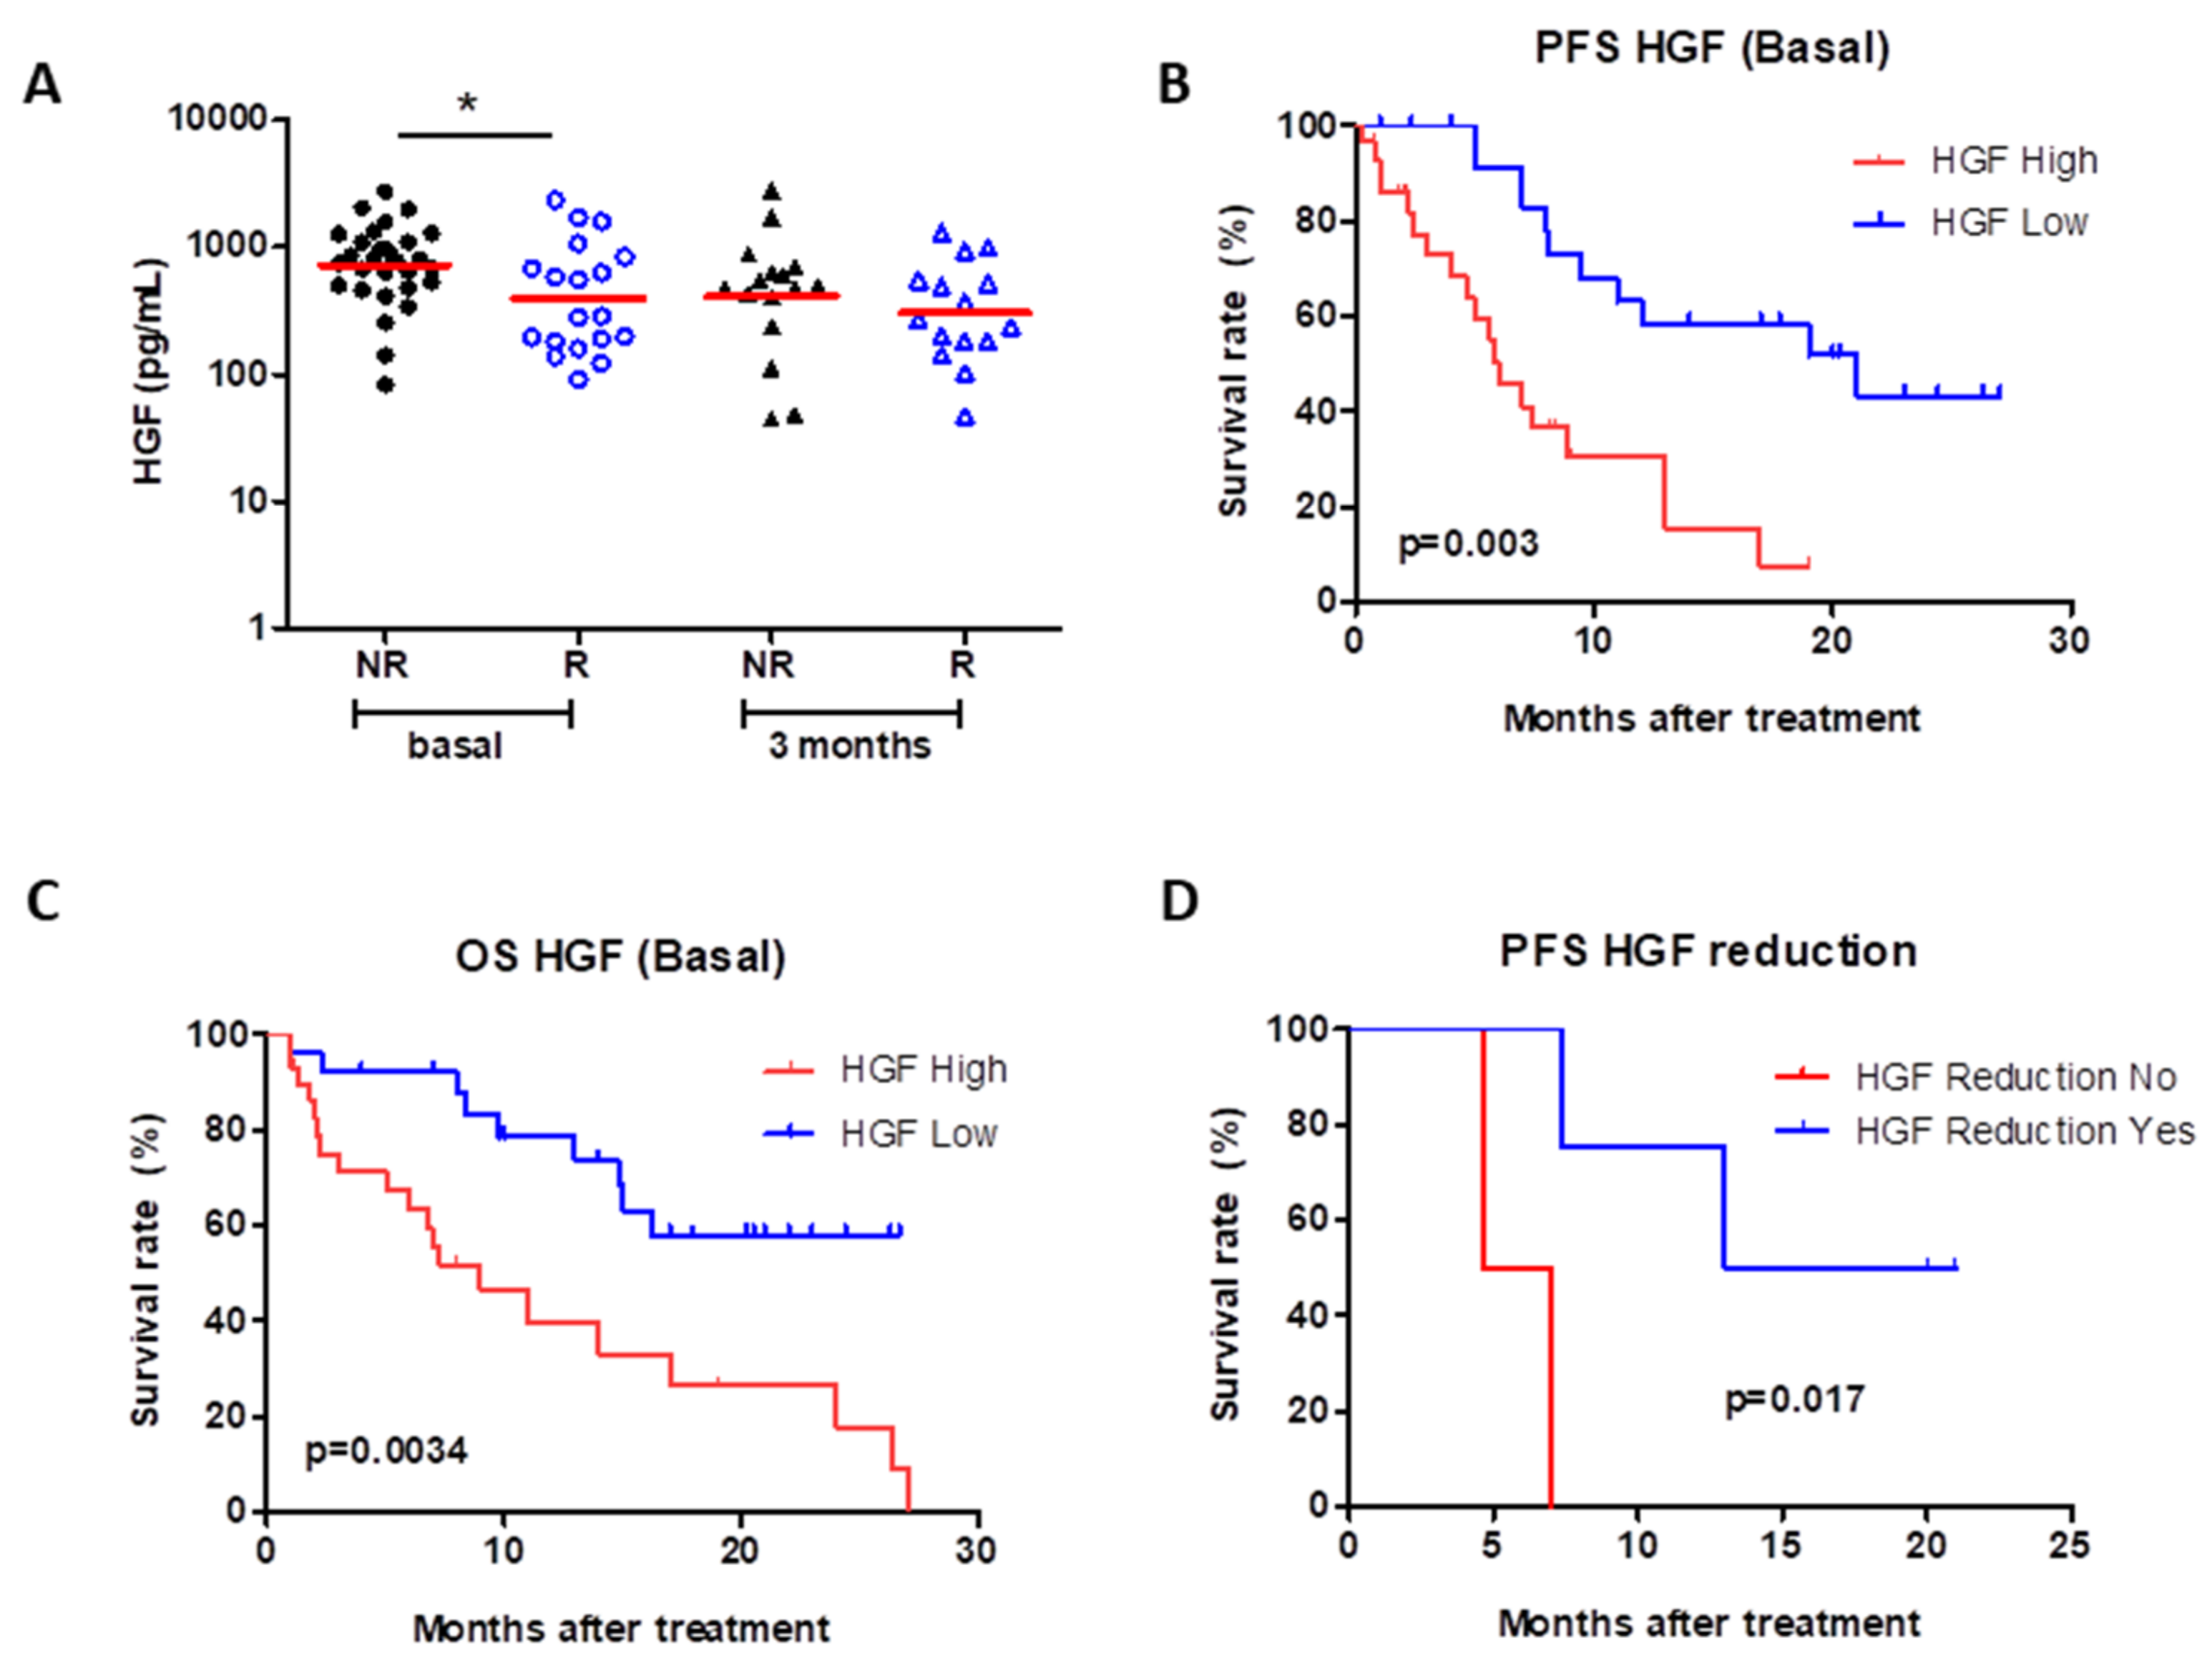
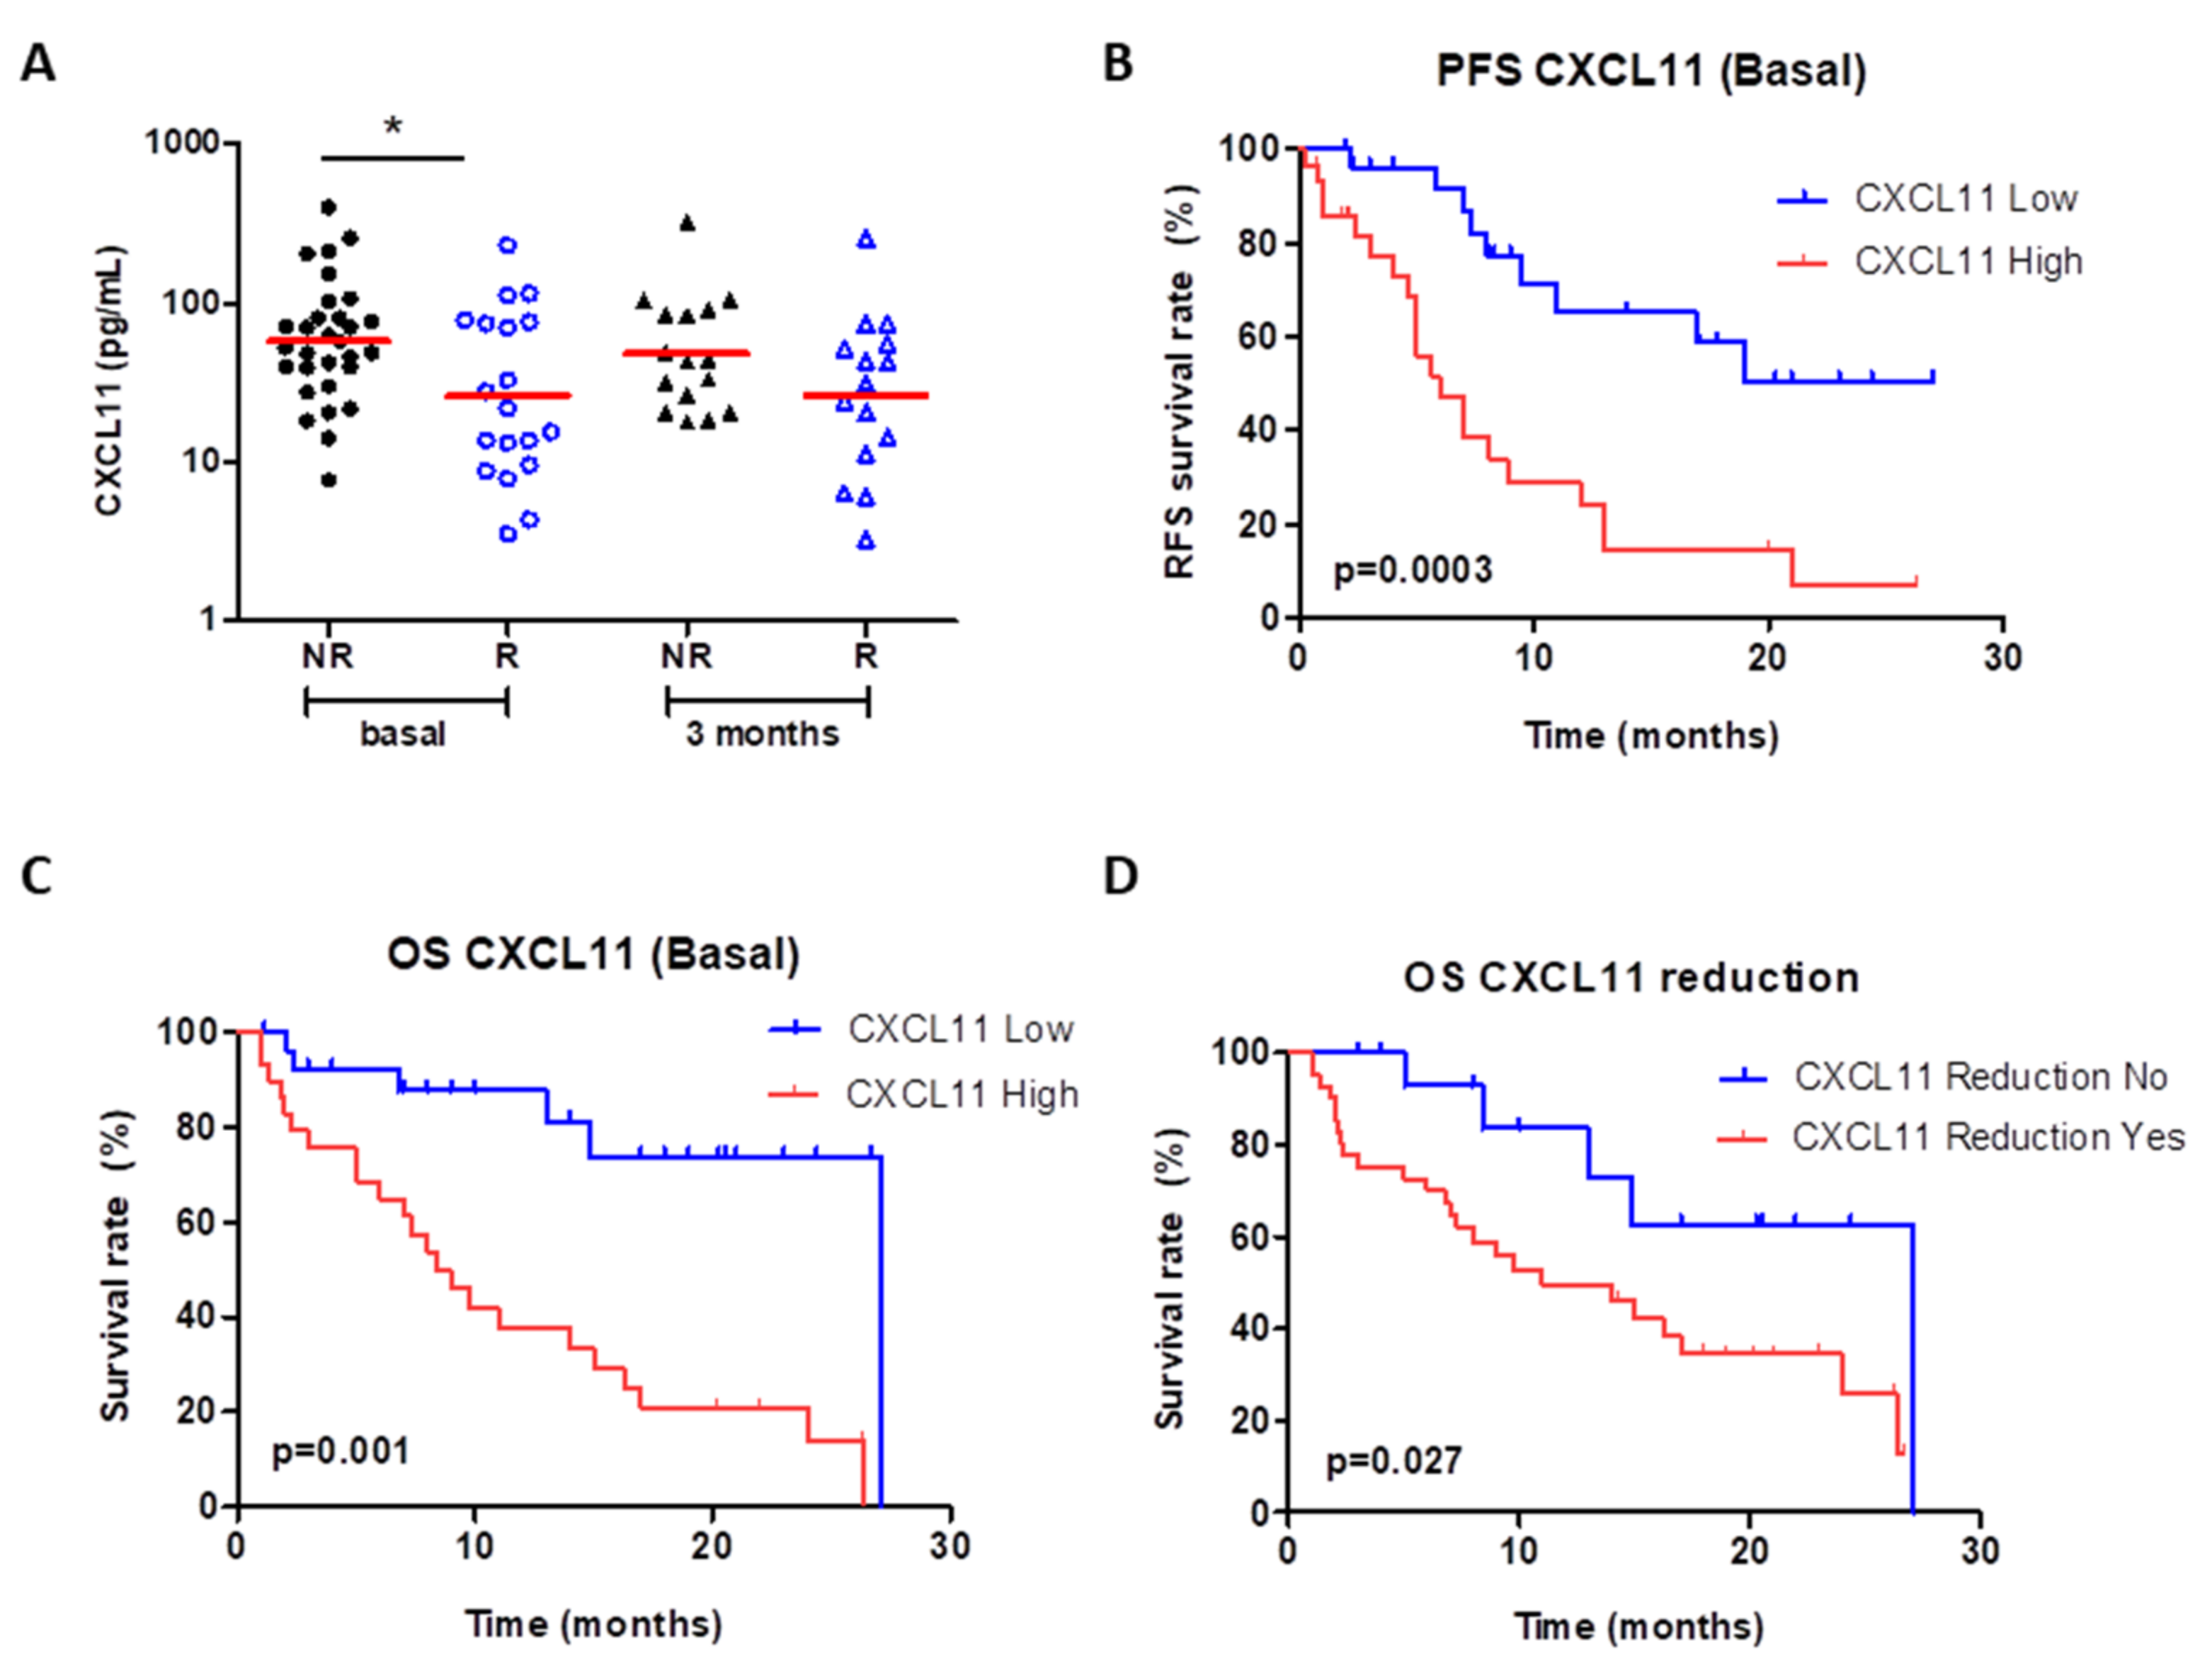
3. Results
Patient Characteristics and Treatment Efficiency
4. Biomarkers in Relation to Efficiency Endpoints
4.1. c-Met Protein Expression in Tumors
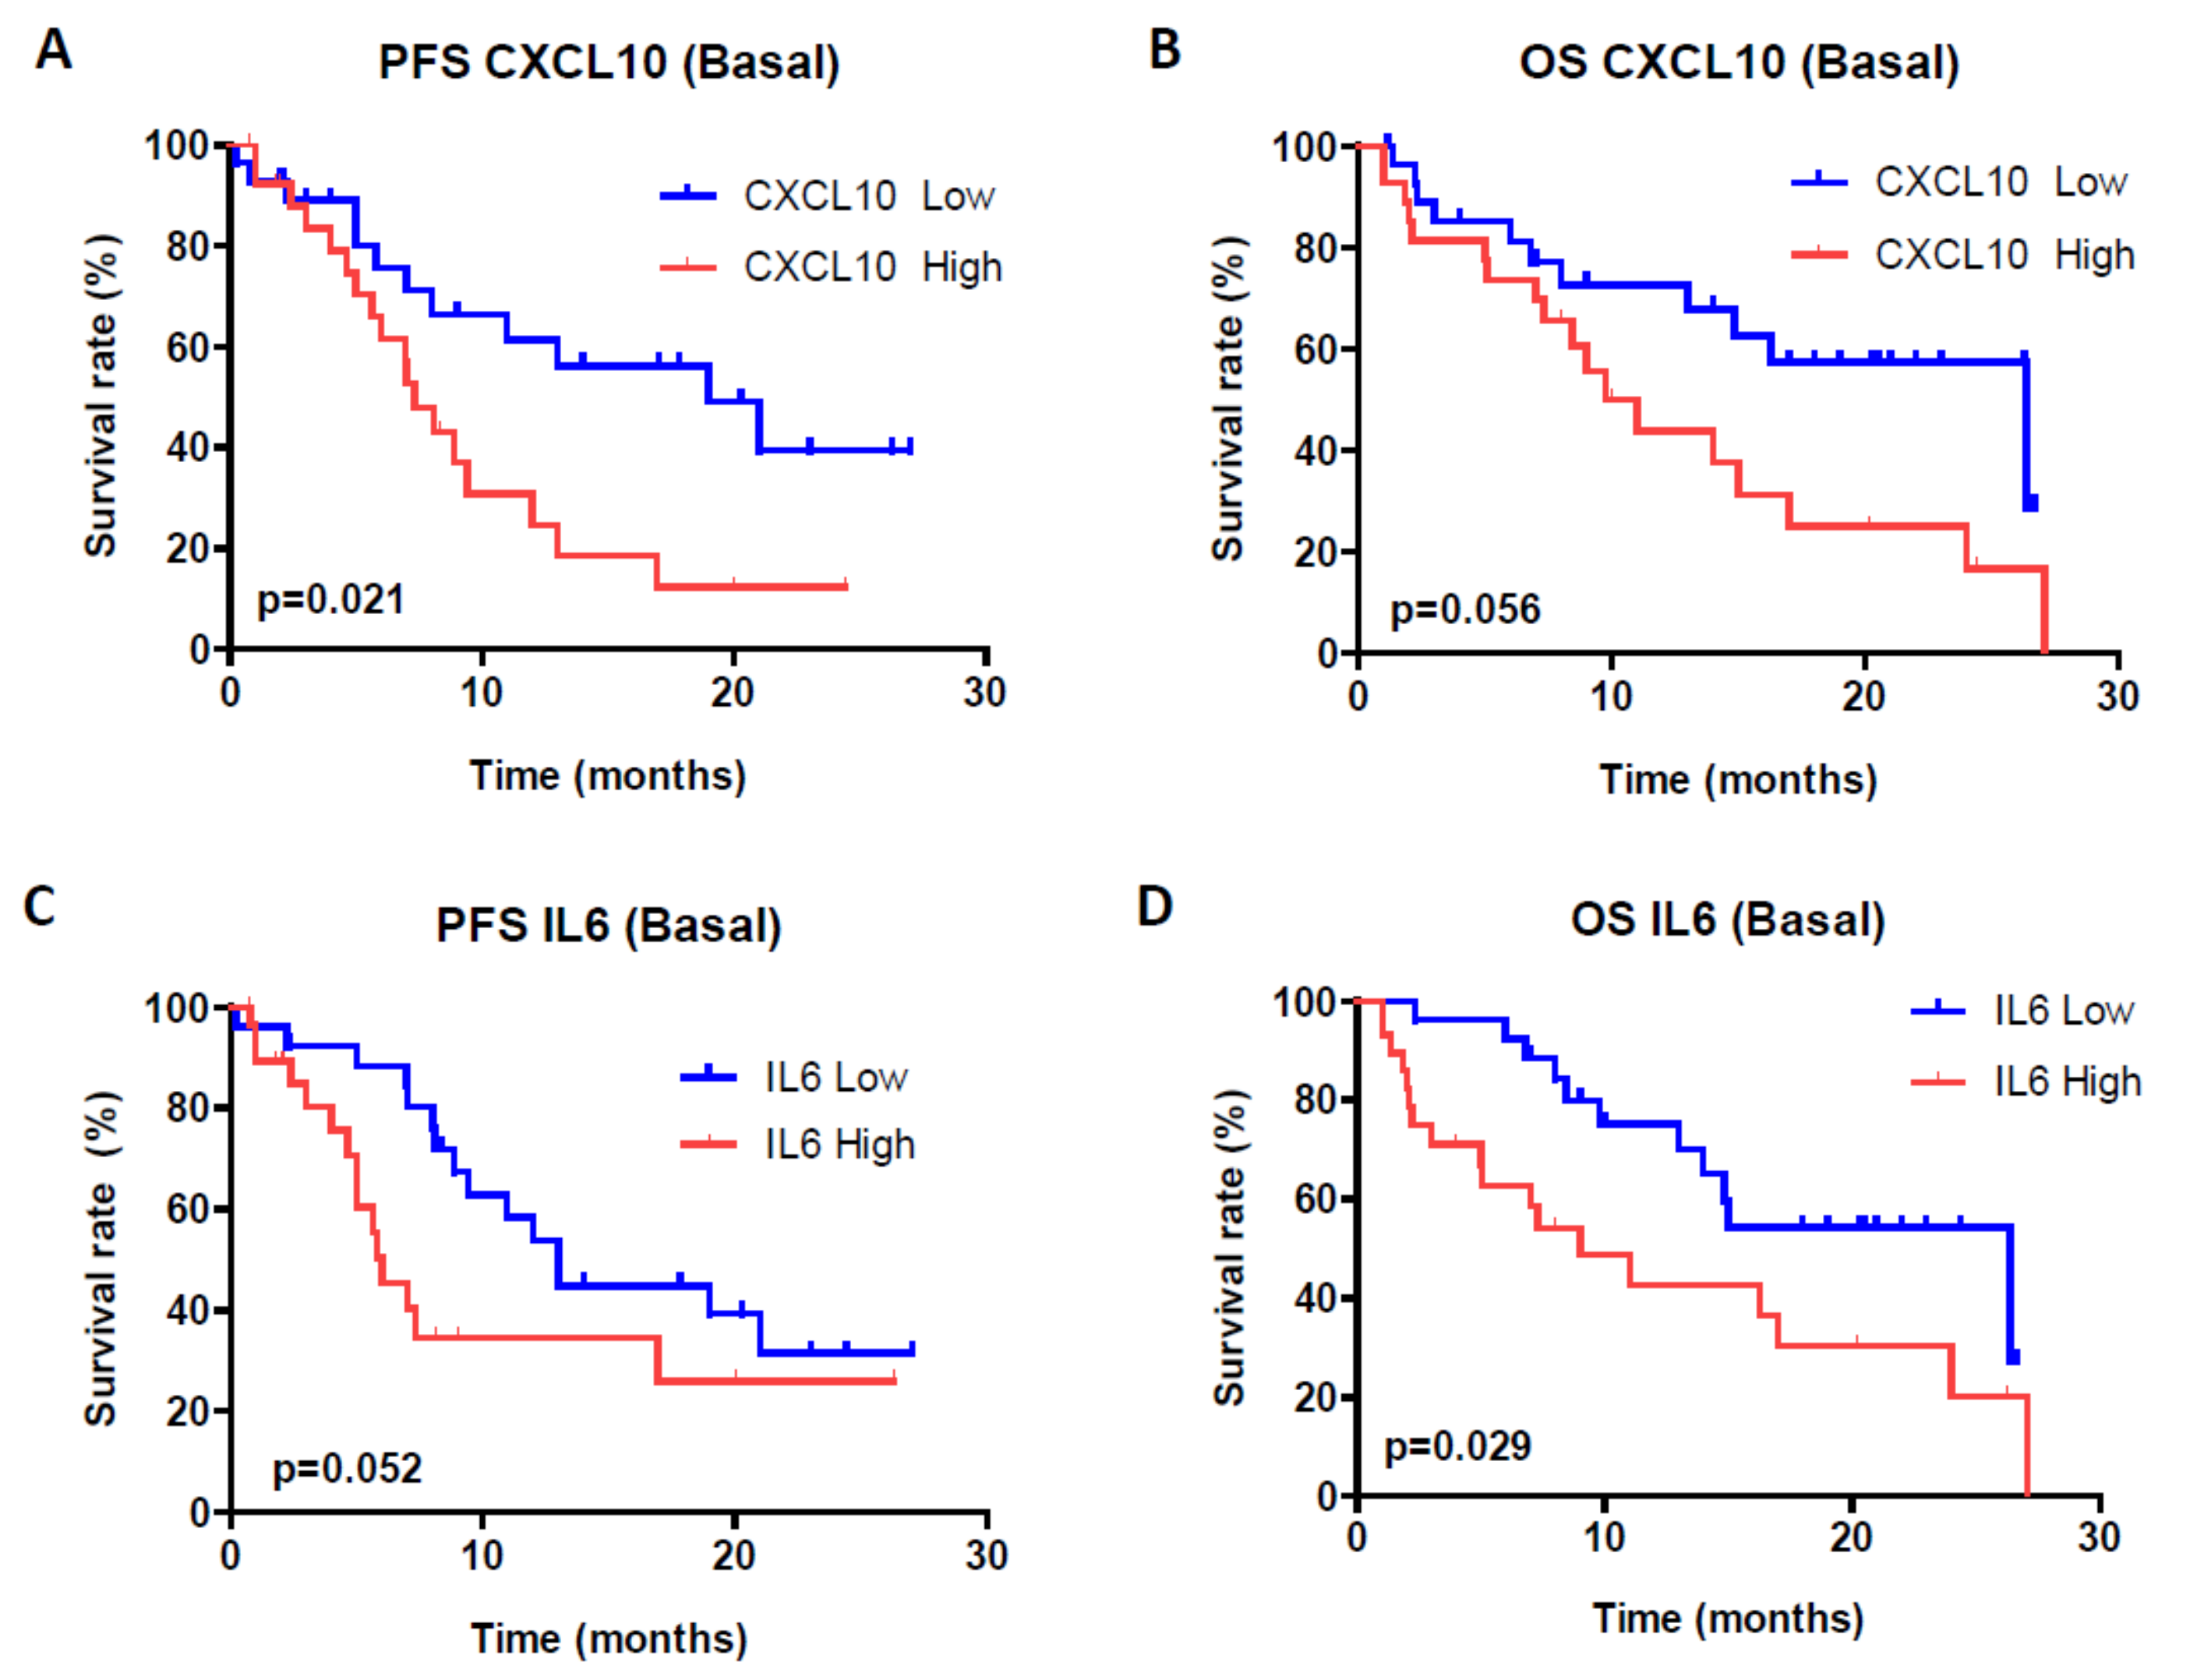
4.2. Circulating Cytokines, Chemokines and Growth Factors
4.3. Cox Proportional-Hazards Model and Prognostic Index for Risk Stratification
4.4. Circulating HGF Levels Strongly Correlate with CXCL11, CXCL10 and IL-6 Levels
4.5. Genetic Polymorphism rs1176221 in the MET Gene
5. Biomarkers in Relation to Toxicity
6. Discussion
Supplementary Materials
Author Contributions
Funding
Institutional Review Board Statement
Informed Consent Statement
Data Availability Statement
Acknowledgments
Conflicts of Interest
References
- Siegel, R.L.; Miller, K.D.; Jemal, A. Cancer statistics, 2020. CA A Cancer J. Clin. 2020, 70, 7–30. [Google Scholar] [CrossRef] [PubMed]
- Padala, S.A.; Barsouk, A.; Thandra, K.C.; Saginala, K.; Mohammed, A.; Vakiti, A.; Rawla, P.; Barsouk, A. Epidemiology of Renal Cell Carcinoma. World J. Oncol. 2020, 11, 79–87. [Google Scholar] [CrossRef] [PubMed]
- Patel, H.V.; Shinder, B.; Srinivasan, R.; Singer, E.A. Challenges and opportunities in the management of metastatic renal cell carcinoma: Combination therapy and the role of cytoreductive surgery. Curr. Opin. Oncol. 2020, 240–249. [Google Scholar] [CrossRef]
- Hutson, T.E. Targeted Therapies for the Treatment of Metastatic Renal Cell Carcinoma: Clinical Evidence. Oncology 2011, 16, 14–22. [Google Scholar] [CrossRef] [PubMed]
- McKay, R.R.; Bossé, D.; Choueiri, T.K. Evolving Systemic Treatment Landscape for Patients with Advanced Renal Cell Carcinoma. J. Clin. Oncol. 2018, 36, 3615–3623. [Google Scholar] [CrossRef]
- Motzer, R.J.; Tannir, N.M.; McDermott, D.F.; Frontera, O.A.; Melichar, B.; Choueiri, T.K.; Plimack, E.R.; Barthélémy, P.; Porta, C.; George, S.; et al. Nivolumab plus Ipilimumab versus Sunitinib in Advanced Renal-Cell Carcinoma. N. Engl. J. Med. 2018, 378, 1277–1290. [Google Scholar] [CrossRef] [PubMed]
- Motzer, R.J.; Penkov, K.; Haanen, J.; Rini, B.; Albiges, L.; Campbell, M.T.; Venugopal, B.; Kollmannsberger, C.; Negrier, S.; Uemura, M.; et al. Avelumab plus Axitinib versus Sunitinib for Advanced Renal-Cell Carcinoma. N. Engl. J. Med. 2019, 380, 1103–1115. [Google Scholar] [CrossRef]
- Rini, B.I.; Plimack, E.R.; Stus, V.; Gafanov, R.; Hawkins, R.; Nosov, D.; Pouliot, F.; Alekseev, B.; Soulières, D.; Melichar, B.; et al. Pembrolizumab plus Axitinib versus Sunitinib for Advanced Renal-Cell Carcinoma. N. Engl. J. Med. 2019, 380, 1116–1127. [Google Scholar] [CrossRef]
- D’Aniello, C.; Berretta, M.; Cavaliere, C.; Rossetti, S.; Facchini, B.A.; Iovane, G.; Mollo, G.; Capasso, M.; Della Pepa, C.; Pesce, L.; et al. Biomarkers of Prognosis and Efficacy of Anti-angiogenic Therapy in Metastatic Clear Cell Renal Cancer. Front. Oncol. 2019, 9. [Google Scholar] [CrossRef]
- Della Corte, C.M.; Fasano, M.; Papaccio, F.; Ciardiello, F.; Morgillo, F. Role of HGF-MET signaling in primary and acquired resistance to targeted therapies in cancer. Biomedicines 2014, 345–358. [Google Scholar] [CrossRef]
- Marona, P.; Górka, J.; Kotlinowski, J.; Majka, M.; Jura, J.; Miekus, K. C-Met as a Key Factor Responsible for Sustaining Undifferentiated Phenotype and Therapy Resistance in Renal Carcinomas. Cells 2019, 8, 272. [Google Scholar] [CrossRef] [PubMed]
- Peltola, K.J.; Penttilä, P.; Rautiola, J.; Joensuu, H.; Hänninen, E.; Ristimäki, A.; Bono, P. Correlation of c-Met Expression and Outcome in Patients With Renal Cell Carcinoma Treated With Sunitinib. Clin. Genitourin. Cancer 2017, 15, 487–494. [Google Scholar] [CrossRef]
- Kammerer-Jacquet, S.-F.; Medane, S.; Bensalah, K.; Bernhard, J.-C.; Yacoub, M.; Dupuis, F.; Ravaud, A.; Verhoest, G.; Mathieu, R.; Peyronnet, B.; et al. Correlation of c-MET Expression with PD-L1 Expression in Metastatic Clear Cell Renal Cell Carcinoma Treated by Sunitinib First-Line Therapy. Target. Oncol. 2017, 12, 487–494. [Google Scholar] [CrossRef]
- Hirsch, L.; Flippot, R.; Escudier, B.; Albiges, L. Immunomodulatory Roles of VEGF Pathway Inhibitors in Renal Cell Carcinoma. Drugs 2020, 80, 1169–1181. [Google Scholar] [CrossRef]
- Garje, R.; An, J.; Greco, A.; Vaddepally, R.K.; Zakharia, Y. The Future of Immunotherapy-Based Combination Therapy in Metastatic Renal Cell Carcinoma. Cancers 2020, 12, 143. [Google Scholar] [CrossRef] [PubMed]
- Tokunaga, R.; Zhang, W.U.; Naseem, M.; Puccini, A.; Berger, M.D.; Soni, S.; McSkane, M.; Baba, H.; Lenz, H.J. CXCL9, CXCL10, CXCL11/CXCR3 axis for immune activation—A target for novel cancer therapy. Cancer Treat. Rev. 2018, 40–47. [Google Scholar] [CrossRef]
- Polimeno, M.; Napolitano, M.; Costantini, S.; Portella, L.; Esposito, A.; Capone, F.; Guerriero, E.; Trotta, A.M.; Zanotta, S.; Pucci, L.; et al. Regulatory T cells, interleukin (IL)-6, IL-8, Vascular endothelial growth factor (VEGF), CXCL10, CXCL11, epidermal growth factor (EGF) and hepatocyte growth factor (HGF) as surrogate markers of host immunity in patients with renal cell carcinoma. BJU Int. 2013, 112, 686–696. [Google Scholar] [CrossRef]
- Sanmamed, M.F.; Carranza-Rua, O.; Alfaro, C.; Oñate, C.; Martín-Algarra, S.; Perez, G.; Landazuri, S.F.; Gonzalez, Á.; Gross, S.; Rodriguez, I.; et al. Serum Interleukin-8 Reflects Tumor Burden and Treatment Response across Malignancies of Multiple Tissue Origins. Clin. Cancer Res. 2014, 20, 5697–5707. [Google Scholar] [CrossRef]
- Gudbrandsdottir, G.; Aarstad, H.H.; Bostad, L.; Hjelle, K.M.; Aarstad, H.J.; Bruserud, Ø.; Tvedt, T.H.A.; Beisland, C. Serum levels of the IL-6 family of cytokines predict prognosis in renal cell carcinoma (RCC). Cancer Immunol. Immunother. 2021, 70, 19–30. [Google Scholar] [CrossRef] [PubMed]
- Liu, W.; Liu, Y.; Fu, Q.; Zhou, L.; Chang, Y.; Xu, L.; Zhang, W.; Xu, J. Elevated expression of IFN-inducible CXCR3 ligands predicts poor prognosis in patients with non-metastatic clear-cell renal cell carcinoma. Oncotarget 2016, 7, 13976–13983. [Google Scholar] [CrossRef][Green Version]
- Hakimi, A.A.; Ostrovnaya, I.; Jacobsen, A.; Susztak, K.; Coleman, J.A.; Russo, P.; Winer, A.G.; Mano, R.; Sankin, A.I.; Motzer, R.J. Validation and genomic interrogation of the MET variant rs11762213 as a predictor of adverse outcomes in clear cell renal cell carcinoma. Cancer 2016, 122, 402–410. [Google Scholar] [CrossRef]
- Schutz, F.A.B.; Pomerantz, M.M.; Gray, K.P.; Atkins, M.B.; Rosenberg, J.E.; Hirsch, M.S.; McDermott, D.F.; Lampron, M.E.; Lee, G.-S.M.; Signoretti, S.; et al. Single nucleotide polymorphisms and risk of recurrence of renal-cell carcinoma: A cohort study. Lancet Oncol. 2013, 14, 81–87. [Google Scholar] [CrossRef]
- Mauge, L.; Méjean, A.; Fournier, L.; Pereira, H.; Etienne-Grimaldi, M.-C.; Levionnois, E.; Caty, A.; Abadie-Lacourtoisie, S.; Culine, S.; Le Moulec, S.; et al. Sunitinib Prior to Planned Nephrectomy in Metastatic Renal Cell Carcinoma: Angiogenesis Biomarkers Predict Clinical Outcome in the Prospective Phase II PREINSUT Trial. Clin. Cancer Res. 2018, 24, 5534–5542. [Google Scholar] [CrossRef] [PubMed]
- Tran, H.T.; Liu, Y.; Zurita, A.J.; Lin, Y.; Baker-Neblett, K.L.; Martin, A.-M.; Figlin, R.A.; Hutson, T.E.; Sternberg, C.N.; Amado, R.G.; et al. Prognostic or predictive plasma cytokines and angiogenic factors for patients treated with pazopanib for metastatic renal-cell cancer: A retrospective analysis of phase 2 and phase 3 trials. Lancet Oncol. 2012, 13, 827–837. [Google Scholar] [CrossRef]
- Ding, X.; Ji, J.; Jiang, J.; Cai, Q.; Wang, C.; Shi, M.; Yu, Y.; Zhu, Z.; Zhang, J. HGF-mediated crosstalk between cancer-associated fibroblasts and MET-unamplified gastric cancer cells activates coordinated tumorigenesis and metastasis. Cell Death Dis. 2018, 9, 867. [Google Scholar] [CrossRef]
- Ito, Y.; Correll, K.; Zemans, R.L.; Leslie, C.C.; Murphy, R.C.; Mason, R.J. Influenza induces IL-8 and GM-CSF secretion by human alveolar epithelial cells through HGF/c-Met and TGF-α/EGFR signaling. Am. J. Physiol. Cell Mol. Physiol. 2015, 308, L1178–L1188. [Google Scholar] [CrossRef]
- Coudriet, G.M.; He, J.; Trucco, M.; Mars, W.M.; Piganelli, J.D. Hepatocyte Growth Factor Modulates Interleukin-6 Production in Bone Marrow Derived Macrophages: Implications for Inflammatory Mediated Diseases. PLoS ONE 2010, 5, e15384. [Google Scholar] [CrossRef]
- Hill, K.S.; Gážiová, I.; Harrigal, L.; Guerra, Y.A.; Qiu, S.; Sastry, S.K.; Arumugam, T.; Logsdon, C.D.; Elferink, L.A. Met Receptor Tyrosine Kinase Signaling Induces Secretion of the Angiogenic Chemokine Interleukin-8/CXCL8 in Pancreatic Cancer. PLoS ONE 2012, 7, e40420. [Google Scholar] [CrossRef]
- Knowles, L.M.; Stabile, L.P.; Egloff, A.M.; Rothstein, M.E.; Thomas, S.M.; Gubish, C.T.; Lerner, E.C.; Seethala, R.R.; Suzuki, S.; Quesnelle, K.M.; et al. HGF and c-Met Participate in Paracrine Tumorigenic Pathways in Head and Neck Squamous Cell Cancer. Clin. Cancer Res. 2009, 15, 3740–3750. [Google Scholar] [CrossRef]
- Landskron, G.; De La Fuente, M.; Thuwajit, P.; Thuwajit, C.; Hermoso, M.A. Chronic Inflammation and Cytokines in the Tumor Microenvironment. J. Immunol. Res. 2014, 2014, 149185. [Google Scholar] [CrossRef] [PubMed]
- Castro, F.; Cardoso, A.; Gonçalves, R.M.; Serre, K.; Oliveira, M.J. Interferon-Gamma at the Crossroads of Tumor Immune Surveillance or Evasion. Front. Immunol. 2018, 9, 847. [Google Scholar] [CrossRef] [PubMed]
- Liu, M.; Guo, S.; Stiles, J.K. The emerging role of CXCL10 in cancer (Review). Oncol. Lett. 2011, 2, 583–589. [Google Scholar] [CrossRef] [PubMed]
- Choueiri, T.K.; Fishman, M.N.; Escudier, B.; McDermott, D.F.; Drake, C.G.; Kluger, H.; Stadler, W.M.; Perez-Gracia, J.L.; McNeel, D.G.; Curti, B.; et al. Immunomodulatory activity of nivolumab in metastatic renal cell carcinoma. Clin. Cancer Res. 2016, 22, 5461–5471. [Google Scholar] [CrossRef] [PubMed]
- Xu, W.; Puligandla, M.; Manola, J.; Bullock, A.J.; Tamasauskas, D.; McDermott, D.F.; Atkins, M.B.; Haas, N.B.; Flaherty, K.; Uzzo, R.G.; et al. Angiogenic Factor and Cytokine Analysis among Patients Treated with Adjuvant VEGFR TKIs in Resected Renal Cell Carcinoma. Clin. Cancer Res. 2019, 25, 6098–6106. [Google Scholar] [CrossRef]
- Suyama, T.; Furuya, M.; Nishiyama, M.; Kasuya, Y.; Kimura, S.; Ichikawa, T.; Ueda, T.; Nikaido, T.; Ito, H.; Ishikura, H. Up-regulation of the interferon γ (IFN-γ)-inducible chemokines IFN-inducible T-cell α chemoattractant and monokine induced by IFN-γ and of their receptor CXC receptor 3 in human renal cell carcinoma. Cancer 2005, 103, 258–267. [Google Scholar] [CrossRef]
- Rupertus, K.; Sinistra, J.; Scheuer, C.; Nickels, R.M.; Schilling, M.K.; Menger, M.D.; Kollmar, O. Interaction of the chemokines I-TAC (CXCL11) and SDF-1 (CXCL12) in the regulation of tumor angiogenesis of colorectal cancer. Clin. Exp. Metast. 2014, 31, 447–459. [Google Scholar] [CrossRef]
- Choueiri, T.K.; Halabi, S.; Sanford, B.L.; Hahn, O.; Michaelson, M.D.; Walsh, M.K.; Feldman, D.R.; Olencki, T.; Picus, J.; Small, E.J.; et al. Cabozantinib Versus Sunitinib As Initial Targeted Therapy for Patients with Metastatic Renal Cell Carcinoma of Poor or Intermediate Risk: The Alliance A031203 CABOSUN Trial. J. Clin. Oncol. 2017, 35, 591–597. [Google Scholar] [CrossRef]
- Abdelaziz, A.; Vaishampayan, U. Cabozantinib for Renal Cell Carcinoma: Current and Future Paradigms. Curr. Treat. Opt. Oncol. 2017, 18, 18. [Google Scholar] [CrossRef]
- Ntellas, P.; Mavroeidis, L.; Gkoura, S.; Gazouli, I.; Amylidi, A.-L.; Papadaki, A.; Zarkavelis, G.; Mauri, D.; Karpathiou, G.; Kolettas, E.; et al. Old Player-New Tricks: Non Angiogenic Effects of the VEGF/VEGFR Pathway in Cancer. Cancers 2020, 12, 3145. [Google Scholar] [CrossRef] [PubMed]


| Corhort (n = 60) | |
|---|---|
| Gender | n (%) |
| Male | 46 (76.7) |
| Female | 14 (23.3) |
| Age at diagnosis (primary tumor) | |
| <65 | 31 (51.7) |
| ≥65 | 29 (48.3) |
| Age at metastasis | |
| <65 | 30 (50) |
| ≥65 | 30 (50) |
| Time between diagnosis and metastasis | |
| Metastasis at diagnosis | 23 (38.3) |
| ≤1 years | 15 (25) |
| ≤5 years | 14 (23.3) |
| >5 years | 8 (13.3) |
| Metastatic disease at study enrollment | 60 (100) |
| Number of metastatic sites | |
| 1 | 22 (36.7) |
| 2 | 30 (50) |
| 3 | 4 (6.7) |
| 4 | 4 (6.7) |
| Risk factor (MSKCC *) | |
| Good | 9 (15) |
| Intermediate | 42 (70 ) |
| Bad | 9 (15) |
| Therapy | |
| Sunitinib | 51 (85) |
| Pazopanib | 4 (6.7) |
| Sunitib + Pazopanib | 5 (8.3) |
| Toxicity | Sunitinib n (%) | Pazopanib n (%) | Sunitinib/Pazopanib n (%) | Total | p |
|---|---|---|---|---|---|
| Asthenia | 33 (64.7) | 3 (75.0) | 2 (40) | 38 (63.3) | 0.495 |
| Neutropenia | 6 (11.8) | - | - | 6 (10) | 0.356 |
| Hand-foot syndrome | 14 (27.5) | - | 1 (20) | 15 (25.0) | 0.282 |
| Hypertension | 17 (33.3) | 2 (50.0) | 1 (20.0) | 20 (33.3) | 0.635 |
| Hypothyroidism | 5 (9.8) | - | - | 5 (8.3) | 0.427 |
| Cardiotoxicity | 1 (2.0) | - | - | 1 (1.7) | 0.849 |
| Mucositis | 27 (52.9) | 1 (25) | 5 (100) | 33 (55.0) | 0.023 |
| Diarrhea | 18 (35.3) | 3 (75.0) | 2 (40.0) | 23 (38.3) | 0.297 |
| Leukopenia | 7 (13.7) | - | - | 7 (11.7) | 0.297 |
| Anemia | 14 (27.5) | - | - | 14 (23.3) | 0.073 |
| Thrombocytope-nia | 15 (29.4) | 1 (25) | 2 (40.0) | 18 (30.0) | 0.864 |
| Cytokine/Chemokine | Univariable Cox Hazards Model (PFS) | Multivariable Cox Hazards Model (PFS) | |||||||||
|---|---|---|---|---|---|---|---|---|---|---|---|
| Cohort | Progression | ||||||||||
| N | N | Person-Years | Crude HR | 95% CI | p | HR | 95% CI | p | LR | p | |
| HGF | 55 | 28 | 22.3 | 0.0002 | |||||||
| Low | 27 | 10 | 0.24 | 1 | 0.001 | 1 | 0.005 | ||||
| High | 28 | 18 | 0.44 | 3.85 | (1.74–8.47) | 3.31 | (1.43–7.65) | ||||
| IL-6 | 55 | ||||||||||
| Low | 27 | 14 | 0.34 | 1 | 0.144 | 1 | 0.531 | ||||
| High | 28 | 14 | 0.34 | 1.73 | (0.82–3.64) | 1.28 | (0.58–2.79) | ||||
| CXCL-10 | 55 | ||||||||||
| Low | 27 | 10 | 0.24 | 1 | 0.026 | 1 | 0.852 | ||||
| High | 28 | 18 | 0.44 | 2.33 | (1.10–4.94) | 1.08 | (0.46–2.52) | ||||
| CXCL-11 | 55 | ||||||||||
| Low | 27 | 8 | 0.19 | 1 | 0.001 | 1 | 0.005 | ||||
| High | 28 | 20 | 0.48 | 3.86 | (1.75–8.50) | 3.23 | (1.42–7.37) | ||||
| Prognostic Index (PI) | 55 | ||||||||||
| Low | 27 | 9 | 0.22 | 1 | <0.0001 | ||||||
| High | 28 | 19 | 0.46 | 5.28 | (2.32–12.0) | ||||||
| Cytokine/Chemokine | Univariable Cox Hazards Model (OS) | Multivariable Cox Hazards Model (OS) | |||||||||
|---|---|---|---|---|---|---|---|---|---|---|---|
| Cohort | Exitus | ||||||||||
| N | N | Person-Years | Crude HR | 95% CI | p | HR | 95% CI | p | LR | p | |
| HGF | 55 | 28 | 19.29 | 0.0007 | |||||||
| Low | 27 | 8 | 0.16 | 1 | 0.005 | 1 | 0.081 | ||||
| High | 28 | 20 | 0.39 | 3.15 | (1.40–7.07) | 2.18 | (0.90–5.23) | ||||
| IL-6 | 55 | ||||||||||
| Low | 27 | 11 | 0.22 | 1 | 0.069 | 1 | 0.715 | ||||
| High | 28 | 17 | 0.34 | 1.99 | (0.94–4.20) | 1.16 | (0.51–2.64) | ||||
| CXCL-10 | 55 | ||||||||||
| Low | 27 | 10 | 0.20 | 1 | 0.062 | 1 | 0.942 | ||||
| High | 28 | 18 | 0.35 | 2.07 | (0.96–4.46) | 1.22 | (0.39–2.37) | ||||
| CXCL-11 | 55 | ||||||||||
| Low | 27 | 4 | 0.08 | 1 | 0.001 | 1 | 0.005 | ||||
| High | 28 | 22 | 0.43 | 5.38 | (2.04–14.1) | 4.24 | (1.53–11.7 ) | ||||
| Prognostic Index (PI) | 55 | ||||||||||
| Low | 27 | 7 | 0.14 | 1 | <0.0001 | ||||||
| High | 28 | 21 | 0.41 | 4.82 | (2.03–11.42) | ||||||
Publisher’s Note: MDPI stays neutral with regard to jurisdictional claims in published maps and institutional affiliations. |
© 2021 by the authors. Licensee MDPI, Basel, Switzerland. This article is an open access article distributed under the terms and conditions of the Creative Commons Attribution (CC BY) license (https://creativecommons.org/licenses/by/4.0/).
Share and Cite
Esteban, E.; Exposito, F.; Crespo, G.; Lambea, J.; Pinto, A.; Puente, J.; Arranz, J.A.; Redrado, M.; Rodriguez-Antona, C.; de Andrea, C.; et al. Circulating Levels of the Interferon-γ-Regulated Chemokines CXCL10/CXCL11, IL-6 and HGF Predict Outcome in Metastatic Renal Cell Carcinoma Patients Treated with Antiangiogenic Therapy. Cancers 2021, 13, 2849. https://doi.org/10.3390/cancers13112849
Esteban E, Exposito F, Crespo G, Lambea J, Pinto A, Puente J, Arranz JA, Redrado M, Rodriguez-Antona C, de Andrea C, et al. Circulating Levels of the Interferon-γ-Regulated Chemokines CXCL10/CXCL11, IL-6 and HGF Predict Outcome in Metastatic Renal Cell Carcinoma Patients Treated with Antiangiogenic Therapy. Cancers. 2021; 13(11):2849. https://doi.org/10.3390/cancers13112849
Chicago/Turabian StyleEsteban, Emilio, Francisco Exposito, Guillermo Crespo, Julio Lambea, Alvaro Pinto, Javier Puente, Jose A. Arranz, Miriam Redrado, Cristina Rodriguez-Antona, Carlos de Andrea, and et al. 2021. "Circulating Levels of the Interferon-γ-Regulated Chemokines CXCL10/CXCL11, IL-6 and HGF Predict Outcome in Metastatic Renal Cell Carcinoma Patients Treated with Antiangiogenic Therapy" Cancers 13, no. 11: 2849. https://doi.org/10.3390/cancers13112849
APA StyleEsteban, E., Exposito, F., Crespo, G., Lambea, J., Pinto, A., Puente, J., Arranz, J. A., Redrado, M., Rodriguez-Antona, C., de Andrea, C., Lopez-Brea, M., Redin, E., Rodriguez, A., Serrano, D., Garcia, J., Grande, E., Castellano, D., & Calvo, A. (2021). Circulating Levels of the Interferon-γ-Regulated Chemokines CXCL10/CXCL11, IL-6 and HGF Predict Outcome in Metastatic Renal Cell Carcinoma Patients Treated with Antiangiogenic Therapy. Cancers, 13(11), 2849. https://doi.org/10.3390/cancers13112849