Simple Summary
Breast cancer, one of the leading causes of death among women, is a complex disease in which several factors, such as psychosocial stress, have been implicated in its initiation and progression. The glucocorticoid receptor (GCR) is one of the molecules that transfers the stress signal into the body. We measured the genetic variation and protein expression of GCR and the genes that regulate GCR function or response and examined whether these variations were associated with breast cancer. We found several genetic variants of functionally important SNPs associated with later disease stage, higher grade, and hormone receptor-negative status. The GCR protein expression was reduced in breast cancer tissue and correlated with the basal cell marker CK5/6.
Abstract
Background: Glucocorticoid, one of the primary mediators of stress, acts via its receptor, the glucocorticoid receptor (GCR/NR3C1), to regulate a myriad of physiological processes. We measured the genetic variation and protein expression of GCR, and the genes that regulate GCR function or response and examined whether these alterations were associated with breast cancer clinicopathological characteristics. Method: We used samples from a multiracial cohort of breast cancer patients to assess the association between breast cancer characteristics and the genetic variants of single nucleotide polymorphisms (SNPs) in GCR/NR3C1, FKBP5, Sgk1, IL-6, ADIPOQ, LEPR, SOD2, CAT, and BCL2. Results: Several SNPs were associated with breast cancer characteristics, but statistical significance was lost after adjustment for multiple comparisons. GCR was detected in all normal breast tissues and was predominantly located in the nuclei of the myoepithelial cell layer, whereas the luminal layer was negative for GCR. GCR expression was significantly decreased in all breast cancer tissue types, compared to nontumor tissue, but was not associated with breast cancer characteristics. We found that high nuclear GCR expression was associated with basal cell marker cytokeratin 5/6 positivity. Conclusion: GCR expression is reduced in breast cancer tissue and correlates with the basal cell marker CK5/6.
Keywords:
breast cancer; glucocorticoid receptor; cytokeratin 5/6; psychological stress; genetic ancestry; single nucleotide polymorphism; immunohistochemical localization; multispectral digital imaging; hormonal receptor; molecular subtypes; basal-like breast cancer; estrogen receptor; progesterone receptor; tissue microarrays 1. Introduction
Breast cancer, one of the leading causes of death among women, is a complex disease in which genetic, epigenetic, and environmental factors have been implicated in its initiation and progression. Psychosocial stress may play a role in the etiology of breast cancer, but the literature is conflicting. Few studies have found a positive association between psychosocial stress and the risk of having breast cancer [1,2]; other prospective and retrospective studies have yielded conflicting findings, with the majority of studies reporting no association [3,4,5,6,7], and even the reverse relationship [6,8]. Furthermore, systematic reviews and meta-analyses of these studies [9,10,11,12] were equivocal. A limitation in the literature is the lack of epidemiological studies attempting to link psychosocial factors to biologically plausible intermediates. Although further downstream signals converting psychosocial stress into cellular dysregulation and finally into breast cancer are not well understood, animal and in vitro studies have implicated glucocorticoid hormones in this process [13,14,15,16,17,18].
Glucocorticoids play an important role in several cellular processes, including apoptosis, inflammation, mammary development, and tumorigenesis [19]. Glucocorticoid signaling is mediated through the functional isoform, glucocorticoid receptor-alpha that resides predominantly in the cytoplasm. GCR is expressed in almost all human tissues in a cell-specific manner [20,21]. GCR activity is modulated by its level, subcellular localization, and interactions with other genes. Altered GCR response has been associated with the pathogenesis of several diseases, such as altered susceptibility to sporadic breast-cancer among Caucasian women [22], metabolic syndrome [23], cardiovascular disease [24], rheumatoid arthritis [25], and depression [26].
GCR is predominantly expressed in myoepithelial cells [27,28,29,30] in normal breast tissue and all stages of breast cancer; however, the relationship between breast cancer progression and GCR expression and subcellular localization appears inconsistent. A wide range of GCR levels (0 to 90% positive cells) in the cytoplasmic and or nuclear compartments has been reported previously in breast cancer tissue [27,28,29,30].
The purpose of this study was to examine the association between breast cancer characteristics and GCR in a series of breast cancer cases with defined clinical and histological characteristics, as we hypothesize that these alterations would be associated with breast cancer subtype or aggressiveness. We examined the association between breast cancer characteristics and genetic variants in GCR/NR3C1 and genes downstream of GCR activation: FKBP5, Sgk1, IL-6, ADIPOQ, LEPR, SOD2, CAT, and BCL2. To investigate GCR protein expression and subcellular localization, we used tissue microarray arrays (TMA) and multispectral digital imaging.
2. Materials and Methods
2.1. Study Population and Biological Samples
Patients and samples for this study are from the Breast Cancer Care in Chicago (BCCC) study, conducted by the UIC Center for Population Health and Health Disparities (NCI P50 CA106743). BCCC is a population-based cross-sectional study of women diagnosed with primary invasive breast cancer cases between 1 October 2005, and 29 February 2008 [31]. The parent study protocol was approved by the University of Illinois at Chicago Institutional Review Board (IRB#2010-0519). DNA samples and paraffin-embedded surgical samples were obtained from diagnosing hospitals prior to radiation or pharmacotherapy. Description of the BCCC cohort had been previously reported [32]. We had 656 cases with valid genetic ancestry estimates and linked clinical, sociodemographic, and epidemiological data to assess candidate gene variance. Tumor tissue from the invasive component from 287 cases was available for the immunohistochemical study (IHC).
2.2. SNP Selection and Genotyping
We genotyped 59 functionally important SNPs and tagging SNPs in GCR and GCR-associated genes. The SNPs were selected based on a minor allele frequency greater than 5% and previous association with GCR activity, breast cancer, or downstream related pathways such as inflammation and apoptosis. Genotyping was performed with iPLEX Gold assay on a MALDI-TOF (matrix-assisted laser desorption/ionization time-of-flight) mass-spectrometer (MassArray system) according to the manufacturer's recommendations. Genotyping quality control for all SNPs was assessed using blinded duplicate genotyping for 60 DNA samples. A genotype concordance rate of 99% was observed for all markers. Genotyping call rates exceeded 98.5% for all individuals included in the analyses.
2.3. Self-Reported Race/Ethnicity and Genetic Ancestry with Ancestry Informative Markers (AIMS)
Race and ethnicity were each defined at the interview through separate self-identification of Hispanic ethnicity and race. Racial/ethnic groups were categorized as non-Hispanic White, non-Hispanic Black, and Hispanic. Global genetic ancestry for the BCCC cohort was previously reported [32]. Ten cases that self-reported as non-Hispanic White and had more than 70% West African genetic ancestry were excluded. After the exclusions, genotype information was available for a total of 656 cases.
2.4. Tissue Microarray Immunohistochemical Staining and Scoring
Three tissue microarrays (TMA) were constructed from the BCCC breast cancer cases subcohort and stained as previously described [33]. The TMA consisted of tumor tissue for 287 cases and 26 normal breast tissues from unaffected women obtained by reduction mastectomy procedures and five fibroadenomas. A list of antibodies for immunohistochemical staining is summarized in Table A1. Immunohistochemical staining for GCR, performed by the UIC Research Histology and Tissue Imaging Core facility, was optimized by testing different sources and dilutions of the primary antibody and different antigen retrieval methods. Manual and digital scoring was performed as previously described [33]. GCR expression was evaluated based on the percentage of positive tumor cells and staining intensity. H-scores were calculated as the sum of staining intensity (0,1,2,3) and the percentage of cells (0–100%) in each intensity category (0, 1+, 2+ and 3+). The final scores were on a continuous scale between 0 and 300. An average H-score of the triplicate cores was used during analysis.
2.5. Statistical Analysis
Baseline characteristics of the population were compared across self-reported racial/ethnic groups using χ2 test for categorical variables and ANOVA for continuous variables. The primary response variable was GCR expression. GCR expression was dichotomized at the median to assess association with our outcome variables: stage at diagnosis, hormone receptor status, and histologic grade as markers of breast cancer progression or aggressiveness. The stage at diagnosis was categorized using the American Joint Committee on Cancer (AJCC) categories (0–4), with the later stage at diagnosis defined as stage >2 versus stage <1. Histological grade was determined through the Nottingham grading system. The higher grade was defined as grade intermediate and high versus low. ER/PR status was defined as positive if the tumor contained ER and/or PR receptors and negative in the absence of both receptor types. Molecular subtypes were categorized as Luminal A, Luminal B, HER2+, and triple negative. We also fitted logistic regression models to estimate the odds ratios (OR) and 95% confidence intervals (CIs). All reported p-values are two-sided, and a p-value < 0.05 was considered statistically significant. Statistical analyses were conducted using Stata version 11 (College Station, TX, USA).
For each SNP, the deviation of genotype frequencies from Hardy−Weinberg equilibrium (HWE) was assessed using χ2 test. The homozygous wild-type genotype served as the reference category. Association analyses were performed under dominant, recessive, or additive modes of inheritance. Separate logistic regression models were run for each self-reported racial/ethnic group (White, Black, and Hispanic), ancestry (European, West African, and Native American), and tumor characteristic to estimate OR (95% CI). We performed separate analyses for each racial/ethnic group because of the potential biological and environmental differences in factors contributing to breast cancer. The regression models were adjusted for health insurance, income, education, nulliparity, and age at first and last birth. All reported p-values are two-sided. A Bonferroni correction was used to account for multiple comparisons. Statistical analyses were conducted using R-Studio and Stata version 11 (College Station, TX, USA).
3. Results
3.1. Baseline Characteristics of the BCCC Sub-Cohort for the Genetic Study
The final cohort’s tumor and demographic characteristics included 250 White, 273 Black, and 120 Hispanic women (Table 1). The mean age at diagnosis was 55 years (range 25 to 78 years). Black and Hispanic women were diagnosed at a later stage, with higher grade disease and a higher proportion of ER/PR negative tumors than Whites. In addition, a greater proportion of Black and Hispanic women were overweight/obese, had more co-morbidities, were less likely to have their cancer detected through screening mammography, had a lower level of education and income, and less likely to have private insurance than Whites. The predominant genetic ancestry proportion among White cases was European genetic ancestry, with a mean of 90% (±SD 11%). The predominant genetic ancestry among Black cases was West African genetic ancestry, with a mean of 80% (±SD 13%). Hispanic women had a wide range of European (mean 40%), Native American (mean 40%), and West African (mean 20%) genetic ancestry representing a highly admixed group.

Table 1.
Baseline characteristics of the BCCC sample stratified by self-reported race/ethnicity.
3.2. Characteristics of Studied Markers
In the current analysis, we examined polymorphisms in GCR, Sgk1, BCL2, FKBP5, IL6, ADIPOQ, LEPR, SOD2, and CAT. The polymorphisms, including the minor allele frequencies (MAF) and HWE results by self-reported race/ethnicity summarized in Table A2. SNPS that failed the MAF and HWE (p = 0.05) in each self-reported racial/ethnic group were removed (Table A3).
We observed different allelic frequency distributions between the racial/ethnic groups for several SNPs (GCR: rs6191, rs33388, rs9324924, rs4607376; Sgk1: rs9493857; BCL 2: rs2279115; LEPR: rs1137101; SOD2: rs4880). Our reported allele frequencies were similar to those in the Single Nucleotide Polymorphism Database [34]. A Bonferroni correction was used to account for multiple comparisons. There were 52 comparisons for the Blacks category with a corrected alpha = 0.001 and 49 comparisons for Whites and Hispanics with a corrected alpha: 0.001. None of the associations between those SNPs and breast cancer characteristics remained statistically significant after adjustment for multiple comparisons.
3.3. Genotypes and Histological Grade at Diagnosis
Table 2 summarizes the significant associations (p < 0.06) between higher histological grade at diagnosis and individual SNPs. Among the White cases, a higher grade at diagnosis was associated with the GCR rs33388TT and rs6191GG genotypes were associated with two-fold increased odds of high-grade disease. The GCR rs41423247GC+CC genotype was associated with lower grade disease (OR 0.56: 95% CI 0.32–0.99). IL-6 rs1800797AG+AA genotype (OR, 1.99:95% CI 1.07–3.73) was associated with higher grade. Among the Black cases, GCR rs10052957AG+AA, rs258813AA, rs2918418AA, rs33388AA, rs41423247GC/CC, rs6188TT, rs6191TT and rs9324924GG genotypes were associated with higher grade disease, whereas GCR rs10482616GA+AA, rs10482672TC+TT, or rs7701443AG+GG or rs9296158AA genotypes were associated with lower grade disease. The FKBP5 rs9296158AA genotype was associated with lower grade disease (OR 0.45: 95% CI 0.23–0.9). Among the Hispanic cases, only the GCR rs9324924GT+TT genotype was associated with higher grade disease (OR 3.14: 95% CI 0.99–10). None of the associations between those SNPs and stage at diagnosis remained statistically significant after adjustment for multiple comparisons.
Table 2.
SNPs with a significant association with a higher grade at diagnosis (p < 0.06).
3.4. Genotypes and Stage at Diagnosis
We examined the association between later stage at diagnosis and individual SNPs among breast cancer cases (Table 3). Among Black cases, the A allele of GCR rs10482614 was associated with later stage at diagnosis (OR, 8: 95% CI 2–39), but there were few cases (n = 12) in this category. Several SNPs in the FKBP5 gene were associated with stage at diagnosis. Black cases with FKBP5 (rs3777747GG) were associated with a later stage of diagnosis (OR, 2:95% CI 0.98–4.11). However, the FKBP5 genotypes rs3800373GT+GG, rs9296158AG+AA, 9470080CT+TT were associated with a nearly 50% decreased prevalence of the later stage at diagnosis. For Hispanic cases, the ADIPOQ rs1501299CA+AA genotype was associated with decreased odds of later stage (OR, 0.39: 95% CI 0.17–0.87), while the rs266729GC+GG genotype was associated with late stage (OR, 3.01: 95% CI 1.35–6.73). None of the tested SNPs were statistically significant at p < 0.06 level for White cases. None of the associations between the studied SNPs and grade at diagnosis remained statistically significant after adjustment for multiple comparisons.
Table 3.
List of SNPs with significant association with later stage at diagnosis (p < 0.06).
3.5. Genotypes and Hormone Receptor Status
Table 4 summarizes the results of the significant association (p < 0.06) between ER/PR positivity and individual SNPs. Among White cases, we found an inverse association for the CC genotype of GCR rs12656106 and ER/PR positivity (OR, 0.47; 95% CI 0.17–1.35). For Black cases, GCR (rs10482616GA+AA), ADIPOQ (rs1501299CA+AA) and BCL2 (rs2279115AA) were associated with ER or PR receptor positivity. None of the SNPs were significant at alpha < 0.06 among Hispanic cases. Overall, none of the associations between those SNPs and hormone-receptor status remained statistically significant after adjustment for multiple comparisons. All the significant results (p < 0.06) are summarized in Table 5.
Table 4.
List of SNPs with significant association with hormone receptor positivity (ER or PR) (p < 0.06).
Table 5.
Summary of significant associations between genetic variants and breast cancer characteristics.
3.6. Characteristics of the BCCC Subcohort for the TMA Study
We measured GCR protein expression in breast cancer tissue from 287 cases. The descriptive statistics of this subset are summarized in Table A4. The mean age at diagnosis was 56 years (SD ± 11), and cases consisted of 103 Black, 84 White and 80 Hispanic patients. The cases in the subcohort still showed the racial/ethnic disparity in the distribution of patient characteristics. A greater proportion of Black and Hispanic women were overweight/obese, had more comorbidities, were less likely to have their cancer detected through screening mammography, had a lower level of education and income, and less likely to have private insurance than Whites. Black women were diagnosed at a later stage, with higher grade disease. Most of the cases were of the ductal histological type, luminal A molecular subtype, and were ER and/or PR positive (Table 6).
Table 6.
GCR expression in breast tissue from the BCCC TMA study.
3.7. GCR Expression and Subcellular Localization in Normal and Cancer Tissue
Representative images of nuclear GCR staining intensity in normal, fibroadenoma, and cancerous breast tissue, along with digital imaging annotation, are shown in Figure 1. In normal breast tissue, GCR was expressed predominantly in the nuclei of the myoepithelial cell layer that surrounds normal ducts and lobules. The luminal layer in normal breast tissue was negative for GCR. Among the fibroadenoma samples, GCR staining was not limited to the myoepithelial layer as nuclear and cytoplasmic staining of luminal epithelial cells was also detected. There was diffuse GCR staining throughout the cancer foci in the breast cancer tissue, which was likely due to the loss of normal glandular architecture and outlining myoepithelium in these malignant cells.
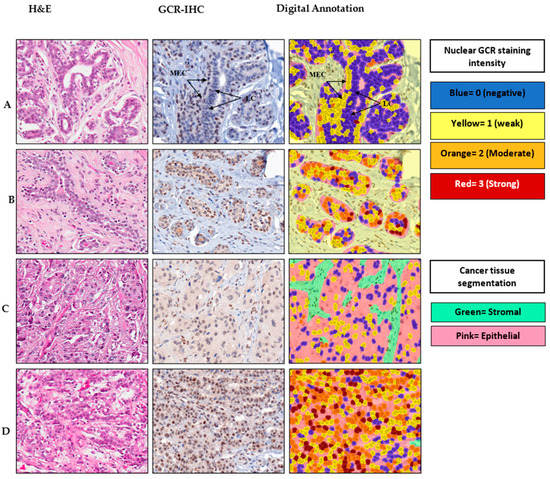
Figure 1.
Immunohistochemical staining and digital output images for glucocorticoid receptor (GCR) in representative cases. For each case, H&E and the corresponding anti-GCR IHC image and digital analysis output are shown. (A) Normal breast tissue, (B) fibroadenoma, (C) ductal carcinoma and (D) lobular carcinoma. LC, luminal cells; MEC, myoepithelial cells.
3.8. GCR Expression in Normal and Cancer Tissue Using Digital Scoring
GCR was detected in both the cytoplasm and nuclear compartments of the normal myoepithelial cells and the GCR-positive breast cancer cells. Despite the low expression of GCR in the cytoplasm relative to the nuclear compartment, there was a strong correlation between nuclear and cytoplasmic H-scores. (Spearman’s Rho = 0.80; p < 0.00001 and r2 = 0.72).
GCR staining was lower in cancer tissue compared with normal tissue and fibroadenoma samples. When we dichotomized nuclear H-scores for breast cancer cases at the sample median for all samples (mean H-score = 17), 44% of breast cancer cases had positive nuclear staining as opposed to 100% in normal breast tissue and fibroadenoma, respectively (Table 6). In breast cancer tissue, cytoplasmic staining (mean H-score = 3) was weaker than nuclear staining (mean H-score = 29); 57% of breast cancer TMA cores had an H-score = 0 for cytoplasmic GCR. We did not observe a statistically significant difference in GCR staining among breast cancer subtypes. However, compared with ductal carcinoma, lobular carcinoma had greater nuclear GCR expression (mean H-score: 27 s. 36, respectively) and a greater percentage of nuclear positive cases (42% versus 48%, respectively).
3.9. Correlation between Nuclear GCR Expression and Breast Cancer Characteristics
We measured the association of GCR staining with clinicopathologic characteristics, histological and molecular breast tumor subtypes. Positive nuclear GCR expression was weakly associated with any strong family history of breast cancer (p = 0.069) but was not associated with self-reported race, BMI, nulliparity, menopausal status, stage or grade at diagnosis, or subtypes of breast cancer.
3.10. Correlation between Nuclear GCR and CK 5/6 Expression
In our immunohistochemical study, nuclear GCR staining strongly correlated with cytoplasmic CK 5/6 expression, a marker of the tumor's basal nature. Figure 2 is a representative staining pattern of CK 5/6 in nontumor and breast cancer tissue, illustrating the correlation between GCR and CK 5/6. We observed diffuse cytoplasmic staining of CK 5/6 in the myoepithelial cells in nontumor and tumor breast tissue. There was a statistically significant difference in the mean H-score of nuclear GCR among CK5/6 high (mean = 36) and CK5/6 low (mean = 19) samples. Multivariate logistic regression of high CK 5/6 regressed on high GCR while adjusting for race, age at diagnosis and stage, grade, and histological category revealed that high GCR expression remained associated with CK5/6 expression (OR 3.3; 95% CI, 1.6–6.9). CK 5/6 was not associated with race/ethnicity, age at diagnosis, hormone receptor status, stage and grade at diagnosis, or breast cancer subtypes.
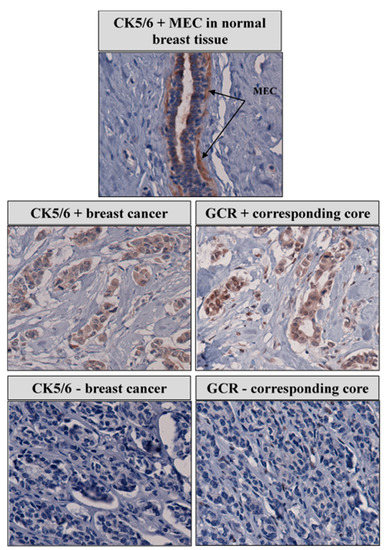
Figure 2.
Correlation between GCR and CK 5/6 and expression in representative breast cancer cases.
4. Discussion
Several genetic variants were associated with later disease stage, higher grade, and hormone receptor-negative status even after correction for population stratification, before adjustment for multiple comparisons. Two functional SNPs in GCR (rs6191, rs33388) were associated with a higher grade between White and Black cases, but not Hispanic cases. The minor allele associated with the phenotype differed between the racial/ethnic groups. The minor allele G of rs6191 was associated with an increased prevalence of high grade among White cases, while the minor allele T was associated with a higher grade among Black cases. The minor allele T of rs33388 was associated with an increased prevalence of high grade among White cases, while the minor allele A was associated with a higher grade among Black cases. The rs41423247 variant in GCR was associated with lower grade in the White cases and it has been shown to be associated with hypersensitivity to glucocorticoids [35].
The rs9324924 was associated with a higher grade in the Black and Hispanic cases. However, the minor G allele in Black and the GT and TT genotypes among Hispanics were associated with a higher grade. The rs10482616GA+AA was associated with ER or PR receptor positivity among Black cases. It is hard to interpret the impact of these variants on breast cancer characteristics as none of these SNPs have been previously studied in breast cancer.
We observed an inverse relationship between stage at diagnosis and 3 FKPB5 SNPs (rs3800373, rs9296158, rs9470080) among Black cases. FKBP5 is a co-chaperone, which belongs to the immunophilin family. Immunophilins are a large, functionally diverse group of proteins defined by their ability to bind immunosuppressive ligands. FKBP5 expression is highly inducible by glucocorticoids and functions as a negative transcriptional regulator of GCR [36]. In addition, over-expression of FKBP5 impairs nuclear localization of GCR (Binder, 2009). The rs3800373, rs9296158 and rs9470080 FKPB5 SNPs have been associated with a higher FKBP5 expression and a more potent induction of FKBP5 mRNA by cortisol [37]. Romano et al. have observed a low/negative protein expression of FKBP5 among ten breast cancer samples [38]. If these associations are real and not a result of type 1 error, it is possible that these FKBP5 polymorphisms might be reducing GCR activation by inhibiting nuclear translocation.
We identified associations with two ADIPOQ SNPs (rs1501299 and rs266729) and stage at diagnosis among Hispanic cases. The ADIPOQ rs1501299CA+AA genotypes were protective against the later stage (OR 0.39, 95% CI 0.17-0.87), while the ADIPOQ rs266729GC+GG genotypes were associated with a later stage (OR 3.01, 95% CI 1.35-6.73). The ADIPOQ (rs1501299 CA+AA) was associated with ER or PR receptor positivity among Black cases. These two SNPs have been previously associated with circulating levels of ADIPOQ and breast cancer. Kaklamani et al. have previously shown that the rs1501299 was associated with increased breast cancer prevalence among African American women [39]. The G allele at rs266729 is associated with lower adiponectin levels and obesity [40].
Among the White cases, a higher grade at diagnosis was associated with IL-6 rs1800797AG+AA genotype. IL-6 is an inflammatory cytokine where high serum levels of IL-6 have been shown to correlate with poor outcomes in breast cancer patients [41] and several IL6 SNPs have been associated with breast cancer risk and prognosis [42].
The B-cell CLL/lymphoma 2 (BCL2) gene encodes an antiapoptotic protein, a critical regulator of programmed cell death. Higher levels of BCL2 expression in breast tumors have been shown to be an independent prognostic factor for improved survival from breast cancer [43]. The BCL2 rs2279115AA was associated with ER or PR receptor positivity. Bachman et al. found that a higher expression of BCL2 was associated with the A-allele, and survival analysis revealed a significant association of the AA genotype with improved survival [44].
It is possible that those SNPs are not causal; it is also possible that causal SNPs exist but are not located in the measured SNP's vicinity. Given the modest sample sizes within racial and ethnic groups and the large number of SNPs analyzed, genetic variants were not associated with breast cancer characteristics after multiple comparison corrections. This was not unexpected given the limited power to detect associations revealed by post hoc power analyses that generally implied the power to detect associations of 60% or less (not shown).
Glucocorticoid signaling via GCR regulates many physiological processes, including those involved in mammary development and differentiation. We examined the protein expression of GCR in breast tissue from our breast cancer cases subcohort, BCCC, in a TMA study and compared it to nontumor tissue. We found that GCR was expressed in all normal and fibroadenoma samples and was mainly localized in myoepithelial cells. There was a marked reduction in nuclear GCR expression in breast cancer tissue compared to normal or benign breast tissue lesions that might be due to disruption of the myoepithelial cell layer and basement membrane during tumor invasion [45]. Our findings could reflect either that GCR is involved in a biological pathway leading to breast cancer or is a marker of other causal mechanisms associated with breast cancer development. GCR has been shown to promote both cell survival and cell death, depending on the cell type. High expression of the GCR gene is associated with poor outcomes in ER- patients and better outcomes in ER+ patients [46].
Based on our findings, we propose that GCR has a tumor suppressor role in breast cancer. The downregulation of the nuclear GCR observed in our study has also been observed in prostate cancer, another hormone-sensitive tumor [47]. GCR was shown to exert tumor suppressor effects in a skin cancer mouse model [48]. It would be important to compare GCR levels from adjacent histologically normal areas, in situ, and invasive components from the same patient to examine expression changes during breast tumorigenesis.
Several studies from different countries across various ethnic groups have detected both cytoplasmic and nuclear GCR expression using either monoclonal [28,29,30] or polyclonal antibodies against GCR [27]. Our results are in agreement with the pattern of decreased nuclear GCR expression reported in these prior studies. However, we did not observe a decrease in nuclear GCR expression nor increased cytoplasmic GCR with tumor progression [30]. We found that cytoplasmic GCR positively correlated with nuclear GCR expression. Unlike one of these studies [28] we did not find any correlation between GCR expression and age at diagnosis or histological and molecular subtypes of breast cancer.
We observed a strong correlation between GCR and CK5/6. Cytokeratins are filament-forming proteins that provide mechanical support in epithelial cells [49]. In normal tissue, CK5/6 is mainly expressed in the basal–myoepithelial cell layer of the prostate, breast, and salivary glands. CK5/6 are also seen in benign and malignant tumors of epidermal, squamous mucosal, and myoepithelial origins [50]. The cytokeratins 5/6 are found in the cells of the basal layer of normal breast ducts [51]. Expression of CK 5/6 has been associated with poor breast cancer prognosis and is an independent indicator for shorter relapse-free survival [52]. Furthermore, immunohistochemical expression of basal CK5/6 is associated with aggressive disease and adversely impacts survival in HER2+ breast cancer patients [53].
It is difficult to reconcile the correlation between a possible tumor suppressor, GCR, with a marker of an aggressive phenotype of breast cancer, CK 5/6. There might be a functional connection between GCR and the CK 5/6 independent of breast cancer. GCR knockout mice have significant skin development defects with impaired keratinocyte differentiation and aberrant proliferation and apoptosis [54].
This study’s strength is that the samples came from a population-based study of breast cancer patients' detailed demographic and clinical data and, therefore, may be generalizable to an urban population. This study’s limitations include its cross-sectional nature, limiting the ability to assess temporal aspects of our associations. There are also limitations in the tissue microarray and immunohistochemical staining technique used in this and other studies. Tissue stained might not represent the tumor due to tumor heterogeneity.
5. Conclusions
To the best of our knowledge, this is the first study to examine the relationship between GCR and GCR-related gene polymorphisms, GCR protein expression and breast cancer characteristics. Activation of the glucocorticoid-mediated pathway plays an essential role in several cellular processes, and disruption of GCR activity could play a role in breast cancer progression and aggression. Using samples from an urban, multiracial study of breast cancer, we found several genetic variants of functionally important SNPs associated with later disease stage, higher grade, and hormone receptor-negative status. GCR protein was expressed in all normal and fibroadenoma samples. GCR expression is reduced in breast cancer tissue and correlated with the basal cell marker CK5/6.
Author Contributions
Conceptualization, U.A.-A., A.M.M., P.H.G., R.K. and G.H.R.; data curation, U.A.-A., A.M.M., K.B., R.K. and G.H.R.; formal analysis, U.A.-A., A.M.M., K.B., and G.H.R.; funding acquisition, U.A.-A., A.M.M., and G.H.R.; investigation, U.A.-A. and G.H.R.; methodology, U.A.-A., A.M.M., K.B., E.S.-W., P.H.G., R.K. and G.H.R.; project administration, U.A.-A., and G.H.R.; resources, A.M.M., P.H.G., R.K. and G.H.R.; supervision, P.H.G., R.K. and G.H.R.; validation, U.A.-A., A.M.M., K.B., E.S.-W., P.H.G., R.K. and G.H.R.; writing—original draft, U.A.-A. and A.M.M.; writing—review and editing, U.A.-A., A.M.M., K.B., E.S.-W., P.H.G., R.K. and G.H.R. All authors have read and agreed to the published version of the manuscript.
Funding
The parent study was funded by a grant from the National Institutes of Health (2P50CA106743-Illinois at Chicago from the National Cancer Institute (Grant # 2P50CA106743-06); the National Center on Minority Health and Health Disparities (Grant # 1 P60MD003424-01); and the National Institute of Health-NHLBI (Grant # 4 R00HL140049—03).
Institutional Review Board Statement
The study was conducted according to the guidelines of the Declaration of Helsinki, and approved by the University of Illinois at Chicago Institutional Review Board (IRB#2010-0519).
Informed Consent Statement
Informed consent was obtained from all subjects involved in the study.
Data Availability Statement
Data presented in this study are available on request from the first author (UA).
Conflicts of Interest
The authors declare no conflict of interest.
Appendix A
Table A1.
List of antibodies for immunohistochemical staining.
Table A1.
List of antibodies for immunohistochemical staining.
| Antigen | Manufacturer | Host | Clone # | Dilution | Retrieval Method |
|---|---|---|---|---|---|
| GCR | Leica/Novocastra | Mouse | 4H2 | 1:25 | HIER |
| IHC subtyping antibodies panel: | |||||
| ER | Ventana | Rabbit | SP1 | Predilute | CC1 Mild |
| PR | Ventana | Rabbit | 1.00E + 02 | Predilute | CC1 Mild |
| Her-2 | Ventana | Mouse | 4B5 | Predilute | CC1 Mild |
| CK 5/6 | DAKO | Mouse | D5 & 16B4 | 1:50 | HIER |
| EGFR | Ventana | Mouse | 3C6 | Predilute | CC1 Mild |
Abbreviations: HCF: UIC Histology Core Facility; MC: Medical Center at Chicago Clinical Reference Surgical Pathology laboratory; HIER: Heat-induced epitope retrieval; CC1: cell conditioning solution 1.
Table A2.
Characteristics of studied polymorphism.
Table A2.
Characteristics of studied polymorphism.
| dbSNP_ID | Coordinates | Type | nH Blacks | nH Whites | Hispanics | |||||||
| MA | MAF | HWE | MA | MAF | HWE | MA | MAF | HWE | ||||
| GCR (NR3C1) at 5q31.1 | ||||||||||||
| rs174048 | 142650404 | upstream of NR3C1 | C | 0.167 | 1.00 | C | 0.164 | 0.48 | C | 0.09 | 1.0 | |
| rs17287745 | 142655015 | Downstream gene | G | 0.135 | 0.11 | G | 0.369 | 0.10 | G | 0.26 | 0.2 | |
| rs17287758 | 142657021 | Downstream gene | A | 0.080 | 0.68 | A | 0.155 | 0.63 | A | 0.08 | 1.0 | |
| rs6191 | 142658156 | 3′ UTR | T | 0.456 | 0.63 | G | 0.482 | 1.00 | T | 0.38 | 0.4 | |
| rs17209251 | 142669223 | Intron | G | 0.055 | 0.17 | G | 0.192 | 0.68 | G | 0.17 | 0.1 | |
| rs258813 | 142674690 | Intron | A | 0.306 | 0.77 | A | 0.322 | 0.47 | A | 0.18 | 0.4 | |
| rs6188 | 142680344 | Intron | T | 0.272 | 0.16 | T | 0.290 | 0.005 | T | 0.14 | 1.0 | |
| rs10482672 | 142692533 | Intron | T | 0.175 | 0.006 | T | 0.168 | 0.22 | T | 0.10 | 0.1 | |
| rs33388 | 142697295 | Intron | A | 0.443 | 0.62 | T | 0.476 | 0.61 | A | 0.38 | 0.7 | |
| rs2918418 | 142723373 | Intron | G | 0.197 | 0.44 | G | 0.170 | 0.18 | G | 0.10 | 0.6 | |
| rs4912905 | 142730376 | Intron | C | 0.101 | 0.32 | C | 0.206 | 0.56 | C | 0.27 | 0.2 | |
| rs2963155 | 142756004 | Intron | G | 0.279 | 0.65 | G | 0.260 | 0.19 | G | 0.15 | 1.0 | |
| rs9324921 | 142767740 | Intron | A | 0.153 | 0.35 | A | 0.059 | 0.19 | A | 0.05 | 1.0 | |
| rs41423247 | 142778575 | Intron | C | 0.251 | 0.52 | C | 0.353 | 1.00 | C | 0.25 | 0.1 | |
| rs6195 | 142779317 | Exon | G | 0.009 | 1.00 | G | 0.026 | 1.00 | G | 0.00 | 1.0 | |
| rs6189 | 142780339 | Synonymous | 0 | 0.000 | 1.00 | A | 0.036 | 0.27 | A | 0.01 | 0.004 | |
| rs10482616 | 142781567 | Intron | A | 0.182 | 0.41 | A | 0.170 | 1.00 | A | 0.25 | 0.8 | |
| rs10482614 | 142782402 | Intron | A | 0.204 | 0.71 | A | 0.169 | 0.11 | A | 0.12 | 1.0 | |
| rs10482605 | 142783521 | Intron | C | 0.054 | 0.003 | C | 0.091 | 0.0001 | C | 0.04 | 0.1 | |
| rs72801094 | 142785905 | Intron | C | 0.019 | 1.00 | C | 0.060 | 0.60 | C | 0.05 | 1.0 | |
| rs10052957 | 142786701 | Intron | A | 0.273 | 0.76 | A | 0.320 | 0.67 | A | 0.20 | 1.0 | |
| rs9324924 | 142792484 | Intron | G | 0.338 | 0.68 | T | 0.421 | 1.00 | T | 0.46 | 0.9 | |
| rs7701443 | 142792650 | Intron | G | 0.431 | 0.11 | G | 0.406 | 1.00 | G | 0.48 | 0.7 | |
| rs4244032 | 142794725 | Intron | G | 0.135 | 0.80 | G | 0.169 | 1.00 | G | 0.11 | 0.6 | |
| rs4607376 | 142796532 | Intron | G | 0.241 | 0.03 | A | 0.480 | 0.16 | G | 0.44 | 0.3 | |
| rs13182800 | 142801480 | Intron | T | 0.194 | 0.07 | T | 0.183 | 0.40 | T | 0.12 | 0.2 | |
| rs12054797 | 142805902 | Intron | T | 0.097 | 0.02 | T | 0.248 | 0.86 | T | 0.28 | 0.5 | |
| rs12656106 | 142808947 | Intron | C | 0.167 | 0.64 | C | 0.407 | 0.33 | C | 0.34 | 0.4 | |
| rs12521436 | 142817607 | Upstream gene | A | 0.236 | 0.61 | A | 0.167 | 0.25 | A | 0.220 | 0.006 | |
| rs4912913 | 142818306 | Upstream gene | T | 0.5 | 0.05 | T | 0.476 | 0.16 | C | 0.333 | 0.01 | |
| FKBP5 at 6p21.3-21.2 | ||||||||||||
| rs3800373 | 35542476 | 3′ UTR | G | 0.409 | 0.61 | G | 0.260 | 1.00 | G | 0.34 | 0.8 | |
| rs1360780 | 35607571 | Intron | T | 0.321 | 0.00001 | T | 0.172 | 0.04 | T | 0.14 | 0.02 | |
| rs17614642 | 35621921 | Intron | C | 0.023 | 1.00 | C | 0.077 | 0.16 | C | 0.06 | 0.4 | |
| rs34866878 | 35544942 | Synonymous | A | 0.174 | 0.83 | A | 0.030 | 1.00 | A | 0.07 | 0.5 | |
| rs3777747 | 35579002 | Intron | G | 0.389 | 1.00 | G | 0.488 | 0.70 | G | 0.47 | 1.0 | |
| rs3798346 | 35562640 | Intron | G | 0.044 | 0.32 | G | 0.175 | 1.00 | G | 0.11 | 1.0 | |
| rs4713916 | 3566983 | Intron | A | 0.134 | 0.28 | A | 0.270 | 0.52 | A | 0.25 | 0.1 | |
| rs9296158 | 35567082 | Intron | A | 0.464 | 0.81 | A | 0.304 | 0.77 | A | 0.37 | 0.8 | |
| rs9470080 | 35646435 | Intron | T | 0.435 | 0.51 | T | 0.294 | 0.19 | T | 0.37 | 1.0 | |
| rs41270080 | 35542045 | 3′ UTR | A | 0.170 | 0.34 | A | 0.036 | 1.00 | A | 0.07 | 1.0 | |
| rs4713899 | 35569281 | Intron | A | 0.133 | 0.59 | A | 0.165 | 0.23 | A | 0.12 | 0.1 | |
| rs6912833 | 35617585 | Intron | A | 0.169 | 1.00 | A | 0.280 | 0.64 | A | 0.27 | 1.0 | |
| rs737054 | 35575487 | Noncoding exon | T | 0.078 | 0.21 | T | 0.282 | 0.88 | T | 0.29 | 1.0 | |
| rs73746499 | 35578851 | Intron | G | 0.182 | 1.00 | G | 0.032 | 1.00 | G | 0.08 | 0.6 | |
| rs755658 | 35549670 | 3 prime UTR | A | 0.023 | 1.00 | A | 0.085 | 0.69 | A | 0.14 | 0.7 | |
| rs9366890 | 35562974 | Intron | T | 0.175 | 0.13 | T | 0.178 | 0.83 | T | 0.13 | 0.1 | |
| rs9380524 | 35589070 | Intron | A | 0.025 | 1.00 | A | 0.094 | 0.14 | A | 0.09 | 1.0 | |
| SGK-1 6q23.2 | ||||||||||||
| rs9493857 | 134530697 | Intron | G | 0.272 | 0.06 | A | 0.201 | 0.0000 | A | 0.41 | 0.2 | |
| BCL2 18q21.33 | ||||||||||||
| rs2279115 | 60986837 | 5' UTR | A | 0.260 | 0.002 | C | 0.451 | 0.52 | C | 0.36 | 0.1 | |
| IL-6 7p21 | ||||||||||||
| rs1800796 | 22766246 | Noncoding exon | A | 0.130 | 0.09 | A | 0.379 | 1.00 | A | 0.21 | 1.0 | |
| rs1800797 | 22766221 | Noncoding exon | A | 0.091 | 0.03 | A | 0.054 | 0.42 | A | 0.18 | 0.3 | |
| rs1800795 | 22766645 | Intron | C | 0.112 | 0.47 | C | 0.378 | 1.00 | C | 0.19 | 1.0 | |
| rs6949149 | 22749157 | Regulatory region | T | 0.123 | 0.002 | T | 0.088 | 0.42 | T | 0.18 | 0.1 | |
| ADIPOQ 3q27.3 | ||||||||||||
| rs266729 | 186559474 | Upstream gene | G | 0.119 | 0.78 | G | 0.276 | 0.15 | G | 0.26 | 0.3 | |
| rs1501299 | 186571123 | Intron | A | 0.321 | 0.78 | A | 0.268 | 0.52 | A | 0.33 | 0.7 | |
| LEPR 1p31.3 | ||||||||||||
| rs1137100 | 66036441 | Exon | G | 0.182 | 0.41 | G | 0.230 | 0.21 | G | 0.30 | 0.8 | |
| rs1137101 | 66058513 | Exon | A | 0.494 | 0.72 | G | 0.434 | 0.12 | G | 0.44 | 0.3 | |
| SOD2 6q25.3 | ||||||||||||
| rs4880 | 160113872 | Missense | C | 0.489 | 0.40 | T | 0.500 | 0.38 | T | 0.38 | 0.8 | |
| CAT 11p13 | ||||||||||||
| rs1001179 | 34460231 | Upstream gene | A | 0.061 | 1.00 | A | 0.244 | 0.287 | A | 0.066 | 1.0 | |
Abbreviations: MA: minor allele, MAF: minor allele frequency, HWE: Hardy−Weinberg equilibrium, UTR: untranslated region. DNA position: according to the NCBI genomic reference sequence NT_029289.11.
Table A3.
SNPs removed from analysis.
Table A3.
SNPs removed from analysis.
| Self-Reported Race/Ethnicity | Black | White | Hispanic |
|---|---|---|---|
| Excluded SNPs | rs6189 rs6195 rs1360780 rs755658 rs9380524 rs17614642 rs72801094 | rs6189 rs6195 rs737499 rs1800796 rs9493857 rs5871845 rs9380524 rs10482605 rs34866878 rs41270080 rs7280109 | rs6189 rs6195 rs174048 rs9324921 rs2918418 rs1001179 rs1360780 rs10482605 rs17287758 rs41270080 rs72801094 |
Table A4.
Distribution of demographic and clinical characteristics of BCCC sub-cohort.
Table A4.
Distribution of demographic and clinical characteristics of BCCC sub-cohort.
| Total | Whites % | Blacks % | Hispanics % | p-Value | |
|---|---|---|---|---|---|
| Genetic Ancestry, Mean (±SD) | |||||
| European | 88 (12) | 16 (12) | 48 (20) | <0.0001 | |
| West African | 9 (11) | 80 (12) | 15 (19) | <0.0001 | |
| Native American | 3 (3) | 4 (4) | 37 (20) | <0.0001 | |
| Age at first birth, Mean years (±SD) | 26 (6) | 20 (5) | 23 (5) | <0.0001 | |
| Age at last birth, Mean years (±SD) | 31 (6) | 29 (5) | 32 (6) | 0.0129 | |
| Age at diagnosis | |||||
| <50years | 66 | 29 | 39 | 32 | 0.765 |
| ≥50years | 149 | 33 | 40 | 28 | |
| CDC categories of BMI (kg/m2) | |||||
| Normal weight (18.5—24.9) | 47 | 40 | 36 | 23 | 0.078 |
| Overweight (25.0—29.9) | 75 | 29 | 32 | 39 | |
| Obese (≥30.0) | 91 | 28 | 48 | 24 | |
| Education | |||||
| Less than High school | 55 | 6 | 35 | 60 | <0.0001 |
| High school | 53 | 23 | 55 | 23 | |
| Some college | 107 | 50 | 35 | 16 | |
| Annual household Income | |||||
| Less than $30,000 | 102 | 13 | 49 | 38 | <0.0001 |
| $30,000 to $75,000 | 69 | 44 | 33 | 23 | |
| Greater than $75,000 | 39 | 56 | 26 | 18 | |
| Insurance category | |||||
| No outpatient insurance | 28 | 11 | 50 | 39 | <0.0001 |
| Public | 47 | 6 | 55 | 38 | |
| Private | 134 | 44 | 31 | 25 | |
| Any comorbidities | |||||
| No | 94 | 31 | 34 | 35 | 0.007 |
| Yes | 115 | 31 | 44 | 25 | |
| Nulliparous | |||||
| No | 34 | 74 | 18 | 9 | <0.0001 |
| Yes | 175 | 23 | 43 | 34 | |
| Menopausal status | |||||
| No | 34 | 21 | 38 | 41 | 0.167 |
| Yes | 180 | 33 | 40 | 27 | |
| Family history breast cancer | |||||
| No | 201 | 31 | 39 | 30 | 0.41 |
| Yes | 13 | 46 | 39 | 15 | |
| Mode of detection | |||||
| Screen-detected | 92 | 44 | 33 | 24 | 0.003 |
| Symptoms and no recent prior screen | 59 | 24 | 51 | 25 | |
| Symptoms despite a recent prior screen | 58 | 19 | 38 | 43 | |
| Stage at diagnosis | |||||
| 0,1 (early stage) | 94 | 42 | 32 | 27 | 0.021 |
| 2,3,4 (late stage) | 120 | 24 | 46 | 30 | |
| Histologic grade | |||||
| Low/intermediate | 134 | 35.1 | 34.3 | 30.6 | 0.068 |
| High | 75 | 25.3 | 50.7 | 24 | |
| ER and/or PR | |||||
| ER and/or PR positive | 143 | 34 | 36 | 30 | 0.203 |
| Double negative | 47 | 26 | 51 | 23 | |
| Her2/neu overexpression | |||||
| No | 124 | 33 | 36 | 31 | 0.068 |
| Yes | 23 | 26 | 61 | 13 |
p-values for categorical variables are from χ2 tests and from ANOVA for continuous variables for differences according to self-reported race/ethnicity.
References
- Helgesson, O.; Cabrera, C.; Lapidus, L.; Bengtsson, C.; Lissner, L. Self-reported stress levels predict subsequent breast cancer in a cohort of Swedish women. Eur. J. Cancer Prev. 2003, 12, 377–381. [Google Scholar] [CrossRef]
- Lillberg, K.; Verkasalo, P.K.; Kaprio, J.; Teppo, L.; Helenius, H.; Koskenvuo, M. Stressful life events and risk of breast cancer in 10,808 women: A cohort study. Am. J. Epidemiol. 2003, 157, 415–423. [Google Scholar] [CrossRef]
- Michael, Y.L.; Carlson, N.E.; Chlebowski, R.T.; Aickin, M.; Weihs, K.L.; Ockene, J.K.; Bowen, D.J.; Ritenbaugh, C. Influence of stressors on breast cancer incidence in the Women′s Health Initiative. Health Psychol. 2009, 28, 137–146. [Google Scholar] [CrossRef]
- Surtees, P.G.; Wainwright, N.W.; Luben, R.N.; Khaw, K.T.; Bingham, S.A. No evidence that social stress is associated with breast cancer incidence. Breast Cancer Res. Treat. 2010, 120, 169–174. [Google Scholar] [CrossRef]
- Roberts, F.D.; Newcomb, P.A.; Trentham-Dietz, A.; Storer, B.E. Self-reported stress and risk of breast cancer. Cancer 1996, 77, 1089–1093. [Google Scholar] [CrossRef]
- Kroenke, C.H.; Hankinson, S.E.; Schernhammer, E.S.; Colditz, G.A.; Kawachi, I.; Holmes, M.D. Caregiving stress, endogenous sex steroid hormone levels, and breast cancer incidence. Am. J. Epidemiol. 2004, 159, 1019–1027. [Google Scholar] [CrossRef]
- Lillberg, K.; Verkasalo, P.K.; Kaprio, J.; Teppo, L.; Helenius, H.; Koskenvuo, M. Stress of daily activities and risk of breast cancer: A prospective cohort study in Finland. Int. J. Cancer 2001, 91, 888–893. [Google Scholar] [CrossRef]
- Ravn-Haren, G.; Olsen, A.; Tjonneland, A.; Dragsted, L.O.; Nexo, B.A.; Wallin, H.; Overvad, K.; Raaschou-Nielsen, O.; Vogel, U. Associations between GPX1 Pro198Leu polymorphism, erythrocyte GPX activity, alcohol consumption and breast cancer risk in a prospective cohort study. Carcinogenesis 2006, 27, 820–825. [Google Scholar] [CrossRef] [PubMed]
- Antonova, L.; Aronson, K.; Mueller, C.R. Stress and breast cancer: From epidemiology to molecular biology. Breast Cancer Res. 2011, 13, 208. [Google Scholar] [CrossRef]
- Callagy, G.M.; Pharoah, P.D.; Pinder, S.E.; Hsu, F.D.; Nielsen, T.O.; Ragaz, J.; Ellis, I.O.; Huntsman, D.; Caldas, C. Bcl-2 is a prognostic marker in breast cancer independently of the Nottingham Prognostic Index. Clin. Cancer Res. 2006, 12, 2468–2475. [Google Scholar] [CrossRef] [PubMed]
- Duijts, S.F.; Zeegers, M.P.; Borne, B.V. The association between stressful life events and breast cancer risk: A meta-analysis. Int. J. Cancer 2003, 107, 1023–1029. [Google Scholar] [CrossRef]
- McKenna, M.C.; Zevon, M.A.; Corn, B.; Rounds, J. Psychosocial factors and the development of breast cancer: A meta-analysis. Health Psychol. 1999, 18, 520–531. [Google Scholar] [CrossRef]
- Strange, K.S.; Kerr, L.R.; Andrews, H.N.; Emerman, J.T.; Weinberg, J. Psychosocial stressors and mammary tumor growth: An animal model. Neurotoxicol. Teratol. 2000, 22, 89–102. [Google Scholar] [CrossRef]
- Antonova, L.; Mueller, C.R. Hydrocortisone down-regulates the tumor suppressor gene BRCA1 in mammary cells: A possible molecular link between stress and breast cancer. Genes Chromosomes Cancer 2008, 47, 341–352. [Google Scholar] [CrossRef]
- Hermes, G.L.; McClintock, M.K. Isolation and the timing of mammary gland development, gonadarche, and ovarian senescence: Implications for mammary tumor burden. Dev. Psychobiol. 2008, 50, 353–360. [Google Scholar] [CrossRef]
- Amirian, E.; Liu, Y.; Scheurer, M.E.; El-Zein, R.; Gilbert, M.R.; Bondy, M.L. Genetic variants in inflammation pathway genes and asthma in glioma susceptibility. Neuro-Oncology 2010, 12, 444–452. [Google Scholar] [CrossRef] [PubMed]
- Nyante, S.J.; Gammon, M.D.; Kaufman, J.S.; Bensen, J.T.; Lin, D.Y.; Barnholtz-Sloan, J.S.; Hu, Y.; He, Q.; Luo, J.; Millikan, R.C. Common genetic variation in adiponectin, leptin, and leptin receptor and association with breast cancer subtypes. Breast Cancer Res. Treat. 2011, 129, 593–606. [Google Scholar] [CrossRef] [PubMed]
- Stark, J.L.; Avitsur, R.; Hunzeker, J.; Padgett, D.A.; Sheridan, J.F. Interleukin-6 and the development of social disruption-induced glucocorticoid resistance. J. Neuroimmunol. 2002, 124, 9–15. [Google Scholar] [CrossRef]
- Vilasco, M.; Communal, L.; Mourra, N.; Courtin, A.; Forgez, P.; Gompel, A. Glucocorticoid receptor and breast cancer. Breast Cancer Res. Treat. 2011, 130, 1–10. [Google Scholar] [CrossRef]
- Reichardt, H.M.; Horsch, K.; Grone, H.J.; Kolbus, A.; Beug, H.; Hynes, N.; Schutz, G. Mammary gland development and lactation are controlled by different glucocorticoid receptor activities. Eur. J. Endocrinol. 2001, 145, 519–527. [Google Scholar] [CrossRef] [PubMed]
- Vaidya, J.S.; Baldassarre, G.; Thorat, M.A.; Massarut, S. Role of glucocorticoids in breast cancer. Curr. Pharm. Des. 2010, 16, 3593–3600. [Google Scholar] [CrossRef]
- Curran, J.E.; Lea, R.A.; Rutherford, S.; Weinstein, S.R.; Griffiths, L.R. Association of estrogen receptor and glucocorticoid receptor gene polymorphisms with sporadic breast cancer. Int. J. Cancer 2001, 95, 271–275. [Google Scholar] [CrossRef]
- Rosmond, R. The glucocorticoid receptor gene and its association to metabolic syndrome. Obes. Res. 2002, 10, 1078–1086. [Google Scholar] [CrossRef]
- Walker, B.R. Glucocorticoids and cardiovascular disease. Eur. J. Endocrinol. 2007, 157, 545–559. [Google Scholar] [CrossRef]
- Donn, R.; Payne, D.; Ray, D. Glucocorticoid receptor gene polymorphisms and susceptibility to rheumatoid arthritis. Clin. Endocrinol. 2007, 67, 342–345. [Google Scholar] [CrossRef]
- Spijker, A.T.; van Rossum, E.F. Glucocorticoid receptor polymorphisms in major depression. Focus on glucocorticoid sensitivity and neurocognitive functioning. Ann N. Y. Acad. Sci. 2009, 1179, 199–215. [Google Scholar] [CrossRef] [PubMed]
- Lien, H.C.; Lu, Y.S.; Cheng, A.L.; Chang, W.C.; Jeng, Y.M.; Kuo, Y.H.; Huang, C.S.; Chang, K.J.; Yao, Y.T. Differential expression of glucocorticoid receptor in human breast tissues and related neoplasms. J. Pathol. 2006, 209, 317–327. [Google Scholar] [CrossRef] [PubMed]
- Belova, L.; Delgado, B.; Kocherginsky, M.; Melhem, A.; Olopade, O.I.; Conzen, S.D. Glucocorticoid receptor expression in breast cancer associates with older patient age. Breast Cancer Res. Treat. 2009, 116, 441–447. [Google Scholar] [CrossRef] [PubMed]
- Buxant, F.; Engohan-Aloghe, C.; Noel, J.C. Estrogen receptor, progesterone receptor, and glucocorticoid receptor expression in normal breast tissue, breast in situ carcinoma, and invasive breast cancer. Appl. Immunohistochem. Mol. Morphol. 2010, 18, 254–257. [Google Scholar] [CrossRef] [PubMed]
- Conde, I.; Paniagua, R.; Fraile, B.; Lucio, J.; Arenas, M.I. Glucocorticoid receptor changes its cellular location with breast cancer development. Histol. Histopathol. 2008, 23, 77–85. [Google Scholar]
- Rauscher, G.H.; Ferrans, C.E.; Kaiser, K.; Campbell, R.T.; Calhoun, E.E.; Warnecke, R.B. Misconceptions about breast lumps and delayed medical presentation in urban breast cancer patients. Cancer Epidemiol. Biomark. Prev. 2010, 19, 640–647. [Google Scholar] [CrossRef] [PubMed]
- Al-Alem, U.; Rauscher, G.; Shah, E.; Batai, K.; Mahmoud, A.; Beisner, E.; Silva, A.; Peterson, C.; Kittles, R. Association of genetic ancestry with breast cancer in ethnically diverse women from Chicago. PLoS ONE 2014, 9, e112916. [Google Scholar] [CrossRef] [PubMed]
- Mahmoud, A.M.; Macias, V.; Al-Alem, U.; Deaton, R.J.; Kadjaksy-Balla, A.; Gann, P.H.; Rauscher, G.H. BRCA1 protein expression and subcellular localization in primary breast cancer: Automated digital microscopy analysis of tissue microarrays. PLoS ONE 2017, 12, e0184385. [Google Scholar] [CrossRef] [PubMed]
- NCBI. National Center for Biotechnology Information. Available online: http://www.ncbi.nlm.nih.gov/snp (accessed on 4 April 2015).
- van Rossum, E.F.; Binder, E.B.; Majer, M.; Koper, J.W.; Ising, M.; Modell, S.; Salyakina, D.; Lamberts, S.W.; Holsboer, F. Polymorphisms of the glucocorticoid receptor gene and major depression. Biol. Psychiatry 2006, 59, 681–688. [Google Scholar] [CrossRef]
- Vermeer, H.; Hendriks-Stegeman, B.I.; van der Burg, B.; van Buul-Offers, S.C.; Jansen, M. Glucocorticoid-induced increase in lymphocytic FKBP51 messenger ribonucleic acid expression: A potential marker for glucocorticoid sensitivity, potency, and bioavailability. J. Clin. Endocrinol. Metab. 2003, 88, 277–284. [Google Scholar] [CrossRef]
- Binder, E.B.; Salyakina, D.; Lichtner, P.; Wochnik, G.M.; Ising, M.; Putz, B.; Papiol, S.; Seaman, S.; Lucae, S.; Kohli, M.A.; et al. Polymorphisms in FKBP5 are associated with increased recurrence of depressive episodes and rapid response to antidepressant treatment. Nat. Genet. 2004, 36, 1319–1325. [Google Scholar] [CrossRef]
- Romano, S.; D′Angelillo, A.; Staibano, S.; Ilardi, G.; Romano, M.F. FK506-binding protein 51 is a possible novel tumoral marker. Cell Death Dis. 2010, 1, e55. [Google Scholar] [CrossRef]
- Kaklamani, V.G.; Sadim, M.; Hsi, A.; Offit, K.; Oddoux, C.; Ostrer, H.; Ahsan, H.; Pasche, B.; Mantzoros, C. Variants of the adiponectin and adiponectin receptor 1 genes and breast cancer risk. Cancer Res. 2008, 68, 3178–3184. [Google Scholar] [CrossRef]
- Siitonen, N.; Pulkkinen, L.; Lindstrom, J.; Kolehmainen, M.; Eriksson, J.G.; Venojarvi, M.; Ilanne-Parikka, P.; Keinanen-Kiukaanniemi, S.; Tuomilehto, J.; Uusitupa, M. Association of ADIPOQ gene variants with body weight, type 2 diabetes and serum adiponectin concentrations: The Finnish Diabetes Prevention Study. BMC Med. Genet. 2011, 12, 1–13. [Google Scholar] [CrossRef]
- Bachelot, T.; Ray-Coquard, I.; Menetrier-Caux, C.; Rastkha, M.; Duc, A.; Blay, J.Y. Prognostic value of serum levels of interleukin 6 and of serum and plasma levels of vascular endothelial growth factor in hormone-refractory metastatic breast cancer patients. Br. J. Cancer 2003, 88, 1721–1726. [Google Scholar] [CrossRef]
- DeMichele, A.; Gray, R.; Horn, M.; Chen, J.; Aplenc, R.; Vaughan, W.P.; Tallman, M.S. Host genetic variants in the interleukin-6 promoter predict poor outcome in patients with estrogen receptor-positive, node-positive breast cancer. Cancer Res. 2009, 69, 4184–4191. [Google Scholar] [CrossRef]
- Dawson, S.J.; Makretsov, N.; Blows, F.M.; Driver, K.E.; Provenzano, E.; Le Quesne, J.; Baglietto, L.; Severi, G.; Giles, G.G.; McLean, C.A.; et al. BCL2 in breast cancer: A favourable prognostic marker across molecular subtypes and independent of adjuvant therapy received. Br. J. Cancer 2010, 103, 668–675. [Google Scholar] [CrossRef] [PubMed]
- Bachmann, H.S.; Otterbach, F.; Callies, R.; Nuckel, H.; Bau, M.; Schmid, K.W.; Siffert, W.; Kimmig, R. The AA genotype of the regulatory BCL2 promoter polymorphism (−938C > A) is associated with a favorable outcome in lymph node negative invasive breast cancer patients. Clin. Cancer Res. 2007, 13, 5790–5797. [Google Scholar] [CrossRef] [PubMed]
- Khamis, Z.I.; Sahab, Z.J.; Sang, Q.X. Active roles of tumor stroma in breast cancer metastasis. Int J. Breast Cancer 2012, 2012, 574025. [Google Scholar] [CrossRef] [PubMed]
- Pan, D.; Kocherginsky, M.; Conzen, S.D. Activation of the glucocorticoid receptor is associated with poor prognosis in estrogen receptor-negative breast cancer. Cancer Res. 2011, 71, 6360–6370. [Google Scholar] [CrossRef]
- Yemelyanov, A.; Czwornog, J.; Chebotaev, D.; Karseladze, A.; Kulevitch, E.; Yang, X.; Budunova, I. Tumor suppressor activity of glucocorticoid receptor in the prostate. Oncogene 2007, 26, 1885–1896. [Google Scholar] [CrossRef]
- Chebotaev, D.; Yemelyanov, A.; Zhu, L.; Lavker, R.M.; Budunova, I. The tumor suppressor effect of the glucocorticoid receptor in skin is mediated via its effect on follicular epithelial stem cells. Oncogene 2007, 26, 3060–3068. [Google Scholar] [CrossRef][Green Version]
- Zhang, X.; Yin, M.; Zhang, L.-j. Keratin 6, 16 and 17—Critical Barrier Alarmin Molecules in Skin Wounds and Psoriasis. Cells 2019, 8, 807. [Google Scholar] [CrossRef]
- Chu, P.G.; Weiss, L.M. Expression of Cytokeratin 5/6 in Epithelial Neoplasms: An Immunohistochemical Study of 509 Cases. Mod. Pathol. 2002, 15, 6–10. [Google Scholar] [CrossRef]
- Gusterson, B.A.; Ross, D.T.; Heath, V.J.; Stein, T. Basal cytokeratins and their relationship to the cellular origin and functional classification of breast cancer. Breast Cancer Res. 2005, 7, 143–148. [Google Scholar] [CrossRef]
- Abd El-Rehim, D.M.; Pinder, S.E.; Paish, C.E.; Bell, J.; Blamey, R.W.; Robertson, J.F.; Nicholson, R.I.; Ellis, I.O. Expression of luminal and basal cytokeratins in human breast carcinoma. J. Pathol. 2004, 203, 661–671. [Google Scholar] [CrossRef] [PubMed]
- Martin-Castillo, B.; Lopez-Bonet, E.; Buxó, M.; Dorca, J.; Tuca-Rodríguez, F.; Ruano, M.A.; Colomer, R.; Menendez, J.A. Cytokeratin 5/6 fingerprinting in HER2-positive tumors identifies a poor prognosis and trastuzumab-resistant basal-HER2 subtype of breast cancer. Oncotarget 2015, 6, 7104–7122. [Google Scholar] [CrossRef] [PubMed]
- Bayo, P.; Sanchis, A.; Bravo, A.; Cascallana, J.L.; Buder, K.; Tuckermann, J.; Schutz, G.; Perez, P. Glucocorticoid receptor is required for skin barrier competence. Endocrinology 2008, 149, 1377–1388. [Google Scholar] [CrossRef] [PubMed]
Publisher’s Note: MDPI stays neutral with regard to jurisdictional claims in published maps and institutional affiliations. |
© 2021 by the authors. Licensee MDPI, Basel, Switzerland. This article is an open access article distributed under the terms and conditions of the Creative Commons Attribution (CC BY) license (https://creativecommons.org/licenses/by/4.0/).