Synergistic Analysis of Protein Corona and Haemoglobin Levels Detects Pancreatic Cancer

 ,
,  ,
,  and
and 
Abstract
Simple Summary
Abstract
1. Introduction
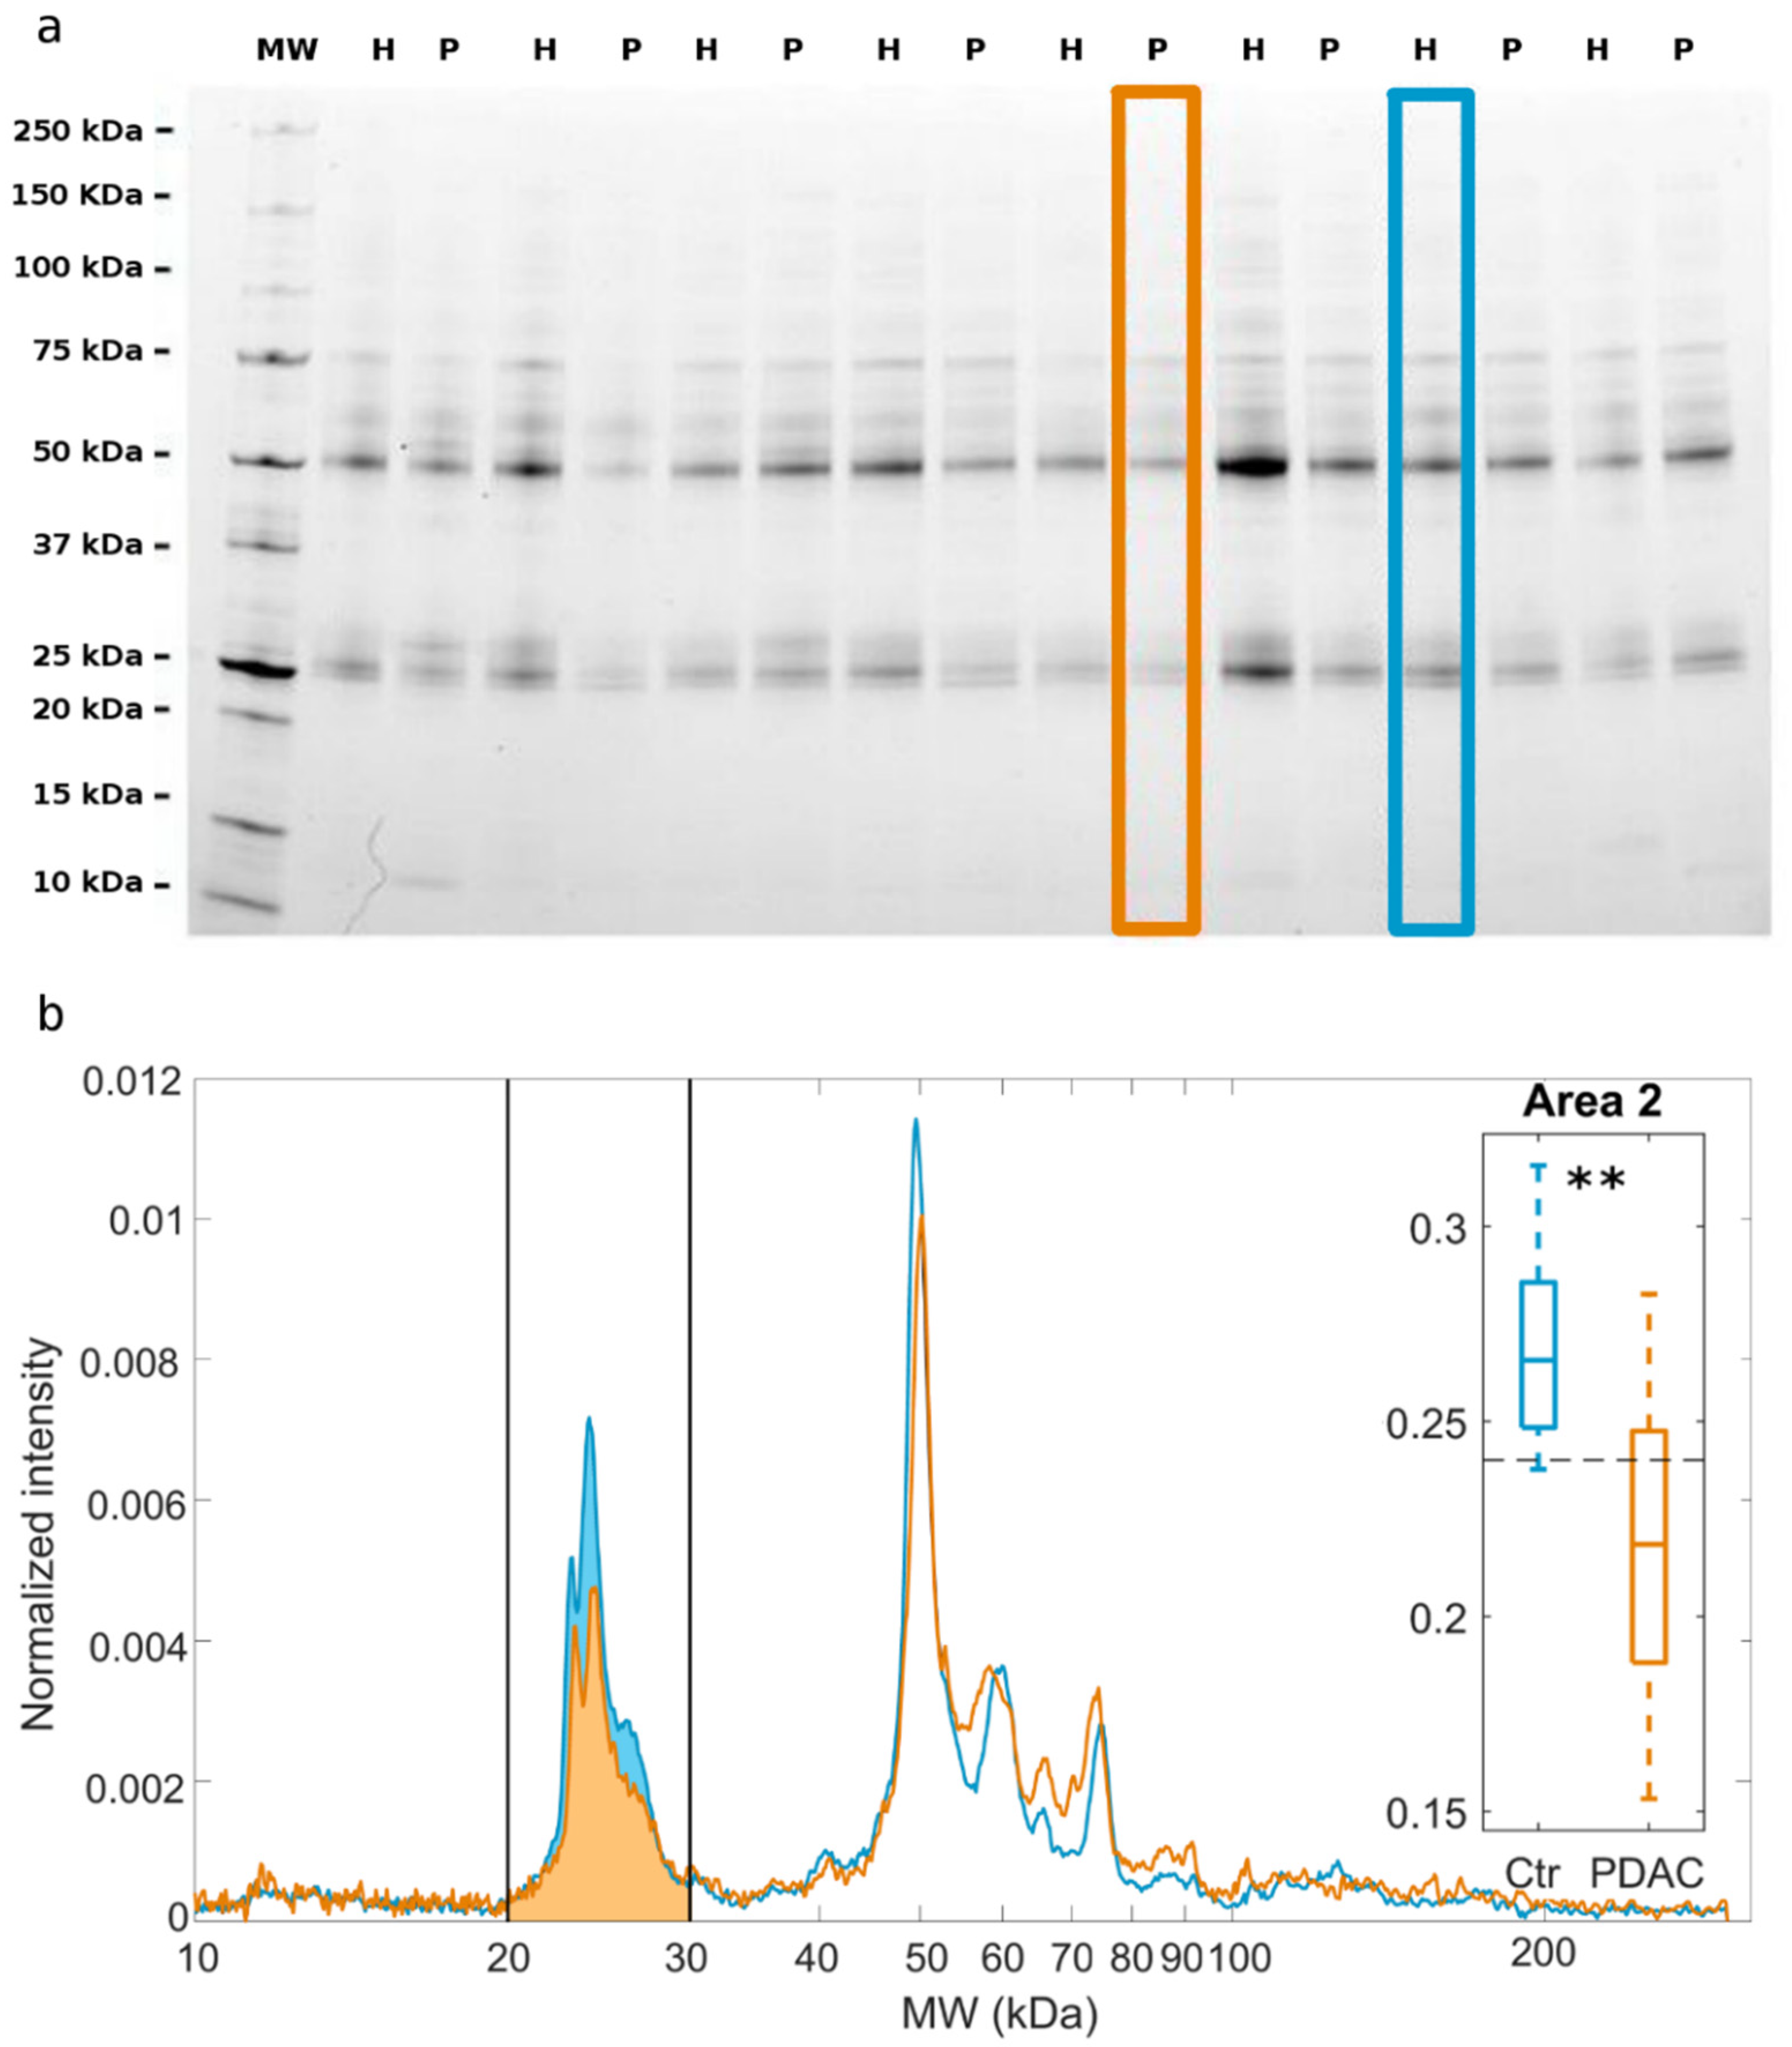
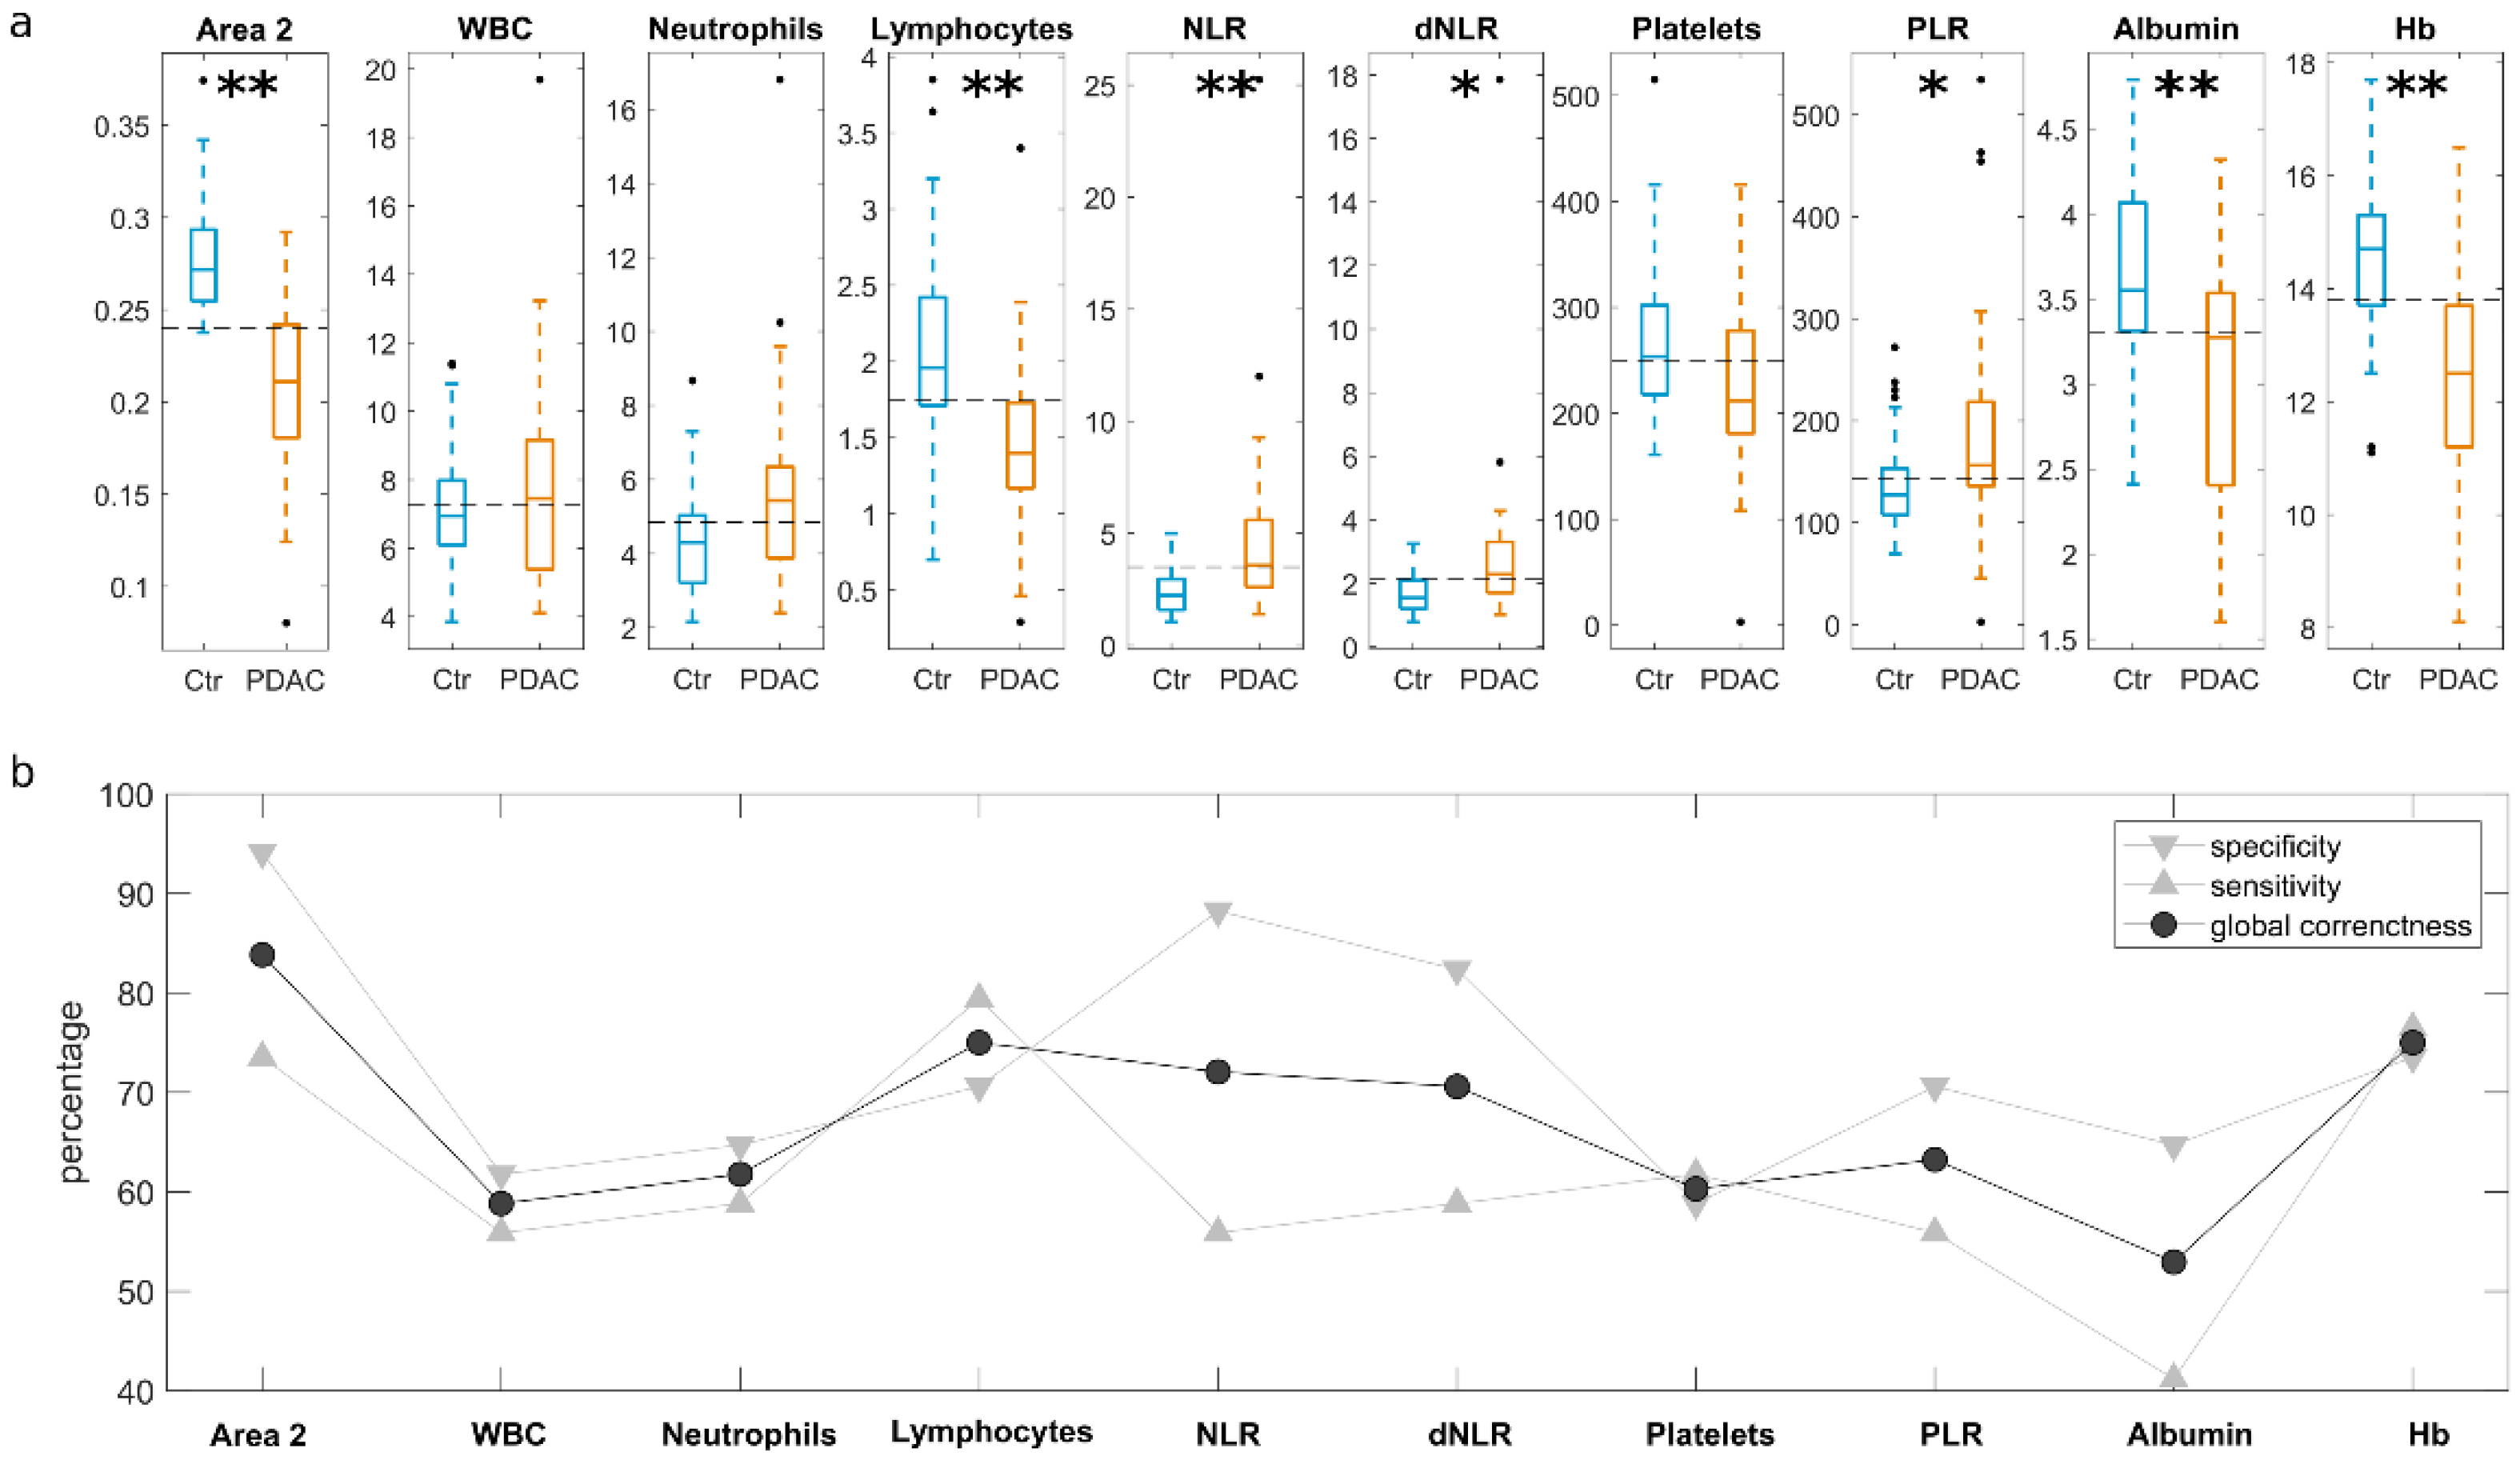
2. Results
3. Discussion
4. Materials and Methods
4.1. Patients’ Enrolment and Blood Sample Collection
4.2. Preparation of Nanosized GO Sheets
4.3. Size and Zeta-Potential Experiments
4.4. SDS-PAGE Experiments
4.5. ROC Analysis
5. Conclusions
Supplementary Materials
Author Contributions
Funding
Institutional Review Board Statement
Informed Consent Statement
Data Availability Statement
Conflicts of Interest
References
- Dagenais, G.R.; Leong, D.P.; Rangarajan, S.; Lanas, F.; Lopez-Jaramillo, P.; Gupta, R.; Diaz, R.; Avezum, A.; Oliveira, G.B.F.; Wielgosz, A.; et al. Variations in common diseases, hospital admissions, and deaths in middle-aged adults in 21 countries from five continents (PURE): A prospective cohort study. Lancet 2020, 395, 785–794. [Google Scholar] [CrossRef]
- Hall, B.R.; Cannon, A.; Atri, P.; Wichman, C.S.; Smith, L.M.; Kumar, S.; Batra, S.K.; Wang, H.; Ganti, A.K.; Sasson, A.R.; et al. A comparative analysis of survival and funding discrepancies in cancers with high mortality. Ann. Surg. 2020, 271, 296–302. [Google Scholar] [CrossRef] [PubMed]
- Zhang, Q.; Zeng, L.; Chen, Y.; Lian, G.; Qian, C.; Chen, S.; Li, J.; Huang, K. Pancreatic Cancer Epidemiology, Detection, and Management. Gastroenterol. Res. Pract. 2016, 2016, 1–10. [Google Scholar] [CrossRef] [PubMed]
- Kanno, A.; Masamune, A.; Hanada, K.; Kikuyama, M.; Kitano, M. Advances in Early Detection of Pancreatic Cancer. Diagnostics 2019, 9, 18. [Google Scholar] [CrossRef] [PubMed]
- Holly, E.A.; Chaliha, I.; Bracci, P.M.; Gautam, M. Signs and symptoms of pancreatic cancer: A population-based case-control study in the San Francisco Bay area. Clin. Gastroenterol. Hepatol. 2004, 2, 510–517. [Google Scholar] [CrossRef]
- Perry, R.J.; Shulman, G.I. Mechanistic Links between Obesity, Insulin, and Cancer. Trends Cancer 2020, 6, 75–78. [Google Scholar] [CrossRef]
- Lynch, H.T.; Deters, C.A.; Snyder, C.L.; Lynch, J.F.; Villeneuve, P.; Silberstein, J.; Martin, H.; Narod, S.A.; Brand, R.E. BRCA1 and pancreatic cancer: Pedigree findings and their causal relationships. Cancer Genet. Cytogenet. 2005, 158, 119–125. [Google Scholar] [CrossRef]
- Al-Sukhni, W.; Rothenmund, H.; Borgida, A.E.; Zogopoulos, G.; O’Shea, A.-M.; Pollett, A.; Gallinger, S. Germline BRCA1 mutations predispose to pancreatic adenocarcinoma. Qual. Life Res. 2008, 124, 271–278. [Google Scholar] [CrossRef]
- Kastrinos, F. Risk of Pancreatic Cancer in Families with Lynch Syndrome. JAMA 2009, 302, 1790–1795. [Google Scholar] [CrossRef]
- Moravec, R.; Divi, R.; Verma, M. Detecting circulating tumor material and digital pathology imaging during pancreatic cancer progression. World J. Gastrointest. Oncol. 2017, 9, 235–250. [Google Scholar] [CrossRef]
- Yachida, S.; Jones, S.; Bozic, I.; Antal, T.; Leary, R.J.; Fu, B.; Kamiyama, M.; Hruban, R.H.; Eshleman, J.R.; Nowak, M.A.; et al. Distant metastasis occurs late during the genetic evolution of pancreatic cancer. Nature 2010, 467, 1114–1117. [Google Scholar] [CrossRef] [PubMed]
- Wei, L.; Yao, K.; Gan, S.; Suo, Z. Clinical utilization of serum-or plasma-based miRNAs as early detection biomarkers for pancreatic cancer: A me-ta-analysis up to now. Medicine 2018, 97, e12132. [Google Scholar] [CrossRef] [PubMed]
- Shu, X.; Zheng, W.; Yu, D.; Li, D.-L.; Lan, Q.; Yang, G.; Cai, H.; Ma, X.; Rothman, N.; Gao, Y.-T.; et al. Prospective metabolomics study identifies potential novel blood metabolites associated with pancreatic cancer risk. Int. J. Cancer 2018, 143, 216–2167. [Google Scholar] [CrossRef] [PubMed]
- Herreros-Villanueva, M.; Bujanda, L. Non-invasive biomarkers in pancreatic cancer diagnosis: What we need versus what we have. Ann. Transl. Med. 2016, 4, 134. [Google Scholar] [CrossRef] [PubMed]
- Markar, S.R.; Brodie, B.; Chin, S.-T.; Romano, A.; Spalding, D.; Hanna, G.B. Profile of exhaled-breath volatile organic compounds to diagnose pancreatic cancer. BJS 2018, 105, 1493–1500. [Google Scholar] [CrossRef] [PubMed]
- Poruk, K.E.; Brown, D.Z.G.K.; Mulvihill, J.D.; Scaife, C.L.; Firpo, M.A.; Mulvihill, S.J. The clinical utility of CA 19-9 in pancreatic adenocarcinoma: Diagnostic and prognostic updates. Curr. Mol. Med. 2013, 13, 340–351. [Google Scholar]
- Azadeh, A.; Ruhlmann, F.; Krause, T.; Bernhardt, M.; Jo, P.; Konig, A.; Kleiss, M.; Leha, A.; Ghadimi, M.; Gaedcke, J. CA19-9 for detecting recurrence of pancreatic cancer. Sci. Rep. 2020, 10, 1332. [Google Scholar]
- Song, J.; Sokoll, L.J.; Pasay, J.J.; Rubin, A.L.; Li, H.; Bach, D.M.; Chan, D.W.; Zhang, Z. Identification of Serum Biomarker Panels for the Early Detection of Pancreatic Cancer. Cancer Epidemiol. Biomark. Prev. 2018, 28, 174–182. [Google Scholar] [CrossRef]
- Dincer, C.; Bruch, R.; Kling, A.; Dittrich, P.S.; Urban, G.A. Multiplexed point-of-care testing–xPOCT. Trends Biotechnol. 2017, 35, 728–742. [Google Scholar] [CrossRef]
- Piraino, F.; Volpetti, F.; Watson, C.; Maerkl, S.J. A Digital–Analog Microfluidic Platform for Patient-Centric Multiplexed Biomarker Diagnostics of Ultralow Volume Samples. ACS Nano 2016, 10, 1699–1710. [Google Scholar] [CrossRef]
- Xu, S.-S.; Li, S.; Xu, H.-X.; Li, H.; Wu, C.-T.; Wang, W.-Q.; Gao, H.-L.; Jiang, W.; Zhang, W.-H.; Li, T.-J.; et al. Haemoglobin, albumin, lymphocyte and platelet predicts postoperative survival in pancreatic cancer. World J. Gastroenterol. 2020, 26, 828–838. [Google Scholar] [CrossRef] [PubMed]
- Dolan, R.D.; Lim, J.; McSorley, S.T.; Horgan, P.G.; McMillan, D.C. The role of the systemic inflammatory response in predicting outcomes in patients with operable cancer: Sys-tematic review and meta-analysis. Sci. Rep. 2017, 7, 1–31. [Google Scholar] [CrossRef] [PubMed]
- Wilson, M.S.; Nie, W. Multiplex Measurement of Seven Tumor Markers Using an Electrochemical Protein Chip. Anal. Chem. 2006, 78, 6476–6483. [Google Scholar] [CrossRef] [PubMed]
- Kobayashi, H.; Longmire, M.R.; Ogawa, M.; Choyke, P.L.; Kawamoto, S. Multiplexed imaging in cancer diagnosis: Applications and future advances. Lancet Oncol. 2010, 11, 589–595. [Google Scholar] [CrossRef]
- Hajipour, M.J.; Laurent, S.; Aghaie, A.; Razaee, F.; Mahmoudi, M. Personalized protein coronas: A “key” factor at the nanobiointerface. Biomater. Sci. 2014, 2, 1210–1221. [Google Scholar] [CrossRef]
- Hajipour, M.J.; Raheb, J.; Akhavan, O.; Arjmand, S.; Mashinchian, O.; Rahman, M.; Abdolahad, M.; Serpooshan, V.; Laurent, S.; Mahmoudi, M. Personalized disease-specific protein corona influences the therapeutic impact of graphene oxide. Nanoscale 2015, 7, 8978–8994. [Google Scholar] [CrossRef]
- Papi, M.; Caracciolo, G. Principal component analysis of personalized biomolecular corona data for early disease detection. Nano Today 2018, 21, 14–17. [Google Scholar] [CrossRef]
- Caracciolo, G.; Safavi-Sohi, R.; Malekadeh, R.; Poustchi, H.; Vasighi, M.; Chiozzi, R.Z.; Capriotti, A.L.; Legana, A.; Hajipour, M.; Di Domenico, M.; et al. Disease-specific protein corona sensor arrays may have disease detection capacity. Nanoscale Horiz. 2019, 4, 1063–1076. [Google Scholar] [CrossRef]
- Di Santo, R.; Digiacomo, L.; Quagliarini, E.; Capriotti, A.L.; Laganà, A.; Chiozzi, R.Z.; Caputo, D.; Cascone, C.; Coppola, R.; Pozzi, D.; et al. Personalized Graphene Oxide-Protein Corona in the Human Plasma of Pancreatic Cancer Patients. Front. Bioeng. Biotechnol. 2020, 8, 491. [Google Scholar] [CrossRef]
- Papi, M.; Palmieri, V.; Palchetti, S.; Pozzi, D.; Digiacomo, L.; Guadagno, E.; Caro, M.D.B.D.; Di Domenico, M.; Ricci, S.; Pani, R.; et al. Exploitation of nanoparticle-protein interactions for early disease detection. Appl. Phys. Lett. 2019, 114, 163702. [Google Scholar] [CrossRef]
- Castagnola, V.; Zhao, W.; Boselli, L.; Giudice, C.L.; Meder, F.; Polo, E.; Paton, K.R.; Backes, C.; Coleman, J.N.; Dawson, K. Biological recognition of graphene nanoflakes. Nat. Commun. 2018, 9, 1–9. [Google Scholar] [CrossRef] [PubMed]
- Alnasser, F.; Castagnola, V.; Boselli, L.; Esquivel-Gaon, M.; Efeoglu, E.; McIntyre, J.; Byrne, H.J.; Dawson, K. Graphene Nanoflake Uptake Mediated by Scavenger Receptors. Nano Lett. 2019, 19, 1260–1268. [Google Scholar] [CrossRef] [PubMed]
- Koomen, J.M.; Shih, L.N.; Coombes, K.R.; Li, D.; Xiao, L.-C.; Fidler, I.J.; Abbruzzese, J.L.; Kobayashi, R. Plasma protein profiling for diagnosis of pancreatic cancer reveals the presence of host response proteins. Clin. Cancer Res. 2005, 11, 1110–1118. [Google Scholar] [PubMed]
- Brand, R.E.; Nolen, B.; Zeh, H.J.; Allen, P.J.; A Eloubeidi, M.; Goldberg, M.; Elton, E.; Arnoletti, J.P.; Christein, J.D.; Vickers, S.M.; et al. Serum Biomarker Panels for the Detection of Pancreatic Cancer. Clin. Cancer Res. 2011, 17, 805–816. [Google Scholar] [CrossRef] [PubMed]
- Lin, C.; Wu, W.; Zhao, G.-C.; Wang, D.-S.; Lou, W.-H.; Jin, D.-Y. ITRAQ-based quantitative proteomics reveals apolipoprotein A-I and transferrin as potential serum markers in CA19-9 negative pancreatic ductal adenocarcinoma. Medicine 2016, 95, e4527. [Google Scholar] [CrossRef] [PubMed]
- Gregory, A.D.; Houghton, A.M. Tumor-Associated Neutrophils: New Targets for Cancer Therapy. Cancer Res. 2011, 71, 2411–2416. [Google Scholar] [CrossRef] [PubMed]
- Smith, H.A.; Kang, Y. The metastasis-promoting roles of tumor-associated immune cells. J. Mol. Med. 2013, 91, 411–429. [Google Scholar] [CrossRef]
- Garcea, G.; Ladwa, N.; Neal, C.P.; Metcalfe, M.S.; Dennison, A.R.; Berry, D.P. Preoperative Neutrophil-to-Lymphocyte Ratio (NLR) is Associated with Reduced Disease-free Survival Following Curative Resection of Pancreatic Adenocarcinoma. World J. Surg. 2011, 35, 868–872. [Google Scholar] [CrossRef]
- Sierko, E.; Wojtukiewicz, M.Z. Platelets and Angiogenesis in Malignancy. Semin. Thromb. Hemost. 2004, 30, 95–108. [Google Scholar] [CrossRef]
- Karachaliou, N.; Pilotto, S.; Bria, E.; Rosell, R. Platelets and their role in cancer evolution and immune system. Transl. Lung Cancer Res. 2015, 4, 713–720. [Google Scholar]
- Fogar, P.; Sperti, C.; Basso, D.; Sanzari, M.C.; Greco, E.; Davoli, C.; Navaglia, F.; Zambon, C.-F.; Pasquali, C.; Venza, E.; et al. Decreased Total Lymphocyte Counts in Pancreatic Cancer: An Index of Adverse Outcome. Pancreas 2006, 32, 22–28. [Google Scholar] [CrossRef] [PubMed]
- Zhou, Y.; Wei, Q.; Fan, J.; Cheng, S.; Ding, W.; Hua, Z. Prognostic role of the neutrophil-to-lymphocyte ratio in pancreatic cancer: A meta-analysis containing 8252 patients. Clin. Chim. Acta 2018, 479, 181–189. [Google Scholar] [CrossRef] [PubMed]
- Proctor, M.J.; Talwar, D.; Balmar, S.; O’Reilly, D.S.; Foulis, A.K.; Horgan, P.G.; Morrison, D.S.; McMillan, D.C. The relationship between the presence and site of cancer, an inflammation-based prognostic score and biochemical parameters. Initial results of the Glasgow Inflammation Outcome Study. Br. J. Cancer 2010, 103, 870–876. [Google Scholar] [CrossRef] [PubMed]
- Caputo, D.; Caracciolo, G. Nanoparticle-enabled blood tests for early detection of pancreatic ductal adenocarcinoma. Cancer Lett. 2020, 470, 191–196. [Google Scholar] [CrossRef]
- Jia, Y.; Ji, K.E.; Ji, J.; Hao, C.; Ye, L.; Sanders, A.J.; Jiang, W.G. IL24 and its Receptors Regulate Growth and Migration of Pancreatic Cancer Cells and Are Potential Biomarkers for IL24 Molecular Therapy. Anticancer. Res. 2016, 36, 1153–1163. [Google Scholar] [PubMed]
- Dougan, M.; Ingram, J.R.; Jeong, H.-J.; Mosaheb, M.M.; Bruck, P.T.; Ali, L.; Pishesha, N.; Blomberg, O.; Tyler, P.M.; Servos, M.M.; et al. Targeting Cytokine Therapy to the Pancreatic Tumor Microenvironment Using PD-L1–Specific VHHs. Cancer Immunol. Res. 2018, 6, 389–401. [Google Scholar] [CrossRef]
- Chun, Y.S.; Pawlik, T.M.; Vauthey, J.N. 8th Edition of the AJCC Cancer Staging Manual: Pancreas and Hepatobiliary Cancers. Ann. Surg. Oncol. 2018, 25, 845–847. [Google Scholar] [CrossRef]
- Caputo, D.; Papi, M.; Coppola, R.; Palchetti, S.; Digiacomo, L.; Caracciolo, G.; Pozzi, D. A protein corona-enabled blood test for early cancer detection. Nanoscale 2017, 9, 349–354. [Google Scholar] [CrossRef]
- Quagliarini, E.; Di Santo, R.; Pozzi, D.; Tentori, P.M.; Cardarelli, F.; Caracciolo, G. Mechanistic Insights into the Release of Doxorubicin from Graphene Oxide in Cancer Cells. Nanomaterials 2020, 10, 1482. [Google Scholar] [CrossRef]
- Digiacomo, L.; Palchetti, S.; Giulimondi, F.; Pozzi, D.; Chiozzi, R.Z.; Capriotti, A.L.; Laganà, A.; Caracciolo, G. The biomolecular corona of gold nanoparticles in a controlled microfluidic environment. Lab Chip 2019, 19, 2557–2567. [Google Scholar] [CrossRef]
- Papi, M.; Palmieri, V.; Digiacomo, L.; Giulimondi, F.; Palchetti, S.; Ciasca, G.; Perini, G.; Caputo, D.; Cartillone, M.C.; Cascone, C.; et al. Converting the personalized biomolecular corona of graphene oxide nanoflakes into a high-throughput diagnostic test for early cancer detection. Nanoscale 2019, 11, 15339–15346. [Google Scholar] [CrossRef] [PubMed]


Publisher’s Note: MDPI stays neutral with regard to jurisdictional claims in published maps and institutional affiliations. |
© 2020 by the authors. Licensee MDPI, Basel, Switzerland. This article is an open access article distributed under the terms and conditions of the Creative Commons Attribution (CC BY) license (http://creativecommons.org/licenses/by/4.0/).
Share and Cite
Caputo, D.; Digiacomo, L.; Cascone, C.; Pozzi, D.; Palchetti, S.; Di Santo, R.; Quagliarini, E.; Coppola, R.; Mahmoudi, M.; Caracciolo, G. Synergistic Analysis of Protein Corona and Haemoglobin Levels Detects Pancreatic Cancer. Cancers 2021, 13, 93. https://doi.org/10.3390/cancers13010093
Caputo D, Digiacomo L, Cascone C, Pozzi D, Palchetti S, Di Santo R, Quagliarini E, Coppola R, Mahmoudi M, Caracciolo G. Synergistic Analysis of Protein Corona and Haemoglobin Levels Detects Pancreatic Cancer. Cancers. 2021; 13(1):93. https://doi.org/10.3390/cancers13010093
Chicago/Turabian StyleCaputo, Damiano, Luca Digiacomo, Chiara Cascone, Daniela Pozzi, Sara Palchetti, Riccardo Di Santo, Erica Quagliarini, Roberto Coppola, Morteza Mahmoudi, and Giulio Caracciolo. 2021. "Synergistic Analysis of Protein Corona and Haemoglobin Levels Detects Pancreatic Cancer" Cancers 13, no. 1: 93. https://doi.org/10.3390/cancers13010093
APA StyleCaputo, D., Digiacomo, L., Cascone, C., Pozzi, D., Palchetti, S., Di Santo, R., Quagliarini, E., Coppola, R., Mahmoudi, M., & Caracciolo, G. (2021). Synergistic Analysis of Protein Corona and Haemoglobin Levels Detects Pancreatic Cancer. Cancers, 13(1), 93. https://doi.org/10.3390/cancers13010093