miRNA Expression Signatures of Therapy Response in Squamous Cell Carcinomas


Abstract
Simple Summary
Abstract
1. Introduction
2. Results
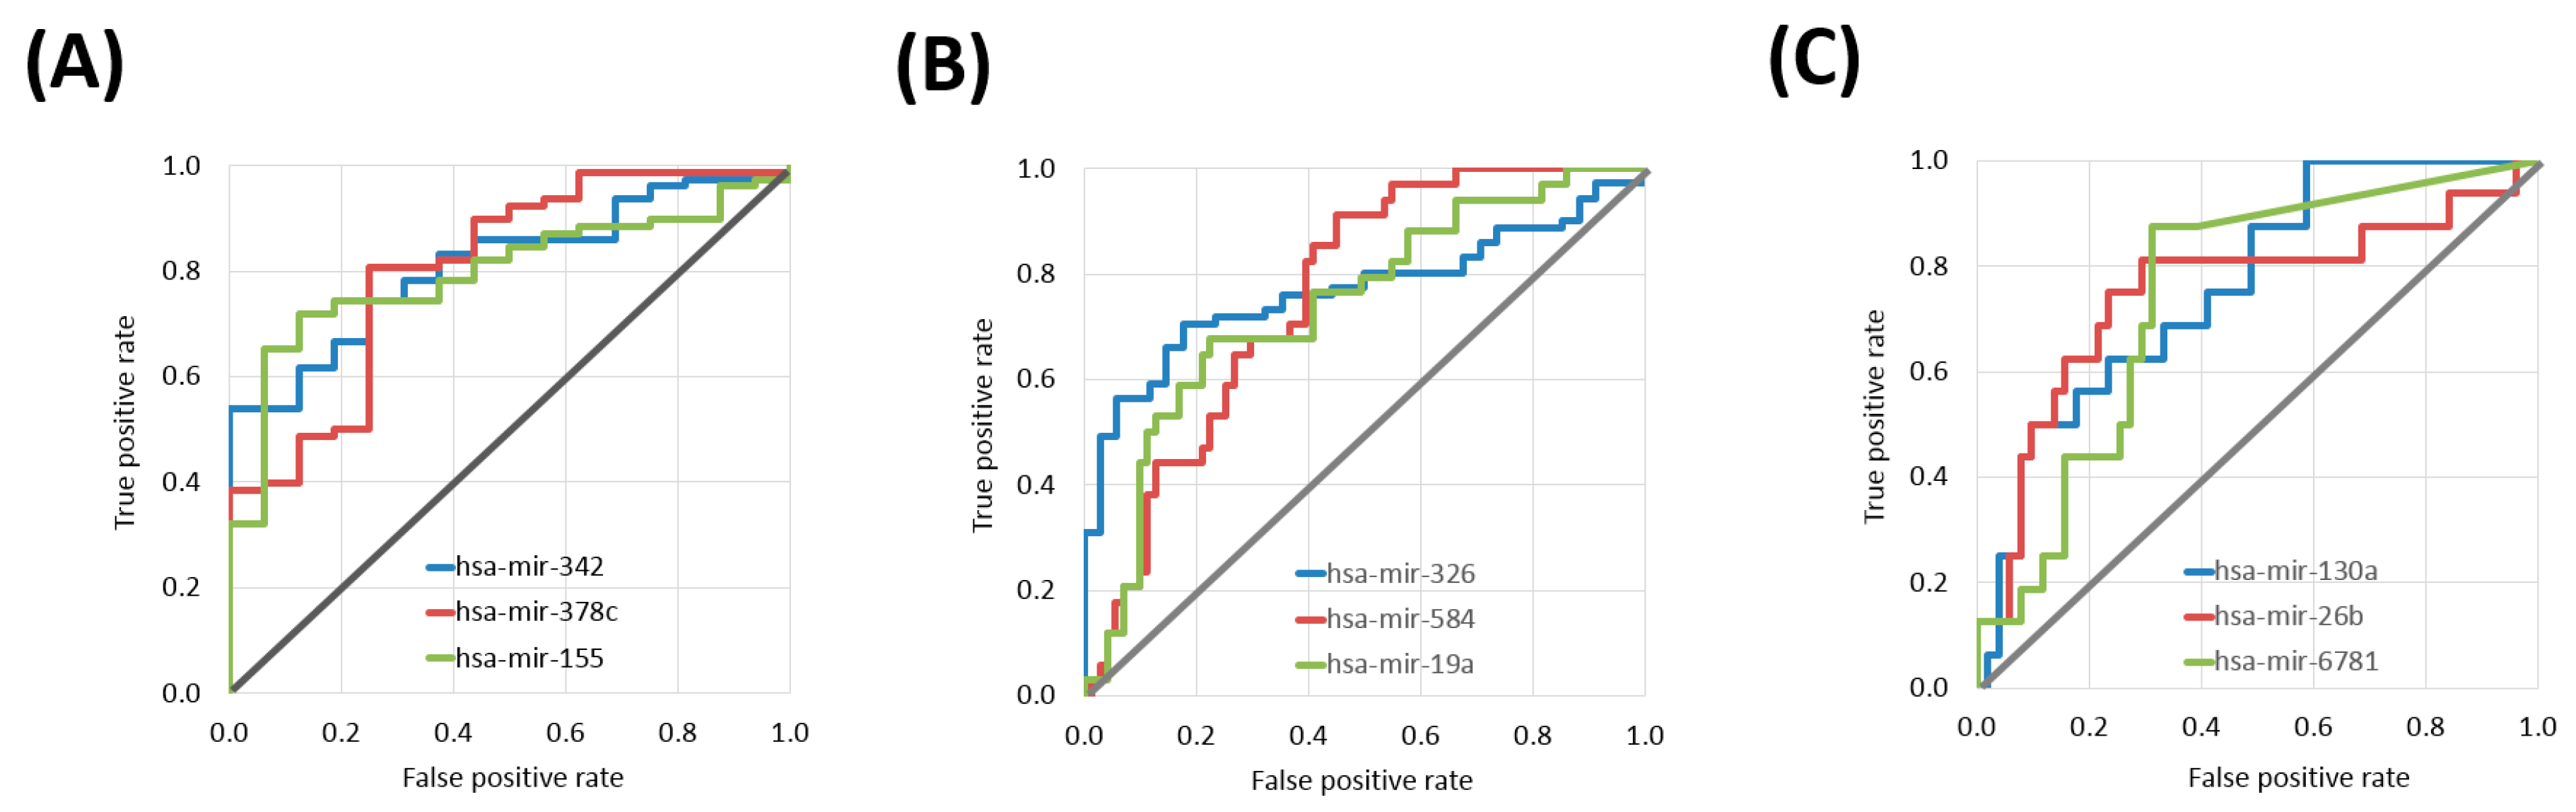
2.1. miRNAs Associated with Treatment Outcome in Each SCC Cohort
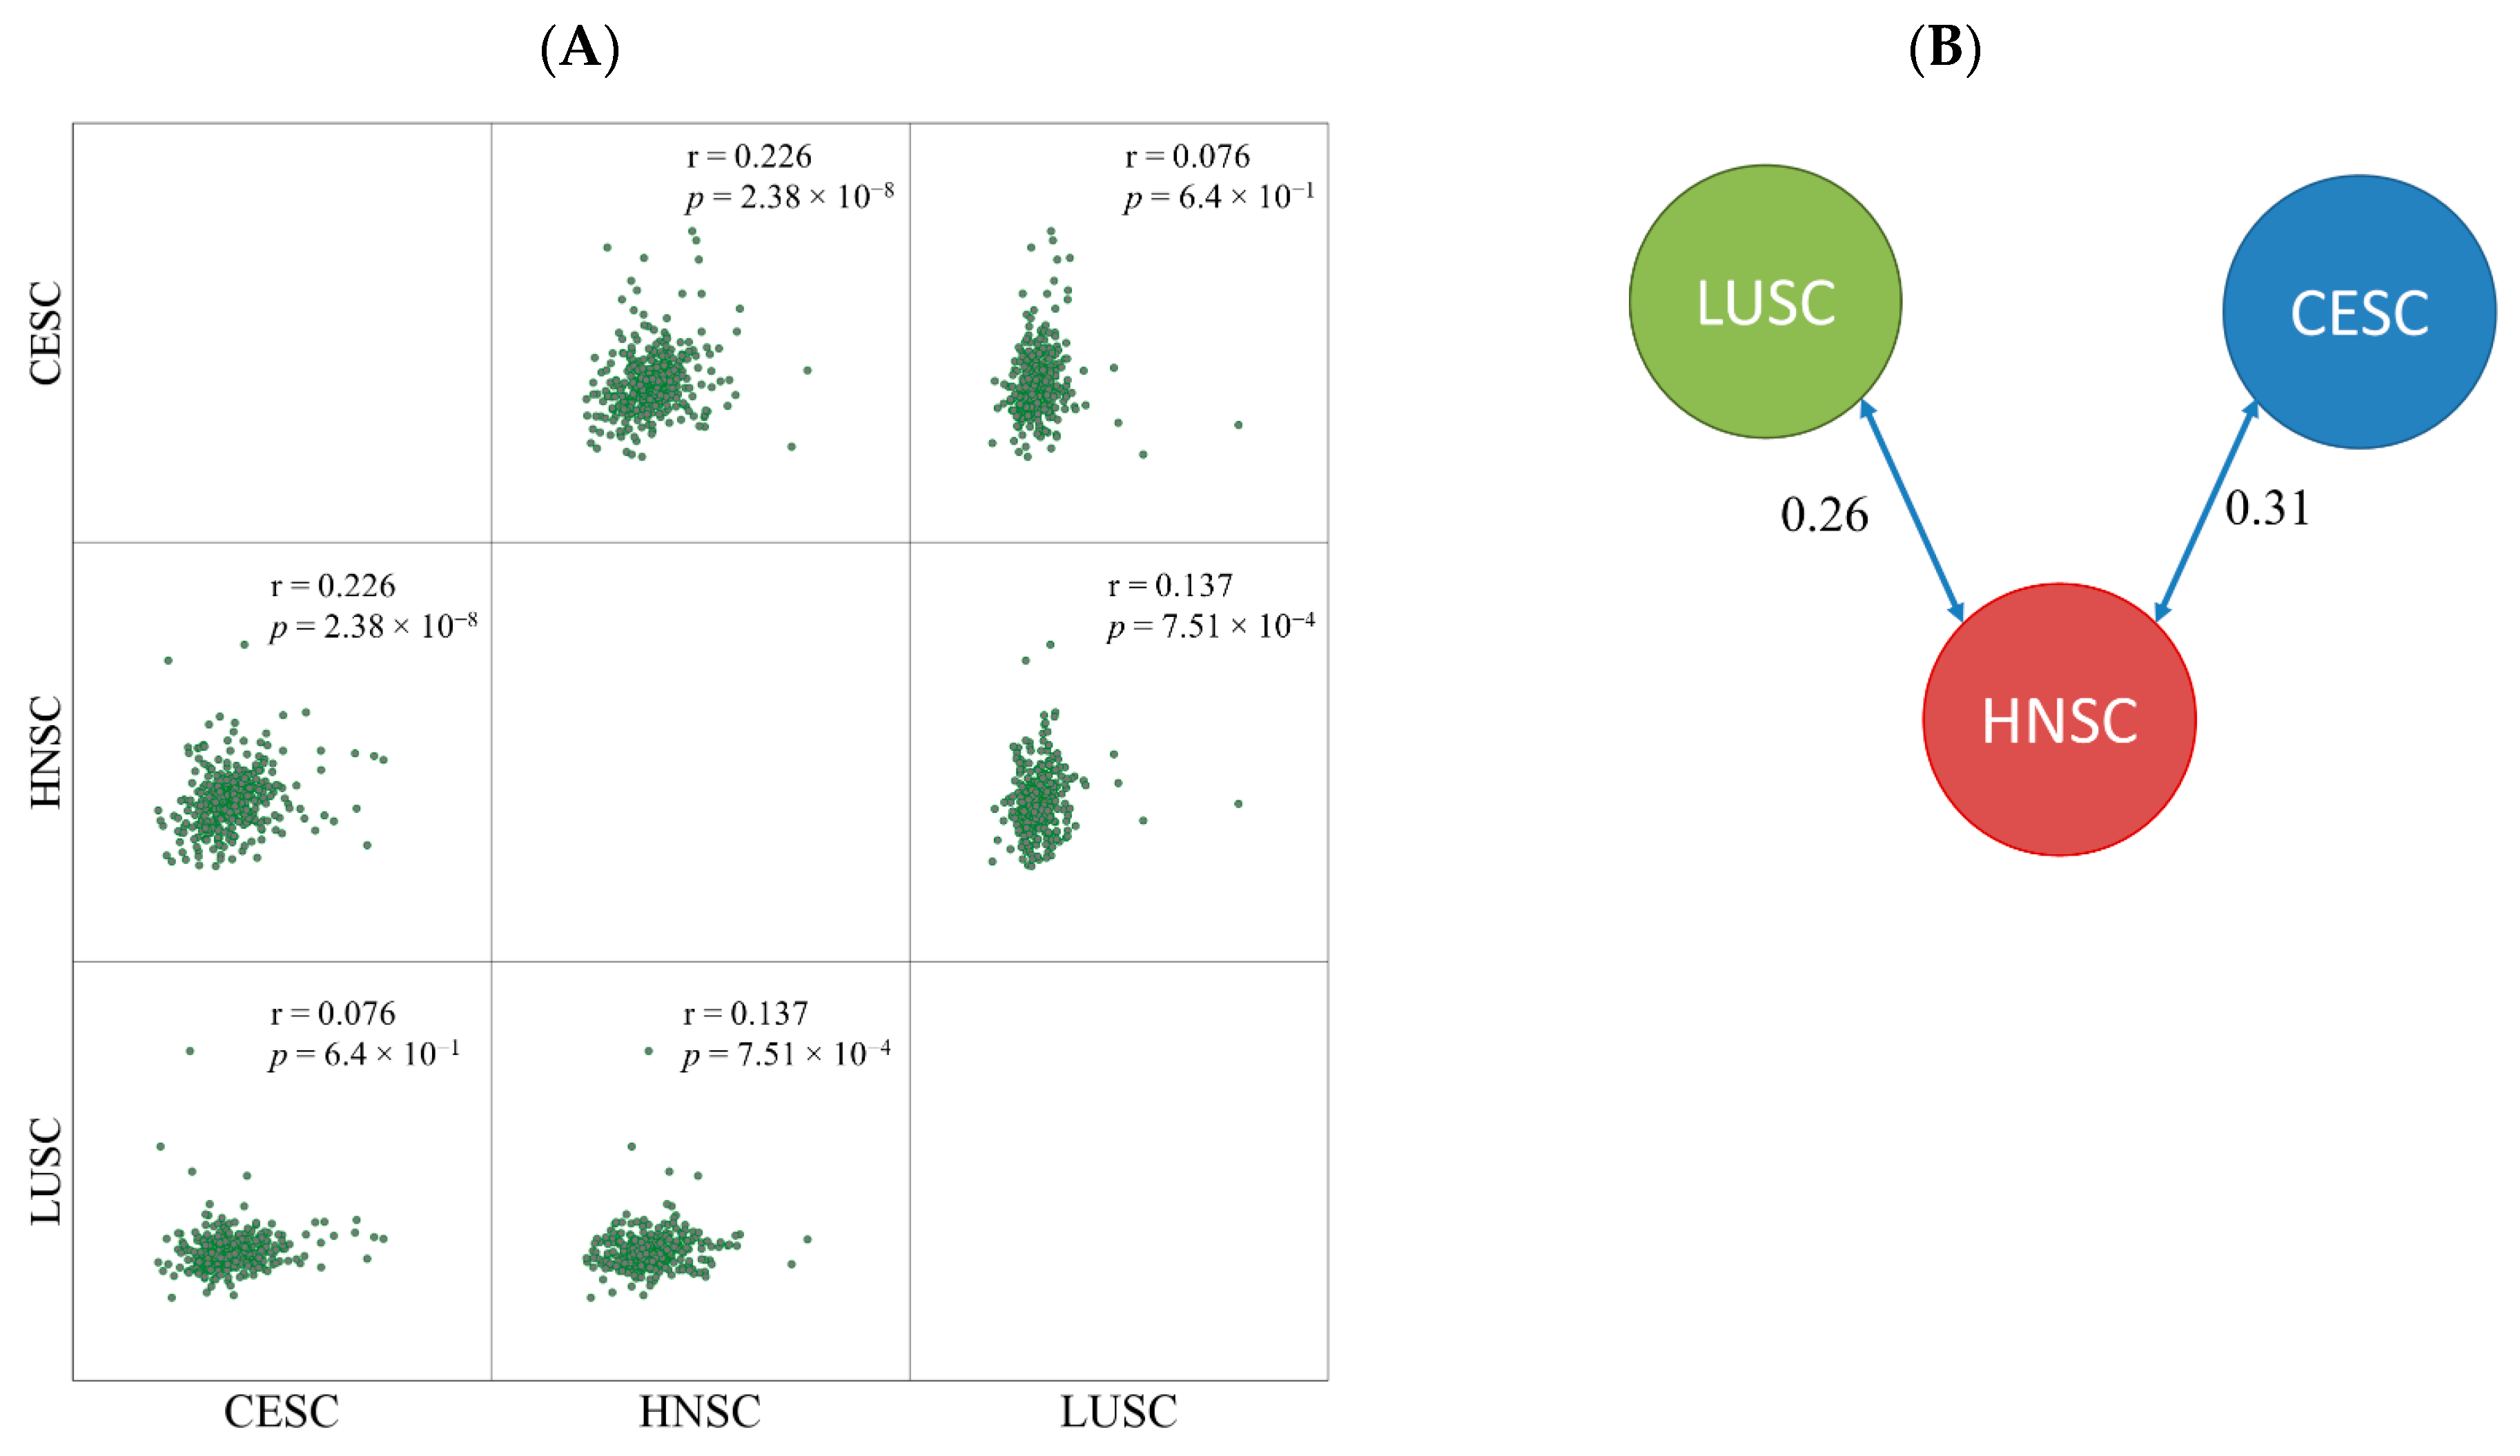
2.2. miRNA Expression Comparison between Tumor Types
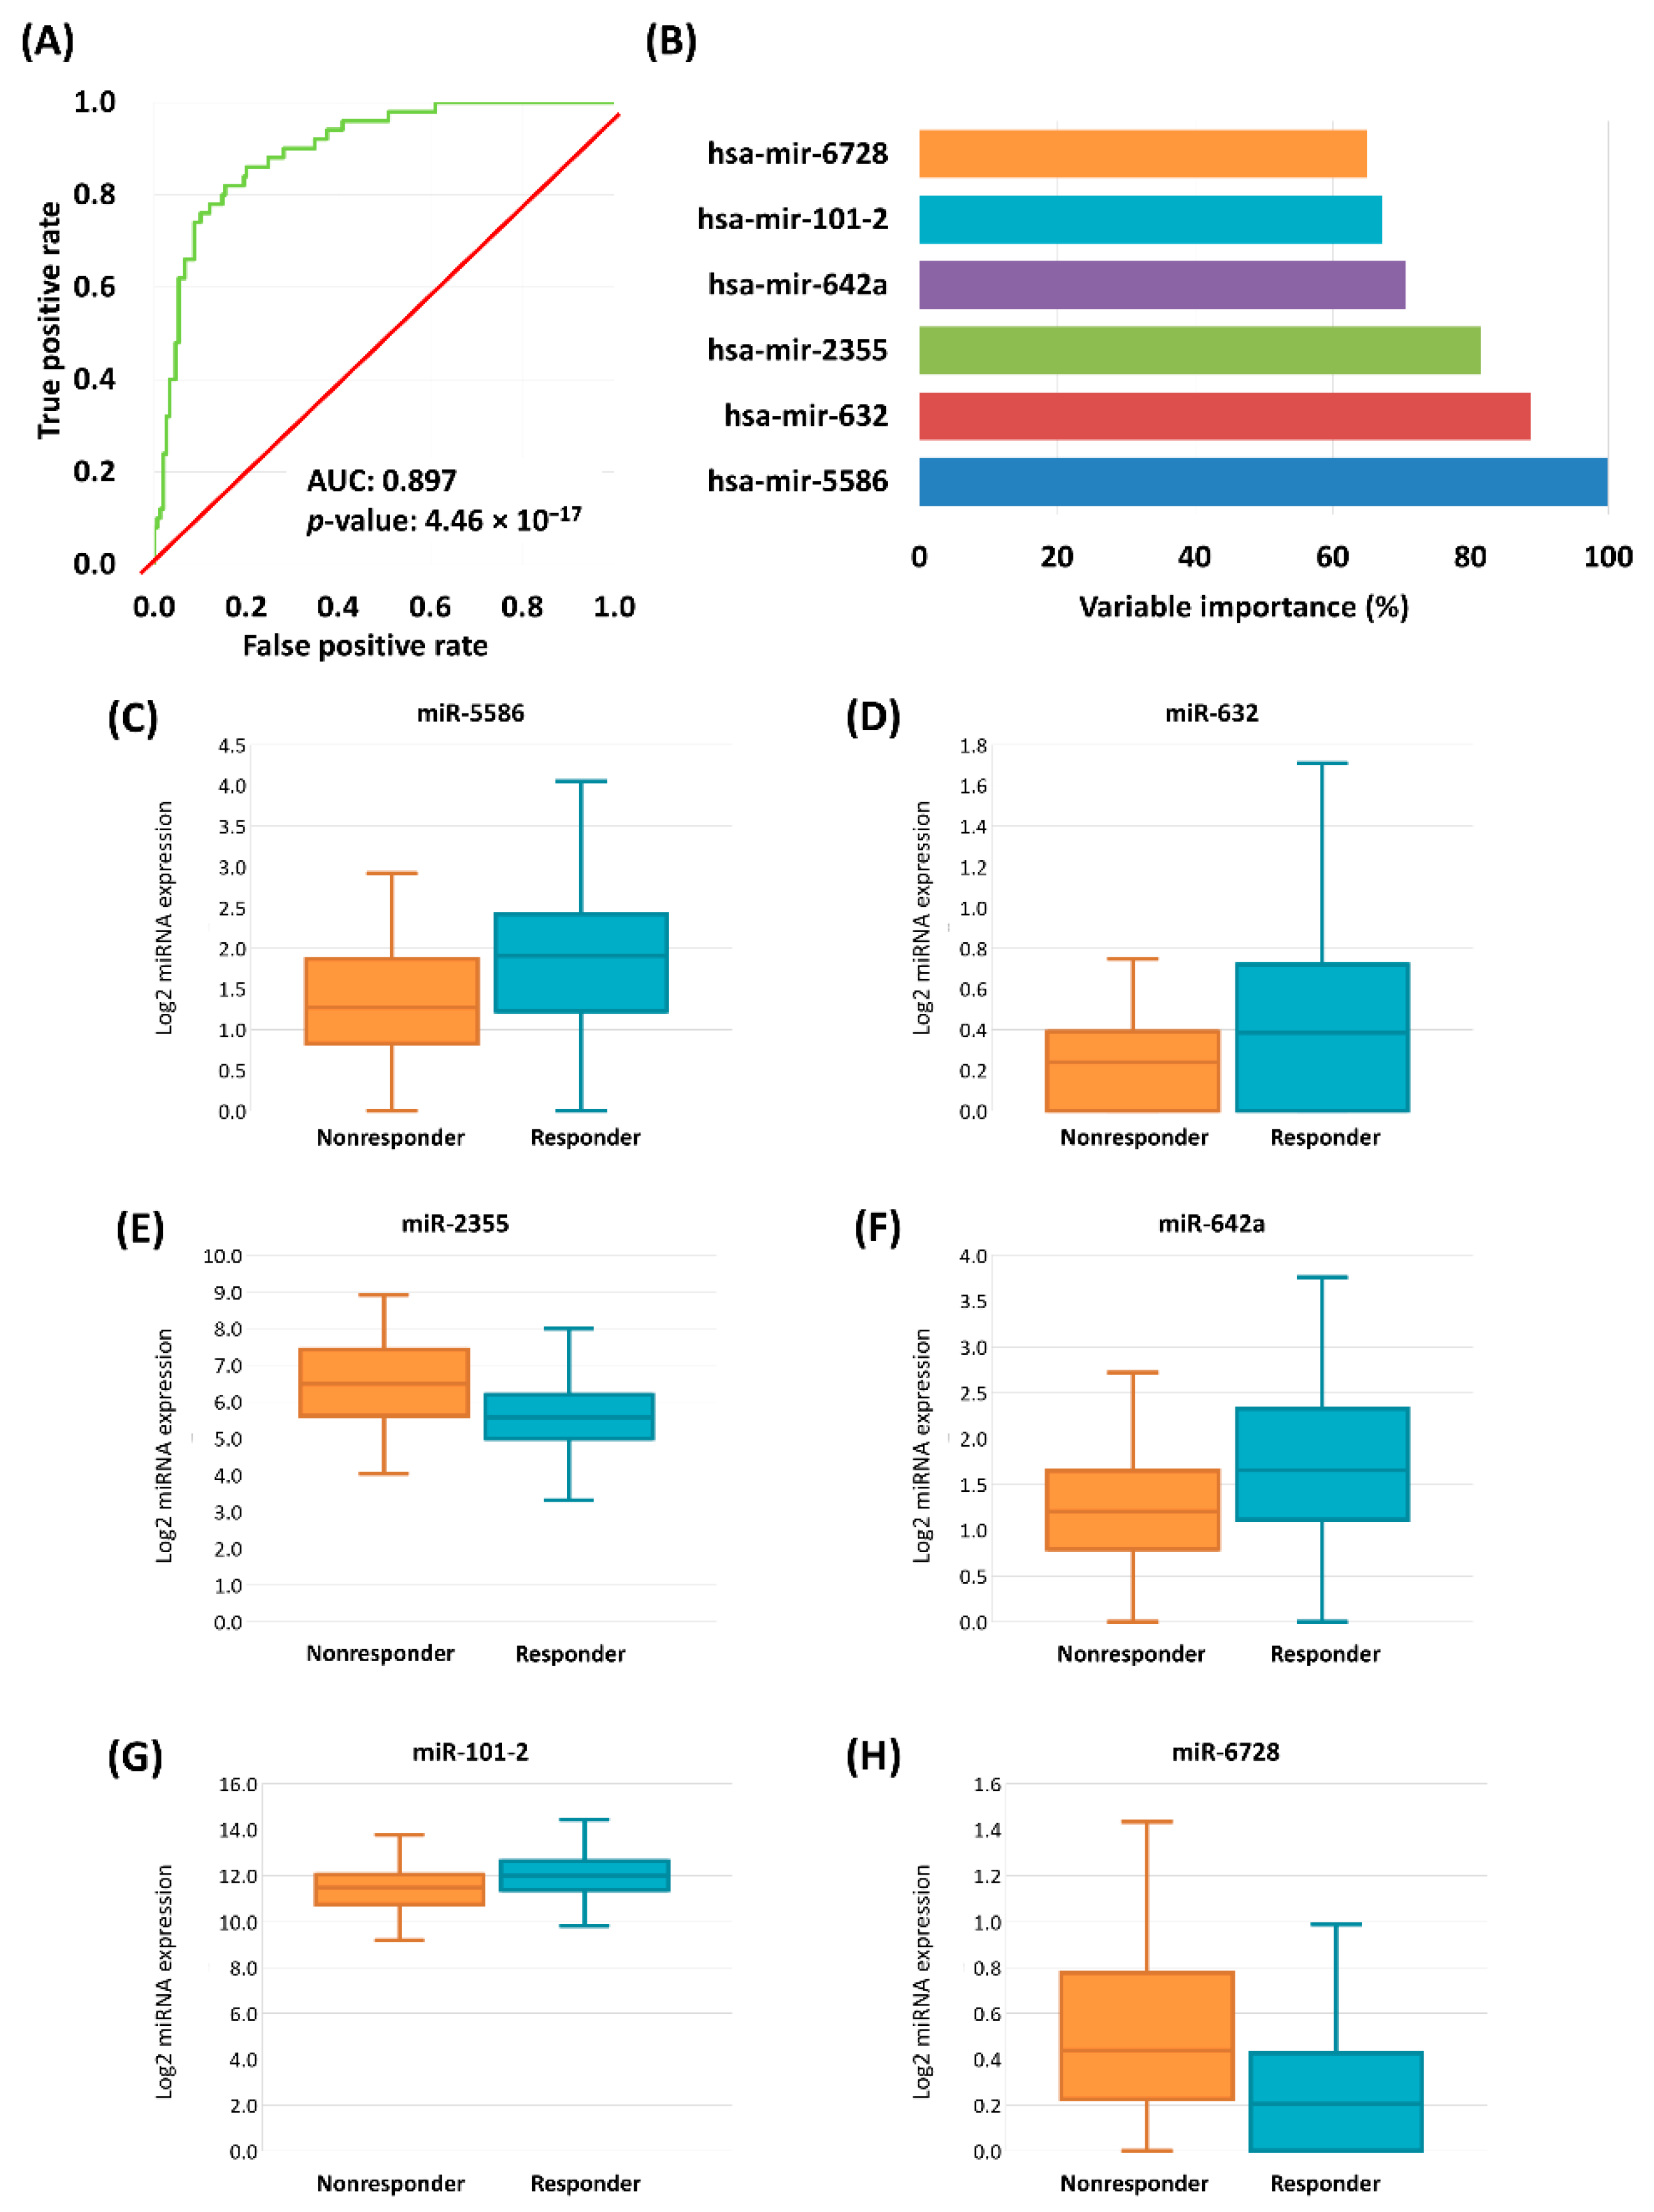
2.3. Logistic Regression Based Classification Model
2.4. Target Gene Prediction
3. Discussion
4. Materials and Methods
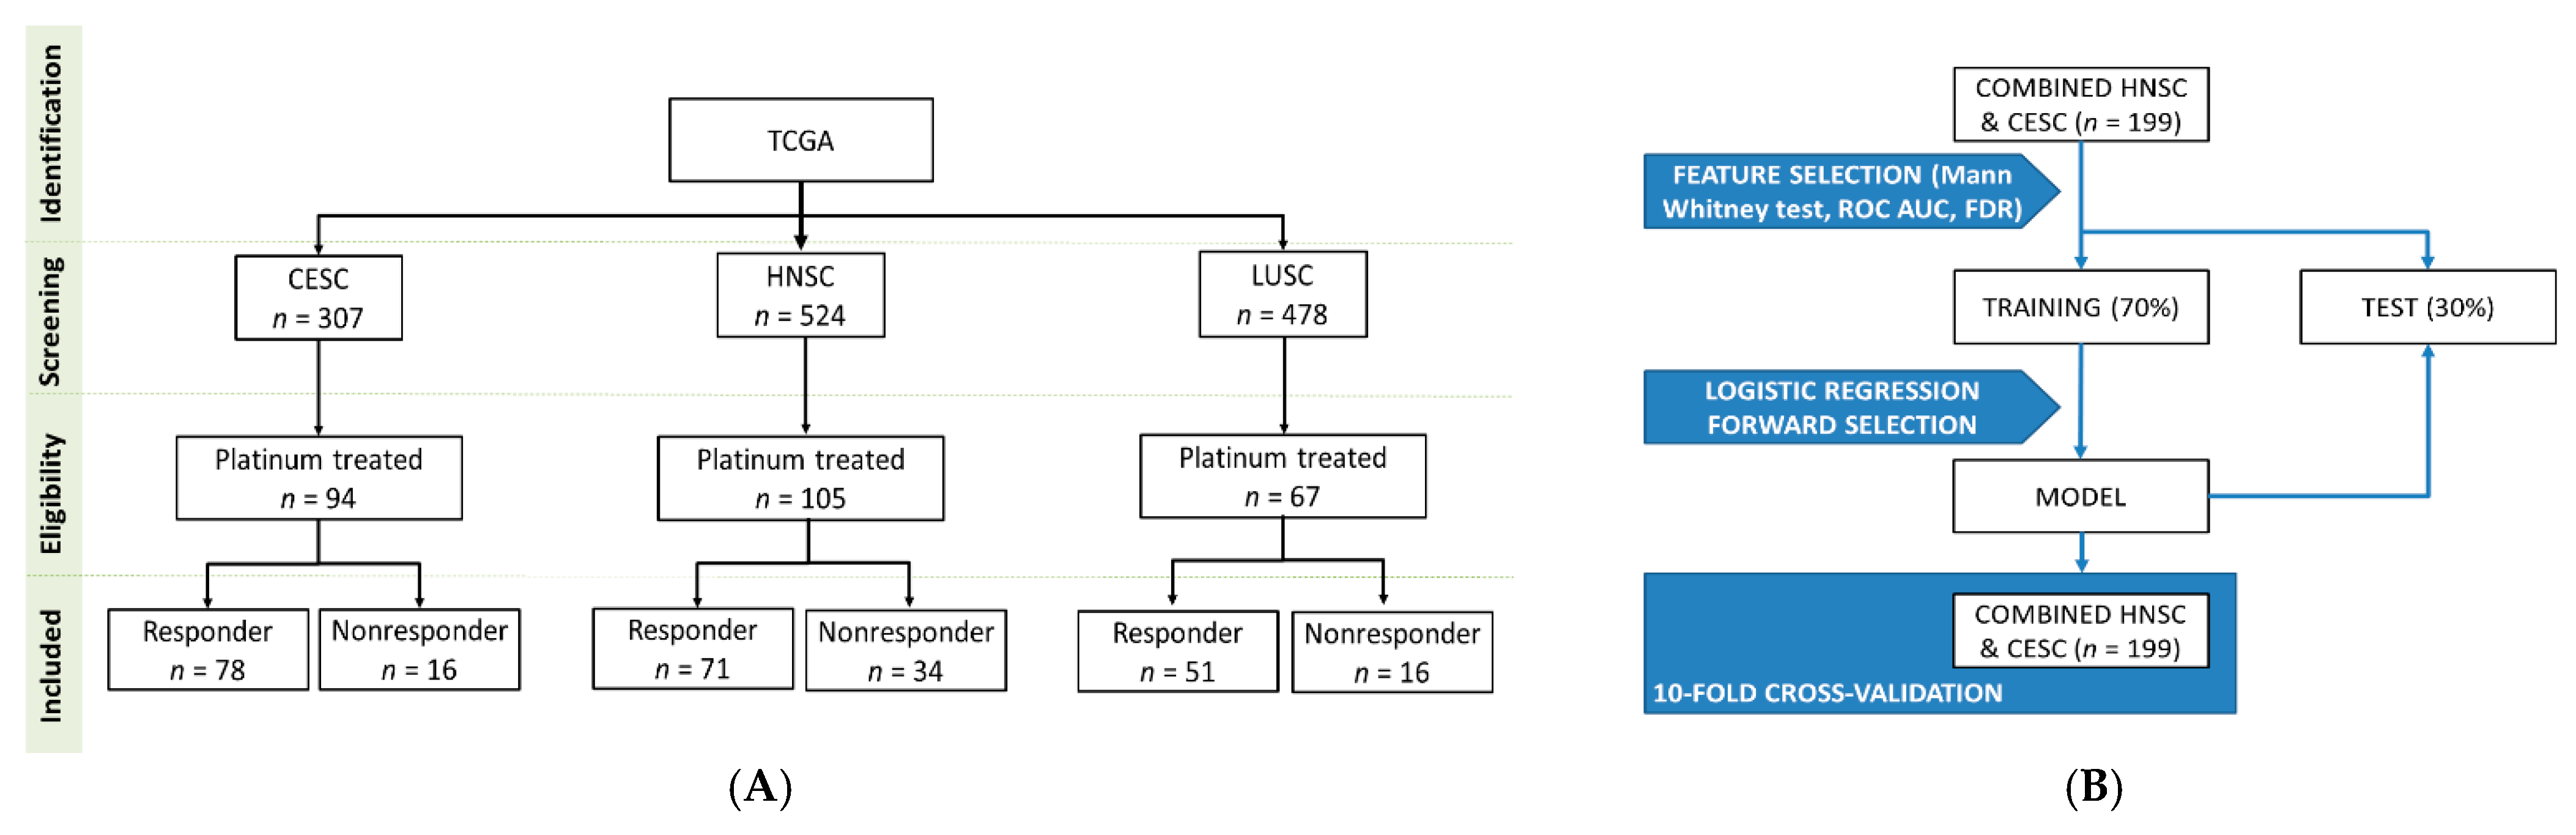
4.1. Database Construction
4.2. Determination of miRNAs with Best Discriminatory Ability by Tumor Types
4.3. Similarity Detection between Tumor Types
4.4. Model Building
4.5. KEGG Target Gene Prediction
5. Conclusions
Author Contributions
Funding
Institutional Review Board Statement
Informed Consent Statement
Data Availability Statement
Acknowledgments
Conflicts of Interest
References
- Yan, W.; Wistuba, I.I.; Emmert-Buck, M.R.; Erickson, H.S. Squamous Cell Carcinoma—Similarities and Differences among Anatomical Sites. Am. J. Cancer Res. 2011, 1, 275–300. [Google Scholar] [CrossRef] [PubMed]
- Campbell, J.D.; Yau, C.; Bowlby, R.; Liu, Y.; Brennan, K.; Fan, H.; Taylor, A.M.; Wang, C.; Walter, V.; Akbani, R.; et al. Genomic, Pathway Network, and Immunologic Features Distinguishing Squamous Carcinomas. Cell Rep. 2018, 23, 194–212. [Google Scholar] [CrossRef] [PubMed]
- Bray, F.; Ferlay, J.; Soerjomataram, I.; Siegel, R.L.; Torre, L.A.; Jemal, A. Global cancer statistics 2018: GLOBOCAN estimates of incidence and mortality worldwide for 36 cancers in 185 countries. CA Cancer J. Clin. 2018, 68, 394–424. [Google Scholar] [CrossRef] [PubMed]
- Menyhárt, O.; Fekete, J.T.; Győrffy, B. Demographic shift disproportionately increases cancer burden in an aging nation: Current and expected incidence and mortality in Hungary up to 2030. Clin. Epidemiol. 2018, 10, 1093–1108. [Google Scholar] [CrossRef] [PubMed]
- Lin, E.W.; Karakasheva, T.A.; Lee, D.J.; Lee, J.S.; Long, Q.; Bass, A.J.; Wong, K.K.; Rustgi, A.K. Comparative transcriptomes of adenocarcinomas and squamous cell carcinomas reveal molecular similarities that span classical anatomic boundaries. PLoS Genet. 2017, 13, e1006938. [Google Scholar] [CrossRef]
- Chow, L.Q.M. Head and Neck Cancer. N. Engl. J. Med. 2020, 382, 60–72. [Google Scholar] [CrossRef]
- Vu, M.; Yu, J.; Awolude, O.A.; Chuang, L. Cervical cancer worldwide. Curr. Probl. Cancer 2018, 42, 457–465. [Google Scholar] [CrossRef]
- National Comprehensive Cancer Network. Available online: http://www.ncnn.org/ (accessed on 15 October 2020).
- Sirohi, B.; Ashley, S.; Norton, A.; Popat, S.; Hughes, S.; Papadopoulos, P.; Priest, K.; O’Brien, M. Early response to platinum-based first-line chemotherapy in non-small cell lung cancer may predict survival. J. Thorac. Oncol. 2007, 2, 735–740. [Google Scholar] [CrossRef]
- Takekuma, M.; Kuji, S.; Tanaka, A.; Takahashi, N.; Abe, M.; Hirashima, Y. Platinum sensitivity and non-cross-resistance of cisplatin analogue with cisplatin in recurrent cervical cancer. J. Gynecol. Oncol. 2015, 26, 185–192. [Google Scholar] [CrossRef][Green Version]
- Pendleton, K.P.; Grandis, J.R. Cisplatin-Based Chemotherapy Options for Recurrent and/or Metastatic Squamous Cell Cancer of the Head and Neck. Clin. Med. Insights Ther. 2013, 2013. [Google Scholar] [CrossRef]
- Kelland, L. The resurgence of platinum-based cancer chemotherapy. Nat. Rev. Cancer 2007, 7, 573–584. [Google Scholar] [CrossRef] [PubMed]
- Hammond, S.M. An overview of microRNAs. Adv. Drug Deliv. Rev. 2015, 87, 3–14. [Google Scholar] [CrossRef] [PubMed]
- Si, W.; Shen, J.; Zheng, H.; Fan, W. The role and mechanisms of action of microRNAs in cancer drug resistance. Clin. Epigenetics 2019, 11, 25. [Google Scholar] [CrossRef]
- Papadaki, C.; Monastirioti, A.; Rounis, K.; Makrakis, D.; Kalbakis, K.; Nikolaou, C.; Mavroudis, D.; Agelaki, S. Circulating MicroRNAs Regulating DNA Damage Response and Responsiveness to Cisplatin in the Prognosis of Patients with Non-Small Cell Lung Cancer Treated with First-Line Platinum Chemotherapy. Cancers 2020, 12, 1282. [Google Scholar] [CrossRef]
- Hess, A.K.; Müer, A.; Mairinger, F.D.; Weichert, W.; Stenzinger, A.; Hummel, M.; Budach, V.; Tinhofer, I. MiR-200b and miR-155 as predictive biomarkers for the efficacy of chemoradiation in locally advanced head and neck squamous cell carcinoma. Eur. J. Cancer 2017, 77, 3–12. [Google Scholar] [CrossRef] [PubMed]
- Phuah, N.H.; In, L.L.; Azmi, M.N.; Ibrahim, H.; Awang, K.; Nagoor, N.H. Alterations of microRNA expression patterns in human cervical carcinoma cells (Ca Ski) toward 1′S-1′-acetoxychavicol acetate and cisplatin. Reprod. Sci. 2013, 20, 567–578. [Google Scholar] [CrossRef]
- Li, X.R.; Chu, H.J.; Lv, T.; Wang, L.; Kong, S.F.; Dai, S.Z. miR-342-3p suppresses proliferation, migration and invasion by targeting FOXM1 in human cervical cancer. FEBS Lett. 2014, 588, 3298–3307. [Google Scholar] [CrossRef]
- Ghaemi, Z.; Soltani, B.M.; Mowla, S.J. MicroRNA-326 Functions as a Tumor Suppressor in Breast Cancer by Targeting ErbB/PI3K Signaling Pathway. Front. Oncol. 2019, 9, 653. [Google Scholar] [CrossRef]
- Wu, L.; Hui, H.; Wang, L.J.; Wang, H.; Liu, Q.F.; Han, S.X. MicroRNA-326 functions as a tumor suppressor in colorectal cancer by targeting the nin one binding protein. Oncol. Rep. 2015, 33, 2309–2318. [Google Scholar] [CrossRef]
- Li, N.; Yang, L.; Wang, H.; Yi, T.; Jia, X.; Chen, C.; Xu, P. MiR-130a and MiR-374a Function as Novel Regulators of Cisplatin Resistance in Human Ovarian Cancer A2780 Cells. PLoS ONE 2015, 10, e0128886. [Google Scholar] [CrossRef]
- Li, H.; Jiang, Z.; Leng, Q.; Bai, F.; Wang, J.; Ding, X.; Li, Y.; Zhang, X.; Fang, H.; Yfantis, H.G.; et al. A prediction model for distinguishing lung squamous cell carcinoma from adenocarcinoma. Oncotarget 2017, 8, 50704–50714. [Google Scholar] [CrossRef] [PubMed]
- Ghafouri-Fard, S.; Gholipour, M.; Taheri, M.; Shirvani Farsani, Z. MicroRNA profile in the squamous cell carcinoma: Prognostic and diagnostic roles. Heliyon 2020, 6, e05436. [Google Scholar] [CrossRef] [PubMed]
- Gao, J.; Wu, N.; Liu, X.; Xia, Y.; Chen, Y.; Li, S.; Deng, Z. MicroRNA-142-3p inhibits cell proliferation and chemoresistance in ovarian cancer via targeting sirtuin 1. Exp. Ther. Med. 2018, 15, 5205–5214. [Google Scholar] [CrossRef] [PubMed]
- Staicu, C.E.; Predescu, D.V.; Rusu, C.M.; Radu, B.M.; Cretoiu, D.; Suciu, N.; Crețoiu, S.M.; Voinea, S.C. Role of microRNAs as Clinical Cancer Biomarkers for Ovarian Cancer: A Short Overview. Cells 2020, 9, 169. [Google Scholar] [CrossRef] [PubMed]
- Gu, Z.; Li, Z.; Xu, R.; Zhu, X.; Hu, R.; Xue, Y.; Xu, W. miR-16-5p Suppresses Progression and Invasion of Osteosarcoma via Targeting at Smad3. Front. Pharmacol. 2020, 11, 1324. [Google Scholar] [CrossRef]
- Pouliot, L.M.; Shen, D.W.; Suzuki, T.; Hall, M.D.; Gottesman, M.M. Contributions of microRNA dysregulation to cisplatin resistance in adenocarcinoma cells. Exp. Cell Res. 2013, 319, 566–574. [Google Scholar] [CrossRef]
- Yang, C.C.; Hung, P.S.; Wang, P.W.; Liu, C.J.; Chu, T.H.; Cheng, H.W.; Lin, S.C. miR-181 as a putative biomarker for lymph-node metastasis of oral squamous cell carcinoma. J. Oral Pathol. Med. 2011, 40, 397–404. [Google Scholar] [CrossRef]
- Chen, X.; Jiang, Y.; Huang, Z.; Li, D.; Chen, X.; Cao, M.; Meng, Q.; Pang, H.; Sun, L.; Zhao, Y.; et al. miRNA-378 reverses chemoresistance to cisplatin in lung adenocarcinoma cells by targeting secreted clusterin. Sci. Rep. 2016, 6, 19455. [Google Scholar] [CrossRef]
- Eichelmann, A.K.; Matuszcak, C.; Lindner, K.; Haier, J.; Hussey, D.J.; Hummel, R. Complex role of miR-130a-3p and miR-148a-3p balance on drug resistance and tumor biology in esophageal squamous cell carcinoma. Sci. Rep. 2018, 8, 17553. [Google Scholar] [CrossRef]
- Chao, A.; Lai, C.H.; Chen, H.C.; Lin, C.Y.; Tsai, C.L.; Tang, Y.H.; Huang, H.J.; Lin, C.T.; Chen, M.Y.; Huang, K.G.; et al. Serum microRNAs in clear cell carcinoma of the ovary. Taiwan J. Obstet. Gynecol. 2014, 53, 536–541. [Google Scholar] [CrossRef]
- Yang, L.; Li, N.; Wang, H.; Jia, X.; Wang, X.; Luo, J. Altered microRNA expression in cisplatin-resistant ovarian cancer cells and upregulation of miR-130a associated with MDR1/P-glycoprotein-mediated drug resistance. Oncol. Rep. 2012, 28, 592–600. [Google Scholar] [CrossRef] [PubMed]
- Aqeilan, R.I.; Calin, G.A.; Croce, C.M. miR-15a and miR-16-1 in cancer: Discovery, function and future perspectives. Cell Death Differ. 2010, 17, 215–220. [Google Scholar] [CrossRef] [PubMed]
- Kontos, C.K.; Tsiakanikas, P.; Avgeris, M.; Papadopoulos, I.N.; Scorilas, A. miR-15a-5p, A Novel Prognostic Biomarker, Predicting Recurrent Colorectal Adenocarcinoma. Mol. Diagn. Ther. 2017, 21, 453–464. [Google Scholar] [CrossRef] [PubMed]
- Xin, C.; Buhe, B.; Hongting, L.; Chuanmin, Y.; Xiwei, H.; Hong, Z.; Lulu, H.; Qian, D.; Renjie, W. MicroRNA-15a promotes neuroblastoma migration by targeting reversion-inducing cysteine-rich protein with Kazal motifs (RECK) and regulating matrix metalloproteinase-9 expression. FEBS J. 2013, 280, 855–866. [Google Scholar] [CrossRef]
- Duan, J.; Zhang, H.; Qu, Y.; Deng, T.; Huang, D.; Liu, R.; Zhang, L.; Bai, M.; Zhou, L.; Ying, G.; et al. Onco-miR-130 promotes cell proliferation and migration by targeting TGFβR2 in gastric cancer. Oncotarget 2016, 7, 44522–44533. [Google Scholar] [CrossRef]
- Boll, K.; Reiche, K.; Kasack, K.; Mörbt, N.; Kretzschmar, A.K.; Tomm, J.M.; Verhaegh, G.; Schalken, J.; von Bergen, M.; Horn, F.; et al. MiR-130a, miR-203 and miR-205 jointly repress key oncogenic pathways and are downregulated in prostate carcinoma. Oncogene 2013, 32, 277–285. [Google Scholar] [CrossRef]
- Lim, E.L.; Trinh, D.L.; Scott, D.W.; Chu, A.; Krzywinski, M.; Zhao, Y.; Robertson, A.G.; Mungall, A.J.; Schein, J.; Boyle, M.; et al. Comprehensive miRNA sequence analysis reveals survival differences in diffuse large B-cell lymphoma patients. Genome Biol. 2015, 16, 18. [Google Scholar] [CrossRef]
- Slattery, M.L.; Pellatt, A.J.; Lee, F.Y.; Herrick, J.S.; Samowitz, W.S.; Stevens, J.R.; Wolff, R.K.; Mullany, L.E. Infrequently expressed miRNAs influence survival after diagnosis with colorectal cancer. Oncotarget 2017, 8, 83845–83859. [Google Scholar] [CrossRef]
- Pu, J.; Wang, J.; Xu, Z.; Lu, Y.; Wu, X.; Wu, Y.; Shao, Z.; Tang, Q.; Wei, H. miR-632 Functions as Oncogene in Hepatocellular Carcinoma via Targeting MYCT1. Hum. Gene Ther. Clin. Dev. 2019, 30, 67–73. [Google Scholar] [CrossRef]
- Zhang, Q.; Guan, F.; Fan, T.; Li, S.; Ma, S.; Zhang, Y.; Guo, W.; Liu, H. LncRNA WDFY3-AS2 suppresses proliferation and invasion in oesophageal squamous cell carcinoma by regulating miR-2355-5p/SOCS2 axis. J. Cell Mol. Med. 2020, 24, 8206–8220. [Google Scholar] [CrossRef]
- MacCarthy, C.M.; Notario, V. The ENTPD5/mt-PCPH oncoprotein is a catalytically inactive member of the ectonucleoside triphosphate diphosphohydrolase family. Int. J. Oncol. 2013, 43, 1244–1252. [Google Scholar] [CrossRef] [PubMed]
- Villar, J.; Quadri, H.S.; Song, I.; Tomita, Y.; Tirado, O.M.; Notario, V. PCPH/ENTPD5 expression confers to prostate cancer cells resistance against cisplatin-induced apoptosis through protein kinase Calpha-mediated Bcl-2 stabilization. Cancer Res. 2009, 69, 102–110. [Google Scholar] [CrossRef] [PubMed]
- Xue, Y.; Wu, L.; Liu, Y.; Ma, Y.; Zhang, L.; Ma, X.; Yang, Y.; Chen, J. ENTPD5 induces apoptosis in lung cancer cells via regulating caspase 3 expression. PLoS ONE 2015, 10, e0120046. [Google Scholar] [CrossRef] [PubMed]
- Savvidis, C.; Koutsilieris, M. Circadian rhythm disruption in cancer biology. Mol. Med. 2012, 18, 1249–1260. [Google Scholar] [CrossRef]
- National Cancer Institute GDC Data Portal. Available online: https://portal.gdc.cancer.gov/ (accessed on 15 October 2020).
- R Core Team. R: A Language and Environment for Statistical Computing; R Foundation for Statistical Computing: Vienna, Austria, 2020. [Google Scholar]
- Huber, W.; Carey, V.J.; Gentleman, R.; Anders, S.; Carlson, M.; Carvalho, B.S.; Bravo, H.C.; Davis, S.; Gatto, L.; Girke, T.; et al. Orchestrating high-throughput genomic analysis with Bioconductor. Nat Methods 2015, 12, 115–121. [Google Scholar] [CrossRef]
- Thind, A.S.; Tripathi, K.P.; Guarracino, M.R. RankerGUI: A Computational Framework to Compare Differential Gene Expression Profiles Using Rank Based Statistics. Int. J. Mol. Sci. 2019, 20, 6098. [Google Scholar] [CrossRef]
- Vlachos, I.S.; Zagganas, K.; Paraskevopoulou, M.D.; Georgakilas, G.; Karagkouni, D.; Vergoulis, T.; Dalamagas, T.; Hatzigeorgiou, A.G. DIANA-miRPath v3.0: Deciphering microRNA function with experimental support. Nucleic Acids Res. 2015, 43, W460–W466. [Google Scholar] [CrossRef]


| Characteristic | Cervical | Head and Neck | Lung | Total |
|---|---|---|---|---|
| Age (years ± standard deviation) | 49.74 ± 12.50 | 57.12 ± 10.10 | 63.15 ± 9.56 | 56.03 ± 12.04 |
| Gender (male/female) | 0/94 | 90/15 | 50/17 | 140/126 |
| Stage (unknown/I/II/III/IV) | 94/-/-/-/- | 27/1/3/8/66 | 1/11/35/18/2 | 122/12/38/26/68 |
| Grade (unknown/I/II/III/IV) | 8/3/46/36/1 | 6/9/57/26/7 | 67/-/-/-/- | 81/12/103/62/8 |
| Follow-up (months ± standard deviation) | 47.64 ± 39.21 | 32.21 ± 21.39 | 35.87 ± 21.00 | 39.68 ± 30.44 |
| CESC (n = 94) | Mean (Nonresponder) | Mean (Responder) | Fold Change | Mann–Whitney p | AUC | AUC (p-Value) | FDR |
|---|---|---|---|---|---|---|---|
| hsa-miR-342 | 6.390 | 7.445 | 1.17 | 9.68 × 10⁻⁵ | 0.811 | 8.30 × 10⁻¹¹ | 1.1 × 10⁻⁵ |
| hsa-miR-7702 | 0.397 | 1.413 | 3.56 | 1.11 × 10⁻⁴ | 0.808 | 1.90 × 10⁻⁷ | 1.8 × 10⁻⁴ |
| hsa-miR-378c | 2.226 | 3.293 | 1.48 | 1.29 × 10⁻⁴ | 0.805 | 3.60 × 10⁻⁷ | 3.5 × 10⁻⁴ |
| hsa-miR-155 | 7.603 | 8.896 | 1.17 | 2.01 × 10⁻⁴ | 0.796 | 4.40 × 10⁻⁹ | 1.1 × 10⁻⁵ |
| hsa-miR-378a | 8.302 | 9.693 | 1.17 | 3.22 × 10⁻⁴ | 0.787 | 8.00 × 10⁻⁶ | 6.0 × 10⁻³ |
| hsa-miR-502 | 3.118 | 3.624 | 1.16 | 1.61 × 10⁻³ | 0.752 | 9.10 × 10⁻⁴ | 1.2 × 10⁻¹ |
| hsa-miR-150 | 7.926 | 9.468 | 1.19 | 1.91 × 10⁻³ | 0.748 | 4.00 × 10⁻⁵ | 2.9 × 10⁻² |
| hsa-miR-5586 | 1.128 | 1.784 | 1.58 | 2.12 × 10⁻³ | 0.745 | 7.40 × 10⁻⁶ | 5.6 × 10⁻³ |
| hsa-let-7g | 8.820 | 9.226 | 1.05 | 2.85 × 10⁻³ | 0.738 | 2.30 × 10⁻⁴ | 7.5 × 10⁻² |
| hsa-miR-378d-2 | 0.299 | 0.600 | 2.01 | 5.72 × 10⁻³ | 0.72 | 1.40 × 10⁻³ | 1.4 × 10⁻¹ |
| HNSC (n = 105) | Mean (Nonresponder) | Mean (Responder) | Fold Change | Mann–Whitney p | AUC | AUC (p-Value) | FDR |
|---|---|---|---|---|---|---|---|
| hsa-miR-326 | 1.366 | 2.312 | 1.69 | 9.24 × 10⁻⁶ | 0.768 | 1.80 × 10⁻⁹ | 1.3 × 10⁻⁵ |
| hsa-miR-584 | 7.750 | 6.430 | 1.21 | 2.02 × 10⁻⁵ | 0.758 | 1.20 × 10⁻⁸ | 1.5 × 10⁻⁵ |
| hsa-miR-4791 | 0.275 | 0.809 | 2.94 | 4.66 × 10⁻⁵ | 0.742 | 2.80 × 10⁻⁷ | 1.7 × 10⁻⁴ |
| hsa-miR-19a | 5.587 | 4.705 | 1.19 | 8.11 × 10⁻⁵ | 0.739 | 2.50 × 10⁻⁶ | 6.4 × 10⁻⁴ |
| hsa-miR-3610 | 0.659 | 1.100 | 1.67 | 8.54 × 10⁻⁵ | 0.738 | 3.60 × 10⁻⁶ | 8.0 × 10⁻⁴ |
| hsa-miR-632 | 0.226 | 0.567 | 2.51 | 1.11 × 10⁻⁴ | 0.732 | 4.30 × 10⁻⁷ | 2.2 × 10⁻⁴ |
| hsa-miR-5091 | 0.291 | 0.600 | 2.06 | 1.39 × 10⁻⁴ | 0.729 | 2.60 × 10⁻⁶ | 6.6 × 10⁻⁴ |
| hsa-miR-3130-1 | 1.162 | 2.019 | 1.74 | 1.50 × 10⁻⁴ | 0.729 | 1.10 × 10⁻⁵ | 1.6 × 10⁻³ |
| hsa-miR-4745 | 0.464 | 0.179 | 2.6 | 8.37 × 10⁻⁵ | 0.724 | 1.60 × 10⁻⁵ | 2.1 × 10⁻³ |
| hsa-miR-143 | 14.970 | 15.801 | 1.06 | 2.59 × 10⁻⁴ | 0.721 | 1.40 × 10⁻⁵ | 1.9 × 10⁻³ |
| LUSC (n = 67) | Mean (Nonresponder) | Mean (Responder) | Fold Change | Mann–Whitney p | AUC | AUC (p-Value) | FDR |
|---|---|---|---|---|---|---|---|
| hsa-miR-130a | 7.168 | 6.496 | 1.1 | 1.61 × 10⁻³ | 0.763 | 2.30 × 10⁻⁵ | 2.5 × 10⁻² |
| hsa-miR-26b | 9.977 | 9.315 | 1.07 | 2.64 × 10⁻³ | 0.751 | 1.00 × 10⁻³ | 1.3 × 10⁻¹ |
| hsa-miR-6781 | 0.626 | 0.259 | 2.42 | 1.87 × 10⁻³ | 0.744 | 9.60 × 10⁻⁵ | 5.2 × 10⁻² |
| hsa-miR-361 | 8.940 | 8.398 | 1.06 | 4.64 × 10⁻³ | 0.737 | 1.60 × 10⁻³ | 1.6 × 10⁻¹ |
| hsa-miR-877 | 2.844 | 1.998 | 1.42 | 6.09 × 10⁻³ | 0.729 | 1.40 × 10⁻³ | 1.5 × 10⁻¹ |
| hsa-miR-30c-2 | 8.583 | 7.958 | 1.08 | 6.66 × 10⁻³ | 0.727 | 7.70 × 10⁻⁴ | 1.2 × 10⁻¹ |
| hsa-miR-335 | 7.650 | 6.918 | 1.11 | 7.94 × 10⁻³ | 0.722 | 2.40 × 10⁻⁴ | 7.6 × 10⁻² |
| hsa-miR-30c-1 | 8.484 | 7.834 | 1.08 | 8.66 × 10⁻³ | 0.719 | 1.30 × 10⁻³ | 1.4 × 10⁻¹ |
| hsa-miR-3193 | 0.207 | 0.541 | 2.62 | 9.20 × 10⁻³ | 0.713 | 1.90 × 10⁻³ | 1.7 × 10⁻¹ |
| hsa-miR-15a | 7.618 | 7.172 | 1.06 | 1.12 × 10⁻² | 0.712 | 3.10 × 10⁻⁴ | 8.4 × 10⁻² |
| MIR | B | SE | ExpB | 95% CI for ExpB | p Value |
|---|---|---|---|---|---|
| hsa-miR-5586 | 1.077 | 0.321 | 2.937 | 1.565–5.511 | 0.001 |
| hsa-miR-632 | 2.375 | 0.778 | 10.751 | 2.341–49.372 | 0.002 |
| hsa-miR-2355 | −0.732 | 0.255 | 0.481 | 0.292–0.793 | 0.004 |
| hsa-miR-642a | 0.798 | 0.309 | 2.222 | 1.213–4.069 | 0.010 |
| hsa-miR-101-2 | −0.946 | 0.38 | 0.388 | 0.184–0.817 | 0.013 |
| hsa-miR-6728 | −1.564 | 0.648 | 0.209 | 0.059–0.745 | 0.016 |
| hsa-miR-181b-2 | −0.438 | 0.267 | 0.645 | 0.383–1.089 | 0.101 |
| hsa-miR-26a-2 | 0.922 | 0.479 | 2.513 | 0.982–6.429 | 0.054 |
| hsa-miR-584 | −0.118 | 0.163 | 0.888 | 0.646–1.222 | 0.467 |
| Constant | 8.578 | 4.694 | 5315.361 | - | 0.068 |
| KEGG Pathway | p-Value | Number of Genes | Predicted Genes |
|---|---|---|---|
| Circadian entrainment (hsa04713) | 2.17 × 10⁻⁶ | 6 | FOS; GNB1; CREB1; GNAQ; GRIN2A; GRIN2B |
| Amphetamine addiction (hsa05031) | 6.15 × 10⁻⁵ | 4 | FOS; CREB1; GRIN2A; GRIN2B |
| Dopaminergic synapse (hsa04728) | 0.009603 | 7 | FOS; GSK3B; GNB1; CREB1; GNAQ; GRIN2A; GRIN2B |
| AMPK signaling pathway (hsa04152) | 0.04017 | 3 | CREB1; PPARGC1A; FOXO1 |
Publisher’s Note: MDPI stays neutral with regard to jurisdictional claims in published maps and institutional affiliations. |
© 2020 by the authors. Licensee MDPI, Basel, Switzerland. This article is an open access article distributed under the terms and conditions of the Creative Commons Attribution (CC BY) license (http://creativecommons.org/licenses/by/4.0/).
Share and Cite
Fekete, J.T.; Welker, Á.; Győrffy, B. miRNA Expression Signatures of Therapy Response in Squamous Cell Carcinomas. Cancers 2021, 13, 63. https://doi.org/10.3390/cancers13010063
Fekete JT, Welker Á, Győrffy B. miRNA Expression Signatures of Therapy Response in Squamous Cell Carcinomas. Cancers. 2021; 13(1):63. https://doi.org/10.3390/cancers13010063
Chicago/Turabian StyleFekete, János Tibor, Ágnes Welker, and Balázs Győrffy. 2021. "miRNA Expression Signatures of Therapy Response in Squamous Cell Carcinomas" Cancers 13, no. 1: 63. https://doi.org/10.3390/cancers13010063
APA StyleFekete, J. T., Welker, Á., & Győrffy, B. (2021). miRNA Expression Signatures of Therapy Response in Squamous Cell Carcinomas. Cancers, 13(1), 63. https://doi.org/10.3390/cancers13010063