Article

Genomic and Functional Regulation of TRIB1 Contributes to Prostate Cancer Pathogenesis

by
Parastoo Shahrouzi
1,
Ianire Astobiza
1,2,
Ana R. Cortazar
1,2,
Verónica Torrano
1,2,3,
Alice Macchia
1,
Juana M. Flores
4,
Chiara Niespolo
5,
Isabel Mendizabal
1,
Ruben Caloto
2,6,
Amaia Ercilla
1,2,
Laura Camacho
1,3,
Leire Arreal
1,
Maider Bizkarguenaga
1,
Maria L. Martinez-Chantar
1,7,
Xose R. Bustelo
2,6,
Edurne Berra
1,2,
Endre Kiss-Toth
5,
Guillermo Velasco
8,9,
Amaia Zabala-Letona
1,2 and
Arkaitz Carracedo
1,2,3,10,*
1
Center for Cooperative Research in Biosciences (CIC bioGUNE), Basque Research and Technology Alliance (BRTA), Bizkaia Technology Park, Building 801A, 48160 Derio, Spain
2
CIBERONC (Centro de Investigación Biomédica en Red de Cáncer), 28029 Madrid, Spain
3
Biochemistry and Molecular Biology Department, University of the Basque Country (UPV/EHU), P.O. Box 644, E-48080 Bilbao, Spain
4
Medicine and Surgery Department, Veterinary Faculty, Complutense University of Madrid, 28040 Madrid, Spain
5
Department of Infection, Immunity and Cardiovascular Disease, University of Sheffield, Beech Hill Road, Sheffield S10 2RX, UK
6
Centro de Investigación del Cáncer, Instituto de Biología Molecular y Celular del Cáncer, Consejo Superior de Investigaciones Científicas (CSIC)-University of Salamanca, 37007 Salamanca, Spain
7
Centro de Investigación Biomédica en Red de Enfermedades Hepáticas y Digestivas, CIBERehd, Carlos III Health Institute, 28029 Madrid, Spain
8
Biochemistry and Molecular Biology Department, Complutense University of Madrid, 28040 Madrid, Spain
9
Instituto de Investigaciones Sanitarias San Carlos, 28040 Madrid, Spain
10
Ikerbasque, Basque Foundation for Science, 48011 Bilbao, Spain
*
Author to whom correspondence should be addressed.
Cancers 2020, 12(9), 2593; https://doi.org/10.3390/cancers12092593
Submission received: 7 August 2020 / Revised: 26 August 2020 / Accepted: 4 September 2020 / Published: 11 September 2020
(This article belongs to the Special Issue Pseudokinases, Tribbles Proteins and Cancer)

Abstract

:
Prostate cancer is the most frequent malignancy in European men and the second worldwide. One of the major oncogenic events in this disease includes amplification of the transcription factor cMYC. Amplification of this oncogene in chromosome 8q24 occurs concomitantly with the copy number increase in a subset of neighboring genes and regulatory elements, but their contribution to disease pathogenesis is poorly understood. Here we show that TRIB1 is among the most robustly upregulated coding genes within the 8q24 amplicon in prostate cancer. Moreover, we demonstrate that TRIB1 amplification and overexpression are frequent in this tumor type. Importantly, we find that, parallel to its amplification, TRIB1 transcription is controlled by cMYC. Mouse modeling and functional analysis revealed that aberrant TRIB1 expression is causal to prostate cancer pathogenesis. In sum, we provide unprecedented evidence for the regulation and function of TRIB1 in prostate cancer.

1. Introduction

The pathogenesis of cancer is underscored by mutations in driver genes that support the acquisition of cancer hallmarks [1,2]. Copy number aberrations can affect a single gene, a group of coding and non-coding genes or DNA regulatory regions [3]. The genomic locus containing the oncogene cMYC, 8q24, is an illustrative example of broad regulatory impact of genomic aberrations [4,5]. cMYC is frequently amplified in tumors [4,6]. Whereas focal amplifications in this gene are reported, copy number alterations in this locus often encompass neighboring regulatory regions, coding and non-coding genes [5,7]. Indeed, a number of genes contained in the cMYC locus have been involved in the pathogenesis or progression of different cancers, including BOP1, PVT1, FAM84B or POU5F1P1 [7,8,9,10,11,12,13]. However, a comprehensive analysis of cMYC-neighboring genes in specific tumor types is lacking, thus resulting in an incomplete understanding of the molecular drivers of this disease.
Prostate cancer (PCa) is among the most frequent cancer types in men, and it is responsible for an important fraction of cancer-associated mortality [14]. This disease is predominantly diagnosed in a localized stage and is subject to first-line therapies, including prostatectomy and radiotherapy [15,16]. However, a subset of patients will exhibit a raise in blood prostate-specific antigen (PSA) months to years after treatment, which is indicative of disease recurrence. Albeit the implementation of innovative therapies for recurrent PCa, emergence of metastasis in these patients is frequent, which represents a major risk of mortality by this disease.
cMYC is a well-known driver of PCa pathogenesis and progression [4]. This gene is frequently amplified and upregulated in PCa, and an increase in cMYC dosage has been reported to associate with disease progression and castration-resistant PCa [17]. Increased expression of this transcription factor is an initiating event in this disease, as demonstrated in genetic mouse models [18,19]. Importantly, cMYC overexpression cooperates with other genetic perturbations, to promote disease progression [18,19]. Interestingly, despite its frequent upregulation, a recent report ruled out a significant prognostic value of cMYC protein levels when monitoring lethality as the outcome [20].
The Tribbles (TRIB) proteins are a family of serine/threonine pseudokinases composed of three members, TRIB1, TRIB2 and TRIB3 [21,22]. TRIB family proteins are activated by a number of cellular stresses and mitogens, and have been reported to participate in cancer-related processes [22]. Their lack of catalytic activity has inspired various studies aimed at identifying their molecular mechanism of action. These pseudokinases harbor a C-terminal COPI-binding domain, which controls the stability of interacting proteins, through ubiquitination and proteasome-dependent degradation [22,23,24,25,26]. The three members of the family operate as tumor suppressors or tumor promoters, based on the tissue of origin [21,22].
TRIB1 gene localizes to chromosome 8q24.13, in close proximity to cMYC. Amplifications of this gene are reported in cancer [22], and evidence of its contribution to disease pathogenesis has begun to emerge. For example, TRIB1-mediated degradation of C/EBPα through COPI and activation of MAPK/AKT pathways lead to leukemogenesis [22]. With regards to PCa, the evidence on the function of TRIB1 is limited, and no genetically engineered mouse models have been generated to provide formal demonstration of its tumor-promoting activity [27,28,29].
In this study, we demonstrate that TRIB1 is the gene exhibiting the highest expression within cMYC amplicon in PCa. In addition to the co-amplification, the pseudokinase is also a transcriptional target of cMYC. Importantly, we show that exacerbated expression levels of Trib1 contribute to the pathogenesis of PCa in murine models.

2. Methods

2.1. Animals

All mouse experiments were performed by following the ethical guidelines established by the Biosafety and Animal Welfare Committee at CIC bioGUNE, Derio, Spain (under protocol P-CBG-CBBA-0715). The employed procedures followed the recommendations from the Association for Assessment and Accreditation of Laboratory Animal Care International (AAALAC). Genetically engineered mouse model experiments were performed in a mixed background, as reported [30]. The prostate-specific Pten-deficient mice were originally generated by the Pandolfi group [31,32]. Mice were routinely fasted for 6 h prior to tissue harvest (9:00–15:00), to prevent metabolic alterations due to immediate food intake. To address the effect of Trib1 overexpression on PCa pathogenesis, Rosa26LSL-Trib1Tg mice [33] were crossed with Ptenlox/+ Pb-Cre4 mice.
For xenograft assays, 4 × 10⁶ DU145 cells transduced either with empty TRIPZ vector (mock) or TRIB1 expressing construct (Doxycycline-inducible TRIPZ–TRIB1) were prepared in PBS supplemented with 5 mM glucose. Matrigel (Corning Cat# 354230) was mixed with the cell suspension, at a 1:1 ratio, in a final volume of 100 µL, and injected subcutaneously in two flanks per mouse (8 mice, n = 16 per condition) in immunocompromised male nude mice of 8–10 weeks (Harlan). Mice were randomly assigned to doxycycline or control diet [30] at day 4 after injection. Tumor size was monitored every day, using external caliper, during a total of 29 days. Tumor volume was inferred by using the volume estimation of an ellipsoid. At the experimental endpoint, mice were sacrificed, and tumors were processed for molecular analysis.

2.2. Histopathological Analysis and Immunohistochemistry

Tissue sample collection was carried out at 15–17 months of age (Ptenpc+/− Trib1pc+/+ and Ptenpc+/− Trib1pcTg/+ mice). Tissue samples were fixed overnight in 10% neutral buffered formalin, embedded in paraffin and sectioned 3 μm thick and dried. Slides were dewaxed and re-hydrated through a series of graded ethanol until water and subsequently stained with required antibody and/or hematoxylin–eosin (H&E). Histological observations on H&E stained tissues were performed, using an Olympus DP73 digital camera. Prostate lesions were histologically classified according to the criteria of the Consortium Prostate Pathology Committee [34] and scored as follows: 0 = no lesion observed; 1 = focal or multifocal LGPIN (low-grade prostatic intraepithelial neoplasia); 2 = focal or multifocal HGPIN (high-grade prostatic intraepithelial neoplasia); 3 = focal carcinoma (less than 50% of tissue); 4 = invasive carcinoma (more than 50% of tissue). Ki67 (Ventana, ref. 790-4286, ready-to-use nuclear staining) and F4/80 (BioRad-MCA497) staining were performed in automated immunostainers (BenchMark Ultra, Ventana Medical Systems, Tucson, AZ, USA), following routine methods. Tris-EDTA was used for antigen retrieval. The analysis was performed by using a Nikon Eclipse 80i microscope (Tokyo, Japan).

2.3. Cell Culture

Human prostate carcinoma cell lines PC3, DU145 and LnCaP were purchased from Leibniz-Institut DSMZ-Deutsche Sammlung von Mikroorganismen und Zellkulturen GmbH, who provided the authentication certificate. Human prostate cell lines PWR1E, RWPE1 and BPH1 and human prostate carcinoma cell lines 22RV1 and VCaP were purchased from American Type Culture Collection (ATCC). HEK293FT were purchased from Thermo Fisher and used for lentiviral production and lipofectamine-based transient transfection. C4-2 was generously provided by the laboratory of Dr. Pier Paolo Pandolfi. Cell lines were periodically subjected to microsatellite-based identity validation. None of the cell lines used in this study was found in the database of commonly misidentified cell lines maintained by the International Cell Line Authentication Committee and NCBI Biosample. All cell lines were routinely monitored for mycoplasma contamination. DU145, PC3, VCaP and HEK293FT cell lines were maintained in DMEM (Gibco Cat# 41966-029) media supplemented with 10% Fetal Bovine Serum (FBS; Gibco) and 1% penicillin–streptomycin (Gibco; 10,000 U/mL). LNCaP, C4-2 and 22RV1 cell lines were maintained in RPMI media (Gibco Cat# 61870-010; with GlutaMAX supplement) supplemented with 10% FBS and 1% penicillin–streptomycin. PWR1E, RWPE1 and BPH1 cell lines were maintained in Keratinocyte Serum Free Medium (K-SFM; Gibco) supplemented with 0.05 mg/mL Bovine Pituitary Extract (BPE; Gibco) and 5 ng/mL epidermal growth factor (EGF; Gibco).

2.4. Generation of Stable Cell Lines

TRIB1-HA and TRIB1 were cloned into TRIPZTM vector as previously reported [30].
Lentiviral vector expressing a validated shRNA against human cMYC (TRCN0000039642) or TRIB1 (TRCN0000381401) from the Mission shRNA Library was subcloned in a Tet-pLKO inducible system (Addgene plasmid # 21915) kindly donated by Dr. Wiederschain [35]. Cells were transfected with lentiviral vectors, following standard procedures [30,36], and viral supernatant was used to infect cells. Selection was done by using puromycin (2 µg/mL) or blasticidin (10 µg/mL), as required.

2.5. Cellular Assays

Two-dimensional cell growth, anchorage-independent growth and invasive growth were performed as previously reported [30,36]. For colony-formation assay, 500 cells/well were seeded in a 6-well plate. The cells were allowed to grow and form foci for up to 14 days. After this period, cells were washed and fixed with formalin, and further stained with crystal violet [30]. The plates were scanned for counting the number of colonies with Image J. Then, 1 mL of acetic acid was added to each well and allowed the crystal violet to dissolve. Afterward, 75 µL of the solution was transferred to 96-well plates, and absorbance was measured at 590 nm.

2.6. Real-Time Quantitative PCR

RNA was extracted using NucleoSpin® RNA isolation kit (Macherey-Nagel; ref: 740955.240C). For murine tissues a Trizol-based implementation of the NucleoSpin® RNA isolation kit protocol was used, as referenced [37]. For all cases, 1 μg of total RNA was used for cDNA synthesis, using MaximaTM H Minus cDNA Synthesis Master Mix (ThermoFisher, M1682). Quantitative Real-Time PCR (RT-qPCR) was performed as previously described [30,38]. Universal Probe Library (Roche) primers and probes employed (Roche; Thermo Fisher) are detailed in Table S1. All RT-qPCR data presented were normalized by using GAPDH/Gapdh (Applied Biosystems; Hs02758991_g1, Mm99999915_g1) and/or ß-ACTIN/ß-Actin (Hs99999903-m1, Mm00607939_s1). The majority of assays was performed by using 2 independent housekeeping genes with consistent results, but data with one normalizer are shown for simplicity.

2.7. Western Blot

Western blot was performed as previously described [36]. Briefly, cells were lysed in RIPA buffer (50mM TrisHCl pH 7.5, 150 mM NaCl, 1mM EDTA, 0.1% SDS, 1% Nonidet P40, 1% sodium deoxycholate, 1 mM Sodium Fluoride, 1 mM sodium orthovanadate, 1 mM β-glycerophosphate and protease inhibitor cocktail; Roche). Antibodies used are described in Table S2. Mouse and rabbit secondary antibodies were purchased from Jackson ImmunoResearch. After standard SDS-PAGE and Western blotting techniques, proteins were visualized, using the ECL (enhanced chemiluminescent) in iBright (Thermo Fisher).

2.8. Chromatin Immunoprecipitation

Chromatin immunoprecipitation (ChIP) was performed as previously reported [36], using the SimpleChIP Enzymatic Chromatin IP Kit (catalog no. 9003, Cell Signaling Technology, Inc). Briefly, 4 million PC3 cells per immunoprecipitation were grown in 150 mm dishes. Cells were cross-linked with 37% formaldehyde, for 10 min, at room temperature. Glycine was added to dishes, and cells were incubated for 5 min, at room temperature. Cells were then washed twice with ice-cold PBS and scraped into PBS and 200X Protease Inhibitor Cocktail (PIC). Pelleted cells were lysed, and nuclei were harvested, following the manufacturer’s instructions. Nuclear lysates were digested with micrococcal nuclease for 20 min, at 37 °C, and then sonicated in 500 mL aliquots, on ice, for six pulses of 20 s, using a Branson sonicator. Cells were held on ice for at least 20 s between sonications. Lysates were clarified at 11.000 g for 10 min, at 4 °C, and chromatin was stored at 80 °C. Anti-c-MYC antibody (Cell Signaling Technology #5605) and IgG antibody (Cell Signaling Technology #2729) were incubated overnight (4 °C) with rotation, and protein G magnetic beads were incubated for 2 h (4 °C). Washes and elution of chromatin were performed while following manufacturer’s instructions. DNA quantification was carried out, using a Viia7 Real-Time PCR System (Applied Biosystems) with SYBR Green reagents and primers that amplify a c-MYC binding region on TRIB1 promoter (Primer information in Table S3).

2.9. Dual Luciferase Reporter Assay

TRIB1 promoter region containing two cMYC binding sites (chr8:126441287-126441960 and chr.8:126442208-126442754) was cloned into pGL3-Firefly vector. pWZL-cMYC was a gift from William Hahn (Addgene plasmid # 10674) [39] and was used for overexpression of cMYC. Then, 15.000 HEK293FT cells were transiently transfected, using Lipofectamin® 2000 (ThermoFisher) according to manufacturers’ indications with pGL3-TRIB1 promoter-Firefly (0.07 μg), empty or pWZL-cMYC (0.02 μg) and Renilla-expressing vector (5 μg) in a 96-well plate. After 24 h, the luciferase activity of both Firefly and Renilla was measured by a luminometer, using a dual luciferase assay reagent (Promega), and the ratio of Firefly to Renilla was calculated. Total cellular extracts were analyzed by Western blot, to confirm cMYC overexpression.

2.10. Bioinformatics Analysis

The analysis of integration of copy number aberrations and gene expression in PCa TCGA (PRAD) was performed as follows. TCGA-PRAD cohort RNAseq counts were downloaded from Genomic Data Commons (GDC) server, using TCGAbiolinks R package, and further processed: Outlier samples were removed, low-expressed genes were filtered out and data were normalized (EDASeq-powered function). Finally, a differential expression analysis (DEA) was performed between tumor and normal samples, and cMYC amplicon differentially expressed genes (DEGs) were retrieved (|Log2(FC)| > 0.58 and FDR-value <0.05). GISTIC2.0 thresholded-by-gene data were downloaded from Broad’s Institute Firehose database latest run, using RTCGAToolbox R package. Then, we calculated differentially expressed genes between copy-number-altered (deep amplified/deleted) vs. diploid tumor samples for every gene contained in cMYC amplicon (|Log2(FC)| > 0.58 and FDR-value < 0.05).
The patient gene expression dataset analysis was performed, using CANCERTOOL [40]. In the microarray data, where gene expression was represented by various individual probes, the average of their signals was calculated and represented. Pearson correlation test was applied to analyze the correlation between paired genes. The p-value in these analyses indicates the significance of Pearson’s r coefficient. For the DFS analysis, patients were separated into the four different quartiles regarding its gene expression levels. In the case of signatures, the average of their gene expression levels was calculated. Kaplan–Meier Estimator [41] was used to estimate the survival curves of the different groups, while a Log-Rank test [42] was used to provide the p-value. Patient copy number information was obtained from cBioPortal [43,44] and TCGA Copy Number Portal (http://portals.broadinstitute.org/tcga/home). GISTIC analysis was performed on TCGA copy number data from version 3.0 of the SNP pipeline, on 20-Feb-2014, where 28 cancer types and 8663 tumor samples were analyzed by employing the stddata__2014_02_15 TCGA/GDAC tumor sample sets from FireHose (Table S4). Visualization of the genomic position of genes in the cMYC locus (chr8:119897767-129710968) and their copy number status in the TCGA downloaded from cBioPortal was performed using gviz package [45]. ENCODE 3 data were analyzed via the UCSC genome browser (https://genome.ucsc.edu). Specifically, we explored the table “wgEncodeRegTfbsClusteredV3” containing ChIP-seq clusters, representing combined signals for 130 cell types. DNA binding motifs were obtained from ENCODE Factorbook repository.

2.11. Statistics Analysis and Reproducibility

No statistical method was used to predetermine sample size. The experiments were not randomized. The investigators were not blinded to allocation during experiments and outcome assessment. Unless otherwise stated, data analyzed by parametric tests are represented by the mean ± SEM of pooled experiments and median ± interquartile range for experiments analyzed by non-parametric tests. The n-values represent the number of independent experiments performed, the number of individual mice or patient specimens. For each independent in vitro experiment, at least three technical replicates were used, and a minimum number of three experiments were performed, to ensure adequate statistical power (the number of biological replicates is indicated in the figure legends). In the in vitro experiments, normal distribution was assumed, and one-sample t-test was applied for one-component comparisons with control and Student’s t-test for two-component comparisons. Student’s t-test was used to compare data with normal distribution, and non-parametric Mann–Whitney exact test was used for samples not following a normal distribution. The confidence level used for all the statistical analyzes was of 95% (alpha value = 0.05). Two-tailed statistical analysis was applied for experimental design without predicted results, and one-tail for validation or hypothesis-driven experiments. GraphPad Prism 8.0.2 software and R version 3.6.0 were used for statistical calculations.

3. Results

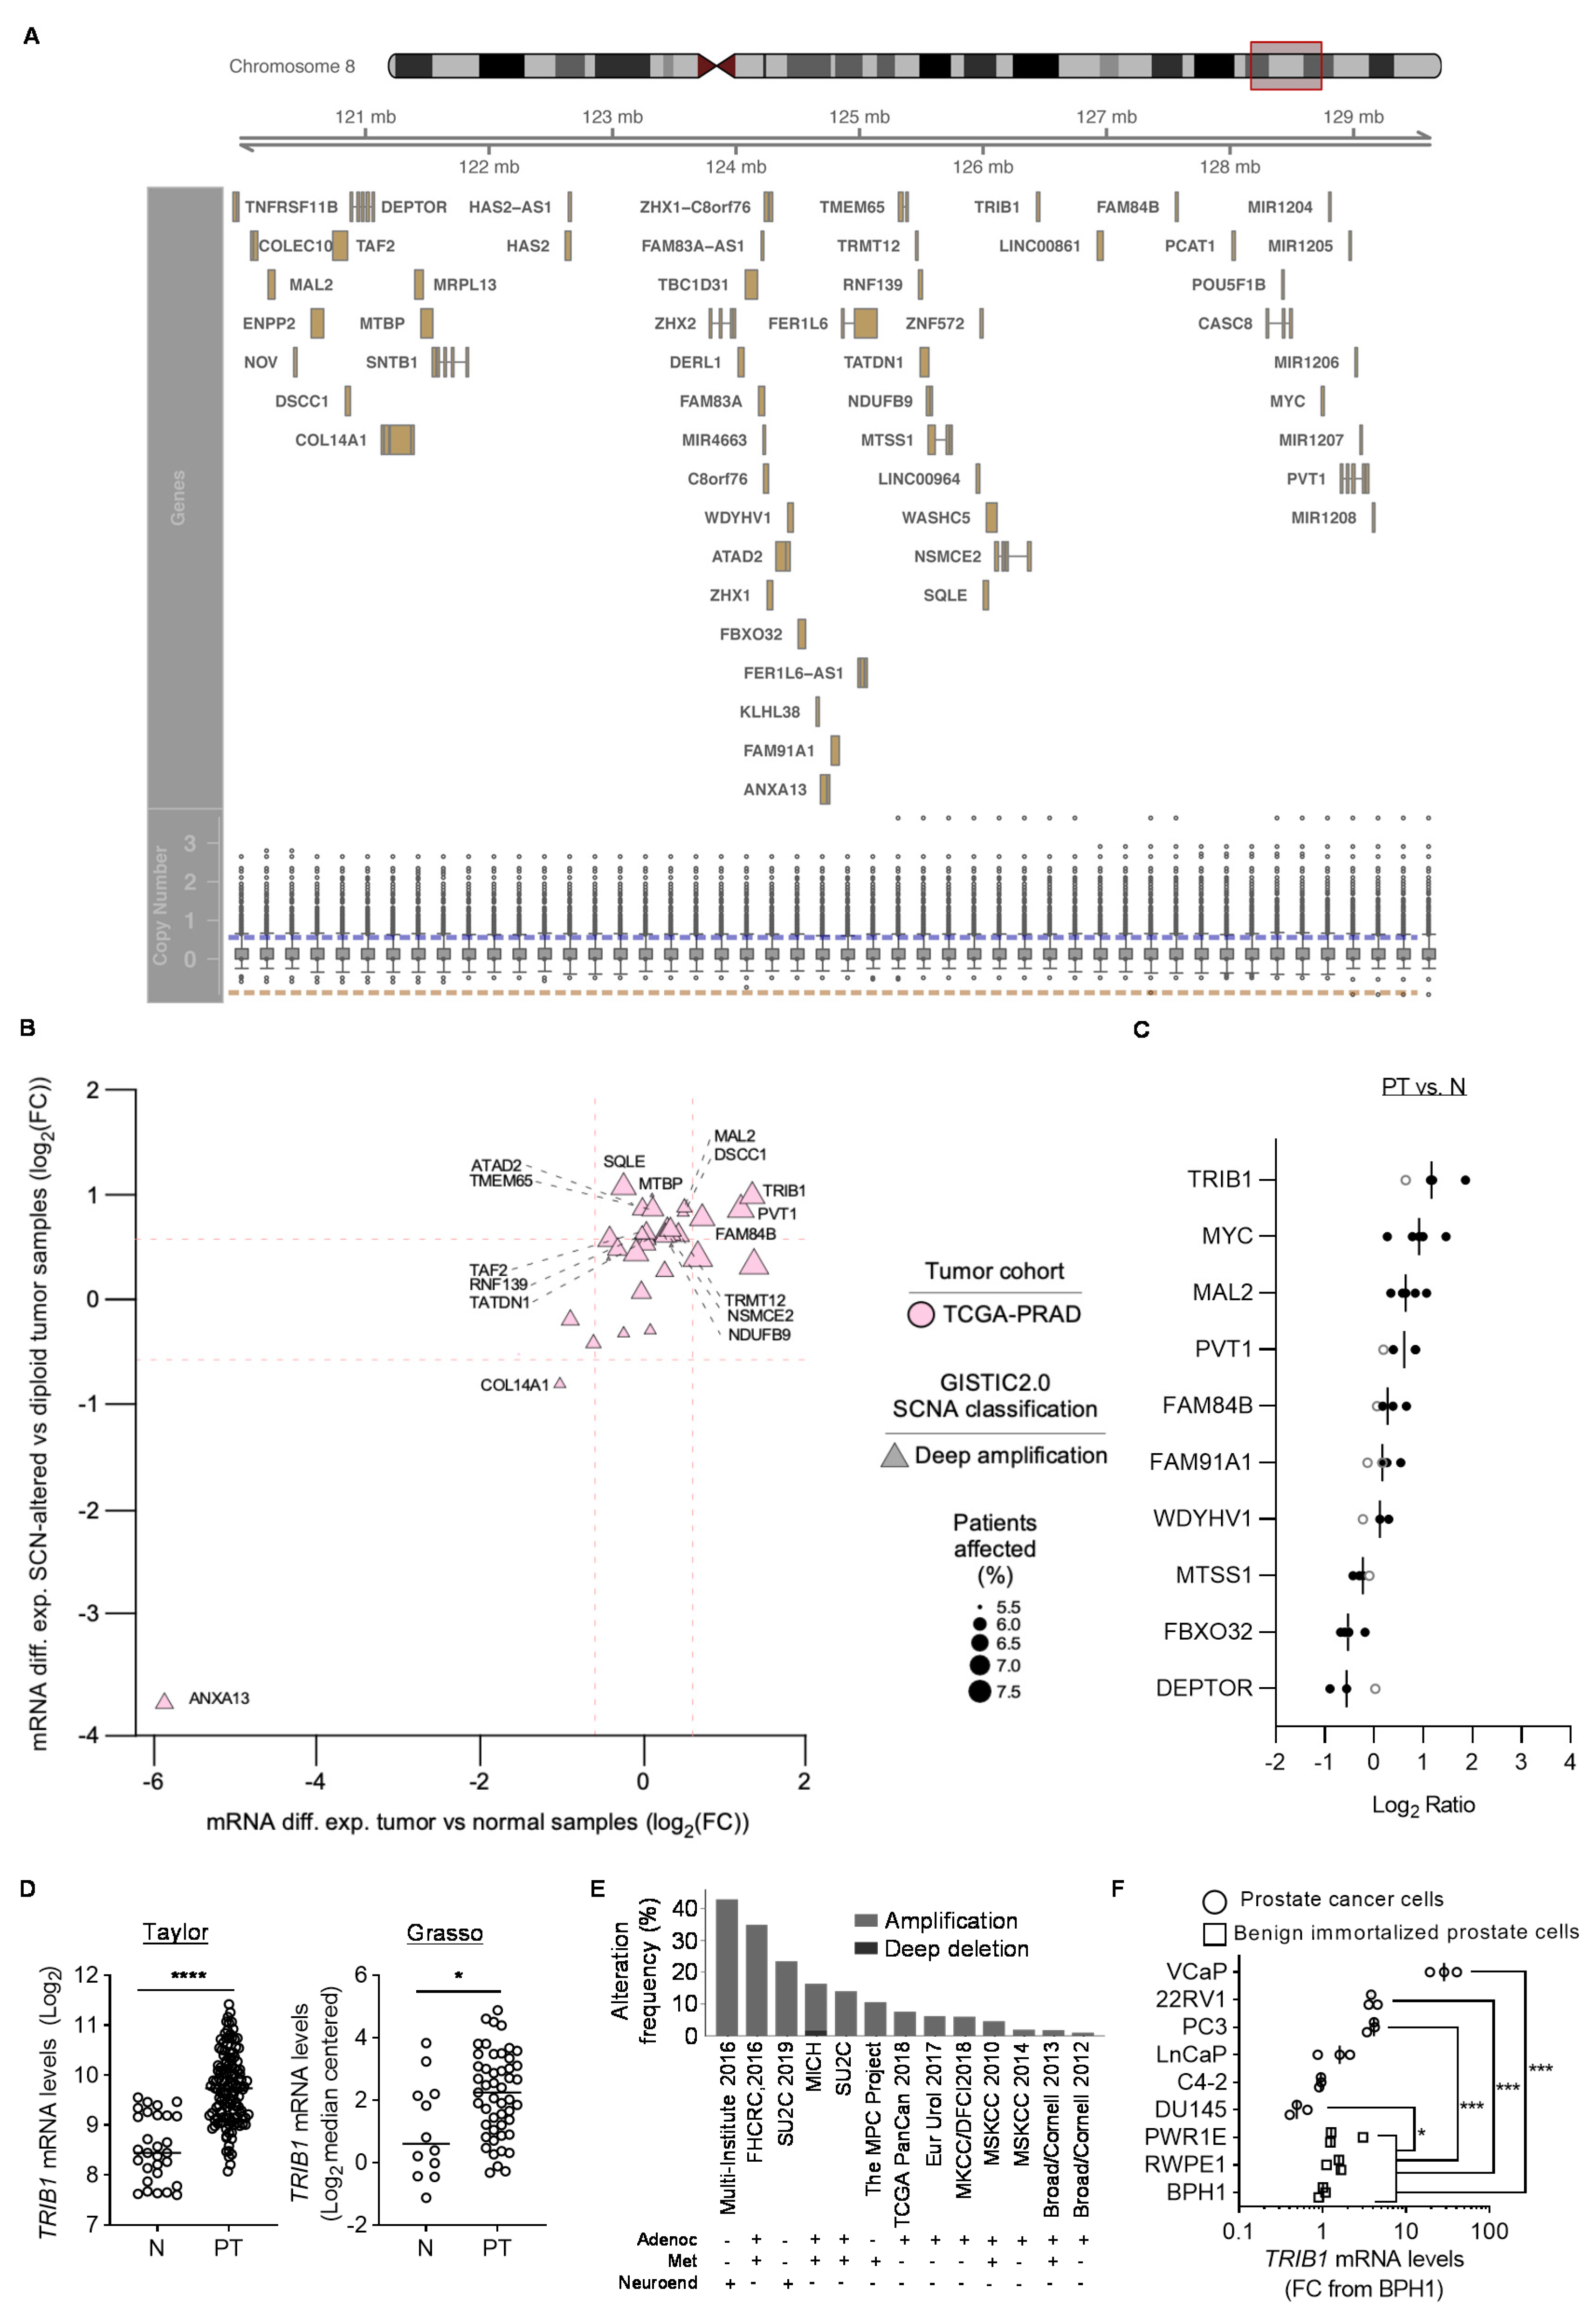
3.1. Identification of PCa-Relevant Candidate Genes in cMYC Amplicon

We aimed at studying the genes contained in cMYC amplicon in PCa. To this end, we took advantage of the TCGA copy number portal, which allows the analysis of copy number alterations in 28 cancer types and 8663 tumor samples through a simplified interface (http://portals.broadinstitute.org/tcga/home). Using this resource, we established that cMYC amplicon encompasses a genomic region containing 60 genes in PCa (Figure 1A and Table S5). We next studied whether amplification of these genes was associated with increased expression in prostate tumors. Two this end, we performed two complementary analyses. On one hand, we integrated genomic amplification and gene expression data from TCGA (PCa, PRAD, Figure 1B). From the genes contained in cMYC amplicon, only 15 exhibited a significant upregulation concomitant to the amplification, whereas ANXA13 and COL14A1 exhibited unexpected repression (Figure 1B). On the other hand, we ascertained the expression levels in localized PCa compared to normal prostate specimens in five different patient datasets [40,46,47,48,49,50]. We established two stringent criteria to identify PCa-relevant genes: (i) data available in at least three PCa datasets and (ii) consistent directional alteration in gene expression (significant in more than 50% of available PCa datasets). This analysis led to a shortlist of 10 genes (Figure 1C). Seven of these genes exhibited a consistent upregulation in PCa (including cMYC), whereas three exhibited a downregulation. From the seven genes overexpressed, four, apart from cMYC, were also shortlisted in the TCGA strategy (Figure 1B, TRIB1, MAL2, PVT1 and FAM84B). This list contained genes previously associated with co-amplification with cMYC in cancer, such as PVT1 or FAM84B [7,10,11,13,51], thus validating our strategy. Interestingly, we found that the pseudokinase TRIB1 exhibited the highest overexpression among the selected genes, which encouraged us to study it further. The detailed gene expression analysis of TRIB1 in the PCa datasets (localized PCa vs. normal tissue) is presented in Figure 1D and Figure S1A. Of interest, the upregulation of TRIB1 mRNA levels in prostate cancerous tissue is in line with the observations made by other groups at the protein level [27,28]. Next, we analyzed the frequency of amplification of TRIB1 in PCa. A comprehensive analysis of copy number aberrations, using cBioPortal [43,44], confirmed the increased copy number of this gene in PCa (Figure 1E), similar to what is observed in cMYC (Figure S1B). Of note, within this set of studies (2844 specimens, including primary tumor and metastases), 373 cases exhibited amplification in cMYC and/or TRIB1, and 85.5% of those presented co-occurrence in both genes (Fisher F, p < 0.001). Amplification of TRIB1 was also detected in PCa cell lines, using the information contained in the Cancer Cell Line Encyclopedia, available in DepMap [52] (https://depmap.org/portal/, Figure S1C), and its consequence on gene expression in PCa cell lines was analyzed by real-time quantitative PCR (RT-qPCR). Of note, 50% of the PCa cell lines evaluated exhibited a significant upregulation of the pseudokinase compared to benign cell lines (Figure 1F). We further corroborated that TRIB1 amplification is frequent in other tumor types, as illustrated by the analysis of TCGA datasets (Figure S1D). We extended this analysis to breast cancer, where we could detect a frequency of amplification in cMYC and TRIB1 greater than 15% in two independent datasets (TCGA and METABRIC, Figure S1E) [53,54]. Similar to the scenario in PCa, from this set of 2899 specimens profiled for copy number aberrations, 741 exhibited amplification in cMYC and/or TRIB1, and 88.1% exhibited co-occurrence (Fisher F, p < 0.0001). The overexpression of this gene in PCa was among the highest in all tumor types studied in TCGA, which reinforced the notion that this pseudokinase might be relevant for the biology of this tumor type (Figure S1F).
To ascertain the pathological context where TRIB1 would be upregulated, we analyzed additional publicly available PCa datasets. Firstly, we evaluated the gene expression of TRIB1 and cMYC in different pathological scenarios. To this end, we took advantage of a study that included benign prostate epithelial tissue from patients without PCa, together with PCa epithelial tissue and its adjacent normal and prostate intraepithelial neoplasia (PIN) lesions [55] (Figure S2A). The results confirmed the upregulation of both TRIB1 and cMYC in PCa epithelial tissue, compared to normal-adjacent epithelium and epithelium from normal specimens. Interestingly, the mRNA upregulation observed in PCa was recapitulated in PIN lesions (Figure S2A). Secondly, we studied the alterations in TRIB1 and cMYC in localized PCa vs. metastatic lesions. These two genes exhibited greater amplification in metastasis, compared to localized tumors (Figure S2B) [56]. However, this event was not translated to elevated mRNA abundance in metastasis, compared to primary PCa (Figure S2C,D) [46,47,48], suggesting that other levels of regulation at the epigenetic level might exist. Lastly, we studied whether the expression of TRIB1, cMYC or their combination could inform abut disease progression after prostatectomy. Neither mRNA expression of cMYC or TRIB1 nor their combination exhibited prognostic potential in biochemical recurrence (Figure S3).

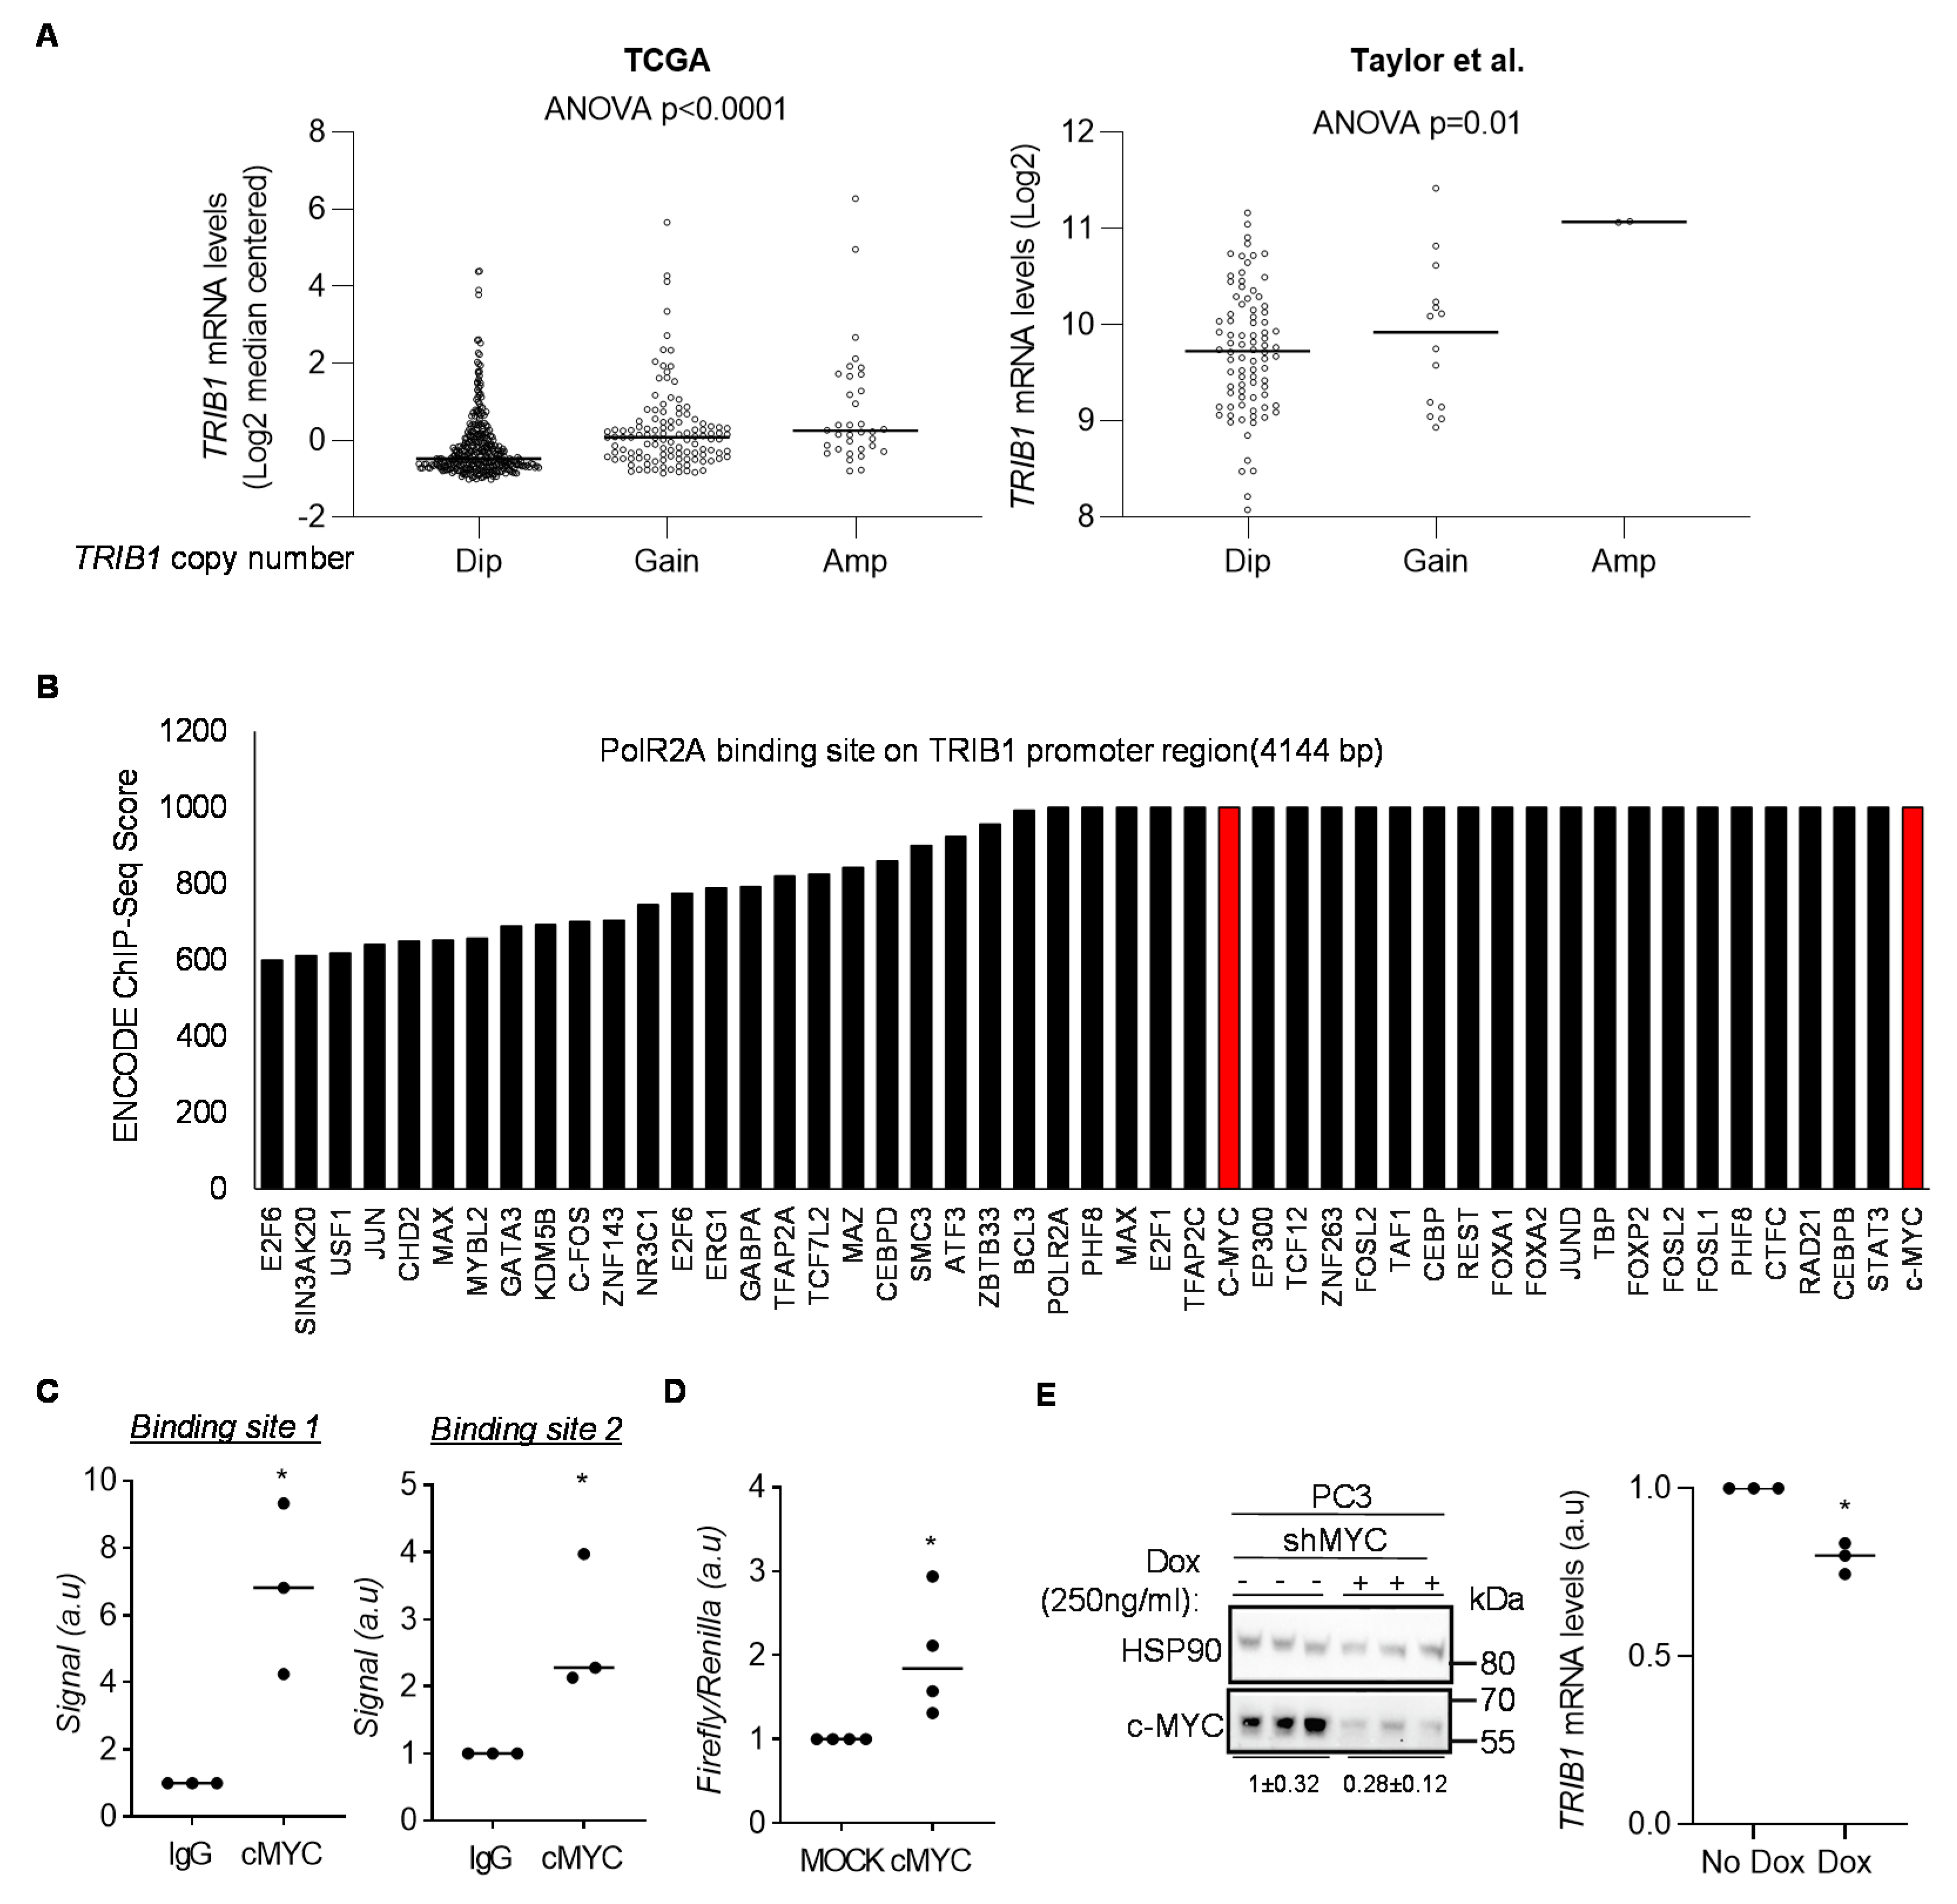
3.2. cMYC Regulates the Expression of TRIB1 in PCa

When analyzing the association between TRIB1 copy number and mRNA abundance in patient datasets, we interestingly observed that tumors with diploid TRIB1 exhibited mRNA expression levels as high as biopsies categorized as TRIB1 amplified cases (Figure 2A). This observation led us to hypothesize that additional mechanisms of TRIB1 upregulation beyond the amplification could exist in PCa. We thus focused on the transcriptional regulation of this pseudokinase. To this end, we interrogated the promoter region of TRIB1 in ENCODE3. We extracted PolR2A peaks located upstream (<1 kb) the transcriptional start site (TSS) of different TRIB1 transcripts. We subsequently ascertained the transcription factors that were associated with a high binding score (>600). Interestingly, we observed that cMYC was present in two different regions of the TRIB1 promoter with the highest score (1000/1000), whereas two additional potential binding sites exhibited lower scores and were not considered for further analyses (Figure 2B and Figure S4A). The two binding sites with high scores presented canonical and non-canonical E-boxes, suggestive of bona fide cMYC-regulated regions (Figure S4B). To confirm these results in PCa, we performed chromatin immunoprecipitation (ChIP) in PC3 cells with anti-cMYC antibody, coupled to RT-qPCR-based quantification of the selected binding regions within the immunoprecipitate. As predicted, cMYC significantly bound to regions within the identified binding sites (Figure 2C, Table S3). To validate the functional regulation of TRIB1 expression by cMYC, we performed two complementary experiments. On the one hand, we carried out dual luciferase reporter assays using the promoter region of TRIB1 that contained cMYC binding sites. Co-transfection of cMYC with Firefly-luciferase reporter system fused to TRIB1 promoter in HEK293T cells resulted in significant increase in luciferase luminescence (Figure 2D, Figure S4C). On the other hand, cMYC silencing with a previously validated doxycycline-inducible shRNA system [36,57] resulted in a significant decrease in TRIB1 mRNA abundance in PC3 cells (Figure 2E). A similar effect was found in the breast cancer cell line MDAMB231 (a cell line which does not exhibit copy number alterations in TRIB1 according to the Cell Line Encyclopedia [58]), thus suggesting that this might be a general mechanism of regulation (Figure S4D). Altogether, our results demonstrate that cMYC is an unprecedented transcriptional regulator of TRIB1 in PCa, thus providing a more comprehensive molecular perspective of the mechanisms underlying the overexpression of this pseudokinase in this disease.

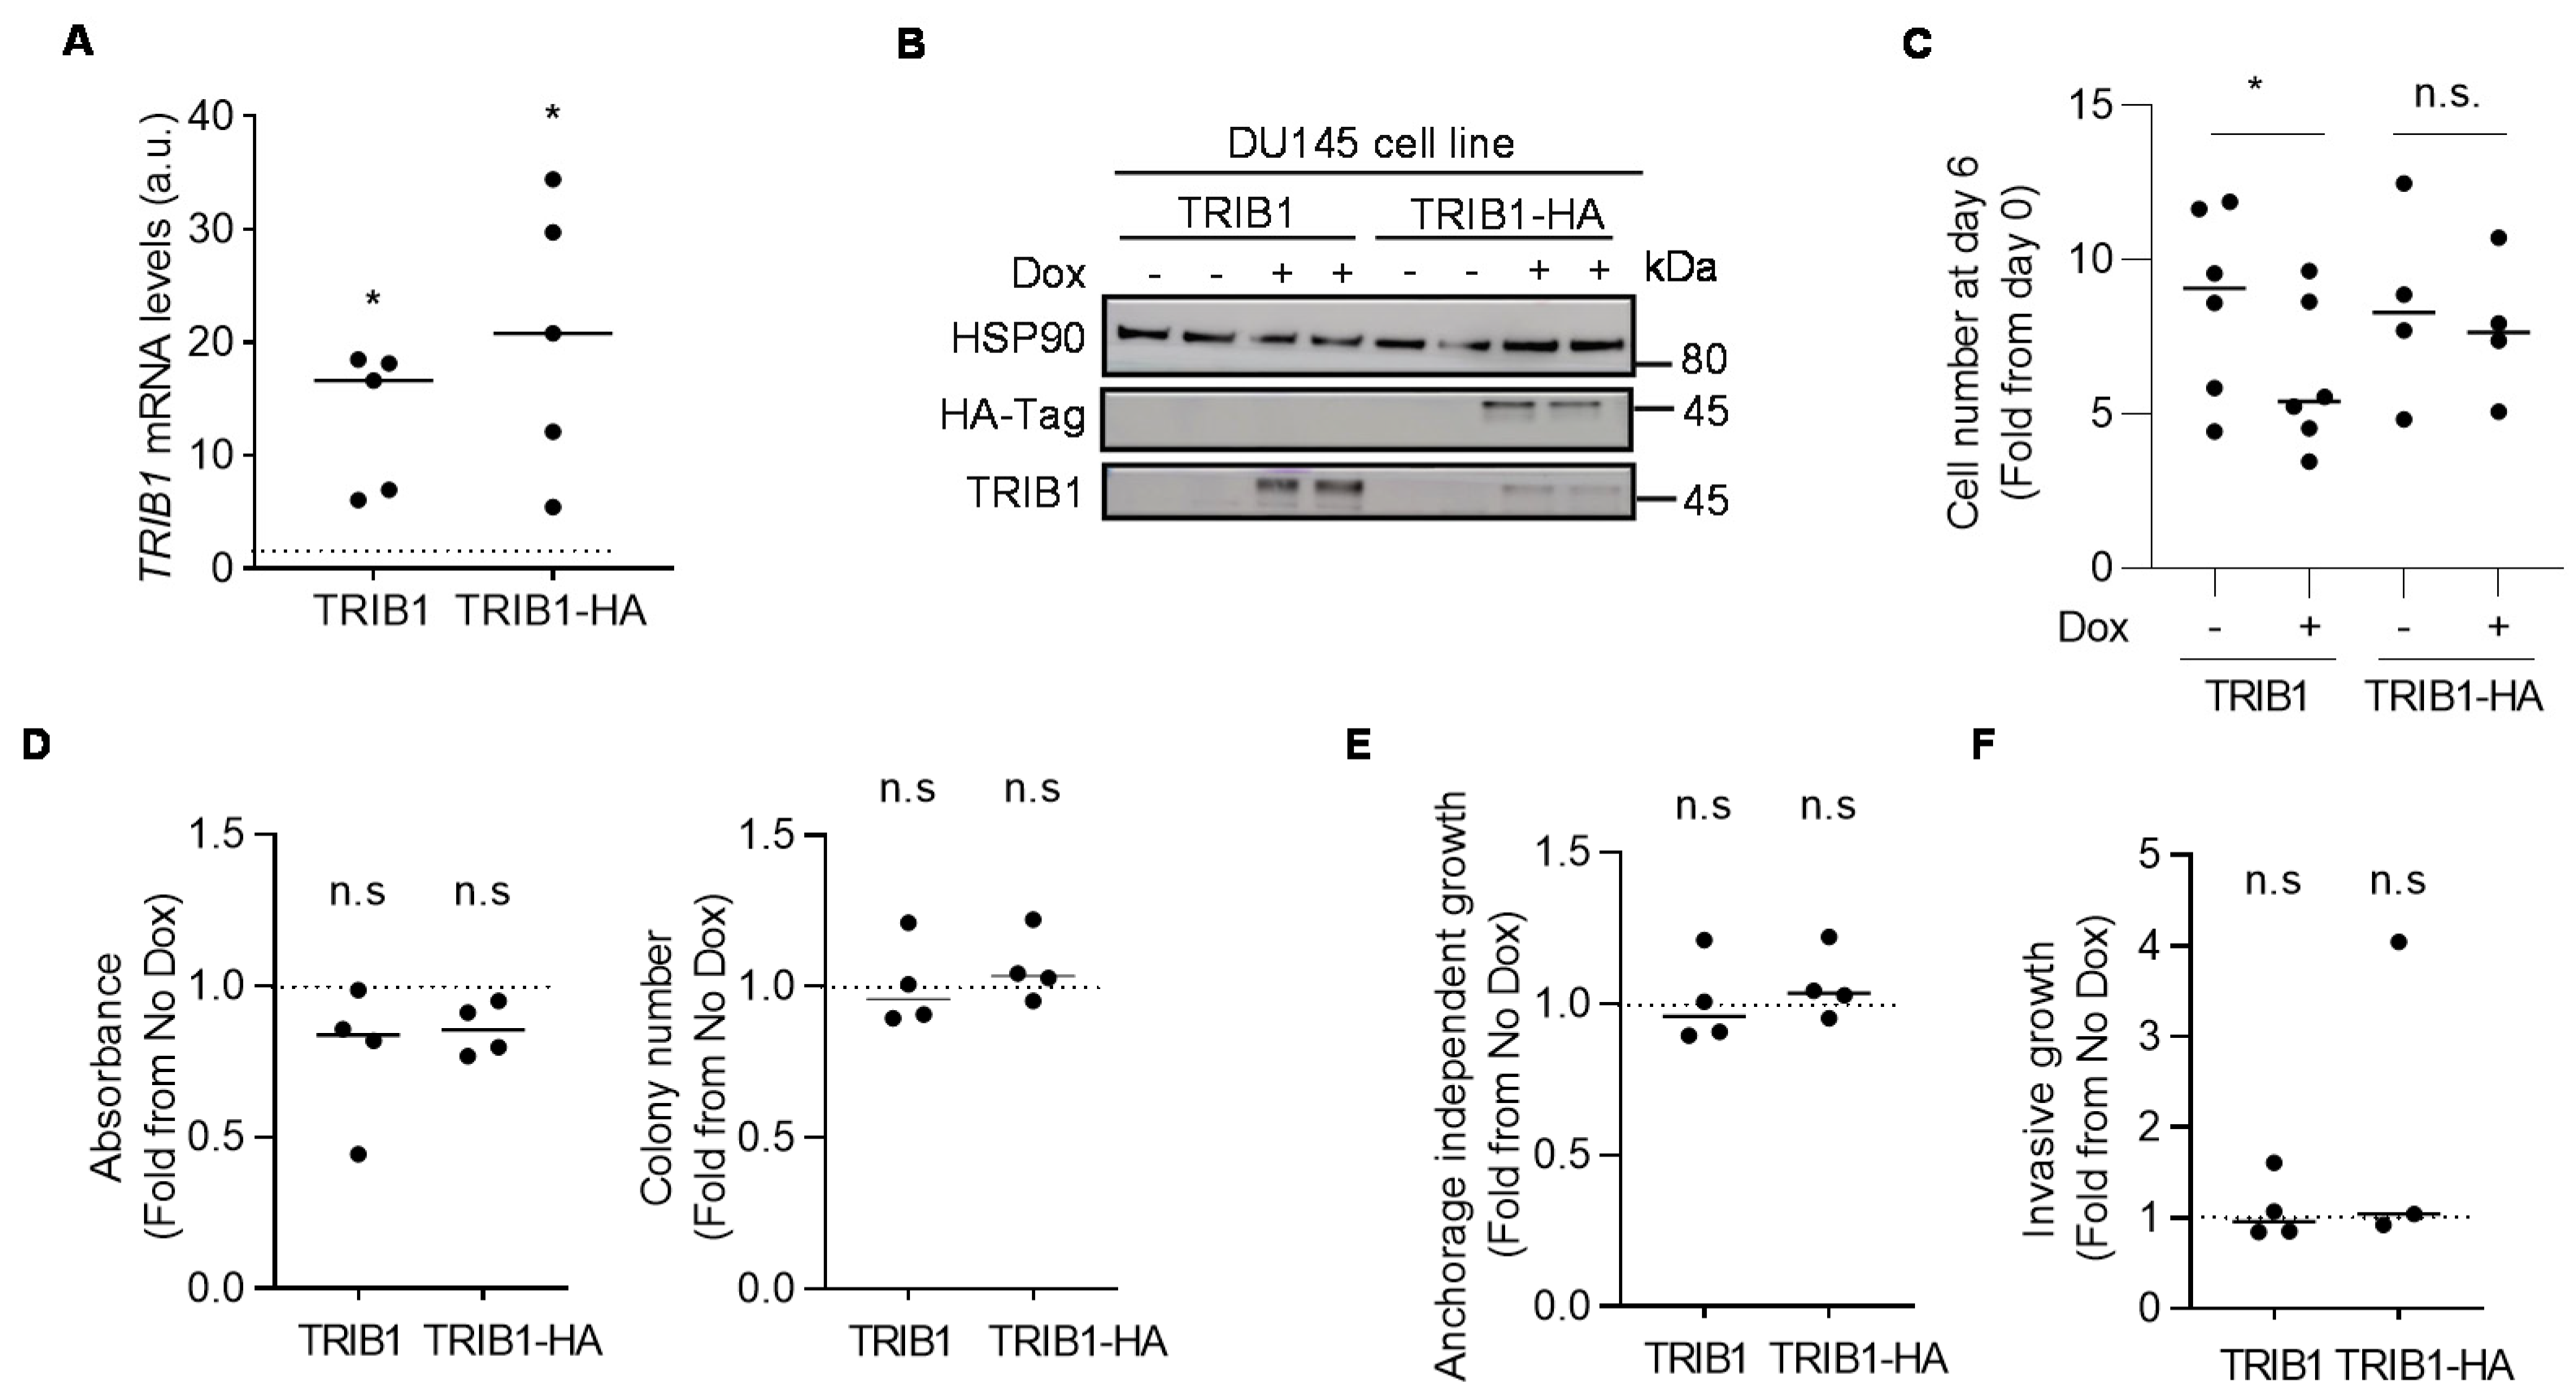
3.3. TRIB1 does not Exhibit Cell-Autonomous Tumor-Promoting Activity in PCa Cell Lines

In order to ascertain the function of TRIB1 in PCa, we undertook an in vitro approach. Based on the gene expression analysis in cell lines (Figure 1F), we chose a low TRIB1-expressing cell line for the overexpression (Figure 3A,B) and a high-expressing cell line for the silencing (Figure S5) of the pseudokinase, respectively. Inducible TRIB1 expression (C-terminal HA-tagged or untagged) in DU145 cells did not alter consistently cell proliferation (Figure 3C). The expression of untagged TRIB1 significantly reduced cell number, whereas the C-terminal tag form of the pseudokinase did not exert any effect. Neither of the constructs altered colony formation (Figure 3D), anchorage-independent growth (Figure 3E) or invasive growth in three-dimensional systems (Figure 3F). Additionally, inducible TRIB1 silencing in PC3 cells was inconsequential for the aforementioned parameters (Figure S5A–E). These results argue against a cancer-cell-autonomous prominent function of TRIB1 in PCa. To acquire further insight about the tumor-promoting function of TRIB1 in cellular system, we took advantage of our low TRIB1-expressing DU145 cells in which we could activate the expression of ectopic TRIB1 through the use of doxycycline. We injected these cells in the flank of immunocompromised nude mice and activated the expression of the pseudokinase four days after implantation. In line with our in vitro results, ectopic TRIB1 expression did not elicit a significant effect on tumor growth (Figure S5F–H). The results in this cell line are consistent with a recent report [27], and suggest that TRIB1 expression in PCa cells is inconsequential for tumor biology in the cell lines and conditions employed. It is worth noting that the lack of a fully functional stroma in immunocompromised mice, or the total lack of such a compartment in vitro could be important factors influencing the results.

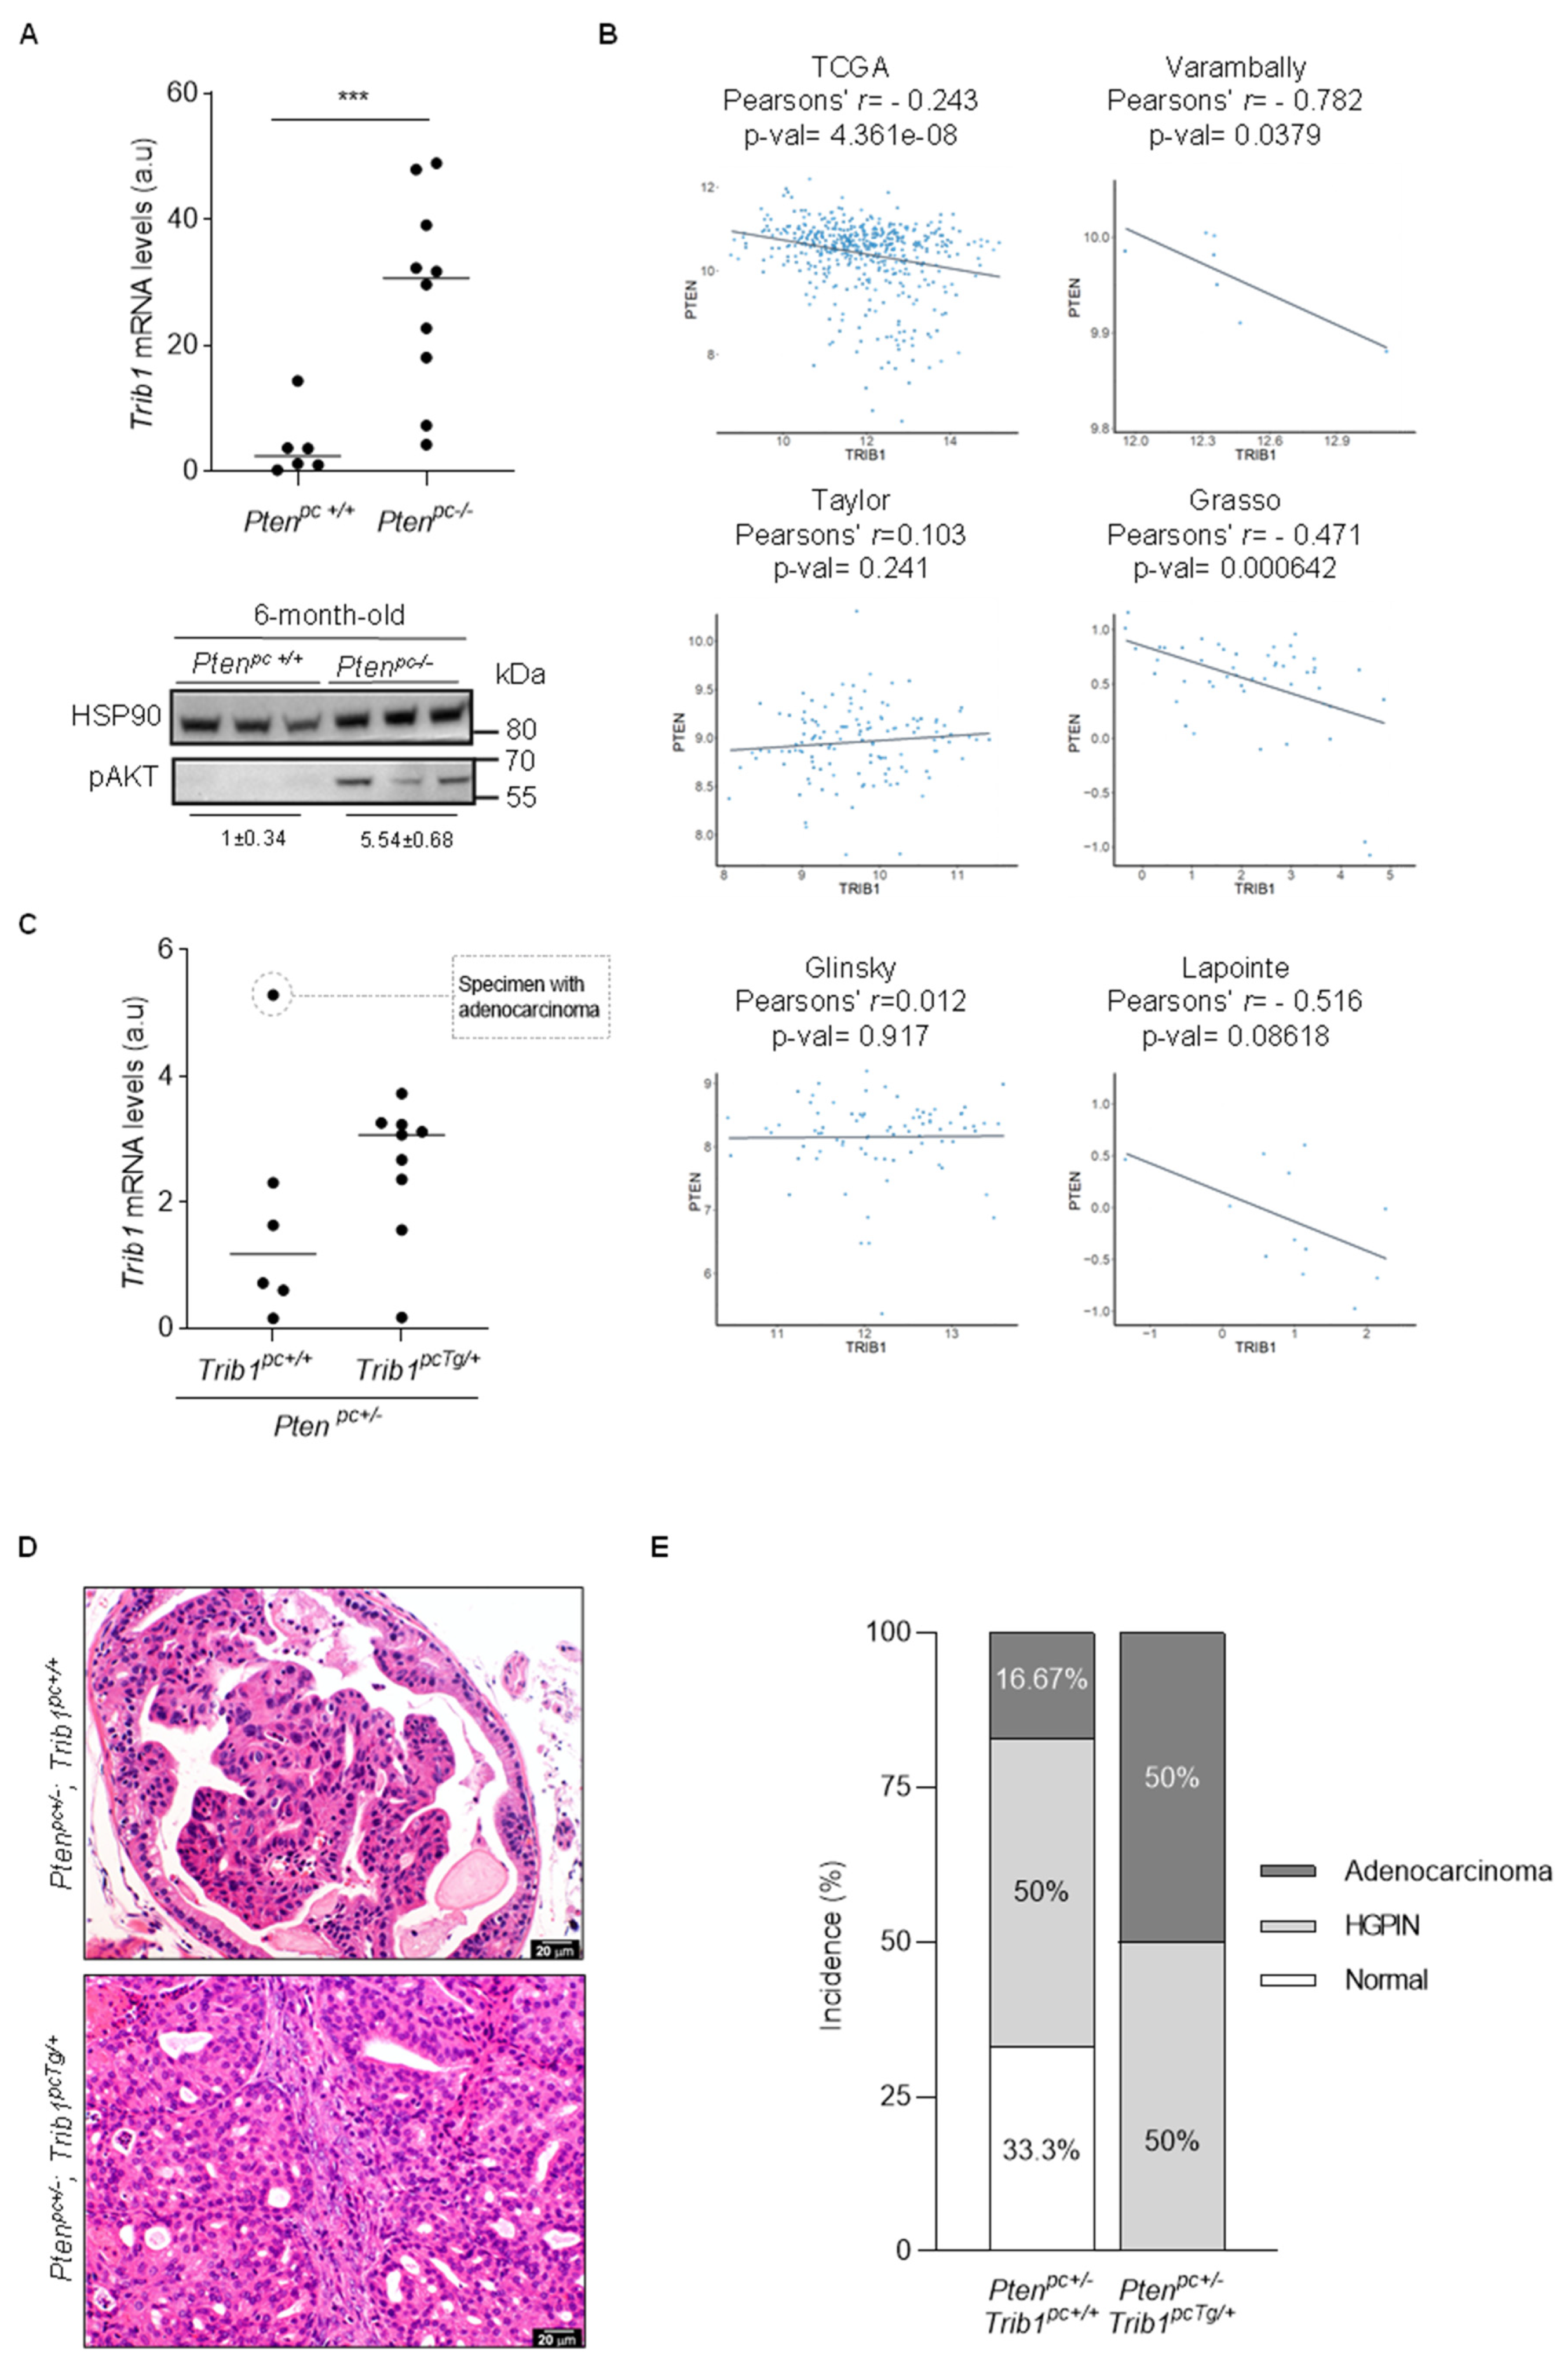
3.4. Trib1 Overexpression Cooperates with Pten Heterozygosity to Promote PCa Pathogenesis

The biological insights on TRIB1 tumor-promoting activities are scarce. We sought to evaluate the impact of Trib1 expression on prostate tumorigenesis by using well-characterized murine models. Deletion of the tumor suppressor Pten in the prostate epithelium results in PCa, whereas heterozygous loss is associated to the development of prostate intraepithelial neoplasia (PIN) [30,59,60]. We thus interrogated the expression of the pseudokinase in the prostate of mice with PCa (Ptenpc−/−) vs. wild type counterparts (Ptenpc+/+). Interestingly, mice with PCa exhibited elevated prostate Trib1 gene expression (Figure 4A). The PTEN-PI3K pathway regulates the abundance of cMYC through diverse mechanisms [61,62,63,64,65]. Indeed, prostate-specific Pten-deficient mice exhibited elevated cMyc protein expression (Figure S6A). As complementary evidence for the negative impact of PTEN on the mRNA expression of TRIB1, we interrogated the aforementioned human PCa datasets. In line with our observations in the murine model, PTEN expression negatively correlated with TRIB1 mRNA abundance in various patient cohorts (Figure 4B).
We have previously reported the generation of a Cre-dependent Trib1 transgenic mouse model (Rosa26-LSL-Trib1; termed Trib1Tg) [33]. We took advantage of this experimental model in order to ascertain the contribution of the pseudokinase to PCa pathogenesis. To this end, we bred Trib1Tg/+ females with PtenLox/+, Probasin (Pb)-Cre males (Figure S6B). We bred the resulting mice for at least three generations, to build a founder colony. From this cohort, we derived prostate-specific Pten heterozygous mice in which Trib1 expression was elevated through the expression of the transgene (Figure 4C). Remarkably, aged prostate-specific Pten heterozygous mice (15–17 months old) expressing a transgenic copy of Trib1 exhibited signs of invasion in the prostate tissue (Figure 4D,E and Figure S6C,D). Detailed pathological analysis concluded that Trib1 transgene increased PCa incidence in Ptenpc+/− mice from 16.7% to 50%. These results provide a formal demonstration of the tumor-promoting activity of Trib1, using an unprecedented genetically engineered mouse model. The discrepancies between the genetic mouse model and the human cellular system (Figure 3 and Figure 5) could be due to the presence of a fully functional stroma in the former, or to intrinsic differences between human and murine PCa that could impact on the role and activity of TRIB1.
Based on the pathological alterations associated to transgenic Trib1 expression in the murine prostate, we evaluated biological alterations in vivo that would explain the phenotype. On the one hand, we measured epithelial cell proliferation in the two genotypes of interest, by means of Ki67 immunoreactive cell quantification (a clinically validated biomarker of cell proliferation [66]). As opposed to the in vitro phenotype, Trib1 transgenic expression resulted in a significant increase in epithelial cell proliferation (Figure 5A,B). Of note, due to the different incidences of adenocarcinoma in the two genotypes, we cannot rule out that the proliferative phenotype emerges as a consequence of cancer initiation. Despite Ki67 being a clinically relevant marker of proliferation, it would be interesting to explore cell-cycle alteration, in further detail, with other markers. On the other hand, TRIB1 influences the polarization and infiltration of macrophages [27]. We studied the composition of the prostate stroma in the two genotypes of interest. In line with this notion, quantification of F4/80-positive cell in formalin-fixed and paraffin-embedded prostate tissue revealed a significant increase in macrophage-specific staining upon Trib1 transgenic expression in our mouse model (Figure 5C,D). These results support the notion that TRIB1 is deregulated through genomic and transcriptional alterations in PCa and promotes cancer pathogenesis in vivo.

4. Discussion

The reprogramming of transcriptional networks is a key event in cancer, in general, and in PCa, in particular [67]. cMYC is among the most prominent genes, altering the transcriptional makeup of tumor cells [4]. This oncogene is altered in cancer through multiple means, including genomic, transcriptional and post-transcriptional mechanisms [4]. In turn, cMYC regulates cell growth, survival, invasion and metabolism [4,68]. The central role of this transcription factor in cancer has led to research efforts focused on the identification of pharmacological means to inhibit its function [69]. Therefore, elucidating molecular pathways that are perturbed as a result of exacerbated cMYC activity represents a major focus in cancer research.
Biological alterations in cancer often stem from copy number aberrations that encompass a large set of genes. As for cMYC, its upregulation is frequently due to amplification of chromosome 8q24 [5] This locus is defined as a gene desert containing several non-coding RNAs and regulatory DNA regions [10]. Moreover, genomic alterations in this locus (translocations, insertions and single nucleotide polymorphisms) frequently fail to impact on cMYC expression, thus suggesting that this locus harbors other cancer-relevant elements [10]. We sought to elucidate coding genes that could be relevant to the biology of PCa by integrating genomics, transcriptomics and bioinformatics analysis. Our study revealed that, out of all the genes encoded in this region, only a small subset exhibited a consistent upregulation in PCa that would be in accordance with their amplification. Importantly, we validated the overexpression of previously reported genes in this locus, including PVT and FAM84B [10,11,13,70,71]. Our results also shed light on chromosome 8q24 genes that, despite their amplification, are profoundly repressed in PCa, such as MTSS1. This observation is in line with the documented epigenetic repression of this gene through different molecular means [72,73].
Interestingly, the analysis of chromosome 8q24 in PCa revealed that TRIB1 is the most robustly upregulated gene, at a level comparable to cMYC. This gene belongs to a family of pseudokinases relevant for health and disease [22]. Aberrant expression of the three Tribbles family members has been associated to cancer pathogenesis and progression [22]. Genomic (amplification and microsatellite repeats) and epigenetic (microRNA-based regulation) alterations in the TRIB1 gene are linked to cancer [22,28,29,74]. In this study, we showed that the association between TRIB1 and cMYC spans beyond their co-localization to chromosome 8q24. We demonstrated that cMYC is an unprecedented transcriptional regulator of the pseudokinase, through at least two discreet genomic regions in TRIB1 promoter that contain canonical and non-canonical E-Boxes. These results suggest that amplification of 8q24 locus has a double impact on TRIB1 gene expression: (1) through the increase of its gene dosage and (2) through the upregulation of its upstream transcriptional activator cMYC. These data might explain the predominant overexpression of TRIB1 among 8q24 genes in our PCa analysis. Interestingly, other oncogenic insults relevant to PCa also affect TRIB1 gene expression. We found that deletion of Pten in the mouse prostate results in elevated mRNA abundance of the pseudokinase. Similarly, PTEN expression is inversely correlated with TRIB1 in human PCa datasets. These results can be explained by the reported regulation of cMYC downstream the PI3K pathway [61,62,63,64,65] and reveal an interesting convergence of PCa-relevant oncogenic signals in the control of TRIB1. It remains to be investigated the repercussion of TRIB1 transcriptional control by PTEN and cMYC in other pathophysiological conditions.
An increasing body of evidence suggests that TRIB1 controls cellular functions associated to cancer aggressiveness [22,27,28,75,76]. On one hand, the regulation of proteasome-mediated control of protein stability by TRIB1 is a field of growing interest. TRIB1 protein contains a C-terminal COPI interacting domain that targets TRIB1-interacting proteins for ubiquitination and proteasome-dependent degradation [22,24,26]. Recent reports suggest that TRIB1 utilizes the substrate-recognizing region in the pseudokinase domain, to bring proteins in close proximity to COPI E3 ligase and hence promote their ubiquitination [23,24,25]. On the other hand, TRIB1 regulates the activation of oncogenic signaling pathways, such as MAPK and PI3K-AKT [22,77]. We performed a wide array of biological assays in PCa cell lines, upon genetic perturbation of TRIB1 with tightly controlled molecular tools, and found that TRIB1 overexpression or downregulation in vitro is largely inconsequential to two-dimensional and three-dimensional growth and invasion. These results are in contrast to reports by other groups in this tumor type [28,29], thus suggesting that further research is needed to define the molecular determinants of cell-autonomous TRIB1 activity in cancer cells.
In vivo immune-competent mouse models are instrumental for the comprehensive study of cancer-relevant molecular events. These experimental systems recapitulate, to a greater extent, the biology of tumor cells in the context of a complete microenvironment, thus accounting for cell-autonomous and non-cell-autonomous regulation. Therefore, the development of genetically engineered mouse models is key to understand the molecular basis of cancer biology. Our group and others have contributed to the development and characterization of mouse models that are relevant for the study of PCa [30,31,60,78,79] or Trib1 function [33,80]. By taking advantage of a genetic setting of PCa susceptibility in mice (prostate-specific Pten heterozygosity) [59], we demonstrated that transgenic Trib1 expression elicits a substantial increase in the incidence of PCa, thus providing unprecedented evidence in genetically engineered mouse models, to support the causal contribution of this pseudokinase to prostate tumorigenesis. Strikingly, and in contrast to our in vitro observations, Trib1 overexpression in vivo significantly increased epithelial cell proliferation. These data, together with the alteration in the stroma composition in these mice (illustrated by the significant increase in tumor-infiltrating macrophages), suggest that a fraction of the tumor-promoting activity of TRIB1 might be associated to non-cell-autonomous effects, in line with recent reports [27].

5. Conclusions

We reported an unprecedented mode of regulation of TRIB1 downstream the oncogene cMYC, and we took advantage of genetically engineered PCa mouse models to provide experimental support for the role of the pseudokinase in the pathogenesis of this disease.

Supplementary Materials

The following are available online at https://www.mdpi.com/2072-6694/12/9/2593/s1, Figure S1: TRIB1 is amplified and overexpressed in cancers, Figure S2: Association of cMYC and TRIB1 genomic and transcriptional alterations to distinct prostate cancer pathological scenarios, Figure S3: Association of cMYC and TRIB1 mRNA levels with biochemical recurrence in prostate cancer, Figure S4: Transcriptional regulation of TRIB1 by cMYC, Figure S5: TRIB1 silencing in PC3 cells is inconsequential for tumor cell function, Figure S6: Prostate-specific TRIB1 transgenic expression in mice, Figure S7: Uncropped western blot figures, Table S1: qPCR and UPL probes used in this study, Table S2: Antibodes used in this study, Table S3: Primers employed in ChIP analysis, Table S4: Genes in peak in cMYC amplicon n different tumour types, Table S5: mRNA expression values for the indicated genes in cMYC amplicon (primary tumours vs. Normal prostate specimens).

Author Contributions

P.S. performed the majority of molecular, cellular and in vivo analysis and participated in experimental design and bioinformatics analyzes. I.A. provided support with generation of molecular biology reagents (lentiviral vectors) and cellular assays. A.R.C. and I.M. performed bioinformatic analysis and representations. V.T., A.M., A.E. and L.A. generated and analyzed the impact of cMYC silencing on TRIB1 expression. C.N., E.B. and E.K.-T. provided technical advice on luciferase assays. L.C. provided support with ChIP assay. R.C. and X.R.B. performed the integrated copy number aberration and gene expression analysis in prostate cancer TCGA (PRAD). G.V. provided support in cellular assays and supervised the work of P.S. during the execution of experiments at the Complutense University of Madrid (Spain). J.M.F. performed the histopathological study of the prostate samples. M.B. and M.L.M.-C. performed or supervised F4-80 staining and analysis in prostate tissue. A.Z.-L. co-supervised with A.C. the experimental design, execution and data analysis. A.C. conceived the study, supervised the execution of the project and wrote the manuscript. All authors have read and agreed to the published version of the manuscript.

Funding

This research and the APC was funded by the European Training Networks Project (H2020-MSCA-ITN-308 2016 721532).

Acknowledgments

We are grateful to the Carracedo lab for valuable input, to Ana M. Aransay and F. Elortza for technical advice. P.S. was funded by the European Training Networks Project (H2020-MSCA-ITN-308 2016 721532). V.T. is funded by Fundación Vasca de Innovación e Investigación Sanitarias, BIOEF (BIO15/CA/052), the AECC J.P. Bizkaia, the Basque Department of Health (2016111109) and the MICINN RTI2018-097267-B-I00. A. Macchia was funded by a FPI predoctoral fellowship from MICINN (PRE2018-083607). EB is funded by the MICINN (BFU2016-76872-R (FEDER/EU), PID2019-108112RB-I00, Severo Ochoa Excellence Accreditation SEV-2016-0644 and Excellence Networks SAF2017-90794-REDT). The work of A. Carracedo is supported by the Basque Department of Industry, Tourism and Trade (Elkartek), the department of education (IKERTALDE IT1106-16) and health (RIS3), the BBVA foundation and the MICINN (SAF2016-79381-R (FEDER/EU; PID2019-108787RB-I00), Severo Ochoa Excellence Accreditation SEV-2016-0644 and Excellence Networks SAF2016-81975-REDT and RED2018-102769-T), European Training Networks Project (H2020-MSCA-ITN-308 2016 721532), the AECC (IDEAS175CARR, GCTRA18006CARR), La Caixa Foundation (ID 100010434), under the agreement LCF/PR/HR17/ and the European Research Council (Starting Grant 336343, Consolidator Grant 819242). CIBERONC was co-funded with FEDER funds and funded by ISCIII.

Conflicts of Interest

The authors declare no conflict of interest.

References

  1. Hanahan, D.; Weinberg, R.A. The hallmarks of cancer. Cell 2000, 100, 57–70. [Google Scholar] [CrossRef] [Green Version]
  2. Hanahan, D.; Weinberg, R.A. Hallmarks of cancer: The next generation. Cell 2011, 144, 646–674. [Google Scholar] [CrossRef] [PubMed] [Green Version]
  3. Berger, M.F.; Mardis, E.R. The emerging clinical relevance of genomics in cancer medicine. Nat. Rev. Clin. Oncol. 2018, 15, 353–365. [Google Scholar] [CrossRef] [PubMed]
  4. Dang, C.V. MYC on the path to cancer. Cell 2012, 149, 22–35. [Google Scholar] [CrossRef] [PubMed] [Green Version]
  5. Grisanzio, C.; Freedman, M.L. Chromosome 8q24-Associated Cancers and MYC. Genes Cancer 2010, 1, 555–559. [Google Scholar] [CrossRef] [PubMed]
  6. Kalkat, M.; De Melo, J.; Hickman, K.A.; Lourenco, C.; Redel, C.; Resetca, D.; Tamachi, A.; Tu, W.B.; Penn, L.Z. MYC Deregulation in Primary Human Cancers. Genes 2017, 8, 151. [Google Scholar] [CrossRef] [Green Version]
  7. Ghoussaini, M.; Song, H.; Koessler, T.; Al Olama, A.A.; Kote-Jarai, Z.; Driver, K.E.; Pooley, K.A.; Ramus, S.J.; Kjaer, S.K.; Hogdall, E.; et al. Multiple loci with different cancer specificities within the 8q24 gene desert. J. Natl. Cancer Inst. 2008, 100, 962–966. [Google Scholar] [CrossRef] [Green Version]
  8. Pal, P.; Xi, H.; Guha, S.; Sun, G.; Helfand, B.T.; Meeks, J.J.; Suarez, B.K.; Catalona, W.J.; Deka, R. Common variants in 8q24 are associated with risk for prostate cancer and tumor aggressiveness in men of European ancestry. Prostate 2009, 69, 1548–1556. [Google Scholar] [CrossRef] [Green Version]
  9. Riaz, M.; Berns, E.M.; Sieuwerts, A.M.; Ruigrok-Ritstier, K.; de Weerd, V.; Groenewoud, A.; Uitterlinden, A.G.; Look, M.P.; Klijn, J.G.; Sleijfer, S.; et al. Correlation of breast cancer susceptibility loci with patient characteristics, metastasis-free survival, and mRNA expression of the nearest genes. Breast Cancer Res. Treat. 2012, 133, 843–851. [Google Scholar] [CrossRef]
  10. Huppi, K.; Pitt, J.J.; Wahlberg, B.M.; Caplen, N.J. The 8q24 gene desert: An oasis of non-coding transcriptional activity. Front. Genet. 2012, 3, 69. [Google Scholar] [CrossRef] [Green Version]
  11. Meyer, K.B.; Maia, A.T.; O’Reilly, M.; Ghoussaini, M.; Prathalingam, R.; Porter-Gill, P.; Ambs, S.; Prokunina-Olsson, L.; Carroll, J.; Ponder, B.A. A functional variant at a prostate cancer predisposition locus at 8q24 is associated with PVT1 expression. PLoS Genet. 2011, 7, e1002165. [Google Scholar] [CrossRef] [PubMed]
  12. Killian, A.; Sarafan-Vasseur, N.; Sesboüé, R.; Le Pessot, F.; Blanchard, F.; Lamy, A.; Laurent, M.; Flaman, J.M.; Frébourg, T. Contribution of the BOP1 gene, located on 8q24, to colorectal tumorigenesis. Genes Chromosomes Cancer 2006, 45, 874–881. [Google Scholar] [CrossRef] [PubMed]
  13. Gu, Y.; Lin, X.; Kapoor, A.; Chow, M.J.; Jiang, Y.; Zhao, K.; Tang, D. The Oncogenic Potential of the Centromeric Border Protein FAM84B of the 8q24.21 Gene Desert. Genes 2020, 11, 312. [Google Scholar] [CrossRef] [PubMed] [Green Version]
  14. Kypta, R.; Unda, M.; Carracedo, A. Is the bench getting closer to the bedside in the war on cancer? A quick look at prostate cancer. Front. Endocrinol. 2012, 3, 53. [Google Scholar] [CrossRef] [PubMed] [Green Version]
  15. Crawford, E.D.; Schellhammer, P.F.; McLeod, D.G.; Moul, J.W.; Higano, C.S.; Shore, N.; Denis, L.; Iversen, P.; Eisenberger, M.A.; Labrie, F. Androgen Receptor Targeted Treatments of Prostate Cancer: 35 Years of Progress with Antiandrogens. J. Urol. 2018, 200, 956–966. [Google Scholar] [CrossRef] [PubMed]
  16. Grimm, P.; Billiet, I.; Bostwick, D.; Dicker, A.P.; Frank, S.; Immerzeel, J.; Keyes, M.; Kupelian, P.; Lee, W.R.; Machtens, S.; et al. Comparative analysis of prostate-specific antigen free survival outcomes for patients with low, intermediate and high risk prostate cancer treatment by radical therapy. Results from the Prostate Cancer Results Study Group. BJU Int. 2012, 109 (Suppl. S1), 22–29. [Google Scholar] [CrossRef]
  17. Rubin, M.A.; Demichelis, F. The Genomics of Prostate Cancer: Emerging understanding with technologic advances. Mod. Pathol. 2018, 31, S1–S11. [Google Scholar] [CrossRef]
  18. Ellwood-Yen, K.; Graeber, T.G.; Wongvipat, J.; Iruela-Arispe, M.L.; Zhang, J.; Matusik, R.; Thomas, G.V.; Sawyers, C.L. Myc-driven murine prostate cancer shares molecular features with human prostate tumors. Cancer Cell 2003, 4, 223–238. [Google Scholar] [CrossRef] [Green Version]
  19. Cho, H.; Herzka, T.; Zheng, W.; Qi, J.; Wilkinson, J.E.; Bradner, J.E.; Robinson, B.D.; Castillo-Martin, M.; Cordon-Cardo, C.; Trotman, L.C. RapidCaP, a novel GEM model for metastatic prostate cancer analysis and therapy, reveals myc as a driver of Pten-mutant metastasis. Cancer Discov. 2014, 4, 318–333. [Google Scholar] [CrossRef] [Green Version]
  20. Pettersson, A.; Gerke, T.; Penney, K.L.; Lis, R.T.; Stack, E.C.; Pértega-Gomes, N.; Zadra, G.; Tyekucheva, S.; Giovannucci, E.L.; Mucci, L.A.; et al. MYC Overexpression at the Protein and mRNA Level and Cancer Outcomes among Men Treated with Radical Prostatectomy for Prostate Cancer. Cancer Epidemiol. Biomark. Prev. 2018, 27, 201–207. [Google Scholar] [CrossRef] [Green Version]
  21. Richmond, L.; Keeshan, K. Pseudokinases: A tribble-edged sword. FEBS J. 2019. [Google Scholar] [CrossRef] [PubMed] [Green Version]
  22. Eyers, P.A.; Keeshan, K.; Kannan, N. Tribbles in the 21st Century: The Evolving Roles of Tribbles Pseudokinases in Biology and Disease. Trends Cell Biol. 2017, 27, 284–298. [Google Scholar] [CrossRef] [Green Version]
  23. Kung, J.E.; Jura, N. The pseudokinase TRIB1 toggles an intramolecular switch to regulate COP1 nuclear export. EMBO J. 2019, 38, e99708. [Google Scholar] [CrossRef] [PubMed]
  24. Jamieson, S.A.; Ruan, Z.; Burgess, A.E.; Curry, J.R.; McMillan, H.D.; Brewster, J.L.; Dunbier, A.K.; Axtman, A.D.; Kannan, N.; Mace, P.D. Substrate binding allosterically relieves autoinhibition of the pseudokinase TRIB1. Sci. Signal. 2018, 11. [Google Scholar] [CrossRef] [PubMed] [Green Version]
  25. Uljon, S.; Xu, X.; Durzynska, I.; Stein, S.; Adelmant, G.; Marto, J.A.; Pear, W.S.; Blacklow, S.C. Structural Basis for Substrate Selectivity of the E3 Ligase COP1. Structure 2016, 24, 687–696. [Google Scholar] [CrossRef] [Green Version]
  26. Yoshida, A.; Kato, J.Y.; Nakamae, I.; Yoneda-Kato, N. COP1 targets C/EBPα for degradation and induces acute myeloid leukemia via Trib1. Blood 2013, 122, 1750–1760. [Google Scholar] [CrossRef]
  27. Liu, Z.Z.; Han, Z.D.; Liang, Y.K.; Chen, J.X.; Wan, S.; Zhuo, Y.J.; Cai, Z.D.; Deng, Y.L.; Lin, Z.Y.; Mo, R.J.; et al. TRIB1 induces macrophages to M2 phenotype by inhibiting IKB-zeta in prostate cancer. Cell. Signal. 2019, 59, 152–162. [Google Scholar] [CrossRef]
  28. Mashima, T.; Soma-Nagae, T.; Migita, T.; Kinoshita, R.; Iwamoto, A.; Yuasa, T.; Yonese, J.; Ishikawa, Y.; Seimiya, H. TRIB1 supports prostate tumorigenesis and tumor-propagating cell survival by regulation of endoplasmic reticulum chaperone expression. Cancer Res. 2014, 74, 4888–4897. [Google Scholar] [CrossRef] [Green Version]
  29. Lin, Z.Y.; Huang, Y.Q.; Zhang, Y.Q.; Han, Z.D.; He, H.C.; Ling, X.H.; Fu, X.; Dai, Q.S.; Cai, C.; Chen, J.H.; et al. MicroRNA-224 inhibits progression of human prostate cancer by downregulating TRIB1. Int. J. Cancer 2014, 135, 541–550. [Google Scholar] [CrossRef]
  30. Torrano, V.; Valcarcel-Jimenez, L.; Cortazar, A.R.; Liu, X.; Urosevic, J.; Castillo-Martin, M.; Fernandez-Ruiz, S.; Morciano, G.; Caro-Maldonado, A.; Guiu, M.; et al. The metabolic co-regulator PGC1alpha suppresses prostate cancer metastasis. Nat. Cell Biol. 2016, 18, 645–656. [Google Scholar] [CrossRef] [Green Version]
  31. Chen, Z.; Trotman, L.C.; Shaffer, D.; Lin, H.K.; Dotan, Z.A.; Niki, M.; Koutcher, J.A.; Scher, H.I.; Ludwig, T.; Gerald, W.; et al. Crucial role of p53-dependent cellular senescence in suppression of Pten-deficient tumorigenesis. Nature 2005, 436, 725–730. [Google Scholar] [CrossRef] [PubMed] [Green Version]
  32. Trotman, L.C.; Niki, M.; Dotan, Z.A.; Koutcher, J.A.; Di Cristofano, A.; Xiao, A.; Khoo, A.S.; Roy-Burman, P.; Greenberg, N.M.; Van Dyke, T.; et al. Pten dose dictates cancer progression in the prostate. PLoS Biol. 2003, 1, E59. [Google Scholar] [CrossRef] [PubMed]
  33. Johnston, J.M.; Angyal, A.; Bauer, R.C.; Hamby, S.; Suvarna, S.K.; Baidžajevas, K.; Hegedus, Z.; Dear, T.N.; Turner, M.; Wilson, H.L.; et al. Myeloid Tribbles 1 induces early atherosclerosis via enhanced foam cell expansion. Sci. Adv. 2019, 5, eaax9183. [Google Scholar] [CrossRef] [PubMed] [Green Version]
  34. Shappell, S.B.; Thomas, G.V.; Roberts, R.L.; Herbert, R.; Ittmann, M.M.; Rubin, M.A.; Humphrey, P.A.; Sundberg, J.P.; Rozengurt, N.; Barrios, R.; et al. Prostate pathology of genetically engineered mice: Definitions and classification. The consensus report from the Bar Harbor meeting of the Mouse Models of Human Cancer Consortium Prostate Pathology Committee. Cancer Res. 2004, 64, 2270–2305. [Google Scholar] [CrossRef] [PubMed] [Green Version]
  35. Wiederschain, D.; Wee, S.; Chen, L.; Loo, A.; Yang, G.; Huang, A.; Chen, Y.; Caponigro, G.; Yao, Y.M.; Lengauer, C.; et al. Single-vector inducible lentiviral RNAi system for oncology target validation. Cell Cycle 2009, 8, 498–504. [Google Scholar] [CrossRef] [PubMed]
  36. Valcarcel-Jimenez, L.; Macchia, A.; Crosas-Molist, E.; Schaub-Clerigue, A.; Camacho, L.; Martin-Martin, N.; Cicogna, P.; Viera-Bardon, C.; Fernandez-Ruiz, S.; Rodriguez-Hernandez, I.; et al. PGC1alpha Suppresses Prostate Cancer Cell Invasion through ERRalpha Transcriptional Control. Cancer Res. 2019, 79, 6153–6165. [Google Scholar] [CrossRef] [Green Version]
  37. Ugalde-Olano, A.; Egia, A.; Fernandez-Ruiz, S.; Loizaga-Iriarte, A.; Zuniga-Garcia, P.; Garcia, S.; Royo, F.; Lacasa-Viscasillas, I.; Castro, E.; Cortazar, A.R.; et al. Methodological aspects of the molecular and histological study of prostate cancer: Focus on PTEN. Methods 2015, 77–78, 25–30. [Google Scholar] [CrossRef]
  38. Martin-Martin, N.; Piva, M.; Urosevic, J.; Aldaz, P.; Sutherland, J.D.; Fernandez-Ruiz, S.; Arreal, L.; Torrano, V.; Cortazar, A.R.; Planet, E.; et al. Stratification and therapeutic potential of PML in metastatic breast cancer. Nat. Commun. 2016, 7, 12595. [Google Scholar] [CrossRef] [Green Version]
  39. Boehm, J.S.; Hession, M.T.; Bulmer, S.E.; Hahn, W.C. Transformation of human and murine fibroblasts without viral oncoproteins. Mol. Cell. Biol. 2005, 25, 6464–6474. [Google Scholar] [CrossRef] [Green Version]
  40. Cortazar, A.R.; Torrano, V.; Martin-Martin, N.; Caro-Maldonado, A.; Camacho, L.; Hermanova, I.; Guruceaga, E.; Lorenzo-Martin, L.F.; Caloto, R.; Gomis, R.R.; et al. CANCERTOOL: A Visualization and Representation Interface to Exploit Cancer Datasets. Cancer Res. 2018, 78, 6320–6328. [Google Scholar] [CrossRef] [Green Version]
  41. Kaplan, E.L.; Meier, P. Nonparametric Estimation from Incomplete Observations. J. Am. Stat. Assoc. 1958, 53, 457–481. [Google Scholar] [CrossRef]
  42. Mantel, N. Evaluation of survival data and two new rank order statistics arising in its consideration. Cancer Chemother. Rep. 1966, 50, 163–170. [Google Scholar] [PubMed]
  43. Cerami, E.; Gao, J.; Dogrusoz, U.; Gross, B.E.; Sumer, S.O.; Aksoy, B.A.; Jacobsen, A.; Byrne, C.J.; Heuer, M.L.; Larsson, E.; et al. The cBio cancer genomics portal: An open platform for exploring multidimensional cancer genomics data. Cancer Discov. 2012, 2, 401–404. [Google Scholar] [CrossRef] [PubMed] [Green Version]
  44. Gao, J.; Aksoy, B.A.; Dogrusoz, U.; Dresdner, G.; Gross, B.; Sumer, S.O.; Sun, Y.; Jacobsen, A.; Sinha, R.; Larsson, E.; et al. Integrative analysis of complex cancer genomics and clinical profiles using the cBioPortal. Sci. Signal. 2013, 6, pl1. [Google Scholar] [CrossRef] [Green Version]
  45. Hahne, F.; Ivanek, R. Visualizing Genomic Data Using Gviz and Bioconductor. Methods Mol. Biol. 2016, 1418, 335–351. [Google Scholar] [CrossRef]
  46. Grasso, C.S.; Wu, Y.M.; Robinson, D.R.; Cao, X.; Dhanasekaran, S.M.; Khan, A.P.; Quist, M.J.; Jing, X.; Lonigro, R.J.; Brenner, J.C.; et al. The mutational landscape of lethal castration-resistant prostate cancer. Nature 2012, 487, 239–243. [Google Scholar] [CrossRef] [Green Version]
  47. Lapointe, J.; Li, C.; Higgins, J.P.; van de Rijn, M.; Bair, E.; Montgomery, K.; Ferrari, M.; Egevad, L.; Rayford, W.; Bergerheim, U.; et al. Gene expression profiling identifies clinically relevant subtypes of prostate cancer. Proc. Natl. Acad. Sci. USA 2004, 101, 811–816. [Google Scholar] [CrossRef] [Green Version]
  48. Taylor, B.S.; Schultz, N.; Hieronymus, H.; Gopalan, A.; Xiao, Y.; Carver, B.S.; Arora, V.K.; Kaushik, P.; Cerami, E.; Reva, B.; et al. Integrative genomic profiling of human prostate cancer. Cancer Cell 2010, 18, 11–22. [Google Scholar] [CrossRef] [Green Version]
  49. Tomlins, S.A.; Mehra, R.; Rhodes, D.R.; Cao, X.; Wang, L.; Dhanasekaran, S.M.; Kalyana-Sundaram, S.; Wei, J.T.; Rubin, M.A.; Pienta, K.J.; et al. Integrative molecular concept modeling of prostate cancer progression. Nat. Genet. 2007, 39, 41–51. [Google Scholar] [CrossRef]
  50. Varambally, S.; Yu, J.; Laxman, B.; Rhodes, D.R.; Mehra, R.; Tomlins, S.A.; Shah, R.B.; Chandran, U.; Monzon, F.A.; Becich, M.J.; et al. Integrative genomic and proteomic analysis of prostate cancer reveals signatures of metastatic progression. Cancer Cell 2005, 8, 393–406. [Google Scholar] [CrossRef] [Green Version]
  51. Lin, H.-Y.; Callan, C.Y.; Fang, Z.; Tung, H.-Y.; Park, J.Y. Interactions of PVT1 and CASC11 on Prostate Cancer Risk in African Americans. Cancer Epidemiol. Biomark. Prev. 2019, 28, 1067–1075. [Google Scholar] [CrossRef] [PubMed] [Green Version]
  52. Barretina, J.; Caponigro, G.; Stransky, N.; Venkatesan, K.; Margolin, A.A.; Kim, S.; Wilson, C.J.; Lehár, J.; Kryukov, G.V.; Sonkin, D.; et al. The Cancer Cell Line Encyclopedia enables predictive modelling of anticancer drug sensitivity. Nature 2012, 483, 603–607. [Google Scholar] [CrossRef] [PubMed]
  53. Curtis, C.; Shah, S.P.; Chin, S.F.; Turashvili, G.; Rueda, O.M.; Dunning, M.J.; Speed, D.; Lynch, A.G.; Samarajiwa, S.; Yuan, Y.; et al. The genomic and transcriptomic architecture of 2,000 breast tumours reveals novel subgroups. Nature 2012, 486, 346–352. [Google Scholar] [CrossRef] [PubMed]
  54. Ciriello, G.; Gatza, M.L.; Beck, A.H.; Wilkerson, M.D.; Rhie, S.K.; Pastore, A.; Zhang, H.; McLellan, M.; Yau, C.; Kandoth, C.; et al. Comprehensive Molecular Portraits of Invasive Lobular Breast Cancer. Cell 2015, 163, 506–519. [Google Scholar] [CrossRef] [PubMed] [Green Version]
  55. Tyekucheva, S.; Bowden, M.; Bango, C.; Giunchi, F.; Huang, Y.; Zhou, C.; Bondi, A.; Lis, R.; Van Hemelrijck, M.; Andren, O.; et al. Stromal and epithelial transcriptional map of initiation progression and metastatic potential of human prostate cancer. Nat. Commun. 2017, 8, 420. [Google Scholar] [CrossRef] [Green Version]
  56. Armenia, J.; Wankowicz, S.A.M.; Liu, D.; Gao, J.; Kundra, R.; Reznik, E.; Chatila, W.K.; Chakravarty, D.; Han, G.C.; Coleman, I.; et al. The long tail of oncogenic drivers in prostate cancer. Nat. Genet. 2018, 50, 645–651. [Google Scholar] [CrossRef]
  57. Arreal, L.; Piva, M.; Fernandez, S.; Revandkar, A.; Schaub-Clerigue, A.; Villanueva, J.; Zabala-Letona, A.; Pujana, M.; Astobiza, I.; Cortazar, A.R.; et al. Targeting PML in triple negative breast cancer elicits growth suppression and senescence. Cell Death Differ. 2020, 27, 1186–1199. [Google Scholar] [CrossRef]
  58. The Cancer Cell Line Encyclopedia Consortium; The Genomics of Drug Sensitivity in Cancer Consortium. Pharmacogenomic agreement between two cancer cell line data sets. Nature 2015, 528, 84–87. [Google Scholar] [CrossRef]
  59. Di Cristofano, A.; Pesce, B.; Cordon-Cardo, C.; Pandolfi, P.P. Pten is essential for embryonic development and tumour suppression. Nat. Genet. 1998, 19, 348–355. [Google Scholar] [CrossRef]
  60. Nardella, C.; Carracedo, A.; Salmena, L.; Pandolfi, P.P. Faithfull modeling of PTEN loss driven diseases in the mouse. Curr. Top. Microbiol. Immunol. 2011, 347, 135–168. [Google Scholar] [CrossRef]
  61. Zhu, J.; Blenis, J.; Yuan, J. Activation of PI3K/Akt and MAPK pathways regulates Myc-mediated transcription by phosphorylating and promoting the degradation of Mad1. Proc. Natl. Acad. Sci. USA 2008, 105, 6584–6589. [Google Scholar] [CrossRef] [PubMed] [Green Version]
  62. Schild, C.; Wirth, M.; Reichert, M.; Schmid, R.M.; Saur, D.; Schneider, G. PI3K signaling maintains c-myc expression to regulate transcription of E2F1 in pancreatic cancer cells. Mol. Carcinog. 2009, 48, 1149–1158. [Google Scholar] [CrossRef] [PubMed]
  63. Swords, R.T.; Schenk, T.; Stengel, S.; Gil, V.S.; Petrie, K.R.; Perez, A.; Ana, R.; Watts, J.M.; Vargas, F.; Elias, R.; et al. Inhibition of the PI3K/AKT/mTOR Pathway Leads to Down-Regulation of c-Myc and Overcomes Resistance to ATRA in Acute Myeloid Leukemia. Blood 2015, 126, 1363–1363. [Google Scholar] [CrossRef]
  64. Liu, P.; Ge, M.; Hu, J.; Li, X.; Che, L.; Sun, K.; Cheng, L.; Huang, Y.; Pilo, M.G.; Cigliano, A.; et al. A functional mammalian target of rapamycin complex 1 signaling is indispensable for c-Myc-driven hepatocarcinogenesis. Hepatology 2017, 66, 167–181. [Google Scholar] [CrossRef] [PubMed] [Green Version]
  65. Csibi, A.; Lee, G.; Yoon, S.O.; Tong, H.; Ilter, D.; Elia, I.; Fendt, S.M.; Roberts, T.M.; Blenis, J. The mTORC1/S6K1 pathway regulates glutamine metabolism through the eIF4B-dependent control of c-Myc translation. Curr. Biol. 2014, 24, 2274–2280. [Google Scholar] [CrossRef] [PubMed] [Green Version]
  66. Richardsen, E.; Andersen, S.; Al-Saad, S.; Rakaee, M.; Nordby, Y.; Pedersen, M.I.; Ness, N.; Grindstad, T.; Movik, I.; Dønnem, T.; et al. Evaluation of the proliferation marker Ki-67 in a large prostatectomy cohort. PLoS ONE 2017, 12, e0186852. [Google Scholar] [CrossRef]
  67. Labbé, D.P.; Brown, M. Transcriptional Regulation in Prostate Cancer. Cold Spring Harb. Perspect. Med. 2018, 8, a030437. [Google Scholar] [CrossRef]
  68. Stine, Z.E.; Walton, Z.E.; Altman, B.J.; Hsieh, A.L.; Dang, C.V. MYC, Metabolism, and Cancer. Cancer Discov. 2015, 5, 1024–1039. [Google Scholar] [CrossRef] [Green Version]
  69. Whitfield, J.R.; Beaulieu, M.E.; Soucek, L. Strategies to Inhibit Myc and Their Clinical Applicability. Front. Cell Dev. Biol. 2017, 5, 10. [Google Scholar] [CrossRef] [Green Version]
  70. Umemori, M.; Kurata, M.; Yamamoto, A.; Yamamoto, K.; Ishibashi, S.; Ikeda, M.; Tashiro, K.; Kimura, T.; Sato, S.; Takahashi, H.; et al. The expression of MYC is strongly dependent on the circular PVT1 expression in pure Gleason pattern 4 of prostatic cancer. Med. Mol. Morphol. 2020, 53, 156–167. [Google Scholar] [CrossRef]
  71. Yang, J.; Li, C.; Mudd, A.; Gu, X. LncRNA PVT1 predicts prognosis and regulates tumor growth in prostate cancer. Biosci. Biotechnol. Biochem. 2017, 81, 2301–2306. [Google Scholar] [CrossRef] [PubMed] [Green Version]
  72. Chen, J.; Huang, L.; Zhu, Q.; Wang, Z.; Tang, Z. MTSS1 hypermethylation is associated with prostate cancer progression. J. Cell. Physiol. 2020, 235, 2687–2697. [Google Scholar] [CrossRef] [PubMed]
  73. Xu, L.; Zhong, J.; Guo, B.; Zhu, Q.; Liang, H.; Wen, N.; Yun, W.; Zhang, L. miR-96 promotes the growth of prostate carcinoma cells by suppressing MTSS1. Tumour Biol. 2016, 37, 12023–12032. [Google Scholar] [CrossRef] [PubMed]
  74. Moya, L.; Lai, J.; Hoffman, A.; Srinivasan, S.; Panchadsaram, J.; Chambers, S.; Clements, J.A.; Batra, J. Association Analysis of a Microsatellite Repeat in the TRIB1 Gene With Prostate Cancer Risk, Aggressiveness and Survival. Front. Genet. 2018, 9, 428. [Google Scholar] [CrossRef] [PubMed] [Green Version]
  75. Iwamoto, S.; Boonvisut, S.; Makishima, S.; Ishizuka, Y.; Watanabe, K.; Nakayama, K. The role of TRIB1 in lipid metabolism; from genetics to pathways. Biochem. Soc. Trans. 2015, 43, 1063–1068. [Google Scholar] [CrossRef] [PubMed]
  76. Wang, Y.; Wu, N.; Pang, B.; Tong, D.; Sun, D.; Sun, H.; Zhang, C.; Sun, W.; Meng, X.; Bai, J.; et al. TRIB1 promotes colorectal cancer cell migration and invasion through activation MMP-2 via FAK/Src and ERK pathways. Oncotarget 2017, 8, 47931–47942. [Google Scholar] [CrossRef] [Green Version]
  77. Gendelman, R.; Xing, H.; Mirzoeva, O.K.; Sarde, P.; Curtis, C.; Feiler, H.S.; McDonagh, P.; Gray, J.W.; Khalil, I.; Korn, W.M. Bayesian Network Inference Modeling Identifies TRIB1 as a Novel Regulator of Cell-Cycle Progression and Survival in Cancer Cells. Cancer Res. 2017, 77, 1575–1585. [Google Scholar] [CrossRef] [Green Version]
  78. Chen, Z.; Carracedo, A.; Lin, H.K.; Koutcher, J.A.; Behrendt, N.; Egia, A.; Alimonti, A.; Carver, B.S.; Gerald, W.; Teruya-Feldstein, J.; et al. Differential p53-independent outcomes of p19(Arf) loss in oncogenesis. Sci. Signal. 2009, 2, ra44. [Google Scholar] [CrossRef] [Green Version]
  79. Hermanova, I.; Zuniga-Garcia, P.; Caro-Maldonado, A.; Fernandez-Ruiz, S.; Salvador, F.; Martin-Martin, N.; Zabala-Letona, A.; Nunez-Olle, M.; Torrano, V.; Camacho, L.; et al. Genetic manipulation of LKB1 elicits lethal metastatic prostate cancer. J. Exp. Med. 2020, 217, e20191787. [Google Scholar] [CrossRef] [Green Version]
  80. Mack, E.A.; Stein, S.J.; Rome, K.S.; Xu, L.; Wertheim, G.B.; Melo, R.C.N.; Pear, W.S. Trib1 regulates eosinophil lineage commitment and identity by restraining the neutrophil program. Blood 2019, 133, 2413–2426. [Google Scholar] [CrossRef]
Figure 1. TRIB1 is frequently amplified and overexpressed in PCa. (A) Copy number variation at cMYC locus. Overview of the genes located in cMYC amplicon in prostate cancer. Boxplots represent the distribution of copy number variation per gene in the TCGA datasets (492 specimens), given as GISTIC2 scores (log2 (copy-number/2)). Blue and orange lines represent the thresholds for copy-gain and loss, respectively. (B) Genes contained in cMYC amplicon were defined by two FC values: (1) tumor vs. normal samples (x-axis) and (2) SCN-altered vs. diploid tumor samples (y-axis). Only those with an FDR fold change (FC)-associated value < 0.05 were plotted. Deep amplifications are represented with a triangle, and its size is proportional to the % of TCGA-PRAD patients carrying a deep cMYC locus amplification, as defined by the GISTIC2.0 algorithm. Gene symbols point to those with a significant differential expression between SCN-altered and diploid tumor samples (|Log2(FC)| > 0.58 and FDR-value < 0.05). (C) Waterfall plot depicting the expression of indicated genes in up to five prostate cancer datasets [40,46,47,48,49,50]. Each dot represents the differential mRNA abundance in primary tumors (PT) vs. non-cancerous prostate tissue (N) for a given dataset. Black dots indicate a significant difference in expression, whereas grey dots depict gene expression differences that are non-significant according to two-tailed Student’s t-test. (D) Gene expression analysis of TRIB1 in two human prostate cancer datasets in normal (N) versus primary tumors (PT). Data were extracted from Cancertool. Each dot indicates one individual. *, p < 0.05; ****, p < 0.0001. Statistics: two-tailed Mann–Whitney U test. (E) Copy number alteration analysis of the indicated prostate cancer studies. Data were extracted from cBioPortal. Adenoc: adenocarcinoma (localized); Neuroend, neuroendocrine tumor; Met, metastasis. (F) Relative TRIB1 mRNA expression measured by RT-qPCR in benign immortalized prostate (BPH1, RWPE1 and PWRE1) versus prostate cancer (DU145, PC3, C4-2, 22RV1 and VCap) cell lines. Each dot indicates one biological replicate. *, p < 0.05; ***, p < 0.001. All values are normalized to BPH1. GAPDH was employed for normalization. FC: fold change. Statistics: two-tailed Student’s t-test.
Cancers 12 02593 g001
Figure 2. cMYC is a transcriptional regulator of TRIB1. (A) Association of TRIB1 copy number to mRNA expression in TCGA and Taylor datasets. Data were extracted from cBioPortal. Dip, diploid; Amp, amplified. (B) Transcription factors with ENCODE binding score higher than 600 present in PolR2A binding region (4144 bp) on TRIB1 regulatory region. Red bars indicate two cMYC binding sites with ENCODE binding score 1000/1000 in this region. Data were extracted from https://genome.ucsc.edu. (C) ChIP-RT-qPCR analysis of cMYC binding to TRIB1 promoter region. Two cMYC binding sites on TRIB1 regulatory region were selected based on the ENCODE3 binding score (1000/1000) and subject to ChIP analysis in PC3 cells. Quantitation of amplified immunoprecipitated DNA is indicated relative to input IgG. Each dot represents one biological replicate; a.u. = arbitrary unit. Statistics: one-tailed one-sample t-test. *, p < 0.05. (D) Dual-luciferase reporter assay, using TRIB1 promoter and ectopic cMYC expression. Each dot represents one biological replicate. MOCK: empty vector. Statistics: one-sample t-test. *, p < 0.05. (E) Impact of inducible cMYC silencing on TRIB1 mRNA expression in PC3 cells. Left panel shows cMYC downregulation upon activation of the shRNA with 250 ng/mL of doxycycline for six days (densitometry of cMYC relative to HSP90 is indicated, mean ± standard error), and right panels depict TRIB1 mRNA abundance (values are normalized to no dox); a.u. = arbitrary unit. Statistics: one-sample t-test. *, p < 0.05. Uncropped western blot figure in Figure S7.
Cancers 12 02593 g002
Figure 3. Ectopic expression of TRIB1 in DU145 cells does not influence tumor cell function. TRIB1 mRNA (A) and protein expression (B) were measured by using RT-qPCR and Western blot, respectively. Each dot represents one biological replicate in the RT-qPCR data. HSP90 serves as a housekeeping control for Western blot analysis. TRIB1-HA: TRIB1 protein with C-terminal HA-tag. β-ACTIN was used for normalization in RT-qPCR. Dashed line shows normalization of values to non-induced samples in RT-qPCR; a.u. = arbitrary unit. Statistics: one-sample t-test. *, p < 0.05. Uncropped western blot figure in Figure S7. (C) DU145 cell growth was measured by crystal violet staining at day zero, and after three or six days post-doxycycline induction. Each dot represents one biological replicate; n.s. = statistically not significant; a.u. = arbitrary unit. Statistics: paired Student’s t-test. *, p < 0.05. (D) Evaluation of the effect of TRIB1 overexpression on the clonal growth. Colonies formed by DU145 cells were counted, and the crystal violet absorbance was measured after 14 days (left and central panels). Dashed line shows normalization of values to non-induced samples. Each dot represents one biological replicate; n.s. = statistically not significant; a.u. = arbitrary unit. Statistics: one-sample t-test. (E) Analysis of the anchorage independent growth of DU145 cells upon overexpression of TRIB1. Colonies were counted after three weeks of seeding. Each dot represents one biological replicate. Dashed line shows normalization of values to non-induced samples; n.s. = statistically not significant; a.u. = arbitrary unit. Statistics: one-sample t-test. (F) Analysis of the 3D invasive growth of DU145 cells upon overexpression of TRIB1. Each dot represents one biological replicate. Dashed line shows normalization of values to non-induced samples; n.s. = statistically not significant; a.u. arbitrary unit. Statistics: one-sample t-test.
Cancers 12 02593 g003
Figure 4. Transgenic Trib1 expression promotes prostate cancer pathogenesis. (A) Measurement of the relative gene expression level of Trib1 by RT-qPCR in anterior prostate (AP) lobe extracted from six-month-old Ptenpc+/+ (n = 6) and Ptenpc−/− (n = 10) mice. Values are normalized to Gapdh; a.u. = arbitrary unit. Lower panel illustrates the increased in AKT serine 473 phosphorylation as a control of Pten deletion (densitometry of pAKT relative to HSP90 is indicated, mean ± standard error). Statistics: two-tailed Mann–Whitney U test. ***, p < 0.001. Uncropped western blot figure in Figure S7. (B) Correlation analysis and linear regression lines of TRIB1 with PTEN mRNA levels in primary prostate cancer patient datasets. The corresponding Pearson’s r and p-values of the analysis are shown. (C) Evaluation of Trib1 mRNA level by RT-qPCR in 15–17-month-old Ptenpc+/−/Trib1pc+/+ (n = 6) and Ptenpc+/−/Trib1pcTg/+ mice (n = 9). Each dot is representative of one individual mouse. Values are normalized to Gapdh; a.u. = arbitrary unit. (D) H&E staining of AP tissue from 15–17-month-old mice representative of high-grade prostatic intraepithelial neoplasia (HGPIN) in Ptenpc+/−/Trib1pc+/+ and adenocarcinoma in Ptenpc+/−/Trib1pcTg/+ mice. (E) Pathological analysis of prostate tissue isolated from 15–17-month-old Ptenpc+/−/Trib1pc+/+ (n = 6) and Ptenpc+/−/Trib1pcTg/+ (n = 8). The data correspond to the prostate lobe with most significant phenotype. Phenotypes: high-grade prostatic intraepithelial neoplasia (HGPIN) and prostate adenocarcinoma.
Cancers 12 02593 g004
Figure 5. Transgenic Trib1 overexpression in the prostate epithelium promotes cell proliferation and macrophage infiltration. (A) Analysis of tumor cell proliferation by immunostaining of the proliferation marker Ki67 in prostate tissue sections isolated from Ptenpc+/−/Trib1pc+/+ (n = 6) and Ptenpc+/−/Trib1pcTg/+ mice (n = 9). Representative images are presented at two different magnifications. (B) The percentages of Ki67 positive cells were quantified by using Image J, relative to the total number of cells. Data represent five 20X-field per tissue. Statistical test: two-tailed Mann–Whitney U test. *, p < 0.05. (C) Macrophage infiltration was assessed by immunostaining analysis of mouse macrophage marker F4/80 in prostate tissue sections isolated from Ptenpc+/−/Trib1pc+/+ (n = 6) and adenocarcinoma in Ptenpc+/−/Trib1pcTg/+ (n = 9) mice. Representative images are presented at two different magnifications. (D) The number of F4/80 positive cells per 20X field was quantified by using Image J. Data represent the average of five 20X-field per mouse. Statistical test: two-tailed Mann–Whitney U test. *, p < 0.05.
Cancers 12 02593 g005

