Article

A Mathematical Model to Predict Diagnostic Periods for Secondary Distant Metastases in Patients with ER/PR/HER2/Ki-67 Subtypes of Breast Cancer

by
Ella Ya. Tyuryumina
1,*,
Alexey A. Neznanov
1 and
Jacob L. Turumin
2
1
International Laboratory for Intelligent Systems and Structural Analysis, Faculty of Computer Science, National Research University Higher School of Economics, 109028 Moscow, Russia
2
Medical Center “For all Family”, 664047 Irkutsk, Russia
*
Author to whom correspondence should be addressed.
Cancers 2020, 12(9), 2344; https://doi.org/10.3390/cancers12092344
Submission received: 19 July 2020 / Revised: 13 August 2020 / Accepted: 17 August 2020 / Published: 19 August 2020

Abstract

:
Previously, a consolidated mathematical model of primary tumor (PT) growth and secondary distant metastasis (sdMTS) growth in breast cancer (BC) (CoMPaS) was presented. The aim was to detect the diagnostic periods for visible sdMTS via CoMPaS in patients with different subtypes ER/PR/HER2/Ki-67 (Estrogen Receptor/Progesterone Receptor/Human Epidermal growth factor Receptor 2/Ki-67 marker) of breast cancer. CoMPaS is based on an exponential growth model and complementing formulas, and the model corresponds to the tumor-node-metastasis (TNM) staging system and BC subtypes (ER/PR/HER2/Ki-67). The CoMPaS model reflects (1) the subtypes of BC, such as ER/PR/HER2/Ki-67, and (2) the growth processes of the PT and sdMTSs in BC patients without or with lymph node metastases (MTSs) in accordance with the eighth edition American Joint Committee on Cancer prognostic staging system for breast cancer. CoMPaS correctly describes the growth of the PT in the ER/PR/HER2/Ki-67 subtypes of BC patients and helps to calculate the different diagnostic periods, depending on the tumor volume doubling time of sdMTS, when sdMTSs might appear. CoMPaS and the corresponding software tool can help (1) to start the early treatment of small sdMTSs in BC patients with different tumor subtypes (ER/PR/HER2/Ki-67), and (2) to consider the patient almost healthy if sdMTSs do not appear during the different diagnostic periods.

1. Introduction

After the primary tumor (PT) of breast cancer (BC) is diagnosed, multimodal treatment occurs, including surgery (lumpectomy, unilateral or bilateral mastectomy), radiotherapy, and chemotherapy [1]. However, different parameters, such as the size of the PT, the number of affected lymph nodes, and the growth rate of metastases (MTSs), influence the appearance of secondary distant metastases (sdMTSs) in different organs [2,3,4,5,6,7,8,9,10,11,12,13,14,15]. Moreover, these different parameters determine the period from resection of the PT to the first clinical manifestation of sdMTSs (MTS-free survival time or non-visible period) [8,9,13,16,17,18,19,20,21]. Although the interval of time from the date of diagnosis (using the tumor-node-metastasis (TNM) staging system) to the date of the patient’s death is referred to as survival (lifetime), it is commonly defined as a rate per hundred living patients for a certain period after the diagnosis [1,10,11,14,15]. Hence, survival includes the non-visible growth period (MTS-free period) and the visible growth period of sdMTSs, diagnostics, treatment, and patient death [21]. PTs of breast cancer grow at different rates: rapid, intermediate, and slow [2,3,4,6,7]. The growth rate of sdMTSs depends on the growth rate of the PT [2,3,4,6,7]. The growth rate of PTs in BC may depend on different subtypes of ER/PR/HER2/Ki-67 (Estrogen Receptor/Progesterone Receptor/Human epidermal growth factor Receptor 2/Ki-67 marker) expression in BC [22,23,24,25,26].
The current guidelines on BC follow-up recommend regular visits. The European Society of Medical Oncology (ESMO) recommends follow-up visits every 3–4 months after resection of the PT for the first two years [27]. The American Cancer Society/American Society of Clinical Oncology (ASCO) recommends follow-up visits every 3–6 months after resection of the PT for the first three years, every 6–12 months for the next two years, and every 12 months after the first five years [28].
The National Comprehensive Cancer Network (NCCN) recommends follow-up visits every 4–6 months after resection of the PT for the first five years and every 12 months after the first five years [29]. The Associazione Italiana di Oncologia Medica (AIOM) recommends follow-up visits every 3–6 months after resection of the PT for the first five years and every 12 months after the first five years [29].
The guidelines recommend performing annual examinations, including bilateral (in the case of organ-preserving surgery) or contralateral mammography, a computed tomography of the thoracic organs, and an ultrasound examination of the abdominal organs [1,27,28,29,30,31,32].
All BC patients receive comprehensive PT treatment. The duration of the sdMTS-free period depends equally on both the metastatic tumor rate and the duration of the preclinical non-visible growth period of BC (doubling time) [7,21,33,34,35,36,37,38,39,40,41,42].
Case studies from the BC field show that mathematical models can provide tangible advantages [7,10,11,12,14,15,16,17,18,19,20,21,33,34,35,36,37,38,39,40,41,42]. For instance, a consolidated mathematical model of PT growth and sdMTS growth in BC (CoMPaS) allows the calculation of the number of doublings and the tumor volume doubling time (TVDT) (days) for the different growth periods throughout the whole BC process [21].
The current guidelines for multimodal examinations are generalized to all patients [43]. Consequently, there is a lack of personalized recommendations for multimodal examinations to detect sdMTSs in patients with BC with regard to the stage and/or the growth rate of the PT. All patients with BC worry about the appearance of sdMTSs after resection of the PT. Thus, the most important question is whether sdMTSs will appear.
If sdMTSs do appear, when will the sdMTSs first materialize? The available clinical studies provide no information about the period of manifestation of sdMTSs after PT resection in each patient as a function of the size of the PT and the stage of the BC. The problem becomes very complex because the patients must obtain a personalized approach to build a schedule of multimodal examinations to detect sdMTSs at the early stage and to start early treatment, which can increase the patient’s lifetime. Currently, the possibility of calculating the earliest diagnostic period of sdMTSs in patients with BC, taking into account the stage and/or the growth rate of the PT, was not proposed in any mathematical model in the available studies.
Moreover, if sdMTSs do not appear, when will the patient be considered healthy? Currently, there is no answer to this question.
The purpose of this study was to answer these questions using the model CoMPaS, considering the TNM stage and ER/PR/HER2/Ki-67 subtypes. Therefore, the aim of the research was to detect the personalized diagnostic periods for visible sdMTS via CoMPaS in patients with different subtypes (ER/PR/HER2/Ki-67) of breast cancer. The personalized diagnostic periods for multimodal examinations during the MTS-free period were calculated in BC patients depending on the TVDT of PT and TVDT of sdMTSs.

2. Results

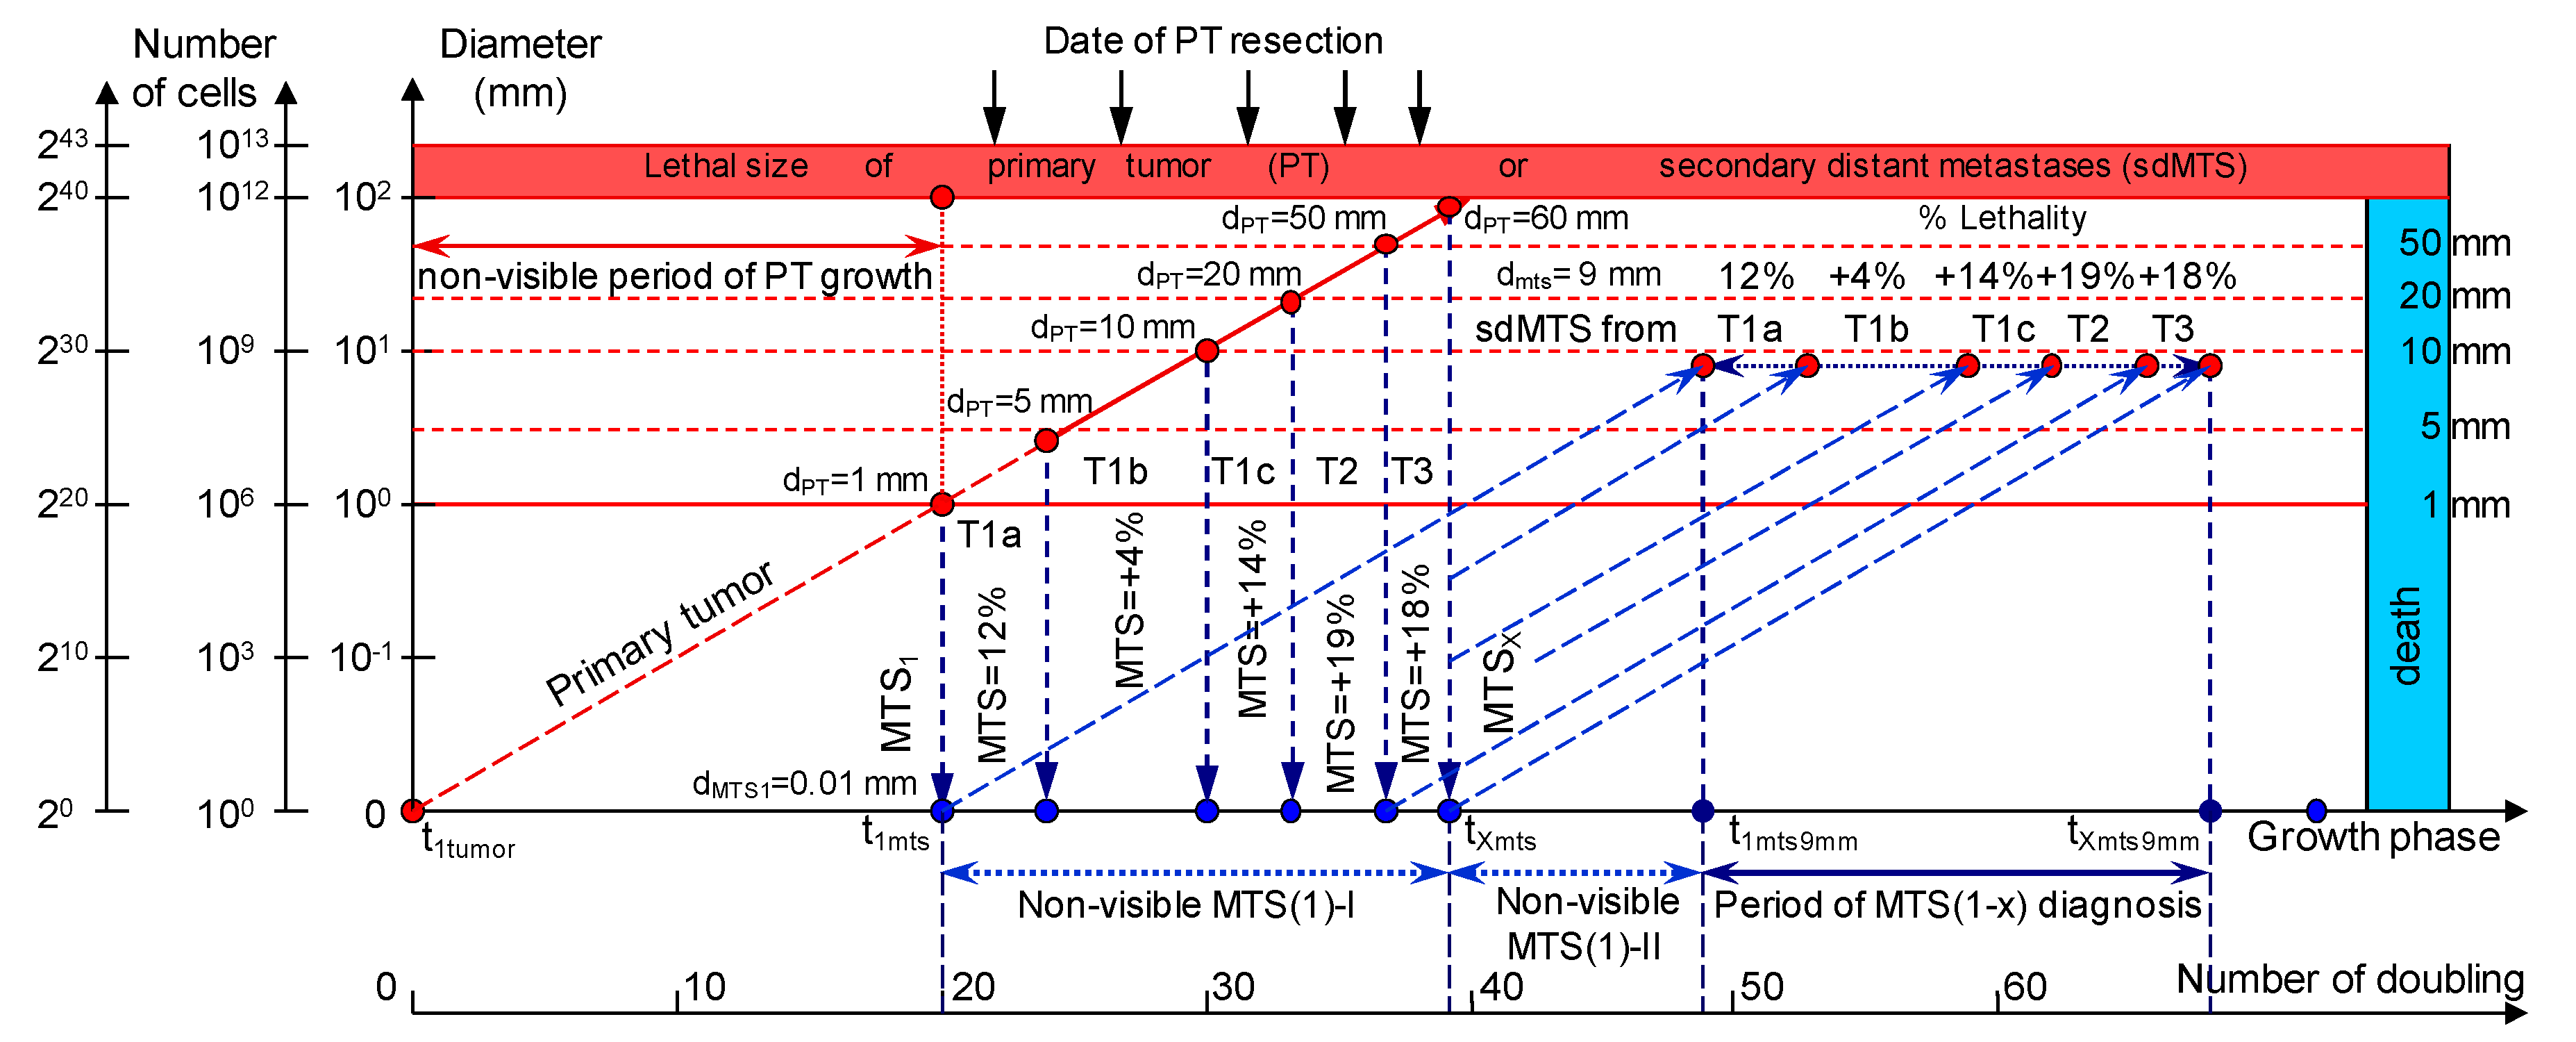
2.1. Consolidated Mathematical Growth Model of Primary Tumor and Secondary Distant Metastases (CoMPaS) in Patients with ER/PR/HER2/Ki-67 Subtypes and Stage I/II/III of Breast Cancer with or without Metastases in the Lymph Nodes

The CoMPaS model helps to determine the causes of BC appearance, which can lead to the development of prevention methods and a deeper understanding of the BC process (Figure 1; Table 1) [21].
sdMTSs are formed from the metastatic cells of the metastasizing PT. The diameter of the metastasizing PT may vary in size from 1 mm up to the diameter of the PT at the time of resection (non-visible MTS-I period) (Figure 1).

2.1.1. T1cN0-3M0. The Whole Natural History of the PT (Triple-Negative, HR(−)/HER2(−), Ki-67 ≥ 14) and sdMTS

If the diameter of the PT at its resection, dPT, was 15.1 mm (Figure 2; Table 1), and the TVDTPT was 10–135 days (a rapid growth rate of PT in patients with HR(−)/HER2(−) (triple-negative) tumors), then the diameter of the sdMTS at PT resection, dMTS, could be 0.01–1.00 mm.
For patients in the rapid growth rate group, TVDTMTS was equal to 10–135 days. The non-visible growth period of sdMTS(1-X)-I was 0.55–4.34 years (Figure 2; Table 1). The non-visible growth period of sdMTS(1-X)-II was 0.26–6.56 years. The visible growth period of sdMTS(1-X) was 0.29–3.90 years. The survival of patients with BC was 0.55–10.47 years.
In summary, in this period of rapid growth rate of sdMTS, patients with T1cN0-3M0 BC must undergo multimodal examination every three months 0.26 years after resection of the PT for 6.30 years.
The total period of MTS(1-X) diagnosis may be 10.64 years (Figure 2; Table 1). BC patients with dPT = 15.1 mm and TVDTPT = 10–135 days (T1aN0-3M0) may be considered healthy only after 10.64 years if sdMTSs were not diagnosed in this period.

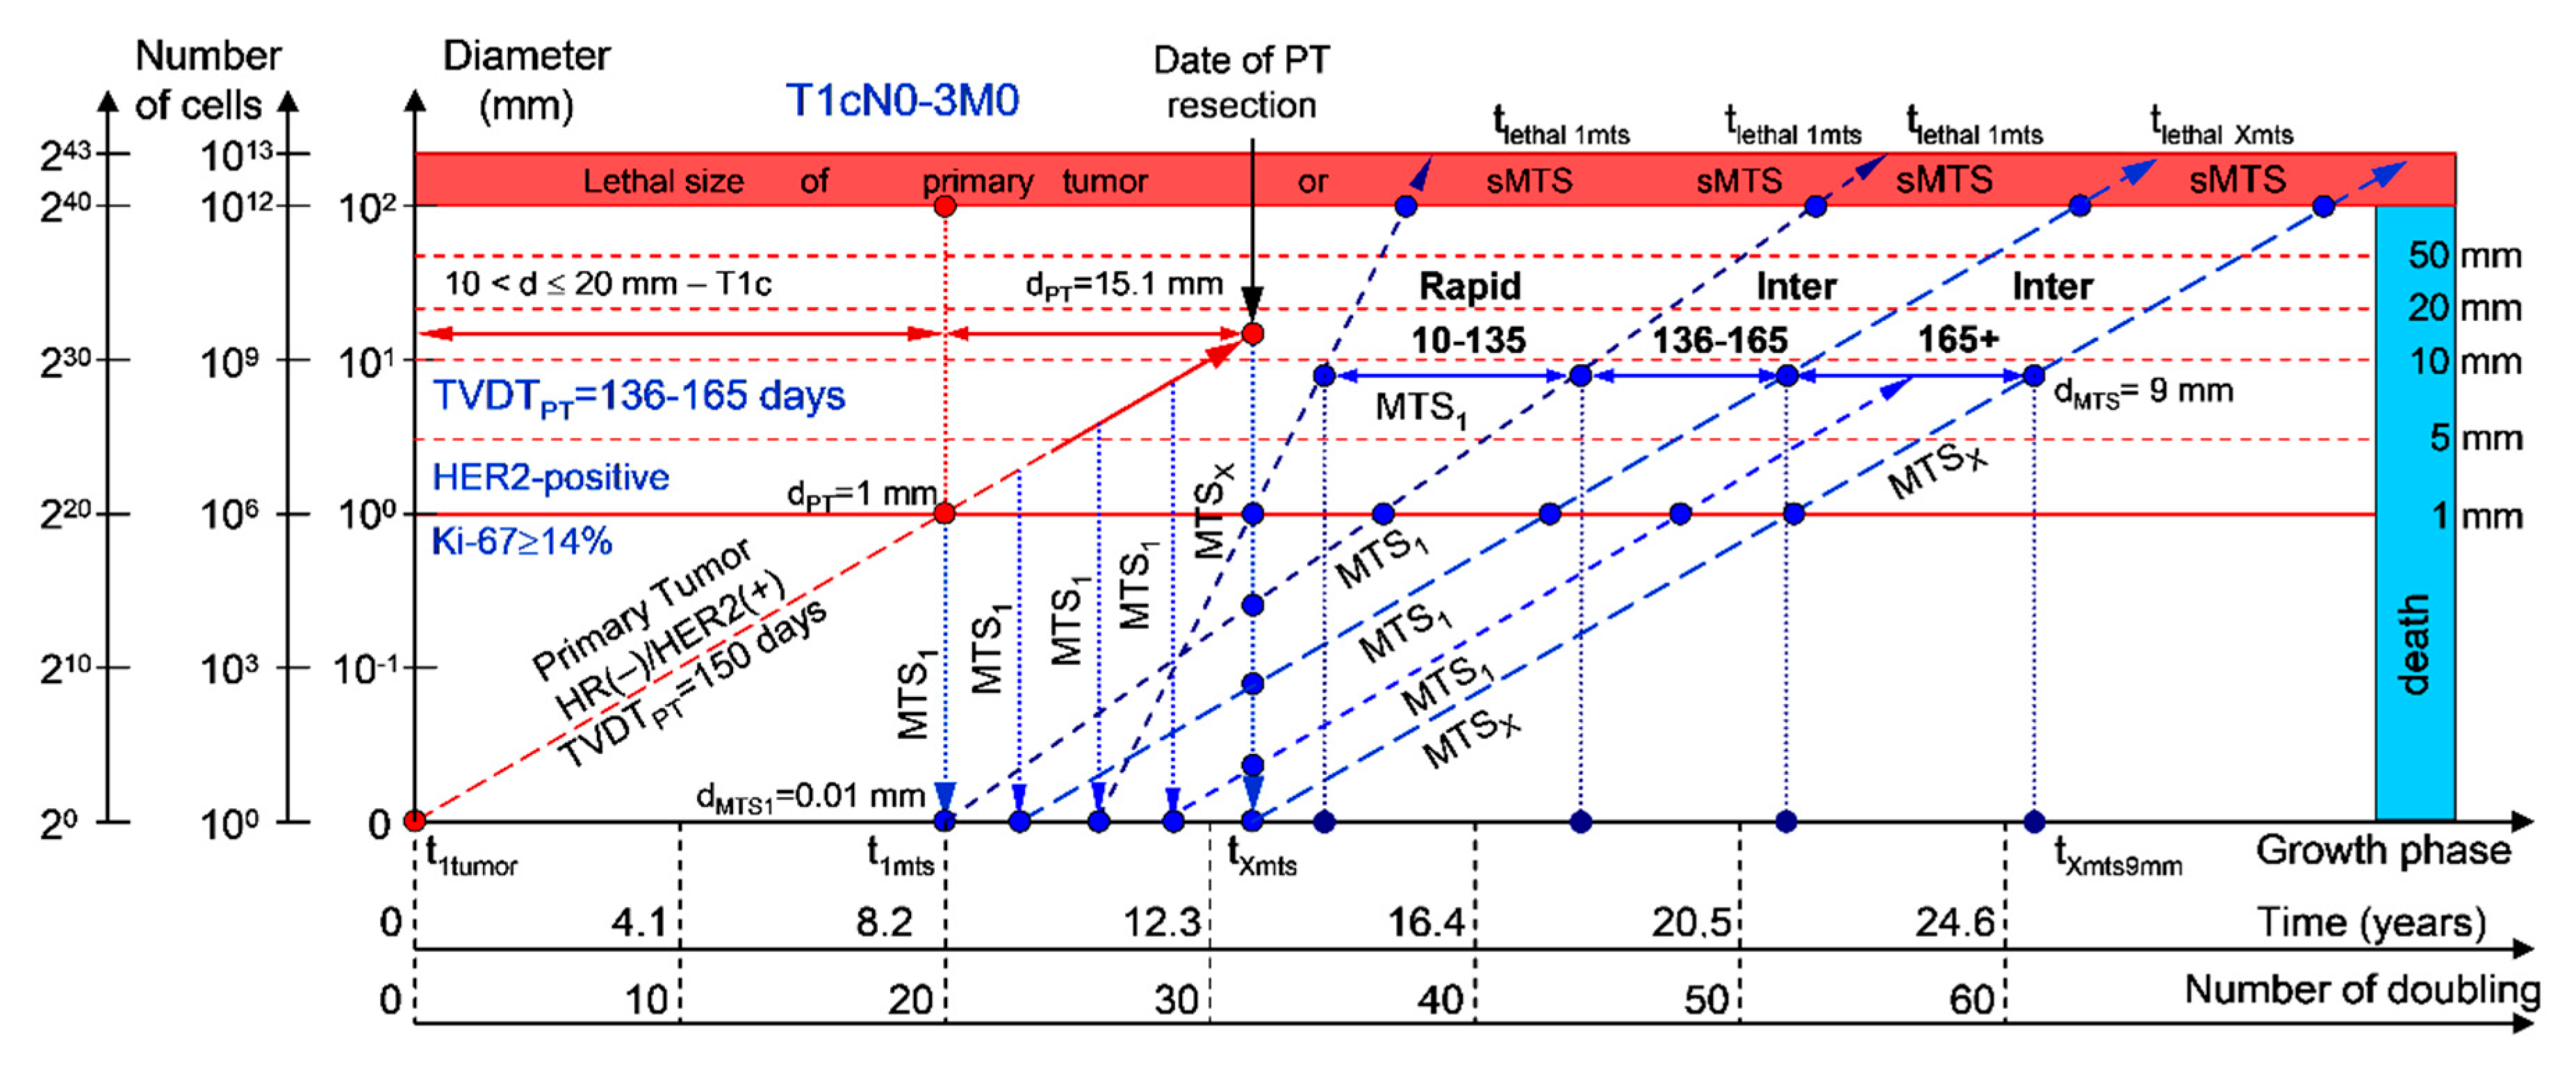
2.1.2. T1cN0-3M0. The Whole Natural History of the PT (HER2-Positive, HR(−)/HER2(+), Ki-67 ≥ 14) and sdMTS

If the diameter of the PT at its resection, dPT, was 15.1 mm (Figure 3; Table 1), and TVDTPT was 136–165 days (intermediate growth rate of PT in patients with HR(−)/HER2(+) (HER2-positive) tumors), then the diameter of the sdMTS at PT resection, dMTS, could be 0.01–1.00 mm. TVDTMTS was equal to 10–135 days for rapid growth rates and/or 136–165 days for intermediate growth rates.
The total period of MTS(1-X) diagnosis may be 13.07 years (Figure 3; Table 1). BC patients with dPT = 15.1 mm and TVDTPT = 136–165 days (T1aN0-3M0) may be considered healthy only after 13.07 years if sdMTSs were not diagnosed in this period.

2.1.3. T1cN0-3M0. The Whole Natural History of the PT (Luminal B, HR(+)/HER2(−), Ki-67 ≥ 14) and sdMTS

If the diameter of the PT at its resection, dPT, was 15.1 mm (Figure 4; Table 1), and the TVDTPT was 166–195 days (intermediate growth rate of PT in patients with the luminal B subtype (HR(+)/HER2(−))), then the diameter of the sdMTS at the PT resection, dMTS, could be 0.01–1.00 mm. TVDTMTS was equal to 10–135 days for rapid growth rates, 136–165 days for intermediate growth rates, and/or 166–195 days for intermediate growth rates.
The total period of MTS(1-X) diagnosis may be 15.49 years (Figure 4; Table 1). BC patients with dPT = 15.1 mm and TVDTPT = 166–195 days (T1aN0-3M0) may be considered healthy only after 15.49 years if sdMTSs were not diagnosed in this period.

2.1.4. T1cN0-3M0. The Whole Natural History of the PT (Luminal B, HR(+)/Her2(+), Ki-67 ≥ 14) and sdMTS

If the diameter of the PT at its resection, dPT, was 15.1 mm (Figure 5; Table 1), and TVDTPT was 196–230 days (slow growth rate of PT in patients with the luminal B subtype (HR(+)/HER2(+))), then the diameter of the sdMTS at PT resection, dMTS, could be 0.01–1.00 mm. TVDTMTS was equal to 10–135 days for rapid growth rates, 136–165 days for intermediate growth rates, 166–195 days for intermediate growth rates, and/or 196–230 days for slow growth rates.
The total period of MTS(1-X) diagnosis may be 18.32 years (Figure 5; Table 1). BC patients with dPT = 15.1 mm and TVDTPT = 196–230 days (T1aN0-3M0) may be considered healthy only after 18.32 years if sdMTSs were not diagnosed in this period.

2.1.5. T1cN0-3M0. The Whole Natural History of the PT (Luminal A, HR(+)/Her2(−), Ki-67 < 14) and sdMTS

If the diameter of the PT at its resection, dPT, was 15.1 mm (Figure 6; Table 1), and TVDTPT was 231–270 days (very slow growth rate of the PT in patients with the luminal A subtype (HR(+)/HER2(−))), then the diameter of the sdMTS at PT resection, dMTS, could be 0.01–1.00 mm. TVDTMTS was equal to 10–135 days for rapid growth rates, 136–165 days for intermediate growth rates, 166–195 days for intermediate growth rates, 196–230 days for slow growth rates, and/or 231–270 days for very slow growth rates.
The total period of MTS(1-X) diagnosis may be 12.87 years (without a 270+ period) (Figure 6; Table 1). BC patients with dPT = 15.1 mm and TVDTPT = 231–270 days (T1aN0-3M0) may be considered healthy only after 12.87 years if sdMTSs were not diagnosed in this period.
The CoMPaS model may help calculate the non-visible MTS-II period (MTS-free period) (Figure 2, Figure 3, Figure 4, Figure 5 and Figure 6; Table 1). These calculated data may help define the minimal number of patient examinations in the non-visible MTS-II period (MTS-free period) depending on the growth rate of the PT and sdMTS (rapidly growing MTS, intermediately growing MTS, and slowly and very slowly growing MTS) (Figure 2, Figure 3, Figure 4, Figure 5 and Figure 6; Table 1).

2.1.6. Examinations during the MTS-Free Period

Therefore, every patient obtains personalized data on an adequate minimal number of examinations during the MTS-free period (non-visible MTS-II period). Examples are as follows:
In the period of a rapid growth rate of sdMTSs (group V with subtype V of BC—triple-negative tumors = HR(−)/HER2(−)), patients must undergo multimodal examination every three months;
In the period of an intermediate growth rate of sdMTSs (group IV with subtype V of BC—HER2-positive tumors = HR(−)/HER2(+)), patients must undergo multimodal examination every five months;
In the period of an intermediate growth rate of sdMTSs (group III with subtype III of BC—luminal B = HR(+)/HER2(−)), patients must undergo multimodal examination every six months;
In the period of a slow growth rate of sdMTSs (group II with subtype II of BC—luminal B = HR(+)/HER2(+)), patients must undergo multimodal examination every eight months;
In the period of a very slow growth rate of sdMTSs (group I with subtype I of BC—luminal A = HR(+)/HER2(−)), patients must undergo multimodal examination every nine months.
Hence, every patient obtains personalized data on an adequate maximal quantity of examinations during this period for the early diagnosis of visible sdMTSs (diameter = 5–9 mm). This may help oncologists start early treatment of small sdMTSs in BC patients (T1-3N0-3M0) and increase the survival of BC patients with sdMTSs (T1-3N0-3M0).
The CoMPaS model calculates the different diagnostic periods of sdMTS in patients with BC (T1-3N0-3M0) and facilitates the understanding of the periods of appearance and materialization of sdMTSs.

2.2. Application of Consolidated Mathematical Growth Model of Primary Tumor and Secondary Distant Metastases (CoMPaS) in Patients with ER/PR/HER2/Ki-67 Subtypes and Stage I/II/III Breast Cancer in Clinical Practices

This mathematical model used to predict the different diagnostic periods of sdMTS in patients with BC may help explain difficult clinical cases of BC patient survival (Figure 2, Figure 3, Figure 4, Figure 5 and Figure 6; Table 1).
The 5–15-year survival of patients with BC depends on the diameter of the PT at resection and TVDTMTS from 10 to 270 days (Figure 2, Figure 3, Figure 4, Figure 5 and Figure 6; Table 1).
Moreover, if patients with BC have a TVDTPT from 10 to 135 days (rapid growth rate of the PT—group V with subtype V of BC—triple-negative tumors = HR(−)/HER2(−)), they have a high risk of death within five years (rapid (TVDTMTS = 10–135 days) growth rate of sdMTSs) (Figure 7 and Figure 8).
If patients with BC have a TVDTPT from 136 to 165 days (intermediate growth rate of PT), they have an intermediate risk of death between five and 10 years (rapid (TVDTMTS = 10–131 days) and/or intermediate (TVDTMTS = 136–165 days) growth rate of sdMTSs).
If patients with BC have a TVDTPT from 166 to 195 days (intermediate growth rate of PT), they have a low risk of death during the period from 10 to 15 years (intermediate (TVDTMTS = 135–165 days or TVDTMTS = 166–195 days) growth rate of sdMTSs).
If patients with BC have a TVDTPT from 196 to 230 days (slow growth rate of PT), they have a low risk of death during the period from 15 to 20 years (intermediate (TVDTMTS = 135–165 days or TVDTMTS = 166–195 days) and/or slow (TVDTMTS = 196–230 days) growth rate of sdMTSs).
If patients with BC have a TVDTPT from 231 to 270 days (very slow growth rate of PT), they have a low risk of death during the period from 20 to 25 years (intermediate (TVDTMTS = 135–165 days or TVDTMTS = 166–195 days) or slow (TVDTMTS = 196–230 days) or very slow (TVDTMTS = 231–270 days) growth rate of sdMTSs).

2.3. Software Tool for Personalized Scheduling of Multimodal Examinations

CoMPaS was updated with a feature that includes a recommendation to have a multimodal examination every 3–4 months k1 years after resection of the PT for k2 years. The recommendation can help oncologists assign early treatment and increase survival.

3. Discussion

3.1. The Relationship between the Size of the PT and an Appearance of the sdMTSs and TVDT

Previous studies showed that (a) the mortality rate depends directly on the PT size and (b) the risk of sdMTS appearance depends directly on the PT size [2,3,4,5,6,7,8,9,10,11,12,13,14,15,16,17,18,19,20,21,36,37,38,39,40,73,74,75,76,77,78,79,80,81,82,83,84,85,86,87,88,89].
In 2010, Holzel et al. [14] and Engel et al. [10,11,15] studied the 10- and 18-year survival from the diagnosis date to PT resection using a large patient group (n = 33475) with regard to the BC stage (parameter T—size of the PT). It was demonstrated that the 10-year mortality linearly increases with the increasing diameter of the PT [15]. In patients with stage pT3, the 18-year mortality was higher than that in patients with stage pT2 and so forth, i.e., the 18-year mortality was much higher in patients with pT3 > pT2 > pT1c > pT1b > pT1a [14].
Hence, a larger PT results in a longer period from the determination of a visible size of the PT to the presurgery size, as well as more time for sdMTS formation before PT resection (Figure 1). In contrast, a smaller PT results in a shorter visible growth period of the PT, as well as less time for sdMTS formation before PT resection (Figure 1) [2,3,4,5,6,7,8,9,10,11,12,13,14,15,20,21,36,37,38,39,40,73,74,75,76,77,78,79,80,81,82,83,84,85,86,87,88,89].
The duration of the non-visible MTS-I period depends on the number of doublings and the TVDT [21]. According to early research results from a sequence of sdMTS appearances in BC patients after multimodal therapy, (1) a total of 75% of the recurrences were found in the first five years, (2) a total of 20% of the recurrences were found between 5–15 years, and (3) the remaining 5% of the recurrences were found in 15–25 years [20]. Therefore, the growth rate of the metastatic tumor can increase 2.2 times that of the PT; meanwhile, the TVDT can decrease 2.2 times [20].

3.2. The Relationship between the TVDT and the Subtypes ER/PR/HER2/Ki-67 of BC

The following observations were made: (1) BC patients with axillary lymph node MTS have a shorter TVDT than BC patients without axillary lymph node MTS (p < 0.05); (2) BC patients positive for the estrogen receptor ER(+) in the PT have a longer TVDT than BC patients negative for the ER(−) in the PT (p < 0.05); (3) BC patients positive for the progesterone receptor PR(+) in the PT have a longer TVDT than BC patients negative for the PR(−) in the PT (p < 0.05); (4) BC patients negative for the Ki-67(−) receptor in the PT have a longer TVDT than BC patients positive for the Ki-67(+) receptor in the PT (p < 0.05); (5) BC patients positive for HER2(+) in the PT have a much longer TVDT than BC patients with triple-negative HR(−)/HER2(−) expression in the PT (p < 0.05) [52]. In other words, this study proposes that BC patients with regional lymph node MTSs have more aggressive BC and a higher risk for the appearance of sdMTSs than patients without regional lymph node MTSs who have a lower risk for the appearance of sdMTSs.
In addition, BC patients with triple-negative (HR(−)/HER2(−)) BC have more aggressive BC and a higher risk of sdMTS appearance than BC patients positive for the progesterone receptor PR(+) who have a lower risk of sdMTS appearance. Ryu et al. [49] reported the following: (1) BC patients positive for ER in the PT (ER(+)) and BC patients positive for HER2 in the PT (HER2(+)) have a much longer TVDT than BC patients with triple-negative expression in the PT (p < 0.05).
The TVDT is one of the most critical parameters used to develop the consolidated mathematical growth model of the PT and sdMTSs of BC (CoMPaS) and to calculate the earliest diagnostic period of sdMTSs in patients with BC [21]. The TVDT, which helped in the development of the mathematical growth model, is a combined quality indicator that reflects the subtype of BC, the proliferative activity, the degree of tumor differentiation, the Nottingham prognostic index (NPI) score, receptor activity (ER(+), ER(−), PR(+), PR(−), HER2(+), HER2(−), Ki-67), and triple-negative BC [47,48,49,50,51,52,53,54,63,64,65,66,67,68,69,70,71,72,90,91,92,93,94,95,96,97,98,99,100]. Hence, patients can obtain a personalized approach for building a schedule of multimodal examinations to detect sdMTSs at the early stage and to start early treatment that can increase the patient’s life [43].

3.3. The Relationship between the Different Diagnostic Periods and Subtypes ER/PR/HER2/Ki-67 of BC

Mathematical models could lead to more precise results and more meaningful prognostic risk scores, and they could integrate the planning of multimodal examinations into outcome-oriented clinical decision-making. While many useful stand-alone models are already in clinical use for forecasting the development of the BC process, the following question remains: will the patient have sdMTSs? If yes, when will the earliest period of the clinical manifestation of sdMTSs occur? If no, when will the patient be considered healthy? To answer these questions, CoMPaS was chosen as the main research tool.
Consequently, this study concentrated on calculating the different diagnostic periods (rapid growth rates in patients with triple-negative tumors (HR(−)/HER2(−)), intermediate growth rates in patients with HER2-positive tumors (HR(−)/HER2(+)), intermediate growth rates in patients with luminal B tumors (HR(+)/HER2(−)), slow growth rates in patients with luminal B tumors (HR(+)/HER2(+)), and very slow growth rates in patients with luminal A tumors (HR(+)/HER2(−))) before the manifestation of sdMTSs (MTSs) after resection of the PT. The broad implementation of the model in everyday oncology requires versatile software platforms that can be easily integrated into existing workflows and information technology (IT) architectures. Therefore, the CoMPaS model was integrated into an iOS application with input parameters such as patient data from examinations and was updated with the possibility of calculating the earliest diagnostic period.
The consolidated mathematical growth model (CoMPaS) and the corresponding software tool may be used for work with the eighth edition American Joint Committee on Cancer (AJCC) prognostic staging system for breast cancer [69,70,71,72].
If a patient has TVDTPT data, the consolidated mathematical growth model (CoMPaS) helps to calculate the data for the new personalized screening program of the sdMTS of breast cancer for each patient with T3N0-3M0 and the ER/PR/HER2/Ki-67 subtypes depending on the natural growth rate of the PT and MTS (the diagnostic periods of rapidly growing sdMTSs (HR(−)/HER2(−)—triple-negative tumors), intermediately growing sdMTSs (HR(−)/HER2(+)—HER2-positive tumors), intermediately growing sdMTSs (luminal B = HR(+)/HER2(−)), slowly growing sdMTSs (luminal B = HR(+)/HER2(+)), and very slowly growing sdMTSs (luminal A = HR(+)/HER2(−))) (Figure 1, Figure 2, Figure 3, Figure 4, Figure 5, Figure 6, Figure 7 and Figure 8; Table 1) [22,23,69,70,71,72,101,102,103,104,105,106].

3.4. The Relationship between the Mortality and the Convalescence and Subtypes ER/PR/HER2/Ki-67 of BC

In patients with triple-negative tumors (HR(−)/HER2(−)), the five-year mortality was higher than that in patients with HER2-positive tumors (HR(−)/HER2(+)) and so forth, i.e., the five-year mortality was much higher in patients with triple-negative tumors (HR(−)/HER2(−)) > patients HER2-positive tumors (HR(−)/HER2(+)) > patients with luminal B subtype tumors (HR(+)/HER2(−)) > patients with luminal B subtype tumors (HR(+)/HER2(+)) > patients with luminal A subtype tumors (HR(+)/HER2(−)) [22,23,24,25,26,69,70,71,72,101,102,103,104,105,106].
Moreover, if sdMTSs did not appear in the different diagnostic periods (rapid growth rate in patients with triple-negative tumors (HR(−)/HER2(−)), intermediate growth rate in patients with HER2-positive tumors (HR(−)/HER2(+)), intermediate growth rate in patients with luminal B subtype tumors (HR(+)/HER2(−)), slow growth rate in patients with luminal B subtype tumors (HR(+)/HER2(+)), and very slow growth rate in patients with luminal A subtype tumors (HR(+)/HER2(−))), the patient could be considered to be almost healthy, and she could be classified into the survival group. The consolidated mathematical growth model of the PT and sdMTSs of BC (CoMPaS) can calculate the total period of MTS(1-X) diagnosis and determine the time when patients may be considered healthy (Figure 1, Figure 2, Figure 3, Figure 4, Figure 5, Figure 6, Figure 7 and Figure 8; Table 1).
As a consequence, oncologists can determine the causes of BC appearance considering the knowledge of when the first tumor cell appeared, which can lead to the development of prevention methods. The relationship between the PT and sdMTSs can provide a deeper understanding of the BC process [2,3,4,5,6,7,8,9,10,11,12,13,14,15,20,21,36,37,38,39,40,41,73,74,75,76,77,78,79,80,81,82,83,84,85,86,87,88,89]. The calculation of the earliest diagnostic period can help with the assignment of early treatment and increase survival [82,83,84,85,86,87,88,89,100]. Clinics can plan procedures with optimal usage of resources and an understanding of when a patient will come to the hospital.

4. Materials and Methods

4.1. Consolidated Mathematical Growth Model of Primary Tumor and Secondary Distant Metastases (CoMPaS)

To describe the growth processes of PTs and sdMTSs at stages I and II, the CoMPaS model was developed. A detailed description and the limitations of CoMPaS, as well as the influence of the appearance of the first sdMTS on the survival prognosis of a patient, were provided previously. Figure 1 demonstrates the model in terms of the whole natural history of PT and sdMTS growth [21].
The whole natural growth history of the PT and sdMTSs includes the non-visible growth period of the PT, the visible growth period of the PT, the non-visible growth period of the sdMTSs, and the visible growth period of the sdMTSs [21]. The non-visible period of PT growth is from the appearance of the first tumor cell (diameter = 10 µm) until it reaches a visible size (diameter = 1–5 mm) [21]. The visible period of PT growth is from the time that it reaches a visible size (diameter = 1–5 mm) up to the time that it reaches pre-surgery size. The non-visible period of MTS growth can be calculated as the period from diagnosis (date of PT resection) to the time that at least one MTS reaches a visible size (diameter = 1–5 mm) [21]. The visible period of MTS growth can be calculated as the period from diagnosis of the visible size (diameter = 1–5 mm) to when it reaches lethal size (death) [21]. Thus, descriptions of the whole natural history of BC require building a consolidated mathematical BC growth model of the PT and secondary distant MTSs [21].
The following updated formulas illustrate the mathematical side of the CoMPaS [21]:
d V d t = log 2 D T V , t D T     log 2 ( θ D T log 2 ) V 0 ,
d V d t = θ log V , t > D T     log 2 ( θ D T log 2 V 0 ) ,
V ( t = 0 ) = V 0 ,
60 = log 2 N p t + log 2 N m t s I I + log 2 N m t s I I v i s ,
T V D T n o n = T V D T v i s = log 2 d a y s N m t s I I + log 2 d a y s N m t s I I v i s log 2 N m t s I I + log 2 N m t s I I v i s ,
where log 2 D T is the fraction of proliferative cell times, θ drives the linear phase ( θ = 1 ), Npt is the number of PT doublings, NmtsII is the number of doublings for the non-visible growth period of sdMTS, Nmts-vis is the number of doublings for the visible growth period of sdMTS, TVDT is the tumor volume doubling time, and 60 doublings represent the whole nature growth history of the PT and sdMTSs.
CoMPaS is based on an exponential growth model that consists of nonlinear and linear deterministic equations [21]. Available studies based on clinical data demonstrate exponential PT growth in patients with BC [36,37,38,39,44,45,46,47]. The growth rate of the PT in patients with BC is calculated via TVDTPT [36,37,38,39,44,45,46,47]. An ultrasound-based diagnosis allows a better detection of the changes in PT sizes in patients with BC to calculate TVDTPT [48,49,50,51,52,53,54].
The appearance of the first metastatic cell of the first sdMTS coincides with the 20th doubling of the PT of BC, which allows defining the non-visible growth period of the sdMTS and the initial period of sdMTS manifestation [7,14,15,21,55,56]. The appearance of the last metastatic cell of sdMTS coincides with the date of BC PT resection [21].
Available studies based on clinical data demonstrate exponential sdMTS growth between 1 mm and 60 mm in patients with BC [20,21,55,56,57,58,59,60,61,62]. The growth rate of sdMTSs in patients with BC is calculated via TVDTMTS [57,58,59,60,61,62]. An ultrasound diagnosis allows a better detection of the changes in sdMTS sizes (liver, subcutaneous MTSs) in patients with BC to calculate TVDTPT [48,49,50,51,52,53,54]. A computed tomography (CT) scan and magnetic resonance imaging (MRI) scan also allow a better detection of the changes in sdMTS sizes (lungs, brain) in patients with BC to calculate TVDTPT [48,49,50,51,52,53,54].
The growth rate of sdMTSs in patients with BC (TVDTMTS) may correspond to (equal) the growth rate of the PT (TVDTPT) or may be 2–2.2–times higher [2,3,4,5,6,7,55,56]. The growth rate of secondary distant MTSs may be a rapid growth rate, an intermediate growth rate, or a slow growth rate [2,3,4,6,7]. The growth rate of the PT and sdMTSs in patients with BC can determine the survival forecast of these patients [2,3,4,5,6,7,41,42,62,63,64,65,66,67,68].
The model describes the following: (a) PT growth from 1 mm up to 60 mm (exponential growth of the PT) without/with MTSs in the lymph nodes; (b) a TVDTPT from 10 days to 310 days; (c) sdMTSs growth from 1 mm up to 60 mm (exponential growth of the sdMTSs); (d) a TVDTMTS from 10 days to 310 days. TVDTMTS must be bigger than 10 days, but TVDTMTS must be less than or equal to TVDTPT.

4.2. A Mathematical Model to Predict the Earliest Diagnostic Periods of Secondary Distant Metastases in Patients with ER/PR/HER2/Ki-67 Subtypes of Breast Cancer

The growth period of sdMTSs includes the non-visible growth period of sdMTSs, the visible growth period of sdMTSs, diagnostics, treatment, and patient death [21]. The non-visible growth period of sdMTSs consists of two periods: (1) the non-visible growth period of the sdMTS from the appearance of the first metastatic cell of the sdMTS to the date of PT resection (non-visible sdMTS(1)-I), and (2) the non-visible growth period of the sdMTS from the diagnosis (the date of PT resection) to the time when the visible size of at least one sdMTS can be diagnosed (non-visible MTS(1)-II) (Figure 1). It should be noted that the non-visible growth period of sdMTS(1)-II is described as the MTS-free period in other papers.
It is difficult to predict which metastatic cell (from the PT: 1 mm, 2 mm or 3 mm) will be the initial point of sdMTS growth (Figure 1). Considering prior assumptions, it is relevant to set the initial point as the non-visible MTS(1-X) (years) and the progression as the Period of MTS(1-X) diagnosis for the critical periods of the earliest diagnosis of the sdMTS (Figure 1).
The natural growth rate of the sdMTS may be similar to the natural growth rate of the PT of BC (Figure 1).
PTs of breast cancer were divided into five different groups depending on the ER/PR/HER2/Ki-67 subtypes and growth rates [49,50,52,53,54]:
Group I with a very slow growth rate of the PT, with subtype I of BC—luminal A = HR(+)/HER2(−) for HR-positive (ER+/PR+, ER+/PR−, or ER−/PR+) tumors, Ki-67 < 14% (TVDTPT = 231–270 days);
Group II with a slow growth rate of the PT, with subtype II of BC—luminal B = HR(+)/HER2(+) for HR-positive (ER+/PR+, ER+/PR−, or ER−/PR+) and Her2-positive tumors, Ki-67 ≥ 14% (TVDTPT = 196–230 days);
Group III with an intermediate growth rate of the PT, with subtype III of BC—luminal B = HR(+)/HER2(−) for HR-positive (ER+/PR+ or ER+/PR− or ER−/PR+) tumors, Ki-67 ≥ 14% (TVDTPT = 166–195 days);
Group IV with an intermediate growth rate of the PT, with subtype IV of BC—HR(−)/HER2(+) for HER2-positive tumors, Ki-67 ≥ 14% (TVDTPT = 136–165 days);
Group V with a rapid growth rate of the PT with subtype V of BC—HR(−)/HER2(−) for triple-negative tumors, Ki-67 ≥ 14% (TVDTPT = 10–135 days).
However, the growth rate of the secondary distant MTS may be higher than the natural growth rate of the BC PT [2,3,4,6,7]. For the first time, the growth rates of secondary distant MTSs were divided into five groups depending on the ER/PR/HER2/Ki-67 subtypes and growth rates [49,50,52,53,54]: group I with subtype I of BC (luminal A = HR(+)/HER2(−)) for sdMTSs with very slow growth rates (TVDTMTS = 231–270 days), group II with subtype II of BC (luminal B = HR(+)/HER2(+)) for sdMTSs with slow growth rates (TVDTMTS = 196–230 days), group III with subtype III of BC (luminal B = HR(+)/HER2(−)) for sdMTSs with intermediate growth rates (TVDTMTS = 166–195 days), group IV with subtype IV of BC (HR(−)/HER2(+)—HER2-positive tumors) for sdMTSs with intermediate growth rates (TVDTMTS = 136–165 days), and group V with subtype V (HR(−)/HER2(−)—triple-negative tumors) of BC for sdMTSs with rapid growth rates (TVDTMTS = 10–135 days) [2,3,4,6,7,20,22,23,24,25,26,40,47,49,52,53,54,69,70,71,72].

4.3. Limitations

The model does not describe or explain an appearance of the secondary distant MTSs (M1) in patients with stage T4N0-3M0.

4.4. Implementation Software

The application was built using Swift and references CoMPaS, where the input data consist of the following fields that a user (doctor) must fill: the first diagnostic data (date of diagnostics, diameter of the PT in mm) and the second diagnostic data (date of diagnostics, diameter of the PT in mm, subtype). As a result, the output data provide the following: prognosis (the category of prognosis: favorable, mid-favorable, unfavorable; the number of months before the manifestation of the sdMTSs) [21].

4.5. Calculation Method

The obtained results were calculated on a personal computer (PC) using Python 3.8.

5. Conclusions

The implementation of CoMPaS and the corresponding software tool offers fascinating prospects for personalized diagnostics and early treatment by detecting the earliest diagnostic period of sdMTSs in BC patients (T1-3N0-3M0 and ER/PR/HER2/Ki-67 subtypes) with regard to the eighth edition AJCC prognostic staging system for breast cancer and the growth rate of the PT and sdMTSs in BC [22,23,24,25,26,69,70,71,72,101,102,103,104,105,106]. Such mathematics-based approaches could better identify high-risk patients in the future and help prevent unnecessary treatments. Therefore, this approach could integrate diagnostic oncology more closely with outcome-oriented clinical decisions by increasing the survival of BC patients with sdMTSs (T1-3N0-3M0 and ER/PR/HER2/Ki-67 subtypes). These kinds of gains in efficiency will become increasingly important, given the growing demand for less toxic treatments and the discovery of almost healthy patients.

6. Patents

The predictor of the whole natural history of breast cancer (COMBREC): Certificate of the state registration of the computer program No. 2018612104. Date of the state registration in the register of computer programs: 12.02.2018. Authors: Neznanov AA, Tyuryumina EYa.

Author Contributions

Conceptualization, E.Y.T.; methodology, E.Y.T., A.A.N., and J.L.T.; software, E.Y.T.; validation, J.L.T.; formal analysis, A.A.N.; investigation, E.Y.T., A.A.N., and J.L.T.; resources, A.A.N.; data curation, E.Y.T. and A.A.N.; writing—original draft preparation, E.Y.T.; writing—review and editing, E.Y.T., A.A.N., and J.L.T.; visualization, E.Y.T.; supervision, A.A.N. and J.L.T.; project administration, E.Y.T.; funding acquisition, A.A.N. All authors read and agreed to the published version of the manuscript.

Funding

The article/book/book chapter was prepared within the framework of the HSE University Basic Research Program and funded by the Russian Academic Excellence Project “5–100”.

Conflicts of Interest

The authors declare no conflict of interest.

References

  1. Shah, R.; Rosso, K.; Nathanson, S.D. Pathogenesis, prevention, diagnosis and treatment of breast cancer. World J. Clin. Oncol. 2014, 5, 283–298. [Google Scholar] [CrossRef] [PubMed]
  2. Slack, N.H.; Blumenson, L.E.; Bross, I.D. Therapeutic implications from a mathematical model characterizing the course of breast cancer. Cancer 1969, 24, 960–971. [Google Scholar] [CrossRef]
  3. Pearlman, A.W. Breast cancer: Influence of growth rate on prognosis and treatment evaluation. Cancer 1976, 38, 1826–1833. [Google Scholar] [CrossRef]
  4. Koscielny, S.; Tubiana, M.; Valleron, A.-J. A simulation model of the natural history of human breast cancer. Br. J. Cancer. 1985, 52, 515–524. [Google Scholar] [CrossRef]
  5. Koscielny, S.; Le, M.G.; Tubiana, M. The natural history of human breast cancer. The relationship between involvement of axillary lymph nodes and the initiation of distant metastases. Br. J. Cancer. 1989, 59, 775–782. [Google Scholar] [CrossRef] [Green Version]
  6. Tubiana, M.; Courdi, A. Cell proliferation kinetics in human solid tumors: Relation to probability of metastatic dissemination and long-term survival. Radiother. Oncol. 1989, 15, 1–18. [Google Scholar] [CrossRef]
  7. Friberg, S.; Mattson, S. On the growth rates of human malignant tumors: Implications for medical decision making. J. Surg. Oncol. 1997, 65, 284–297. [Google Scholar] [CrossRef]
  8. Michaelson, J.S.; Silverstein, M.; Wyatt, J.; Weber, G.; Moore, R.; Halpern, E.; Kopans, D.B.; Hughes, K. Predicting the survival of patients with breast carcinoma using tumor size. Cancer 2002, 95, 713–723. [Google Scholar] [CrossRef]
  9. Michaelson, J.S.; Silverstein, M.; Sgroi, D.; Cheongsiatmoy, J.A.; Taghian, A.; Powell, S.; Hughes, K.; Comegno, A.; Tanabe, K.K.; Smith, B. The effect of tumor size and lymph node status on breast carcinoma lethality. Cancer 2003, 98, 2133–2143. [Google Scholar] [CrossRef]
  10. Engel, J.; Eckel, R.; Aydemir, U.; Aydemir, S.; Kerr, J.; Schlesinger-Raab, A.; Dirschedl, P.; Hölzel, D. Determinants and prognoses of locoregional and distant progression in breast cancer. Int. J. Radiat. Oncol. Biol. Phys. 2003, 55, 1186–1195. [Google Scholar] [CrossRef]
  11. Engel, J.; Eckel, R.; Kerr, J.; Schmidt, M.; Fürstenberger, G.; Richter, R.; Sauer, H.; Senn, H.J.; Hölzel, D. The process of metastasisation for breast cancer. Eur. J. Cancer 2003, 39, 1794–1806. [Google Scholar] [CrossRef]
  12. Klein, C.A.; Hölzel, D. Systemic cancer progression and tumor dormancy: Mathematical models meet single cell genomics. Cell Cycle 2006, 5, 1788–1798. [Google Scholar] [CrossRef] [PubMed] [Green Version]
  13. Michaelson, J.S.; Chen, L.L.; Silverstein, M.J.; Cheongsiatmoy, J.A.; Mihm, M.C., Jr.; Sober, A.J.; Tanabe, K.K.; Smith, B.L.; Younger, J. Why cancer at primary site and in the lymph nodes contributes to the risk of cancer death. Cancer 2009, 115, 5084–5094. [Google Scholar] [CrossRef]
  14. Hölzel, D.; Eckel, R.; Emeny, R.T.; Engel, J. Distant metastases do not metastasize. Cancer Metastasis Rev. 2010, 29, 737–750. [Google Scholar] [CrossRef] [PubMed]
  15. Engel, J.; Emeny, R.T.; Hölzel, D. Positive lymph nodes do not metastasize. Cancer Metastasis Rev. 2012, 31, 235–246. [Google Scholar] [CrossRef] [PubMed]
  16. Clare, S.E.; Nakhlis, F.; Panetta, J.C. Molecular biology of breast cancer metastasis: The use of mathematical models to determine relapse and to predict response to chemotherapy in breast cancer. Breast Cancer Res. 2000, 2, 430–435. [Google Scholar] [CrossRef] [Green Version]
  17. Withers, H.R.; Lee, S.P. Modeling growth kinetics and statistical distribution of oligometastases. Semin. Radiat. Oncol. 2006, 16, 111–119. [Google Scholar] [CrossRef]
  18. Weedon-Fekjaer, H.; Lindqvist, B.H.; Vatten, L.J.; Aalen, O.O.; Tretli, S. Breast cancer tumor growth estimated through mammography screening data. Breast Cancer Res. 2008, 10, R41. [Google Scholar] [CrossRef] [Green Version]
  19. Molina-Pena, R.; Alvarez, M.M. A simple mathematical model based on the cancer stem cell hypothesis suggests kinetic commonalities in solid tumor growth. PLoS ONE 2012, 7, e26233. [Google Scholar] [CrossRef] [Green Version]
  20. Coumans, F.A.; Siesling, S.; Terstappen, L.W. Detection of cancer before distant metastases. BMC Cancer 2013, 13, 283. [Google Scholar] [CrossRef] [Green Version]
  21. Tyuryumina, E.; Neznanov, A. Consolidated mathematical growth model of the primary tumor and sdMTS of breast cancer (CoMPaS). PLoS ONE 2018, 13, e0200148. [Google Scholar] [CrossRef] [PubMed] [Green Version]
  22. Parise, C.A.; Caggiano, V. Breast cancer survival defined by the ER/PR/HER2 subtypes and a surrogate classification according to tumor grade and immunohistochemical biomarkers. J. Cancer Epidemiol. 2014, 2014, 469251. [Google Scholar] [CrossRef] [PubMed]
  23. Chavez-MacGregor, M.; Mittendorf, E.A.; Clarke, C.A.; Lichtensztajn, D.Y.; Hunt, K.K.; Giordano, S.H. Incorporating tumor characteristics to the American joint committee on cancer breast cancer staging system. Oncologist 2017, 22, 1292–1300. [Google Scholar] [CrossRef] [PubMed] [Green Version]
  24. Howlader, N.; Cronin, K.A.; Kurian, A.W.; Andridge, R. Differences in breast cancer survival by molecular subtypes in the United States. Cancer Epidemiol. Biomark. Prev. 2018, 27, 619–626. [Google Scholar] [CrossRef] [Green Version]
  25. Harbeck, N.; Penault-Llorca, F.; Cortes, J.; Gnant, M.; Houssami, N.; Poortmans, P.; Ruddy, K.; Tsang, J.; Cardoso, F. Breast cancer. Nat. Rev. Dis. Primers 2019, 5, 66. [Google Scholar] [CrossRef]
  26. Lawrenson, R.; Lao, C.; Campbell, I.; Harvey, V.; Seneviratne, S.; Elwood, M.; Sarfati, D.; Kuper-Hommel, M. The impact of different tumor subtypes on management and survival of New Zealand women with stage I-III breast cancer. N. Z. Med. J. 2018, 131, 51–60. [Google Scholar]
  27. Lafranconi, A.; Pylkkanen, L.; Deandrea, S.; Bramesfeld, A.; Lerda, D.; Neamtiu, L.; Saz-Parkinson, Z.; Posso, M.; Rigau, D.; Sola, I.; et al. Intensive follow-up for women with breast cancer: Review of clinical, economic and patient’s preference domains through evidence to decision framework. Health Qual. Life Outcomes 2017, 15, 206. [Google Scholar] [CrossRef] [Green Version]
  28. Smith, T.J. Breast cancer surveillance guidelines. J. Oncol. Pract. 2013, 9, 65–67. [Google Scholar] [CrossRef] [Green Version]
  29. Puglisi, F.; Fontanella, C.; Numico, G.; Sini, V.; Evangelista, L.; Monetti, F.; Gori, S.; Del Mastro, L. Follow-up of patients with early breast cancer: Is it time to rewrite the story? Crit. Rev. Oncol. Hematol. 2014, 91, 130–141. [Google Scholar] [CrossRef] [Green Version]
  30. Stevens, G.M.; Weigen, J.F. Mammography survey for breast cancer detection. A 2-year study of 1,223 clinically negative asymptomatic women over 40. Cancer. 1966, 19, 51–59. [Google Scholar] [CrossRef]
  31. Khatcheressian, J.L.; Wolff, A.C.; Smith, T.J.; Grunfeld, E.; Muss, H.B.; Vogel, V.G.; Halberg, F.; Somerfield, M.R.; Davidson, N.E. American Society of Clinical Oncology 2006 updates of the breast cancer follow-up and management guidelines in the adjuvant setting. J. Clin. Oncol. 2006, 24, 5091–5097. [Google Scholar] [CrossRef] [PubMed]
  32. Khatcheressian, J.L.; Hurley, P.; Bantug, E.; Esserman, L.J.; Grunfeld, E.; Halberg, F.; Hantel, A.; Henry, N.L.; Muss, H.B.; Smith, T.J.; et al. Breast cancer follow-up and management after primary treatment: American Society of Clinical Oncology clinical practice guideline update. J. Clin. Oncol. 2013, 31, 961–965. [Google Scholar] [CrossRef] [PubMed]
  33. Collins, V.P.; Loeffler, R.K.; Tivey, H. Observations on growth rates of human tumors. Am. J. Roentgen. 1956, 76, 988–1000. [Google Scholar]
  34. Schwartz, M. A biomathematical approach to clinical tumor growth. Cancer 1961, 14, 1272–1294. [Google Scholar] [CrossRef]
  35. Bloom, H.J.; Richarson, W.W.; Harries, E.J. Natural history of untreated breast cancer (1805–1933). Comparison of untreated and treated cases according to histological grade of malignancy. Br. Med. J. 1962, 2, 213–221. [Google Scholar] [CrossRef] [PubMed] [Green Version]
  36. Skipper, H.E. Kinetics of mammary tumor cell growth and implications for therapy. Cancer 1971, 28, 1479–1499. [Google Scholar] [CrossRef]
  37. Silvestrini, R.; Sanfilippo, O.; Tedesco, G. Kinetics of human mammary carcinomas and their correlation with the cancer and the host characteristics. Cancer 1974, 34, 1252–1258. [Google Scholar] [CrossRef]
  38. Lundgren, B. Observations on growth rate of breast carcinomas and its possible implications for lead time. Cancer 1977, 40, 1722–1725. [Google Scholar] [CrossRef]
  39. Spratt, J.A.; von Fournier, D.; Spratt, J.S.; Weber, E.E. Mammographic assessment of human breast cancer growth and duration. Cancer 1993, 71, 2020–2026. [Google Scholar] [CrossRef]
  40. Moiseenko, V.M. The natural history of breast cancer growth. Pract. Oncol. 2002, 3, 6–14. (In Russian) [Google Scholar]
  41. Rodriguez-Brenes, I.A.; Komarova, N.L.; Wodarz, D. Tumor growth dynamics: Insights into evolutionary processes. Trends Ecol. Evol. 2013, 28, 597–604. [Google Scholar] [CrossRef] [PubMed]
  42. Benzekry, S.; Lamont, C.; Beheshti, A.; Tracz, A.; Ebos, J.M.; Hlatky, L.; Hahnfeldt, P. Classical mathematical models for description and prediction of experimental tumor growth. PLoS Comput. Biol. 2014, 10, e1003800. [Google Scholar] [CrossRef] [PubMed] [Green Version]
  43. Wu, X.; Ye, Y.; Barcenas, C.H.; Chow, W.H.; Meng, Q.H.; Chavez-MacGregor, M.; Hildebrandt, M.A.; Zhao, H.; Gu, X.; Deng, Y.; et al. Personalized prognostic prediction models for breast cancer recurrence and survival incorporating multidimensional data. J. Natl. Cancer Inst. 2017, 109, djw314. [Google Scholar] [CrossRef] [PubMed] [Green Version]
  44. Gershon-Cohen, J.; Berger, S.M.; Klickstein, H.S. Roentgenography of breast cancer moderating concept of “Biologic predeterminism”. Cancer 1963, 16, 961–964. [Google Scholar] [CrossRef]
  45. Kusama, S.; Spratt, J.S., Jr.; Donegan, W.L.; Watson, F.R.; Cunningham, C. The cross rates of growth of human mammary carcinoma. Cancer 1972, 30, 594–599. [Google Scholar] [CrossRef]
  46. von Fournier, D.V.; Weber, E.; Hoeffken, W.; Bauer, M.; Kubli, F.; Barth, V. Growth rate of 147 mammary carcinomas. Cancer 1980, 45, 2198–2207. [Google Scholar] [CrossRef]
  47. Peer, P.G.; van Dijck, J.A.; Hendriks, J.H.; Holland, R.; Verbeek, A.L. Age-dependent growth rate of primary breast cancer. Cancer 1993, 71, 3547–3551. [Google Scholar] [CrossRef]
  48. Gruber, I.V.; Rueckert, M.; Kagan, K.O.; Staebler, A.; Siegmann, K.C.; Hartkopf, A.; Wallwiener, D.; Hahn, M. Measurement of tumor size with mammography, sonography and magnetic resonance imaging as compared to histological tumor size in primary breast cancer. BMC Cancer 2013, 13, 328. [Google Scholar] [CrossRef] [Green Version]
  49. Ryu, E.B.; Chang, J.M.; Seo, M.; Kim, S.A.; Lim, J.H.; Moon, W.K. Tumor volume doubling time of molecular breast cancer subtypes assessed by serial breast ultrasound. Eur. Radiol. 2014, 24, 2227–2235. [Google Scholar] [CrossRef]
  50. Yoo, T.K.; Min, J.W.; Kim, M.K.; Lee, E.; Kim, J.; Lee, H.B.; Kang, Y.J.; Kim, Y.G.; Moon, H.G.; Moon, W.K.; et al. In vivo tumor growth rate measured by US in preoperative period and long term disease outcome in breast cancer patients. PLoS ONE 2015, 10, e0144144. [Google Scholar] [CrossRef]
  51. Cortadellas, T.; Argacha, P.; Acosta, J.; Rabasa, J.; Peiró, R.; Gomez, M.; Rodellar, L.; Gomez, S.; Navarro-Golobart, A.; Sanchez-Mendez, S.; et al. Estimation of tumor size in breast cancer comparing clinical examination, mammography, ultrasound and MRI–correlation with the pathological analysis of the surgical specimen. Gland Surg. 2017, 6, 330–335. [Google Scholar] [CrossRef] [PubMed] [Green Version]
  52. Zhang, S.; Ding, Y.; Zhou, Q.; Wang, C.; Wu, P.; Dong, J. Correlation factors analysis of breast cancer tumor volume doubling time measured by 3D-Ultrasound. Med. Sci. Monit. 2017, 23, 3147–3153. [Google Scholar] [CrossRef] [PubMed] [Green Version]
  53. Nakashima, K.; Uematsu, T.; Takahashi, K.; Nishimura, S.; Tadokoro, Y.; Hayashi, T.; Sugino, T. Does breast cancer growth rate really depend on tumor subtype? Measurement of tumor doubling time using serial ultrasonography between diagnosis and surgery. Breast Cancer 2019, 26, 206–214. [Google Scholar] [CrossRef] [PubMed]
  54. Lee, S.H.; Kim, Y.S.; Han, W.; Ryu, H.S.; Chang, J.M.; Cho, N.; Moon, W.K. Tumor growth rate of invasive breast cancers during wait times for surgery assessed by ultrasonography. Medicine (Baltim.) 2016, 95, e4874. [Google Scholar] [CrossRef] [PubMed]
  55. Friberg, S. On the growth rates of human malignant tumors: Implications for medical decision making. J. Oncol. 2005, 55, 1–22. [Google Scholar]
  56. Klein, C.A. Parallel progression of primary tumors and metastases. Nat. Rev. Cancer. 2009, 9, 302–312. [Google Scholar] [CrossRef]
  57. Spratt, J.S.; Spratt, T.L. Rates of growth of pulmonary metastases and host survival. Ann. Surg. 1964, 159, 61–171. [Google Scholar] [CrossRef]
  58. Philippe, E.; Le Gal, Y. Growth of 78 recurrent mammary cancers. Cancer 1968, 21, 461–467. [Google Scholar] [CrossRef]
  59. Lee, Y.T.; Spratt, J.S., Jr. Rate of growth of soft tissue metastases of breast cancer. Cancer 1972, 29, 344–348. [Google Scholar] [CrossRef]
  60. Gullino, P.M. Natural history of breast cancer. Progression from hyperplasia to neoplasia as predicted by angiogenesis. Cancer 1977, 39, 2697–2703. [Google Scholar] [CrossRef]
  61. Retsky, M.W.; Swartzendruber, D.E.; Wardwell, R.H.; Bame, P.D. Is Gompertzian or exponential kinetics a valid description of individual human cancer growth? Med. Hypotheses 1990, 33, 95–106. [Google Scholar] [CrossRef]
  62. Spratt, J.S.; Kaltenbach, M.L.; Spratt, J.A. Cytokinetic definition of acute and chronic breast cancer. Cancer Res. 1977, 37, 226–230. [Google Scholar] [PubMed]
  63. Boyd, N.F.; Meakin, J.W.; Hayward, J.L.; Brown, T.C. Clinical estimation of the growth rate of breast cancer. Cancer 1981, 48, 1037–1042. [Google Scholar] [CrossRef]
  64. Galante, E.; Gallus, G.; Guzzon, A.; Bono, A.; Bandieramonte, G.; Di Pietro, S. Growth rate of primary breast cancer and prognosis: Observations on a 3- to 7-year follow-up in 180 breast cancers. Br. J. Cancer. 1986, 54, 833–836. [Google Scholar] [CrossRef] [PubMed]
  65. Kuroishi, T.; Tominaga, S.; Morimoto, T.; Tashiro, H.; Itoh, S.; Watanabe, H.; Fukuda, M.; Ota, J.; Horino, T.; Ishida, T.; et al. Tumor growth rate and prognosis of breast cancer mainly detected by mass screening. Jpn. J. Cancer Res. 1990, 81, 454–462. [Google Scholar] [CrossRef]
  66. Spratt, J.A.; von Fournier, D.; Spratt, J.S.; Weber, E.E. Decelerating growth and human breast cancer. Cancer 1993, 71, 2013–2019. [Google Scholar] [CrossRef]
  67. Friberg, S.; Nyström, A. Cancer metastases: Early dissemination and late recurrences. Cancer Growth Metastasis 2015, 8, 43–49. [Google Scholar] [CrossRef] [Green Version]
  68. Tabbane, F.; Bahi, J.; Rahal, K.; May, A.E.; Riahi, M.; Cammoun, M.; Hechiche, M.; Jaziri, M.; Mourali, N. Inflammatory symptoms in breast cancer. Correlations with growth rate, clinicopathologic variables, and evolution. Cancer 1989, 64, 2081–2089. [Google Scholar] [CrossRef]
  69. Hortobagyi, G.; Connolly, J.L.; D’Orsi, C.J.; Edge, S.B.; Mittendorf, E.A.; Rugo, H.S.; Solin, L.J.; Weaver, D.L.; Winchester, D.J.; Giuliano, A. Breast. In AJCC Cancer Staging Manual, 8th ed.; Amin, M.B., Edge, S., Greene, F., Byrd, D.R., Brookland, R.K., Washington, M.K., Gershenwald, J.E., Compton, C.C., Hess, K.R., Sullivan, D.C., et al., Eds.; American Joint Committee on Cancer (AJCC): New York, NY, USA; Springer: Berlin/Heidelberg, Germany, 2017; pp. 587–628. ISBN 978-3-319-40617-6. [Google Scholar] [CrossRef]
  70. Hortobagyi, G.N.; Edge, S.B.; Giuliano, A. New and important changes in the TNM staging system for breast cancer. Am. Soc. Clin. Oncol. Educ. Book 2018, 38, 457–467. [Google Scholar] [CrossRef]
  71. Zhang, J.; Zhao, B.; Jin, F. The assessment of 8th edition AJCC prognostic staging system and a simplified staging system for breast cancer: The analytic results from the SEER database. Breast J. 2019, 25, 838–847. [Google Scholar] [CrossRef]
  72. He, J.; Tsang, J.Y.; Xu, X.; Li, J.; Li, M.; Chao, X.; Xu, Y.; Luo, R.; Tse, G.M.; Sun, P. AJCC 8th edition prognostic staging provides no better discriminatory ability in prognosis than anatomical staging in triple negative breast cancer. BMC Cancer 2020, 20, 18. [Google Scholar] [CrossRef] [PubMed]
  73. Koscielny, S.; Tubiana, M.; Lê, M.G.; Valleron, A.J.; Mouriesse, H.; Contesso, G.; Sarrazin, D. Breast cancer: Relationship between the size of the primary tumor and the probability of metastatic dissemination. Br. J. Cancer 1984, 49, 709–715. [Google Scholar] [CrossRef] [PubMed] [Green Version]
  74. Koscielny, S.; Tubiana, M. The link between local recurrence and distant metastases in human breast cancer. Int. J. Radiat. Oncol. Biol. Phys. 1999, 43, 11–24. [Google Scholar] [CrossRef]
  75. Tabar, L.; Duffy, S.W.; Vitak, B.; Chen, H.H.; Prevost, T.C. The natural history of breast carcinoma: What have we learned from screening? Cancer 1999, 86, 449–462. [Google Scholar] [CrossRef]
  76. Tubiana, M.; Koscielny, S. The natural history of breast cancer and the link between local recurrence and distant metastases: Implications for therapy. Rep. Pract. Oncol. Radiother. 2001, 6, 181–195. [Google Scholar] [CrossRef] [Green Version]
  77. Koscielny, S.; Arriagada, R.; Adolfsson, J.; Fornander, T.; Bergh, J. Impact of tumor size on axillary involvement and distant dissemination in breast cancer. Br. J. Cancer 2009, 101, 902–907. [Google Scholar] [CrossRef] [Green Version]
  78. Yu, K.D.; Jiang, Y.Z.; Chen, S.; Cao, Z.G.; Wu, J.; Shen, Z.Z.; Shao, Z.M. Effect of large tumor size on cancer-specific mortality in node-negative breast cancer. Mayo Clin. Proc. 2012, 87, 1171–1180. [Google Scholar] [CrossRef] [Green Version]
  79. Lin, R.S.; Plevritis, S.K. Comparing the benefits of screening for breast cancer and lung cancer using a novel natural history model. Cancer Causes Control 2012, 23, 175–185. [Google Scholar] [CrossRef] [Green Version]
  80. Narod, S.A. Tumor size predicts long-term survival among women with lymph node-positive breast cancer. Curr. Oncol. 2012, 19, 249–253. [Google Scholar] [CrossRef] [Green Version]
  81. Narod, S.A.; Iqbal, J.; Jakubowska, A.; Huzarski, T.; Sun, P.; Cybulski, C.; Gronwald, J.; Byrski, T.; Lubinski, J. Are two-centimeter breast cancers large or small? Curr. Oncol. 2013, 20, 205–211. [Google Scholar] [CrossRef] [Green Version]
  82. Elkin, E.B.; Hudis, C.; Begg, C.B.; Schrag, D. The effect of changes in tumor size on breast carcinoma survival in the U.S.: 1975–1999. Cancer 2005, 104, 1149–1157. [Google Scholar] [CrossRef] [PubMed]
  83. Tevaarwerk, A.J.; Gray, R.J.; Schneider, B.P.; Smith, M.L.; Wagner, L.I.; Fetting, J.H.; Davidson, N.; Goldstein, L.J.; Miller, K.D.; Sparano, J.A. Survival in patients with metastatic recurrent breast cancer after adjuvant chemotherapy: Little evidence of improvement over the past 30 years. Cancer 2013, 119, 1140–1148. [Google Scholar] [CrossRef] [PubMed] [Green Version]
  84. Jemal, A.; Ward, E.M.; Johnson, C.J.; Cronin, K.A.; Ma, J.; Ryerson, B.; Mariotto, A.; Lake, A.J.; Wilson, R.; Sherman, R.L.; et al. Annual Report to the Nation on the Status of Cancer, 1975–2014, Featuring Survival. J. Natl. Cancer Inst. 2017, 109, djx030. [Google Scholar] [CrossRef] [PubMed]
  85. Zheng, Y.Z.; Wang, L.; Hu, X.; Shao, Z.M. Effect of tumor size on breast cancer-specific survival stratified by joint hormone receptor status in a SEER population-based study. Oncotarget 2015, 6, 22985–22995. [Google Scholar] [CrossRef] [Green Version]
  86. Sopik, V.; Narod, S.A. The relationship between tumor size, nodal status and distant metastases: On the origins of breast cancer. Breast Cancer Res. Treat. 2018, 170, 647–656. [Google Scholar] [CrossRef] [Green Version]
  87. Orang, E.; Marzony, E.T.; Afsharfard, A. Predictive role of tumor size in breast cancer with axillary lymph node involvement—Can size of primary tumor be used to omit an unnecessary axillary lymph node dissection? Asian Pac. J. Cancer Prev. 2013, 14, 717–722. [Google Scholar] [CrossRef] [Green Version]
  88. Jung, J.; Suh, Y.J.; Ko, B.K.; Lee, E.S.; Kim, E.K.; Paik, N.S.; Byun, K.D.; Hwang, K.T. Clinical implication of subcategorizing T2 category into T2a and T2b in TNM staging of breast cancer. Cancer Med. 2018, 7, 5514–5524. [Google Scholar] [CrossRef]
  89. Narod, S.A.; Giannakeas, V.; Sopik, V. Time to death in breast cancer patients as an indicator of treatment response. Breast Cancer Res. Treat. 2018, 172, 659–669. [Google Scholar] [CrossRef]
  90. Kirch, R.L.; Klein, M. Prospective evaluation of periodic breast examination programs. Cancer 1976, 38, 265–272. [Google Scholar] [CrossRef]
  91. Heuser, L.; Spratt, J.S., Jr.; Polk, H.C., Jr.; Buchanan, J. Relation between mammary cancer growth kinetics and the intervals between screenings. Cancer 1979, 43, 857–862. [Google Scholar] [CrossRef]
  92. Heuser, L.; Spratt, J.S.; Polk, H.C., Jr. Growth rates of primary breast cancers. Cancer 1979, 43, 1888–1894. [Google Scholar] [CrossRef]
  93. Spratt, J.S.; Heuser, L.; Kuhns, J.G.; Reiman, H.M.; Buchanan, J.B.; Polk, H.C., Jr.; Sandoz, J. Association between the actual doubling times of primary breast cancer with histopathologic characteristics and Wolfe’s parenchymal mammographic patterns. Cancer 1981, 47, 2265–2268. [Google Scholar] [CrossRef]
  94. Begg, A.C.; McNally, N.J.; Shrieve, D.C.; Karcher, H. A method to measure the duration of DNA synthesis and the potential doubling time from a single sample. Cytometry 1985, 6, 620–626. [Google Scholar] [CrossRef] [PubMed]
  95. Arnerlöv, C.; Emdin, S.O.; Lundgren, B.; Roos, G.; Söderström, J.; Bjersing, L.; Norberg, C.; Angquist, K.A. Breast carcinoma growth rate described by mammographic doubling time and S-phase fraction. Correlations to clinical and histopathologic factors in a screened population. Cancer 1992, 70, 1928–1934. [Google Scholar] [CrossRef]
  96. Arnerlöv, C.; Emdin, S.O.; Lundgren, B.; Roos, G.; Söderström, J.; Bjersing, L.; Norberg, C.; Angquist, K.A. Mammographic growth rate, DNA ploidy, and S-phase fraction analysis in breast carcinoma. A prognostic evaluation in a screened population. Cancer 1992, 70, 1935–1942. [Google Scholar] [CrossRef]
  97. Bailey, S.L.; Sigal, B.M.; Plevritis, S.K. A simulation model investigating the impact of tumor volume doubling time and mammographic tumor detectability on screening outcomes in women aged 40–49 years. J. Natl. Cancer Inst. 2010, 102, 1263–1271. [Google Scholar] [CrossRef]
  98. Vieira, I.T.; de Senna, V.; Harper, P.R.; Shahani, A.K. Tumor doubling times and the length bias in breast cancer screening programmes. Health Care Manag. Sci. 2011, 14, 203–211. [Google Scholar] [CrossRef]
  99. Fornvik, D.; Lang, K.; Andersson, I.; Dustler, M.; Borgquist, S.; Timberg, P. Estimates of breast cancer growth rate from mammograms and its relation to tumor characteristics. Radiat. Prot. Dosim. 2016, 169, 151–157. [Google Scholar] [CrossRef]
  100. Seely, J.M.; Alhassan, T. Screening for breast cancer in 2018-what should we be doing today? Curr. Oncol. 2018, 25, S115–S124. [Google Scholar] [CrossRef] [Green Version]
  101. Wu, Q.; Li, J.; Zhu, S.; Wu, J.; Chen, C.; Liu, Q.; Wei, W.; Zhang, Y.; Sun, S. Breast cancer subtypes predict the preferential site of distant metastases: A SEER based study. Oncotarget 2017, 8, 27990–27996. [Google Scholar] [CrossRef] [Green Version]
  102. Wu, S.G.; Li, H.; Tang, L.Y.; Sun, J.Y.; Zhang, W.W.; Li, F.Y.; Chen, Y.X.; He, Z.Y. The effect of distant metastases sites on survival in de novo stage-IV breast cancer: A SEER database analysis. Tumor Biol. 2017, 39, 1010428317705082. [Google Scholar] [CrossRef] [PubMed] [Green Version]
  103. Wang, H.; Zhang, C.; Zhang, J.; Kong, L.; Zhu, H.; Yu, J. The prognosis analysis of different metastasis pattern in patients with different breast cancer subtypes: A SEER based study. Oncotarget 2017, 8, 26368–26379. [Google Scholar] [CrossRef] [PubMed]
  104. Xiao, W.; Zheng, S.; Yang, A.; Zhang, X.; Zou, Y.; Tang, H.; Xie, X. Breast cancer subtypes and the risk of distant metastasis at initial diagnosis: A population-based study. Cancer Manag. Res. 2018, 10, 5329–5338. [Google Scholar] [CrossRef] [PubMed] [Green Version]
  105. Yao, Y.; Chu, Y.; Xu, B.; Hu, Q.; Song, Q. Risk factors for distant metastasis of patients with primary triple-negative breast cancer. Biosci. Rep. 2019, 39, BSR20190288. [Google Scholar] [CrossRef]
  106. Chen, Q.F.; Huang, T.; Shen, L.; Wu, P.; Huang, Z.L.; Li, W. Prognostic factors and survival according to tumor subtype in newly diagnosed breast cancer with liver metastases: A competing risk analysis. Mol. Clin. Oncol. 2019, 11, 259–269. [Google Scholar] [CrossRef]
Figure 1. The mathematical model used to predict the earliest diagnostic period of the secondary distant metastasis (sdMTS) in patients with breast cancer (BC). T1a = 1 mm < d ≤ 5 mm; T1b = 5 mm < d ≤ 10 mm; T1c = 10 mm < d ≤ 20 mm; T2 = 20 mm < d ≤ 50 mm; T3 = d > 50 mm [14]. Non-visible MTS(1)-I (years)—the non-visible growth period of the sdMTS (the first non-visible sdMTS from the primary tumor (PT)) can be calculated as the period from the appearance of the first metastatic cell of the sdMTS (d = 10 µm) to the detection of the non-visible sdMTS (before the date of PT surgery); Non-visible MTS(1)-II (years)—the non-visible growth period of sdMTS (the first non-visible sdMTS from the PT) can be calculated as the period from the diagnosis (after date of PT surgery) to the diagnosis of the visible size (d = 9 mm) of at least one sdMTS; Visible MTS(1) (years)—the visible growth period of sdMTS(1) (the first visible sdMTS from the PT) can be calculated as the period from the diagnosis of the visible size (d = 9 mm) to when it reaches the lethal size (death); Visible MTS(X) (years)—the visible growth period of sdMTS(X) (the last visible sdMTS from the PT) can be calculated as the period from the diagnosis of the visible size (d = 9 mm) to when it reaches the lethal size (death); Period of MTS(1-X) diagnosis—the period of the diagnosis of the visible size (d = 9 mm) of the sdMTS from the first visible sdMTS (1) to the last visible sdMTS (X).
Cancers 12 02344 g001
Figure 2. T1cN0-3M0. The whole natural history of the PT (triple-negative, HR(−)/HER2(−), Ki-67 ≥ 14) and sdMTS. Parameter T1c: 10 mm < d ≤ 20 mm. Diameter of PT = dPT = 15.1 mm, TVDTPT = 10–135 days. Rapid growth rate of secondary distant MTS = TVDTMTS = 10–135 days. Mean TVDTMTS = 40–67 days.
Cancers 12 02344 g002
Figure 3. T1cN0-3M0. The whole natural history of the PT (HER2-positive, HR(−)/HER2(+), Ki-67 ≥ 14) and sdMTS. Parameter T1c: 10 mm < d ≤ 20 mm. Diameter of primary tumor = dPT = 15.1 mm, TVDTPT = 136–165 days. Rapid growth rate of secondary distant MTS = TVDTMTS = 10–135 days. Intermediate growth rate of secondary distant MTS = TVDTMTS = 136–165 days. Mean TVDTMTS = 68–82 days.
Cancers 12 02344 g003
Figure 4. T1cN0-3M0. The whole natural history of the PT (Luminal B, HR(+)/HER2(−), Ki-67 ≥ 14) and sdMTS. Parameter T1c: 10 mm < d ≤ 20 mm. Diameter of primary tumor = dPT = 15.1 mm, TVDTPT = 166–195 days. Rapid growth rate of secondary distant MTS = TVDTMTS = 10–135 days. Intermediate growth rate of secondary distant MTS = TVDTMTS = 136–195 days. Mean TVDTMTS = 83–97 days.
Cancers 12 02344 g004
Figure 5. T1cN0-3M0. The whole natural history of the PT (Luminal B, HR(+)/Her2(+), Ki-67 ≥ 14) and sdMTS. Parameter T1c: 10 mm < d ≤ 20 mm. Diameter of primary tumor = dPT = 15.1 mm, TVDTPT = 196–230 days. Rapid growth rate of secondary distant MTS = TVDTMTS = 10–135 days. Intermediate growth rate of secondary distant MTS = TVDTMTS = 136–195 days. Slow growth rate of secondary distant MTS = TVDTMTS = 196–230 days. Mean TVDTMTS = 98–115 days.
Cancers 12 02344 g005
Figure 6. T1cN0-3M0. The whole natural history of the PT (Luminal A, HR(+)/Her2(−), Ki-67 < 14) and sdMTS. Parameter T1c: 10 mm < d ≤ 20 mm. Diameter of primary tumor = dPT = 15.1 mm, TVDTPT = 231–270 days. Rapid growth rate of secondary distant MTS = TVDTMTS = 10–135 days. Intermediate growth rate of secondary distant MTS = TVDTMTS = 136–166–195 days. Slow growth rate of secondary distant MTS = TVDTMTS = 196–230 days. Very slow growth rate of secondary distant MTS = TVDTMTS = 231–270 days. Mean TVDTMTS = 116–135 days.
Cancers 12 02344 g006
Figure 7. T1cN0-3M0. The whole natural history of the PT (triple-negative, HR(−)/HER2(−), Ki-67 ≥ 14) and sdMTSs of patient with multiple single MTSs (lung, liver, brain). Parameter T1c: 10 mm < d ≤ 20 mm. Diameter of primary tumor = dPT = 15.1 mm, TVDTPT = 88 days. Rapid growth rate of secondary distant MTS: TVDTMTS of lung metastasis = 40 days, TVDTMTS of liver metastasis = 40 days, TVDTMTS of brain metastasis = 40 days.
Cancers 12 02344 g007
Figure 8. T1cN0-3M0. The whole natural history of the PT (triple-negative, HR(−)/HER2(−), Ki-67 ≥ 14) and sdMTSs of patient with multiple MTSs (liver). Parameter T1c: 10 mm < d ≤ 20 mm. Diameter of primary tumor = dPT = 15.1 mm, TVDTPT = 110 days. Rapid growth rate of secondary distant MTS: TVDTMTS of liver metastasis = 50 days.
Cancers 12 02344 g008
Table 1. Diagnostic periods for sdMTSs in patients with ER/PR/HER2/Ki-67 (Estrogen Receptor/Progesterone Receptor/Human Epidermal growth factor Receptor 2/Ki-67 marker) subtypes of BC for stage T1cN0-3M0. TVDT—tumor volume doubling time.
T1c (mm)
10 < d ≤ 20
T1c (mm)
10 < d ≤ 20
T1c (mm)
10 < d ≤ 20
T1c (mm)
10 < d ≤ 20
T1c (mm)
10 < d ≤ 20
dPT at surgery (mm)15.115.115.115.115.1
PTlog(V)31.731.731.731.731.7
TVDTPT (days)80–110–135136–150–165166–180–195196–210–230231–250–270
TVDTPT (days) mean110150180210250
V subtypeIV subtypeIII subtypeII subtypeI subtype
Good prognosis I subtype
Very slow growth rate HR(+)/Her2(−)
TVDTMTS (days) 230(+)231–270
Mean TVDTMTS (days) 230(+)116–135
dMTS (mm) 9.09.0
Non-visible MTS(1-X)-I 7.41–14.807.43–8.69
Non-visible MTS(1-X)-II 11.19–18.5811.23–13.13
Visible MTS(1-X) (years) 6.66–14.056.68–7.81
Survival MTS(1-X) (years) 17.84–25.2317.91–20.93
Period of MTS(1-X) diagnosis 7.401.95
Screening time 12 mo12 mo
Intermediate prognosis II subtype
Slow growth rate HR(+)/Her2(+)
TVDTMTS (days) 195(+)196–230196–230
Mean TVDTMTS (days) 195(+)98–11598–115
dMTS (mm) 9.09.09.0
Non-visible MTS(1-X)-I 6.28–12.556.31–7.406.31–7.40
Non-visible MTS(1-X)-II 9.49–15.769.53–11.189.53–11.18
Visible MTS(1-X) (years) 5.65–11.915.67–6.655.67–6.65
Survival MTS(1-X) (years) 15.13–21.3915.20–17.8315.20–17.83
Period of MTS(1-X) diagnosis 6.271.701.70
Screening time 8 mo8 mo8 mo
Intermediate prognosis III subtype
Intermediate growth rate HR(+)/HER2(−)
TVDTMTS (days) 165(+)166–195166–195166–195
Mean TVDTMTS (days) 165(+)83–9783–9783–97
dMTS (mm) 9.09.09.09.0
Non-visible MTS(1-X)-I 5.32–10.625.34–6.275.34–6.275.34–6.27
Non-visible MTS(1-X)-II 8.03–13.338.07–9.488.07–9.488.07–9.48
Visible MTS(1-X) (years) 4.78–10.084.80–5.644.80–5.644.80–5.64
Survival MTS(1-X) (years) 12.80–18.1012.87–15.1212.87–15.1212.87–15.12
Period of MTS(1-X) diagnosis 5.311.461.461.46
Screening time 6 mo6 mo6 mo6 mo
Intermediate prognosis IV subtype
Intermediate growth rate HR(−)/HER2(+)
TVDTMTS (days)135(+)136–165136–165136–165136–165
Mean TVDTMTS (days)135(+)68–8268–8268–8268–82
dMTS (mm)9.09.09.09.09.0
Non-visible MTS(1-X)-I4.35–8.694.38–5.314.38–5.314.38–5.314.38–5.31
Non-visible MTS(1-X)-II6.57–10.916.61–8.026.61–8.026.61–8.026.61–8.02
Visible MTS(1-X) (years)3.91–8.253.93–4.773.93–4.773.93–4.773.93–4.77
Survival MTS(1-X) (years)10.48–14.8110.54–12.7910.54–12.7910.54–12.7910.54–12.79
Period of MTS(1-X) diagnosis4.341.461.461.461.46
Screening time5 mo5 mo5 mo5 mo5 mo
Poor prognosisV subtype
Rapid growth rateHR(−)/HER2(−)
TVDTMTS (days)10–13510–13510–13510–13510–135
Mean TVDTMTS (days)40–6740–6740–6740–6740–67
dMTS (mm)9.09.09.09.09.0
Non-visible MTS(1-X)-I0.55–4.340.55–4.340.55–4.340.55–4.340.55–4.34
Non-visible MTS(1-X)-II0.26–6.560.26–6.560.26–6.560.26–6.560.26–6.56
Visible MTS(1-X) (years)0.29–3.900.29–3.900.29–3.900.29–3.900.29–3.90
Survival MTS(1-X) (years)0.55–10.470.55–10.470.55–10.470.55–10.470.55–10.47
Period of MTS(1-X) diagnosis6.306.306.306.306.30
Screening time3 mo3 mo3 mo3 mo3 mo
Total period MTS(1-X) diagnosis10.6413.0715.4918.3212.87
dPT at surgery (mm)—the mean size (mm) of the PT at surgery (resection of the PT) for each stage (T1, T2, T3), obtained from Table 1 of [15]; PTlog(V)—the number of doublings of the PT at surgery (resection of the PT); TVDTPT—the mean tumor volume doubling time of the PT (days) at surgery (resection of the PT) [20,21,44,45,46,47,48,49,50,51,52,53,54,55,56]; TVDTMTS—the mean tumor volume doubling time of the sdMTS (days) [20,21,57,58,59,60,61,62,63,64,65,66,67,68]; dMTS—the mean size (mm) of the sdMTS at the diagnosis period; Non-visible MTS(1-X)-I (years), Non-visible MTS(1-X)-II (years), Visible MTS(1-X) (years) and Period of MTS(1-X) diagnosis—see Figure 1. Survival MTS(1-X) (years)—the survival (lifetime) can be calculated as the period between the date of diagnosis (using the tumor-node-metastasis (TNM) staging system) and the date of patient death. The survival of BC patients includes both the non-visible and visible growth periods of the sdMTS (the first, intermediate, or last sdMTS from the PT); Total period of MTS(1-X) diagnosis (years)—sum of the periods of the MTS(1-X) diagnosis (periods of rapid growth rate, intermediate growth rate, and slow and very slow growth rates). I subtype—Luminal A, HR(+)/Her2(−), Ki-67 < 14% for HR-positive (ER+/PR+ or ER+/PR− or ER−/PR+) tumors [22,23,24,25,26,69,70,71,72]; II subtype—Luminal B, HR(+)/Her2(+), Ki-67 ≥ 14% for HR-positive (ER+/PR+ or ER+/PR− or ER−/PR+) and Her2-positive tumors [22,23,24,25,26,69,70,71,72]; III subtype—Luminal B, HR(+)/Her2(−), Ki-67 ≥ 14% for HR-positive (ER+/PR+ or ER+/PR− or ER−/PR+) tumors [22,23,24,25,26,69,70,71,72]; IV subtype—HER2-positive, HR(−)/Her2(+), Ki-67 ≥ 14% [22,23,24,25,26,69,70,71,72]; V subtype—Triple Negative, HR(−)/Her2(−), Ki-67 ≥ 14% [22,23,24,25,26,69,70,71,72].

