Article

Interplay of tRNA-Derived Fragments and T Cell Activation in Breast Cancer Patient Survival

1
Center for Statistical Science, Department of Industrial Engineering, Tsinghua University, Beijing 100084, China
2
Department of Biostatistics, Yale School of Public Health, New Haven, CT 06520, USA
3
SJTU-Yale Joint Center for Biostatistics and Data Science, Department of Bioinformatics and Biostatistics, School of Life Sciences and Biotechnology, Shanghai Jiao Tong University, Shanghai 200240, China
4
MOE Key Laboratory of Bioinformatics, School of Life Sciences, Tsinghua University, Beijing 100084, China
5
Section of Pulmonary, Critical Care and Sleep Medicine, Yale School of Medicine, New Haven, CT 06520, USA
6
Department of Mathematical Sciences, University of Nevada, Las Vegas, NV 89154, USA
7
Department of Chronic Disease Epidemiology, Yale School of Public Health, New Haven, CT 06520, USA
*
Authors to whom correspondence should be addressed.
Cancers 2020, 12(8), 2230; https://doi.org/10.3390/cancers12082230
Submission received: 6 July 2020 / Revised: 28 July 2020 / Accepted: 7 August 2020 / Published: 10 August 2020

Abstract

:
Effector CD8+ T cell activation and its cytotoxic function are positively correlated with improved survival in breast cancer. tRNA-derived fragments (tRFs) have recently been found to be involved in gene regulation in cancer progression. However, it is unclear how interactions between expression of tRFs and T cell activation affect breast cancer patient survival. We used Kaplan–Meier survival and multivariate Cox regression models to evaluate the effect of interactions between expression of tRFs and T cell activation on survival in 1081 breast cancer patients. Spearman correlation analysis and weighted gene co-expression network analysis were conducted to identify genes and pathways that were associated with tRFs. tRFdb-5024a, 5P_tRNA-Leu-CAA-4-1, and ts-49 were positively associated with overall survival, while ts-34 and ts-58 were negatively associated with overall survival. Significant interactions were detected between T cell activation and ts-34 and ts-49. In the T cell exhaustion group, patients with a low level of ts-34 or a high level of ts-49 showed improved survival. In contrast, there was no significant difference in the activation group. Breast cancer related pathways were identified for the five tRFs. In conclusion, the identified five tRFs associated with overall survival may serve as therapeutic targets and improve immunotherapy in breast cancer.

1. Introduction

Recently, tRNA-derived fragments (tRFs), a novel class of small non-coding RNAs derived from tRNA precursor or mature sequences, have drawn great attention to characterize their biological roles and functional mechanisms in diseases. tRFs play important roles in cancer progression and tumorigenesis [1,2,3,4]. Dysregulation of tRFs have been observed in breast cancer [5,6,7,8]. For example, a novel class of tRFs induced by hypoxic stress was found to bind to the oncogenic RNA-binding protein YBX1 and inhibit the stability and expression of multiple oncogenic transcripts by displacing their 3′ UTRs from YBX1, which resulted in an antagonized protein activity and suppressing breast cancer progression [5]. Another study found that a number of tRNA-derived small RNAs were abundant in estrogen receptor (ER)-positive breast cancer cell lines, but not in ER negative breast cancer or other tissue cell lines, suggesting that tRFs are involved in cell proliferation of sex hormone-dependent cancers [6]. tRFs were also found to be upregulated in trastuzumab-resistant breast cancer cell lines compared to trastuzumab-sensitive breast cancer and higher levels of tRF expression were correlated with worse progression-free survival in human epidermal growth factor receptor 2 (HER2) positive patients, indicating that tRFs are involved in patient response to trastuzumab-targeted therapy in HER2 positive breast cancer [7]. Several tRFs were identified to be predictive biomarkers for recurrence-free survival in triple-negative breast cancer [8]. Taken together, these findings suggest a functional role of tRFs in breast cancer development and progression.
CD8+ T cell exhaustion and enhanced regulatory T cell function have been known to be involved in the progression of human cancer including breast cancer. Once infiltrated T cells are primed and activated by tumor neoantigens to become effector T cells, they will execute their cytotoxic activities to kill tumor cells. Neoantigens are present in tumor cells and are generated from tumor-specific somatic DNA alterations that lead to changes of protein sequences. Neoantigens bind to MHC class I molecules and then are distinguished by CD8+ T cells, triggering antitumor immunity. Although tRFs were found to be abundant in immune cells and may play an important role in the immune response [9,10], the underlying mechanisms are not well understood. One possible mechanism is that tRFs regulate gene expression within immune cells; and the other can be that tRFs are recognized by Toll-like receptors to induce the immune responses of Th1 and toxic T lymphocytes [11].
Our previous work reported that the T cell activation score was positively associated with improved survival in breast cancer patients [12,13]. However, it is unclear whether and how interactions between expression of tRFs and T cell activation affect breast cancer patient survival. In this study, we aimed to investigate the effect of tRFs and their interactions with T cell activation status on patient survival in breast cancer, which will advance the understanding of biological mechanisms of tRFs and serve as therapeutic targets in breast cancer.

2. Results

2.1. Association of tRFs with Patient Survival

The correlations between expression of each tRF and overall survival were evaluated. A full list of the 232 tRFs with their sequences and p-value was displayed in Table S1. Among them, fourteen tRFs with a p-value < 0.05 were selected to include in the multivariate Cox regression model. After model selection, eight tRFs were retained in the final model, which adjusted for patient’s age at diagnosis, disease stage, histological type, and T cell activation. Among them, expression levels of three tRFs, tRFdb-5024a, 5P_tRNA-Leu-CAA-4-1, and ts-49, were positively associated with overall survival, and two tRFs, ts-34 and ts-58, were negatively associated (Table 1). A higher level of tRFdb-5024a was significantly associated with decreased risk of death. The adjusted HR was 0.52 (95% CI: 0.37–0.74, p < 0.001) for high vs. low expression groups. A higher level of 5P_tRNA-Leu-CAA-4-1 was significantly associated with decreased risk of death. The adjusted HR was 0.55 (95% CI: 0.35–0.87, p = 0.011) for high vs. low expression groups. A higher level of ts-34 was significantly associated with increased risk of death. The adjusted HR was 1.62 (95% CI: 1.08–2.44, p = 0.019) for high vs. low expression groups. A higher level of ts-49 was significantly associated with decreased risk of death. The adjusted HR was 0.40 (95% CI: 0.17–0.93, p = 0.032) for high vs. low expression groups. A higher level of ts-58 was significantly associated with increased risk of death. The adjusted HR was 1.56 (95% CI: 1.10–2.20, p = 0.013) for high vs. low expression groups. Patients in the T cell activation group had better overall survival compared to those in the exhaustion group. The adjusted HR was 0.48 (95% CI: 0.27–0.83, p = 0.009) for activation vs. exhaustion groups.

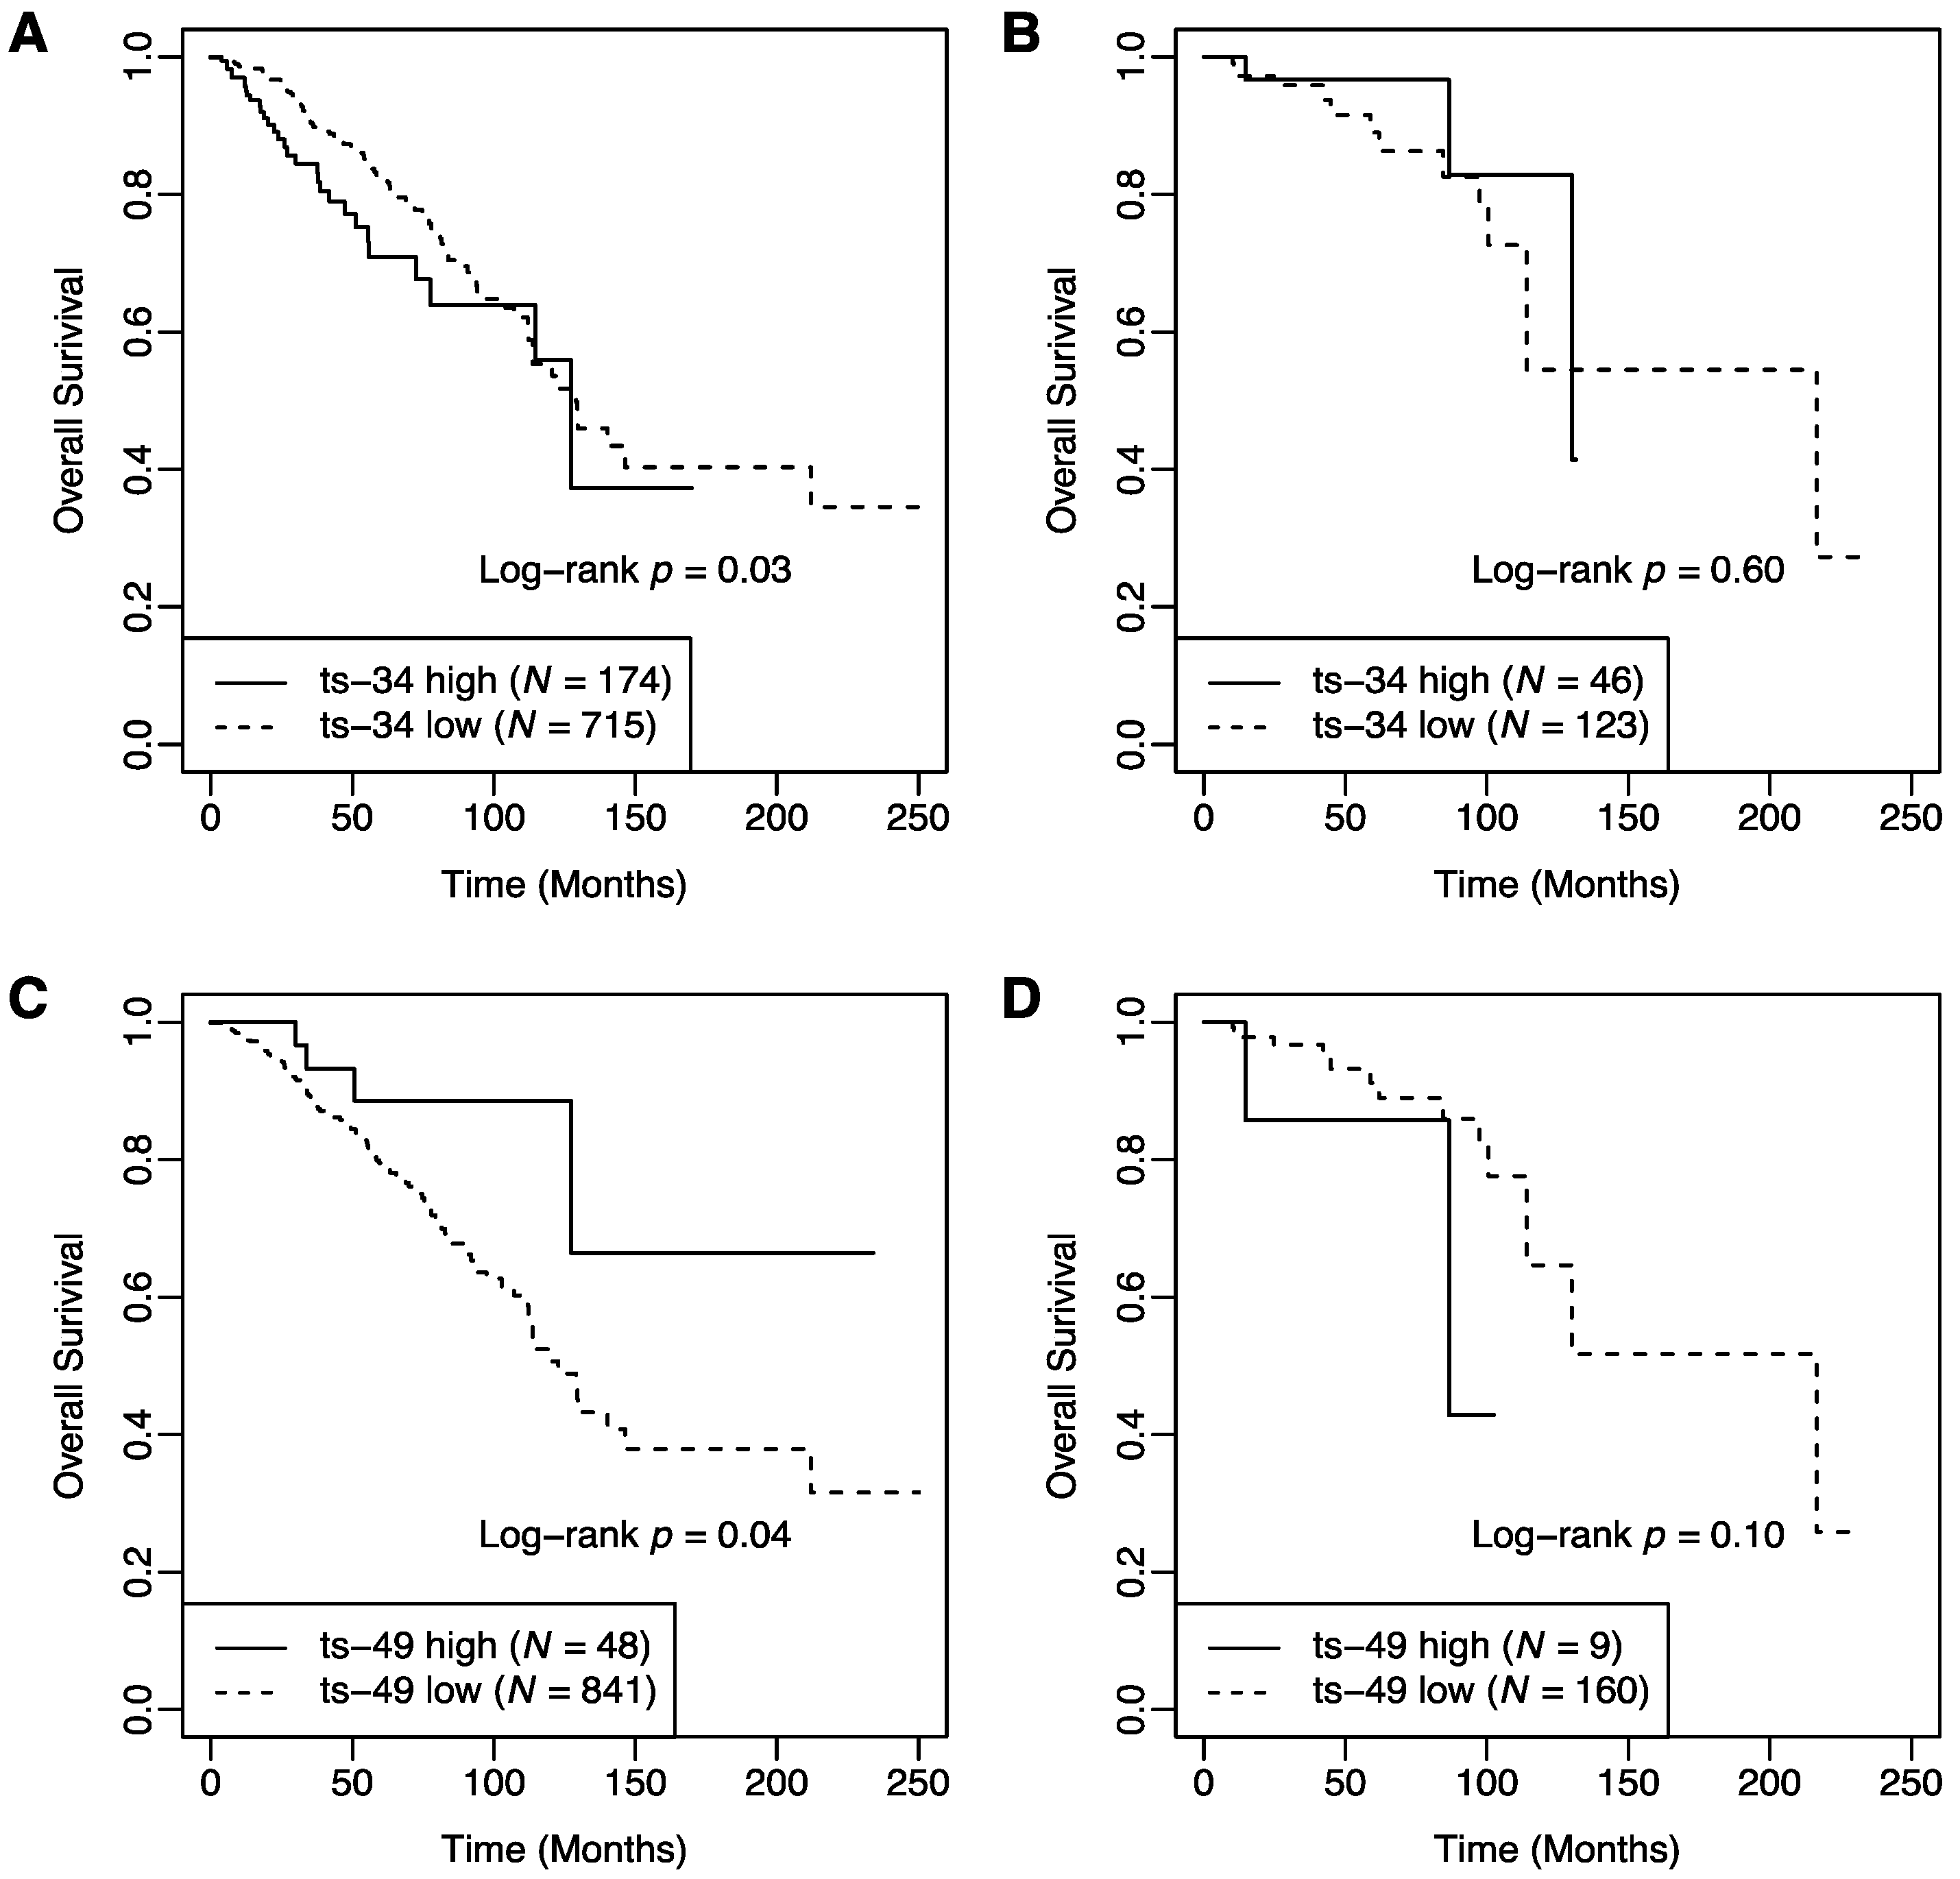
2.2. Interaction between T Cell Activation Status and tRFs in Patient Survival

The interactions between T cell activation status and expression of tRFs were evaluated in the multivariate Cox regression model, with adjustment for patient’s age at diagnosis, disease stage, and histological type. After model selection, two interaction terms were significant: ts-34 by T cell activation interaction (p = 0.040) and ts-49 by T cell activation interaction (p = 0.008; Table 2). The other three tRFs, tRFdb-5024a, 5P_tRNA-Leu-CAA-4-1, and ts-58, remained significantly correlated with overall survival. A higher level of tRFdb-5024a was associated with decreased risk of death. The adjusted HR was 0.50 (95% CI: 0.36–0.71, p < 0.001) for high vs. low expression groups. A higher level of 5P_tRNA-Leu-CAA-4-1 was associated with decreased risk of death. The adjusted HR was 0.58 (95% CI: 0.37–0.92, p = 0.021) for high vs. low expression groups. A higher level of ts-58 was associated with increased risk of death. The adjusted HR was 1.51 (95% CI: 1.07–2.12, p = 0.018) for high vs. low expression groups.
We further investigated the relationship between survival and expression of tRFs stratified by T cell activation status (Table 3). In the exhaustion group, patients with a low level of ts-34 showed better overall survival compared to those with a high level of ts-34 (Figure 1A). The 5-year survival rate was 0.82 (95% CI: 0.78–0.87) in the low expression group (n = 715) and 0.71 (95% CI: 0.61–0.82) in the high expression group (n = 174). The adjusted HR was 2.13 (95% CI: 1.40–3.23, p < 0.001) for high vs. low expression groups. In contrast, among patients in the activation group, there was no significant difference in overall survival between high and low expression groups (Figure 1B). The 5-year survival rate was 0.89 (95% CI: 0.81–0.98) in the low expression group (n = 123) and 0.97 (95% CI: 0.90–1.00) in the high expression group (n = 46). The adjusted HR was 0.18 (95% CI: 0.03–1.14, p = 0.069) for high vs. low expression groups.
Overall survival in high and low groups of ts-49 was different by T cell activation status. In the exhaustion group, improved overall survival was observed in patients with a high level of ts-49 compared to those with a low level of ts-49 (Figure 1C). The 5-year survival rate was 0.79 (95% CI: 0.75–0.84) for the low expression group (n = 841) and 0.89 (95% CI: 0.77–1.00) for the high expression group (n = 48). The adjusted HR was 0.28 (95% CI: 0.10–0.76, p = 0.013) for high vs. low expression groups. In contrast, in the activation group, there was no significant difference in overall survival between high and low expression groups (Figure 1D). The 5-year survival rate was 0.91 (95% CI: 0.85–0.98) for the low expression group (n = 160) and 0.86 (95% CI: 0.63–1.00) for the high expression group (n = 9). The adjusted HR was 3.91 (95% CI: 0.61–24.95, p = 0.150) for high vs. low expression groups.
The associations remained significant between overall survival and tRFdb-5024a, 5P_tRNA-Leu-CAA-4-1, and ts-58 in the exhaustion group. The adjusted HRs were 0.51 (95% CI: 0.35–0.73, p < 0.001), 0.54 (95% CI: 0.33–0.88, p = 0.014), and 1.58 (95% CI: 1.10–2.26, p = 0.013), respectively. In contrast, among patients in the activation group, none of the three tRFs were associated with overall survival.

2.3. Correlation between tRFs and Clinical Pathological Variables

The correlations between the expression of the five tRFs and clinical pathological variables, including the ER status, PR status, HER2 status, histological type, and disease stage were assessed (Table S2). Differential expression of tRFdb-5024a was observed among different histological types (p = 2.508 × 10⁻⁵). ts-34 was differentially expressed between ER positive and negative groups (p = 1.691 × 10⁻⁶), between PR positive and negative groups (p = 1.424 × 10⁻⁵), and between HER2 positive and negative groups (p = 0.023). ts-58 was differentially expressed between HER2 positive and negative groups (p = 1.473 × 10⁻⁴). There was a borderline significant association between disease stage and ts-49 (p = 0.055). 5P_tRNA-Leu-CAA-4-1 was not differentially expressed between any groups of the clinical variables.

2.4. Correlation between tRFs and mRNA Transcripts

The correlations between the five tRFs and 36,674 mRNA transcripts were assessed. We identified 404 positively and 2292 negatively correlated genes with tRFdb-5024a, 16 positively and 2 negatively correlated genes with 5P_tRNA-Leu-CAA-4-1, 310 positively and 230 negatively correlated genes with ts-34, and 280 positively and 1 negatively correlated genes with ts-58. No genes were significantly correlated with ts-49. Pathway enrichment analyses were carried out on positively and negatively correlated genes for the four tRFs separately. For tRFdb-5024a, the positively correlated genes were enriched for 27 pathways and the negatively correlated genes were enriched for 405 pathways (Table S3). Cell cycle related pathways were found in the top 10 pathways enriched in the positively correlated genes (Figure 2A). The top 10 pathways enriched in the negatively correlated genes included epithelial-to-mesenchymal transition (EMT), signal transduction, cell adhesion ECM remodeling, and extracellular matrix-regulated proliferation related pathways (FDR = 4.05 × 10⁻¹², 1.40 × 10⁻⁸, 1.48 × 10⁻⁸, and 1.77 × 10⁻⁸, respectively; Figure 2B and for Table S3). For ts-34, the positively correlated genes were enriched for 33 pathways and the negatively correlated genes were enriched for 13 pathways (Table S4). The positively correlated genes were enriched for molecules involved in cell cycle related pathways (Figure 2C), while the negatively correlated genes were involved in mammary cell development and neuronal cell development (Figure 2D). Notably, the most relevant pathway was breast cancer (general schema) pathway in which three genes were negatively correlated with ts-34 (FDR = 2.95 × 10⁻²). For ts-58, four pathways were enriched in the positively correlated genes and no significant pathways were found in the negatively correlated genes (Table S5). The top two pathways were development microRNA-dependent regulation of EMT pathway (FDR = 5.48 × 10⁻⁶) and TGF-beta signaling via microRNA in the breast cancer pathway (FDR = 3.94 × 10⁻³; Figure 2E). No significant pathways were identified for ts-49 and 5P_tRNA-Leu-CAA-4-1.

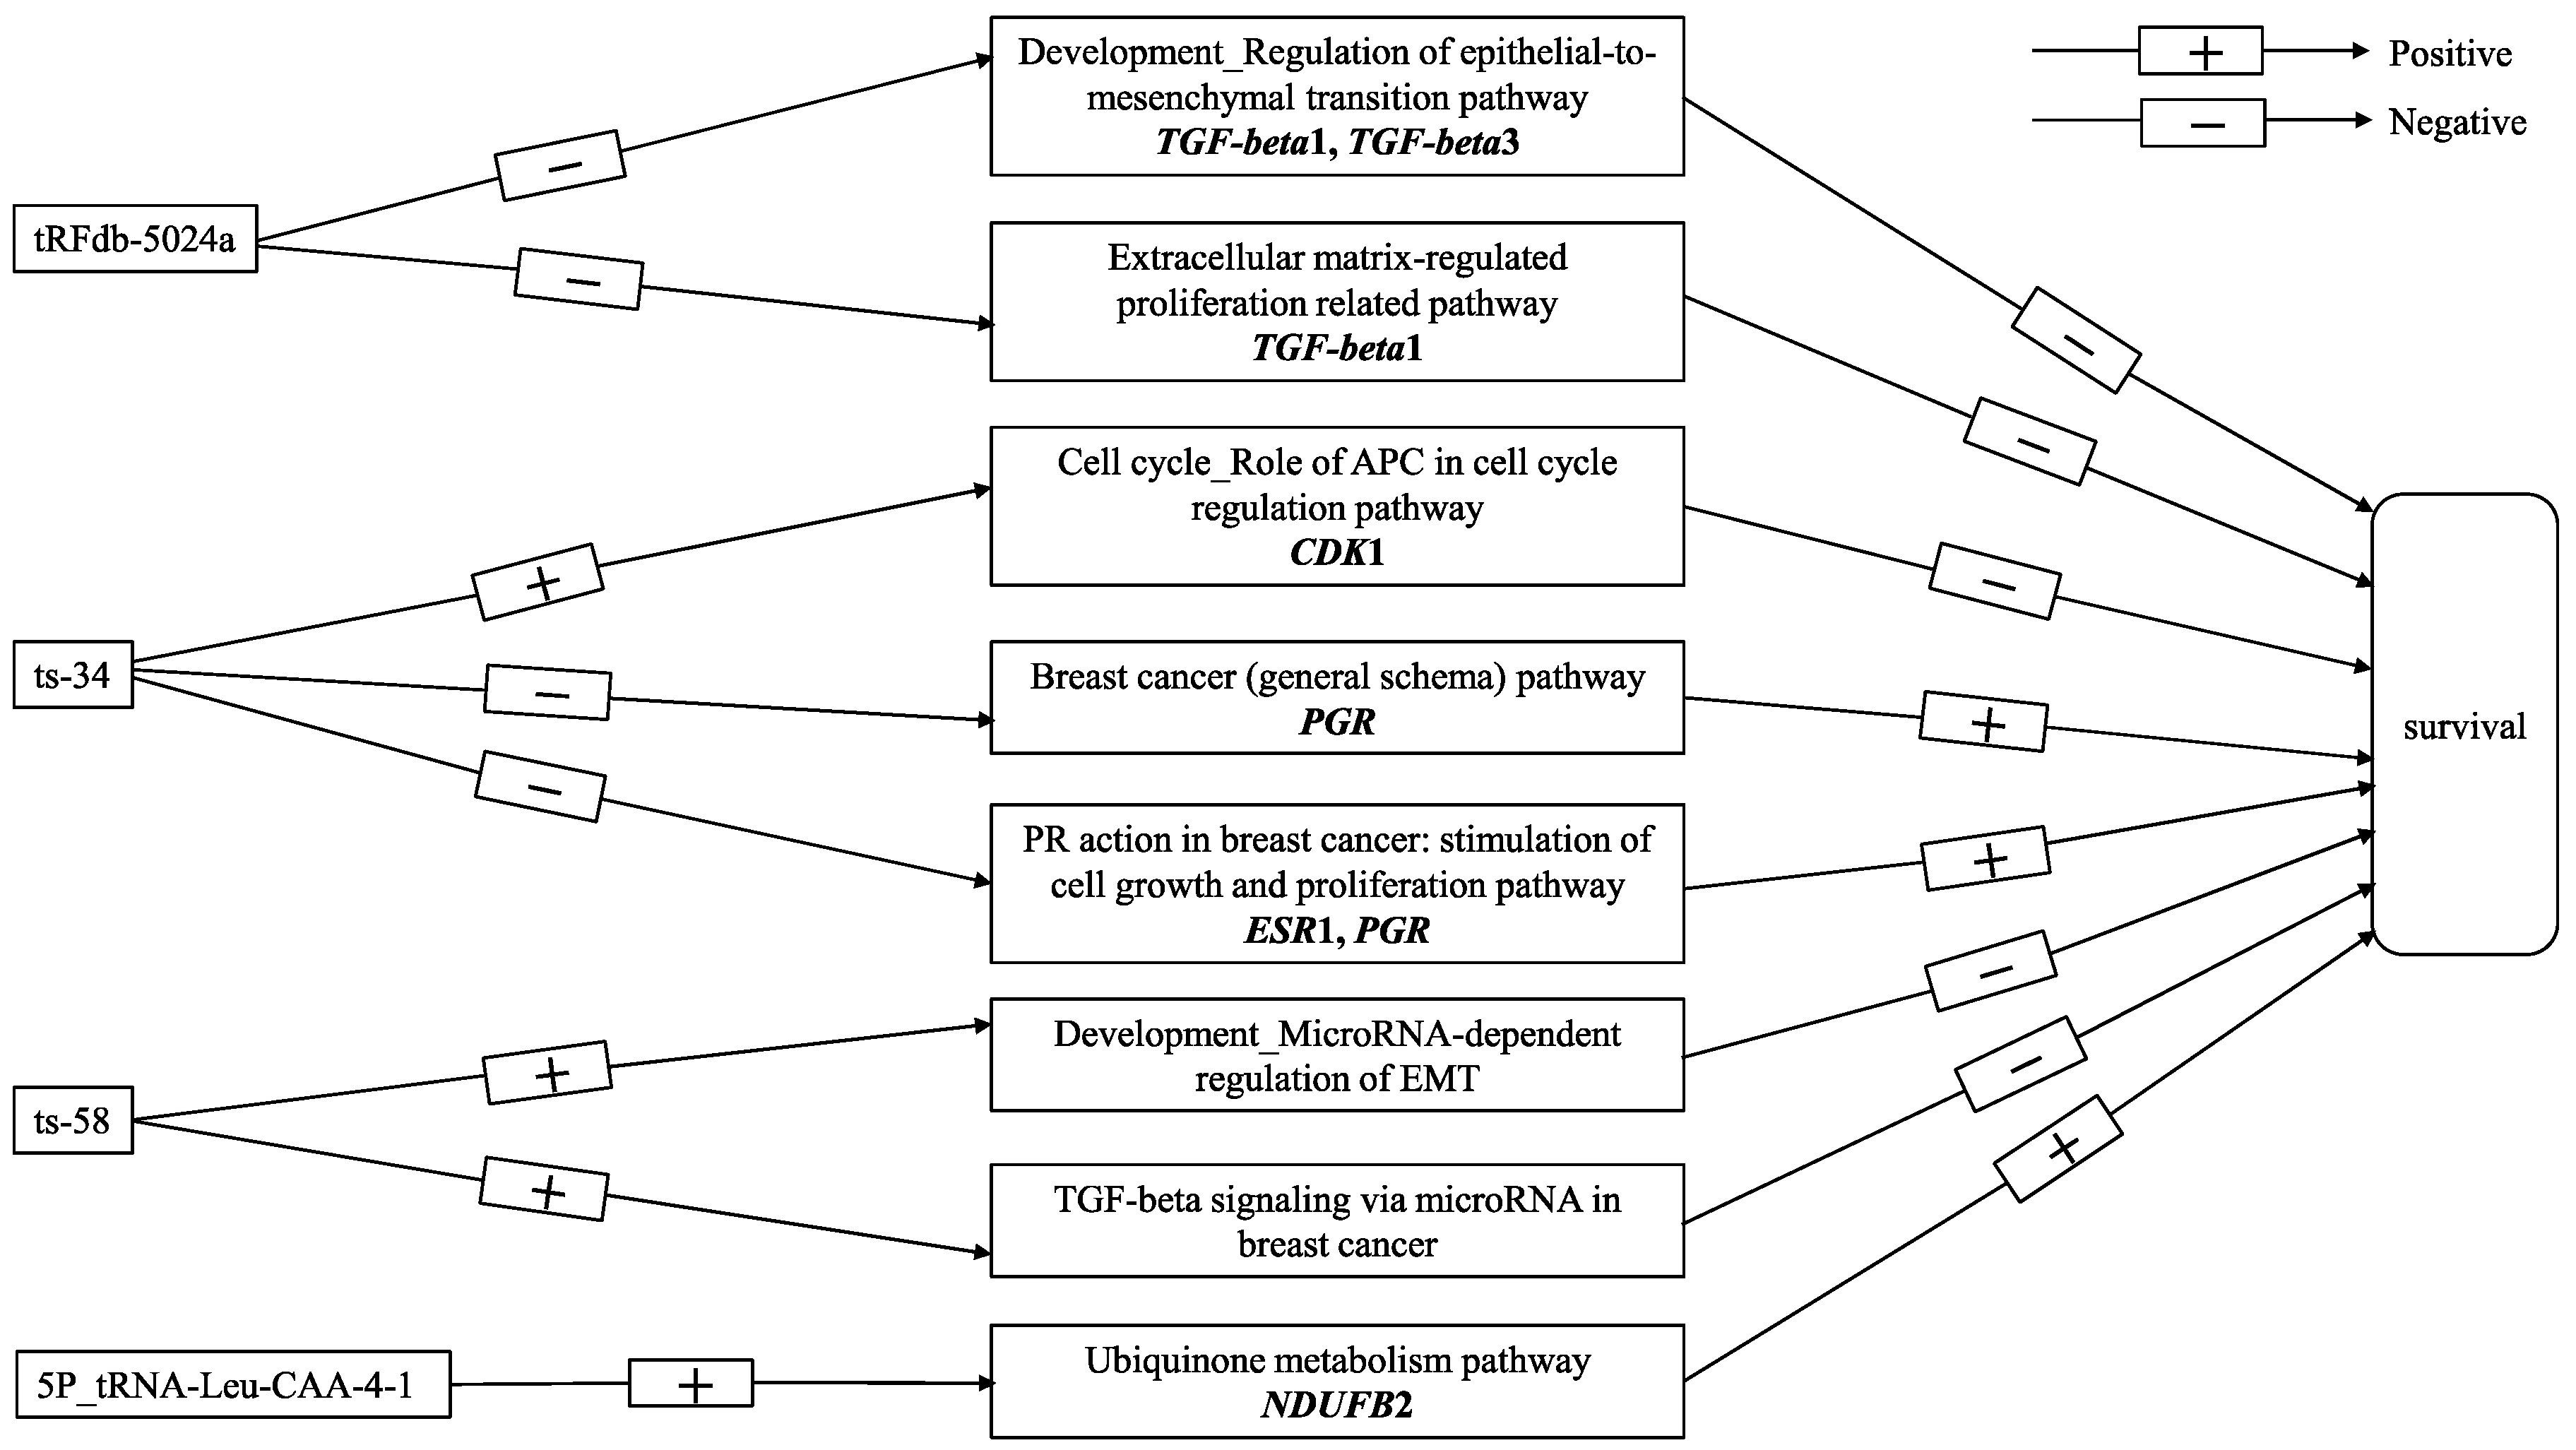
2.5. Correlation between tRFs and Gene Modules

Gene co-expression network was constructed to identify modules of highly correlated genes using weighted gene co-expression network analysis (WGCNA). The identified 38 gene modules and their correlations with expression of the five tRFs were demonstrated in Figure 3A. For tRFdb-5024a, the pink module was the top positively correlated module (r = 0.13, p = 3 × 10⁻⁵) and the yellow module was the top negatively correlated module (r = -0.27, p = 1 × 10⁻¹⁹). For 5P_tRNA-Leu-CAA-4-1, the top positively correlated module was the blue module (r = 0.11, p = 5 × 10⁻⁴). For ts-34, the pink module was the top positively correlated module (r = 0.18, p = 5 × 10⁻⁹) and the black module was the top negatively correlated module (r = -0.16, p = 2 × 10⁻⁷). For ts-58, the top positively correlated module was the green-yellow module (r = 0.16, p = 2 × 10⁻⁷). Weak correlations were observed for modules that were negatively correlated with 5P_tRNA-Leu-CAA-4-1 and ts-58, which were consistent with the observation that genes were mostly positively correlated with 5P_tRNA-Leu-CAA-4-1 and ts-58. No modules were significantly correlated with ts-49. Figure 3B shows the correlations between gene modules and clinical pathological variables. The pink module was significantly correlated with ER status (r = −0.52, p = 2 × 10−70), PR status (r = −0.45, p = 9 × 10−52), ductal subtype (r = 0.31, p = 2 × 10⁻²⁵), and lobular subtype (r = −0.32, p = 8 × 10⁻²⁷). The yellow module was significantly associated with ductal subtype (r = −0.3, p = 1 × 10⁻²³) and lobular subtype (r = 0.34, p = 4 × 10⁻³⁰). Black module was significantly correlated with ER status (r = 0.65, p = 1 × 10−122) and PR status (r = 0.57, p = 2 × 10−85). These results, combined with the significant associations between the tRFdb-5024a and histological type, ts-34 and ER or PR status, suggested potential biological functions of tRFdb-5024a and ts-34 in breast cancer.
The pathway enrichment analysis was conducted to evaluate the biological function of top gene modules associated with the five tRFs. There were 80, 197, 159, 31, and 6 pathways enriched in pink, yellow, blue, black, and green-yellow modules, respectively (Table S6). For tRFdb-5024a, genes in the pink module were largely enriched for cell cycle related pathways (Figure 4A), consistent with the pathway results of the positively correlated genes of tRFdb-5024a. The signal transduction pathway enriched in the negatively correlated genes of tRFdb-5024a was also observed in the top 10 pathways of yellow modules (Figure 4B). For 5P_tRNA-Leu-CAA-4-1, blue module (22 genes) was enriched for ubiquinone metabolism pathway (FDR = 3.72 × 10⁻¹⁰; Figure 4C and Table S6). Genes such as NDUFB1, NDUFB2, and NDUFB7 were found to have significant prognostic values for breast cancer patients [14]. For ts-34, pathway results of the pink module revealed that many of the top 10 pathways were related to the cell cycle function (Figure 4A), consistent with the pathway results of the positively correlated genes of ts-34. The breast cancer (general schema) pathway was among the top 10 pathways of the black module (Figure 4D), consistent with the pathway results of the negatively correlated genes of ts-34. Interestingly, genes in the black module were enriched for the PR action in breast cancer: stimulation of cell growth and proliferation pathway (FDR = 9.05 × 10⁻³), inhibition of LKB1/AMPK signaling in breast cancer pathway (FDR = 1.37 × 10⁻²), and IL-6 signaling in breast cancer cells pathway (FRD = 2.48 × 10⁻²) (Figure 4D and Table S6). For ts-58, the top two significant pathways of green-yellow module (Figure 4E), development MicroRNA-dependent regulation of EMT and TGF-beta signaling via microRNA in breast cancer, agreed well with the pathway results of the positively correlated genes of ts-58.

3. Discussion

tRFs have been found to be dysregulated in several human cancers, such as prostate, colon, lung, and breast cancer [8,15,16,17,18]. However, understanding of the biological mechanisms of tRFs in cancer is still in its infancy. In this study, we explored the effect of tRFs and their interactions with the T cell activation score on patient survival in breast cancer. We also identified genes and modules that were associated with tRFs. Pathway enrichment results provided valuable insights into the functions of tRFs.
To our knowledge, this is the first attempt to investigate how interactions between expression of tRFs and T cell activation status affect breast cancer patient survival using a large cohort available in TCGA. We integrated multiple data types, including mRNA, tRFs, and clinical information. Our results suggest that tRFdb-5024a, 5P_tRNA-Leu-CAA-4-1, and ts-49 were positively associated with patient survival, while ts-34 and ts-58 were negatively associated. ts-34 and ts-49 showed significant interactions with T cell activation status. In the T cell exhaustion group, better overall survival was observed in patients with a low level of ts-34 and a high level of ts-49. However, there was no significant difference in overall survival between high and low expression groups of ts-34 and ts-49 in the T cell activation group. These findings suggest that tRFs affect patient survival differently depending on the T cell activation status. We also observed that tRFdb-5024a was significantly associated with the histological type; ts-34 was significantly associated with ER, PR, and HER2 status; and ts-58 was significantly associated with HER2 status. These results added to the evidence of biological functions of tRFdb-5024a, ts-34, and ts-58 in breast cancer.
Spearman correlation analysis demonstrated that tRFdb-5024a mainly downregulates gene expression, whereas 5P_tRNA-Leu-CAA-4-1, ts-34, and ts-58 upregulate gene expression. Gene modules associated with the breast cancer-related tRFs appeared to be involved in various biological processes in human cancer, including cell cycle, EMT, extracellular matrix-regulated proliferation, signal transduction, neuronal cell development, and mammary cell development. Our study showed that negatively correlated genes with tRFdb-5024a (e.g., TGF-beta1 and TGF-beta3) were enriched for development regulation of the EMT pathway and extracellular matrix-regulated proliferation related pathway. EMT is a hallmark of human cancer with the acquisition of cancer stem cell-like traits that promote cancer progression and metastasis [19]. Extracellular matrix is a major structural component of the tumor microenvironment and serves as a niche for cancer stem cells. It influences the recruitment of immune cells, impairs proliferation and activation of T cells, and induces EMT [20]. Previous studies showed that extracellular matrix-dependent disruption of cell adhesion could lead to increased cell motility and circulating tumor cells, consequently resulting in elevated relapse and mortality risk in breast cancer [21,22]. The cell cycle role of APC in the cell cycle regulation pathway was enriched in both positively correlated genes of tRFdb-5024a and ts-34, suggesting that tRFdb-5024a and ts-34 may target different genes in the cell cycle pathway. Cell cycle-related genes include oncogenes and tumor suppressor genes. For example, Anaphase-Promoting Complex or Cyclosome (APC/C) is an E3 ubiquitin ligase and functions as a tumor suppressor by degrading CDKs [23], whereas high expression of CDK1 was previously reported to be correlated with poor survival [24]. Thus, it warrants further investigation of which distinct target gene(s) in the cell cycle pathway is targeted by tRFdb-5024a and ts-34. Interestingly, we found that ts-34 downregulated genes were enriched for breast cancer (general schema) pathway, where absent expression of PGR was correlated with poor survival [25]. Similarly, the WGCNA analysis showed that the ts-34 negatively correlated black module was enriched for the PR action in breast cancer: stimulation of cell growth and proliferation pathway. Absent expression of ESR1 and/or PGR showed resistance to hormonal therapy and higher risk of mortality [25,26]. The top two significant pathways, development microRNA-dependent regulation of EMT and TGF-beta signaling via microRNA in breast cancer, were enriched in both the positively correlated genes and green-yellow module of ts-58. This is consistent with the reports in the previous studies that high expression of TGF-beta and miR-21 was positively associated with poor prognosis in breast cancer [27,28]. The underlying mechanisms may involve the upregulation of development microRNA-dependent regulation of the EMT pathway and TGF-beta signaling via microRNA in breast cancer, which increases metastasis by promoting EMT [29]. In addition, the WGCNA results demonstrated new insights into potential functions of 5P_tRNA-Leu-CAA-4-1. The top significant pathway, ubiquinone metabolism pathway, was enriched in the positively correlated blue module of 5P_tRNA-Leu-CAA-4-1, where high expression of NDUFB2 had a better prognostic value in breast cancer patients [14]. Figure 5 illustrates a schematic pathway diagram that presents the potential molecular mechanisms of vital-associated tRFs in breast cancer in this study. The biological functions of ts-49 remains to be explored in the future.
There are several caveats and limitations in this study. First, molecular subtype information is available on a small subset of patients, preventing us from incorporating it into the analysis. Whether and how the effect of tRFs and their interactions with the T cell activation status on patient survival varying with different molecular subtypes remains to be investigated in the future. Second, chemotherapy information is unavailable in this study so that we cannot include chemotherapy as a covariate in the multivariate Cox regression models. Thus, interpretation and generalization of the results need to be cautious. However, as the standard care for breast cancer is surgical resection followed by adjuvant chemotherapy for all patients except for those who were too sick to tolerate chemotherapy, leading to a relatively small proportion of patients without chemotherapy in clinic practice, our results might be robust given that the sample size is relatively large in this study.

4. Materials and Methods

4.1. Study subjects and Data Sources

Included in this study were 1081 female patients with primary breast cancer. Their clinical data were obtained from The Cancer Genome Atlas (TCGA) breast invasive carcinoma study [30]. The normalized RNA sequencing data were downloaded from the TCGA-BRCA project in Genomic Data Commons (GDC) data portal [31], which provided expression levels of 60,483 mRNA transcripts. T cell activation scores were computed based on 13 genes related to T cell activation status (NKG7, CCL4, CST7, PRF1, GZMA, GZMB, IFNG, CCL3, PD-1, TIGIT, LAG3, TIM3, and CTLA4), as described previously [12]. To obtain expression of tRFs, small RNA raw sequencing reads were processed for quality control and then realigned to the human reference genome (hg19) and the human genomic tRNA database [32,33]. We used normalized count matrix consisting of 232 distinct tRFs from the tRFexplorer database in our analysis [34,35].
One thousand and fifty-eight patients had clinical, mRNA gene expression, and tRFs data, and were retained for further analysis. The average age at diagnosis was 58.4 (range: 26–90) years old. Among the 1048 patients with disease stage information, most were diagnosed with breast cancer at an early stage including 178 (17.0%) at stage I and 600 (57.3%) at stage II. The other 270 patients (25.7%) were diagnosed at an advanced stage (III or IV). There were 1056 patients with histological type information: 71.5% (n = 755) ductal carcinoma, 18.8% (n = 198) lobular, 4.9 % (n = 52) mix, and 4.8% (n = 51) other. Among the 1009 women with a known ER status, 77.0% (n = 777) were positive and 23.0% (n = 232) were negative. Among the 1006 patients with a known progesterone receptor (PR) status, 67.0% (n = 674) were positive and 33.0% (n = 332) were negative. There are 700 patients with HER2 information: 22.3% (n = 156) were positive and 77.7% (n = 544) were negative. The average length of follow-up in the 1058 patients was 40.8 (range: 0–282.7) months and 147 patients died during the follow-up period.

4.2. Statistical Analyses

Multivariate Cox proportional hazards models were used to evaluate the relationship between the expression of tRFs and overall survival, adjusting for covariates including the patient’s age at diagnosis, disease stage, histological type, and T cell activation status. Both the expression of tRFs and the T cell activation score were treated as categorical variables in the analysis. For each tRF, patients were classified into two groups, high and low, with the cutoff value to be the median of the expression level. T cell activation status, activation or exhaustion, was defined as previously described [12]. We first selected a small set of tRFs with a p-value < 0.05 by the Cox regression model with a single tRF adjusting for covariates. Then the multivariate Cox model with backward elimination was conducted to select significant tRFs and obtain adjusted hazards ratios (HRs) with 95% confidence intervals (95% CIs). The interaction between T cell activation status and expression of tRFs were evaluated by including it in the Cox regression model as an interaction term. Backward elimination using Akaike information criterion was performed for model selection. We also assessed effects of tRFs on overall survival in each subgroup stratified by the T cell activation status using Kaplan–Meier survival curves. Proportional hazards assumption was examined in the analysis. For each clinical pathological variable, Wilcoxon test and Kruskal–Wallis test were used to evaluate differential expression of tRFs between patients from different pathological categories. In all statistical analyses, p-value less than 0.05 was considered to be significant. All analyses were performed in R [36].

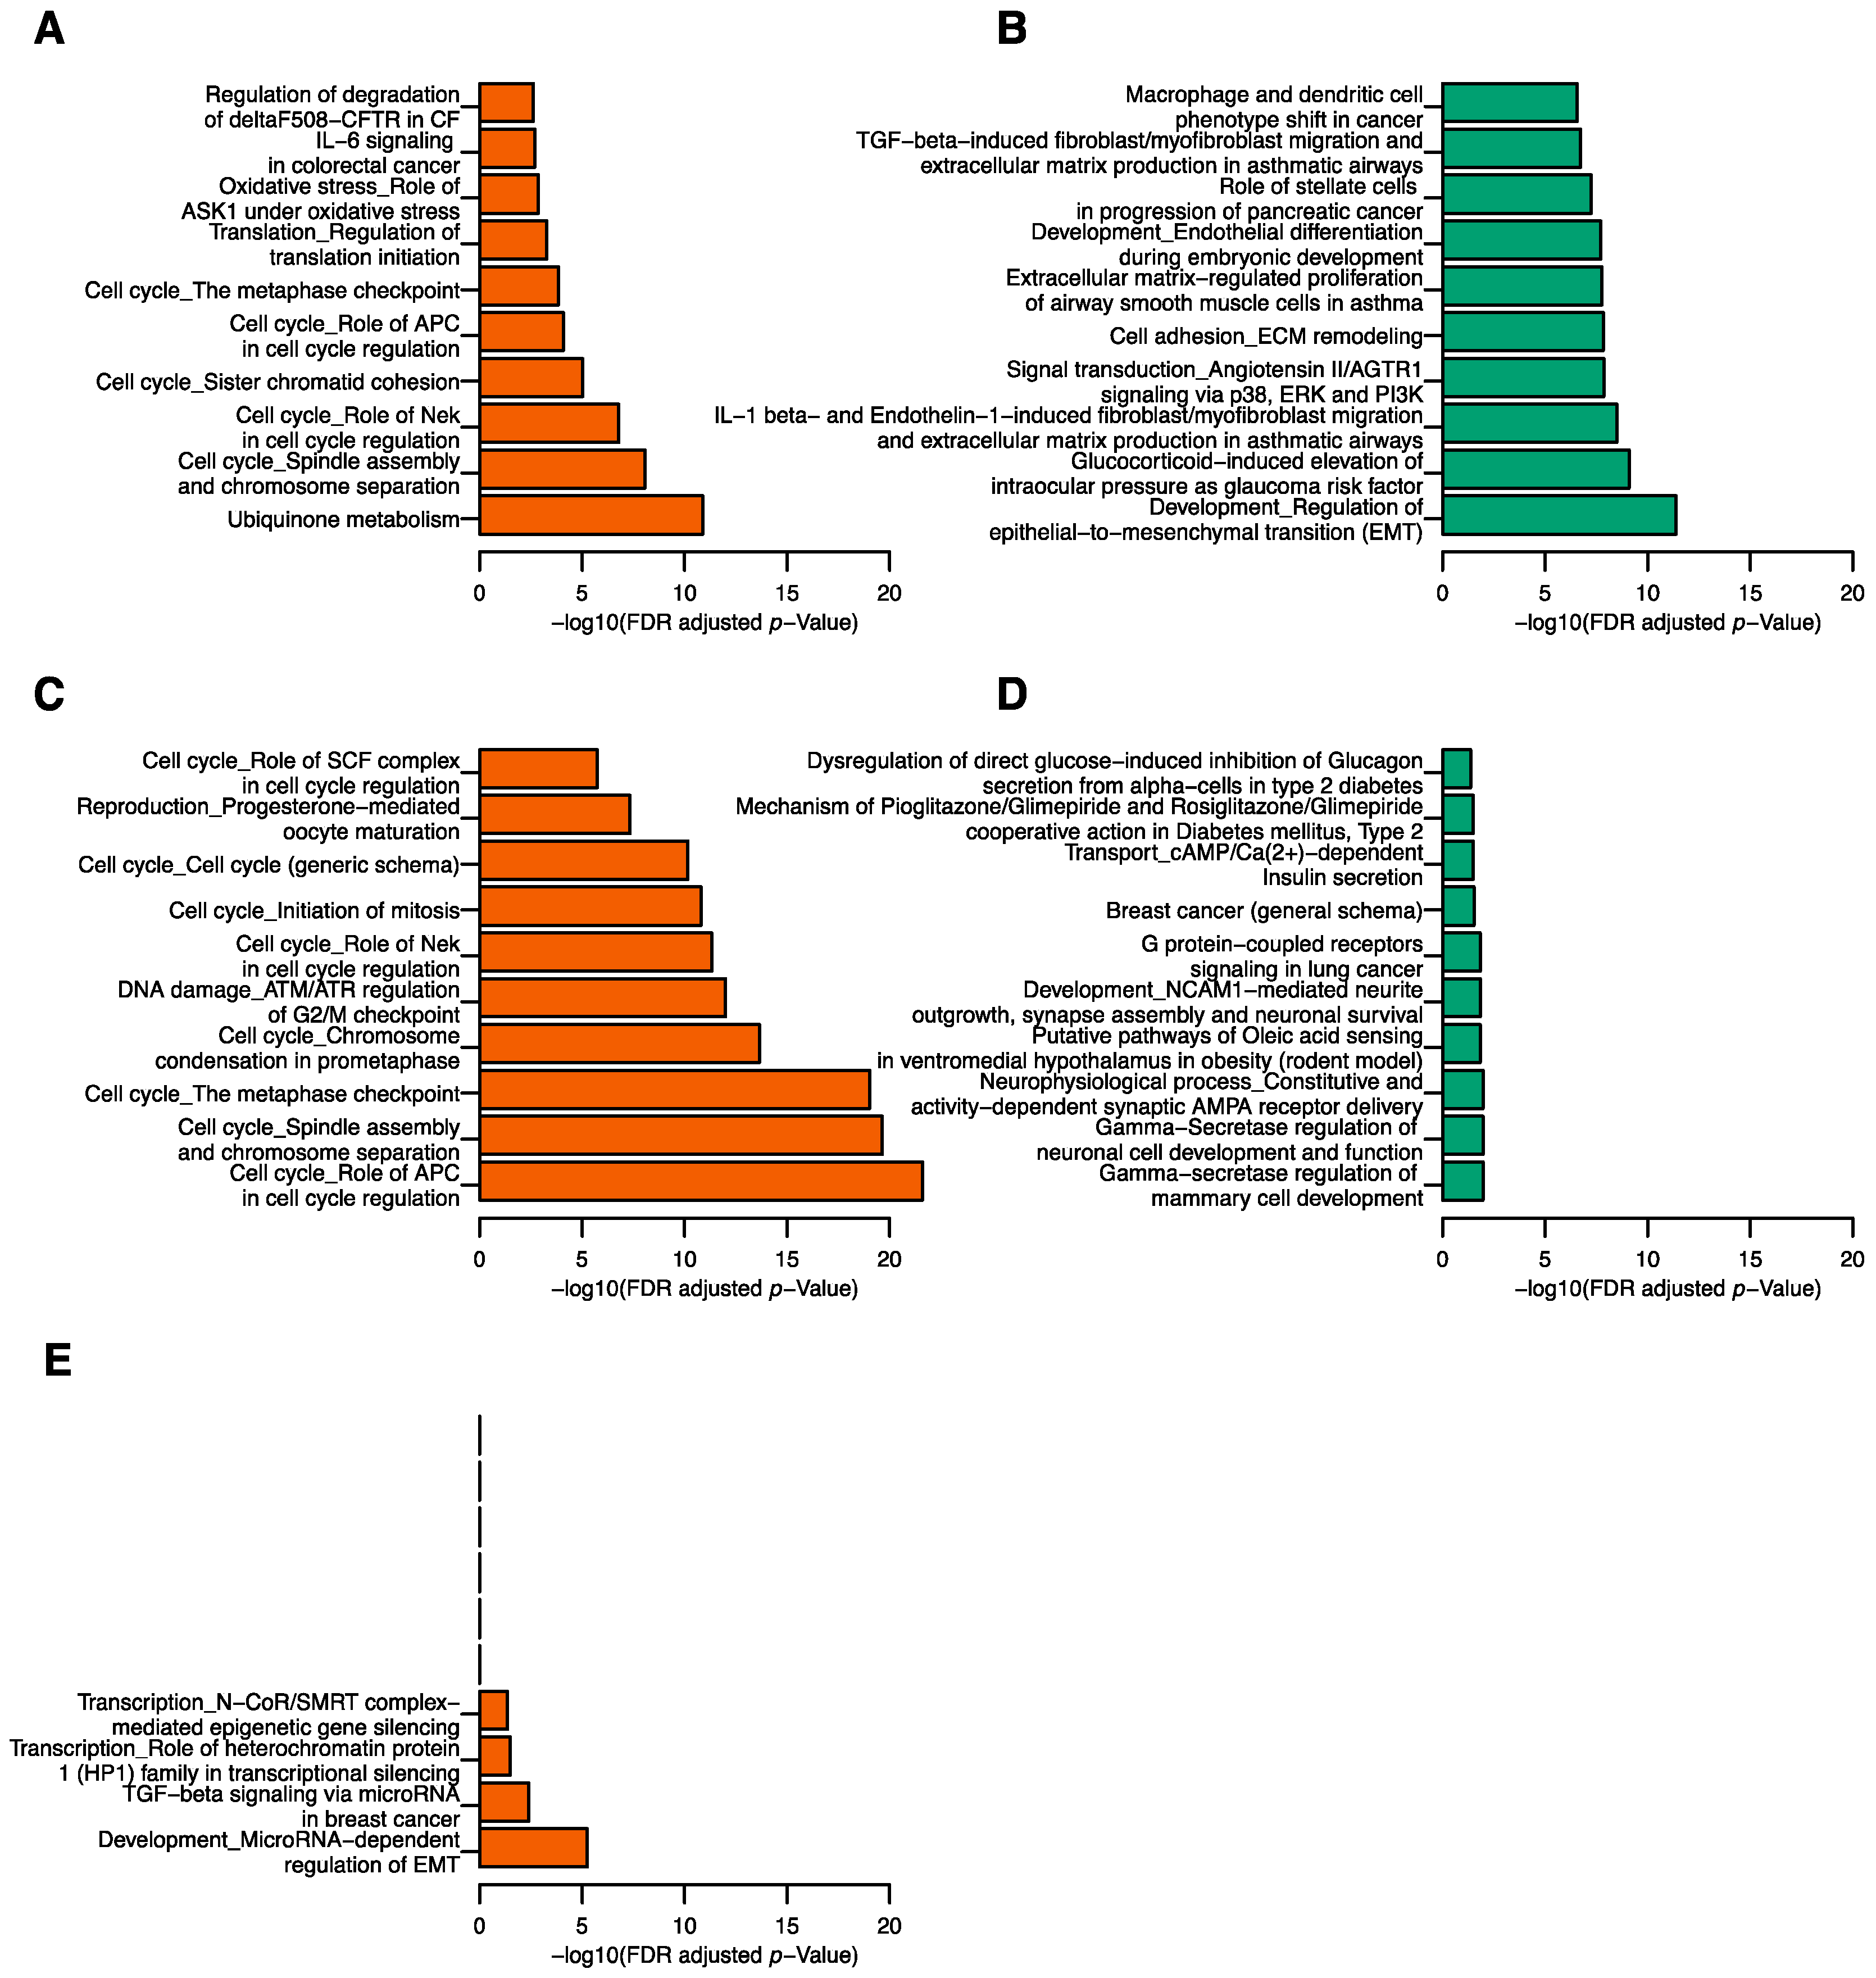
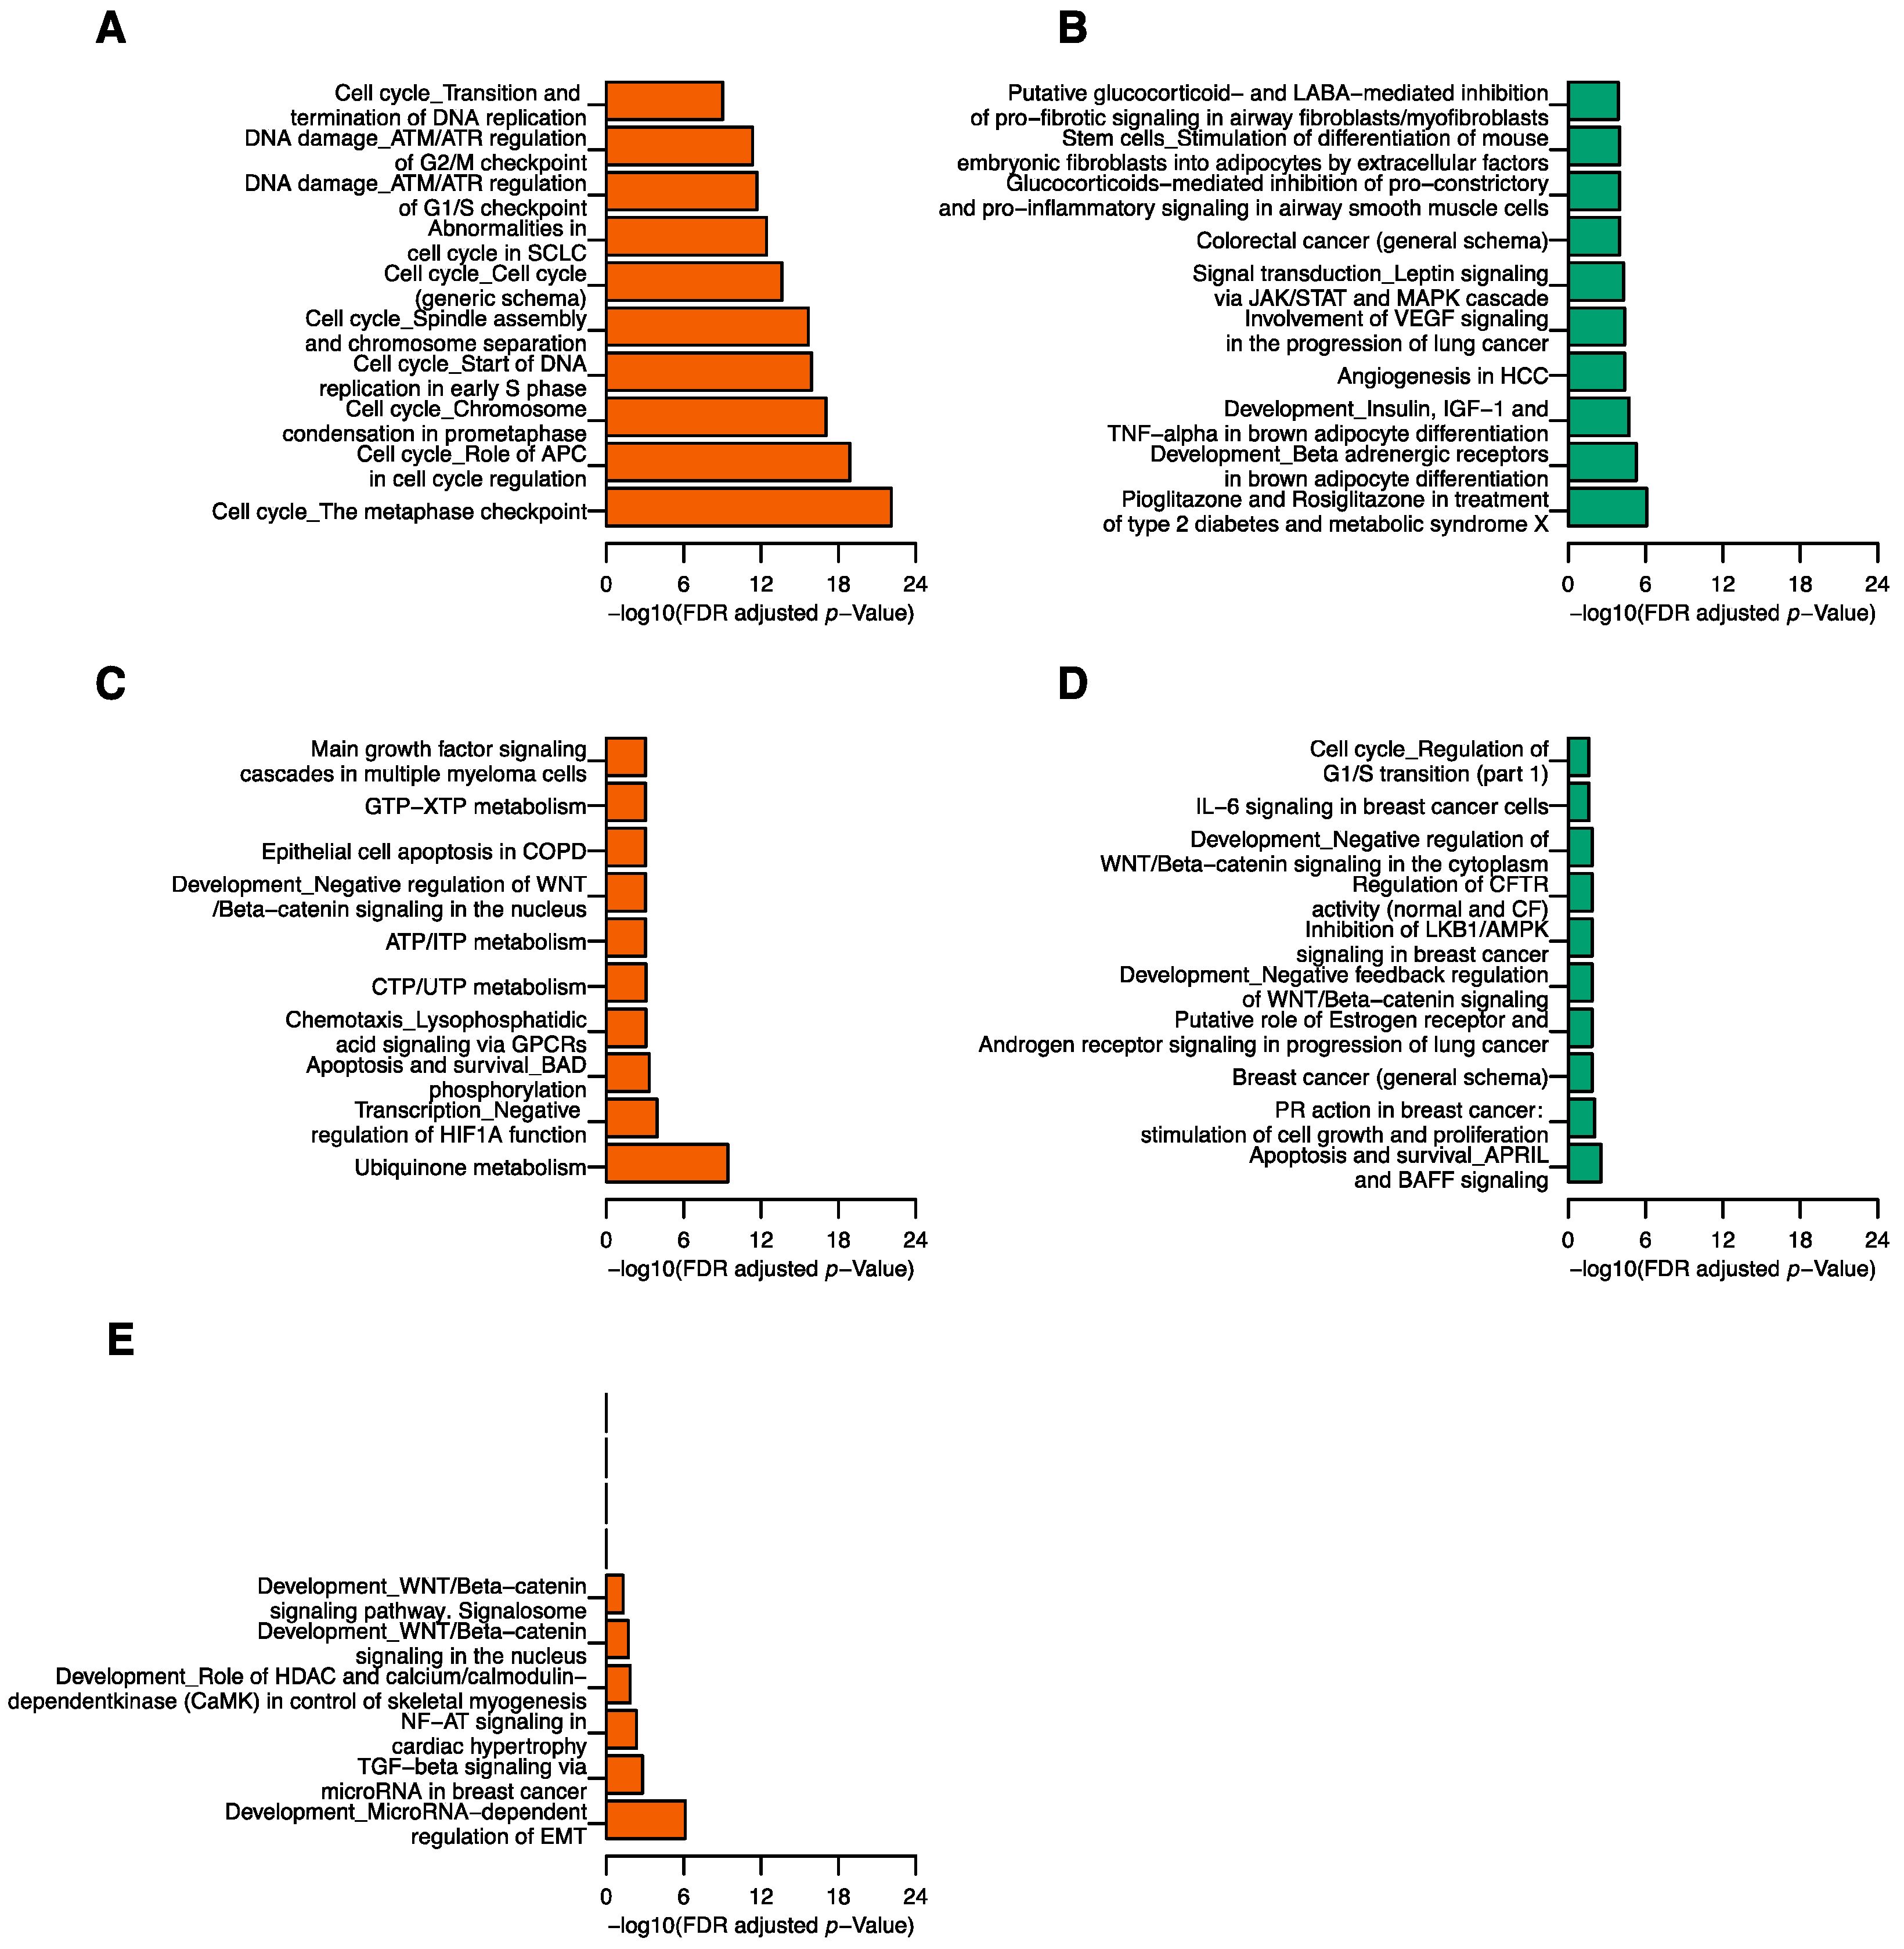
4.3. Functional Pathway Analysis

To understand the biological functions of tRFs in breast cancer progression, we performed functional pathway analysis using the MetaCore software [37]. Spearman correlation analysis was carried out to assess correlations between significant tRFs identified in the Cox regression models and mRNA expression levels. Positively and negatively correlated genes with a Bonferroni corrected p-value < 0.05 were included in a pathway analysis separately. We also performed WGCNA to construct gene correlation networks and identify modules of highly correlated genes [38]. In the WGCNA analysis, we first excluded genes with no variation (standard deviation of fragments per kilobase million (FPKM) = 0) or with low expression (FPKM < 0.05) in 90% of the samples. Then, we clustered patients based on their gene expression profiles and removed sample outliers. Lastly, we applied WGCNA with the default setting to obtain gene modules and their correlation with significant tRFs and clinical pathological variables. Genes in top modules with the highest positive or negative correlation coefficients with each tRF and p-value < 0.001 were selected for the pathway analysis. Fisher’s exact test was used to determine whether a gene module is enriched for a functional pathway. Pathways with a false discovery rate (FDR) < 0.05 were considered to be significant. We reported pathways that are significant and more than one gene overlapped with the gene module [39].

5. Conclusions

In this study, we integrated multiple data types to elucidate the effect of tRFs and their interactions with T cell activation score on patient survival in breast cancer and to uncover the biological relevance of tRFs with statistical significance. We identified five tRFs that were significantly associated with patient survival in breast cancer, especially in the T cell exhaustion group, suggesting that these five tRFs are potential therapeutic targets to improve patient survival, and may have implication in improving immunotherapy in breast cancer. Moreover, our results provided novel knowledge in biological functions of the tRFs in breast cancer.

Supplementary Materials

The following are available online at https://www.mdpi.com/2072-6694/12/8/2230/s1, Table S1: A full list of tRFs with their sequences and p-value, Table S2: Differential expression of tRFs between patients from different pathological categories, Table S3: Significant pathways enriched in positively and negatively correlated genes of tRFdb-5024a, Table S4: Significant pathways enriched in positively and negatively correlated genes of ts-34, Table S5: Significant pathways enriched in positively correlated genes of ts-58, Table S6: Significant pathways enriched in pink, yellow, blue, black, and green-yellow modules.

Author Contributions

Conceptualization, L.L. and Z.W.; methodology, N.S., L.L. and Z.W.; formal analysis, N.S.; investigation, N.S., N.L., L.L. and Z.W.; resources, L.L. and Z.W.; data curation, N.S., N.L., Q.D.; writing—original draft preparation, N.S., L.L. and Z.W.; writing—review and editing, N.S., L.H., X.Y., A.A., L.L. and Z.W.; visualization, N.S., L.H., X.Y., A.A., L.L. and Z.W.; supervision, L.L. and Z.W.; funding acquisition, Z.W. All authors have read and agreed to the published version of the manuscript.

Funding

This study was supported by the National Institutes of Health (NIH), grant number K01AA023321. N.S. and N.L. were supported in part by China Scholarship Council.

Acknowledgments

We thank two anonymous reviewers for thoughtful and constructive comments to improve the manuscript.

Conflicts of Interest

The authors declare no conflict of interest.

References

  1. Pekarsky, Y.; Balatti, V.; Palamarchuk, A.; Rizzotto, L.; Veneziano, D.; Nigita, G.; Rassenti, L.Z.; Pass, H.I.; Kipps, T.J.; Liu, C.G.; et al. Dysregulation of a family of short noncoding RNAs, tsRNAs, in human cancer. Proc. Natl. Acad. Sci. USA 2016, 113, 5071–5076. [Google Scholar] [CrossRef] [PubMed] [Green Version]
  2. Balatti, V.; Nigita, G.; Veneziano, D.; Drusco, A.; Stein, G.S.; Messier, T.L.; Farina, N.H.; Lian, J.B.; Tomasello, L.; Liu, C.G.; et al. tsRNA signatures in cancer. Proc. Natl. Acad. Sci. USA 2017, 114, 8071–8076. [Google Scholar] [CrossRef] [PubMed] [Green Version]
  3. Slack, F.J. Tackling Tumors with Small RNAs Derived from Transfer RNA. N. Engl. J. Med. 2018, 378, 1842–1843. [Google Scholar] [CrossRef] [PubMed]
  4. Dhahbi, J.M.; Spindler, S.R.; Atamna, H.; Boffelli, D.; Martin, D.I. Deep Sequencing of Serum Small RNAs Identifies Patterns of 5′ tRNA Half and YRNA Fragment Expression Associated with Breast Cancer. Biomark. Cancer 2014, 6, 37–47. [Google Scholar] [CrossRef] [Green Version]
  5. Goodarzi, H.; Liu, X.; Nguyen, H.C.; Zhang, S.; Fish, L.; Tavazoie, S.F. Endogenous tRNA-Derived Fragments Suppress Breast Cancer Progression via YBX1 Displacement. Cell 2015, 161, 790–802. [Google Scholar] [CrossRef] [Green Version]
  6. Honda, S.; Loher, P.; Shigematsu, M.; Palazzo, J.P.; Suzuki, R.; Imoto, I.; Rigoutsos, I.; Kirino, Y. Sex hormone-dependent tRNA halves enhance cell proliferation in breast and prostate cancers. Proc. Natl. Acad. Sci. USA 2015, 112, E3816–E3825. [Google Scholar] [CrossRef] [Green Version]
  7. Sun, C.; Yang, F.; Zhang, Y.; Chu, J.; Wang, J.; Wang, Y.; Zhang, Y.; Li, J.; Li, Y.; Fan, R.; et al. tRNA-Derived Fragments as Novel Predictive Biomarkers for Trastuzumab-Resistant Breast Cancer. Cell. Physiol. Biochem. 2018, 49, 419–431. [Google Scholar] [CrossRef]
  8. Feng, W.; Li, Y.; Chu, J.; Li, J.; Zhang, Y.; Ding, X.; Fu, Z.; Li, W.; Huang, X.; Yin, Y. Identification of tRNA-derived small noncoding RNAs as potential biomarkers for prediction of recurrence in triple-negative breast cancer. Cancer Med. 2018, 7, 5130–5144. [Google Scholar] [CrossRef] [Green Version]
  9. Dhahbi, J.M. 5′ tRNA Halves: The Next Generation of Immune Signaling Molecules. Front. Immunol. 2015, 6, 74. [Google Scholar] [CrossRef] [Green Version]
  10. Li, S.; Xu, Z.; Sheng, J. tRNA-Derived Small RNA: A Novel Regulatory Small Non-Coding RNA. Genes 2018, 9, 246. [Google Scholar] [CrossRef] [Green Version]
  11. Wang, Z.; Xiang, L.; Shao, J.; Yuan, Z. The 3′ CCACCA sequence of tRNAAla(UGC) is the motif that is important in inducing Th1-like immune response, and this motif can be recognized by Toll-like receptor 3. Clin. Vaccine Immunol. 2006, 13, 733–739. [Google Scholar] [CrossRef] [PubMed] [Green Version]
  12. Lu, L.; Bai, Y.; Wang, Z. Elevated T cell activation score is associated with improved survival of breast cancer. Breast Cancer Res. Treat. 2017, 164, 689–696. [Google Scholar] [CrossRef] [PubMed]
  13. Lu, L.; Huang, H.; Zhou, J.; Ma, W.; Mackay, S.; Wang, Z. BRCA1 mRNA expression modifies the effect of T cell activation score on patient survival in breast cancer. BMC Cancer 2019, 19, 387. [Google Scholar] [CrossRef] [PubMed] [Green Version]
  14. Li, L.D.; Sun, H.F.; Liu, X.X.; Gao, S.P.; Jiang, H.L.; Hu, X.; Jin, W. Down-Regulation of NDUFB9 Promotes Breast Cancer Cell Proliferation, Metastasis by Mediating Mitochondrial Metabolism. PLoS ONE 2015, 10, e0144441. [Google Scholar] [CrossRef] [PubMed]
  15. Olvedy, M.; Scaravilli, M.; Hoogstrate, Y.; Visakorpi, T.; Jenster, G.; Martens-Uzunova, E.S. A comprehensive repertoire of tRNA-derived fragments in prostate cancer. Oncotarget 2016, 7, 24766–24777. [Google Scholar] [CrossRef] [PubMed]
  16. Huang, B.; Yang, H.; Cheng, X.; Wang, D.; Fu, S.; Shen, W.; Zhang, Q.; Zhang, L.; Xue, Z.; Li, Y.; et al. tRF/miR-1280 Suppresses Stem Cell-like Cells and Metastasis in Colorectal Cancer. Cancer Res. 2017, 77, 3194–3206. [Google Scholar] [CrossRef] [Green Version]
  17. Shao, Y.; Sun, Q.; Liu, X.; Wang, P.; Wu, R.; Ma, Z. tRF-Leu-CAG promotes cell proliferation and cell cycle in non-small cell lung cancer. Chem. Biol. Drug Des. 2017, 90, 730–738. [Google Scholar] [CrossRef]
  18. Telonis, A.G.; Rigoutsos, I. Race Disparities in the Contribution of miRNA Isoforms and tRNA-Derived Fragments to Triple-Negative Breast Cancer. Cancer Res. 2018, 78, 1140–1154. [Google Scholar] [CrossRef] [Green Version]
  19. Weidenfeld, K.; Barkan, D. EMT and Stemness in Tumor Dormancy and Outgrowth: Are They Intertwined Processes? Front. Oncol. 2018, 8, 381. [Google Scholar] [CrossRef]
  20. Nallanthighal, S.; Heiserman, J.P.; Cheon, D.J. The Role of the Extracellular Matrix in Cancer Stemness. Front. Cell Dev. Biol. 2019, 7, 86. [Google Scholar] [CrossRef]
  21. Lu, L.; Zeng, H.; Gu, X.; Ma, W. Circulating tumor cell clusters-associated gene plakoglobin and breast cancer survival. Breast Cancer Res. Treat. 2015, 151, 491–500. [Google Scholar] [CrossRef] [PubMed]
  22. Todorović, V.; Desai, B.V.; Patterson, M.J.; Amargo, E.V.; Dubash, A.D.; Yin, T.; Jones, J.C.; Green, K.J. Plakoglobin regulates cell motility through Rho- and fibronectin-dependent Src signaling. J. Cell Sci. 2010, 123, 3576–3586. [Google Scholar] [CrossRef] [PubMed] [Green Version]
  23. Barnum, K.J.; O’Connell, M.J. Cell cycle regulation by checkpoints. In Cell Cycle Control; Humana Press: New York, NY, USA, 2014; pp. 29–40. [Google Scholar]
  24. Lu, Y.; Yang, G.; Xiao, Y.; Zhang, T.; Su, F.; Chang, R.; Ling, X.; Bai, Y. Upregulated cyclins may be novel genes for triple-negative breast cancer based on bioinformatic analysis. Breast Cancer 2020. [Google Scholar] [CrossRef] [PubMed]
  25. Purdie, C.A.; Quinlan, P.; Jordan, L.B.; Ashfield, A.; Ogston, S.; Dewar, J.A.; Thompson, A.M. Progesterone receptor expression is an independent prognostic variable in early breast cancer: A population-based study. Br. J. Cancer 2014, 110, 565–572. [Google Scholar] [CrossRef] [Green Version]
  26. Dunnwald, L.K.; Rossing, M.A.; Li, C.I. Hormone receptor status, tumor characteristics, and prognosis: A prospective cohort of breast cancer patients. Breast Cancer Res. 2007, 9, R6. [Google Scholar] [CrossRef]
  27. Qian, B.; Katsaros, D.; Lu, L.; Preti, M.; Durando, A.; Arisio, R.; Mu, L.; Yu, H. High miR-21 expression in breast cancer associated with poor disease-free survival in early stage disease and high TGF-beta1. Breast Cancer Res. Treat. 2009, 117, 131–140. [Google Scholar] [CrossRef]
  28. Mu, L.; Katsaros, D.; Lu, L.; Preti, M.; Durando, A.; Arisio, R.; Yu, H. TGF-beta1 genotype and phenotype in breast cancer and their associations with IGFs and patient survival. Br. J. Cancer 2008, 99, 1357–1363. [Google Scholar] [CrossRef] [Green Version]
  29. Xu, Q.; Wang, L.; Li, H.; Han, Q.; Li, J.; Qu, X.; Huang, S.; Zhao, R.C. Mesenchymal stem cells play a potential role in regulating the establishment and maintenance of epithelial-mesenchymal transition in MCF7 human breast cancer cells by paracrine and induced autocrine TGF-β. Int. J. Oncol. 2012, 41, 959–968. [Google Scholar] [CrossRef] [Green Version]
  30. cBioPortal. Available online: http://www.cbioportal.org/ (accessed on 10 July 2018).
  31. Genomic Data Commons Data Portal. Available online: https://portal.gdc.cancer.gov/ (accessed on 10 November 2018).
  32. GtRNAdb. Available online: http://gtrnadb.ucsc.edu/ (accessed on 3 December 2019).
  33. Chan, P.P.; Lowe, T.M. GtRNAdb 2.0: An expanded database of transfer RNA genes identified in complete and draft genomes. Nucleic Acids Res. 2016, 44, D184–D189. [Google Scholar] [CrossRef] [Green Version]
  34. tRFexplorer. Available online: https://trfexplorer.cloud/ (accessed on 3 December 2019).
  35. La Ferlita, A.; Alaimo, S.; Veneziano, D.; Nigita, G.; Balatti, V.; Croce, C.M.; Ferro, A.; Pulvirenti, A. Identification of tRNA-derived ncRNAs in TCGA and NCI-60 panel cell lines and development of the public database tRFexplorer. Database 2019, 2019. [Google Scholar] [CrossRef]
  36. The R Project for Statistical Computing. Available online: https://www.r-project.org/ (accessed on 19 January 2019).
  37. Dubovenko, A.; Nikolsky, Y.; Rakhmatulin, E.; Nikolskaya, T. Functional Analysis of OMICs Data and Small Molecule Compounds in an Integrated “Knowledge-Based” Platform. In Biological Networks and Pathway Analysis; Humana Press: New York, NY, USA, 2017; pp. 101–124. [Google Scholar]
  38. Langfelder, P.; Horvath, S. WGCNA: An R package for weighted correlation network analysis. BMC Bioinform. 2008, 9, 559. [Google Scholar] [CrossRef] [PubMed] [Green Version]
  39. Yu, J.X.; Sieuwerts, A.M.; Zhang, Y.; Martens, J.W.; Smid, M.; Klijn, J.G.; Wang, Y.; Foekens, J.A. Pathway analysis of gene signatures predicting metastasis of node-negative primary breast cancer. BMC Cancer 2007, 7, 182. [Google Scholar] [CrossRef] [PubMed] [Green Version]
Figure 1. Kaplan–Meier survival curves of breast cancer patients stratified by T cell activation status. (A) In the exhaustion group, patients with a low level of ts-34 had better overall survival compared to those with a high level (p = 0.03). (B) In the activation group, there was no significant difference in overall survival between patients in the high and low levels of ts-34 (p = 0.60). (C) In the exhaustion group, patients with a high level of ts-49 had better overall survival compared to those with a low level (p = 0.04). (D) In the activation group, there was no significant difference in overall survival between patients in the high and low levels of ts-49 (p = 0.10).
Cancers 12 02230 g001
Figure 2. Top gene pathways associated with tRFs. Top 10 pathways from the positively (A) and negatively (B) correlated genes of tRFdb-5024a, positively (C) and negatively (D) correlated genes of ts-34, and positively correlated genes of ts-58 (E).
Cancers 12 02230 g002
Figure 3. Correlation of gene modules with tRFs and clinical pathological variables. Row represents module eigengenes, column represents tRFs or clinical variables. Each cell displays the corresponding correlation coefficient and p-value. (A) Heatmap of correlations between module eigengenes and expression of the five tRFs. (B) Heatmap of correlations between module eigengenes and clinical variables.
Cancers 12 02230 g003
Figure 4. Top pathways of gene modules associated with tRFs. Top 10 pathways enriched in pink (A), yellow (B), blue(C), black (D), and green-yellow (E) modules.
Cancers 12 02230 g004
Figure 5. A schematic pathway diagram of the potential molecular mechanisms of vital-associated tRFs in breast cancer.
Cancers 12 02230 g005
Table 1. Relationships between overall survival and tRNA-derived fragments (tRFs).
Variables Death
HR95% CIp-Value
T Cell Activation
 Exhaustion1.00
 Activation0.480.27–0.830.009
tRFdb-5024a
 Low1.00
 High0.520.37–0.74p < 0.001
5P_tRNA-Leu-CAA-4-1
 Low1.00
 High0.550.35–0.870.011
ts-34
 Low1.00
 High1.621.08–2.440.019
ts-49
 Low1.00
 High0.400.17–0.930.032
ts-58
 Low1.00
 High1.561.10–2.200.013
tRFdb-1040
 Low1.00
 High1.490.93–2.380.096
5P_tRNA-Ala-AGC-8-2
 Low1.00
 High1.490.99–2.270.059
ts-13
 Low1.00
 High1.380.94–2.030.103
Age (per 5 years)1.211.13–1.29p < 0.001
Disease Stage
 Stage I1.00
 Stage II2.381.31–4.310.004
 Stage III or IV7.033.84–12.85p < 0.001
Histological type
 Ductal1.00
 Lobular0.550.34–0.870.011
 Mix0.590.28–1.240.161
 Other2.381.24–4.570.009
Table 2. Interactions between T cell activation status and tRFs in the whole sample.
Variables Death
HR95% CIp-Value
T Cell Activation
 Exhaustion1.00
 Activation0.600.32–1.120.110
tRFdb-5024a
 Low1.00
 High0.500.36–0.71p < 0.001
5P_tRNA-Leu-CAA-4-1
 Low1.00
 High0.580.37–0.920.021
ts-34
 Low1.00
 High2.121.40–3.22p < 0.001
ts-49
 Low1.00
 High0.270.10–0.740.011
ts-58
 Low1.00
 High1.511.07–2.120.018
T cell Activation × ts-340.220.05–0.940.040
T cell Activation × ts-4913.492.00–91.020.008
Age (per 5 years)1.201.12–1.28p < 0.001
Disease Stage
 Stage I1.00
 Stage II2.181.21–3.940.010
 Stage III or IV6.353.50–11.52p < 0.001
Histological type
 Ductal1.00
 Lobular0.530.33–0.830.006
 Mix0.560.26–1.190.130
 Other2.601.34–5.020.005
Table 3. Relationships between overall survival and tRFs stratified by T cell activation status.
Stratification VariableVariablesDeath
HR95% CIp-Value
T cell Exhaustion grouptRFdb-5024a
 Low1.00
 High0.510.35–0.73p < 0.001
5P_tRNA-Leu-CAA-4-1
 Low1.00
 High0.540.33–0.880.014
ts-34
 Low1.00
 High2.131.40–3.23p < 0.001
ts-49
 Low1.00
 High0.280.10–0.760.013
ts-58
 Low1.00
 High1.581.10–2.260.013
Age (per 5 years)1.211.13–1.30p < 0.001
Disease Stage
 Stage I1.00
 Stage II2.601.35–4.990.004
 Stage III or IV7.183.72–13.86p < 0.001
Histological type
 Ductal1.00
 Lobular0.490.30–0.800.004
 Mix0.510.23–1.120.094
 Other2.160.98–4.760.056
T cell Activation grouptRFdb-5024a
 Low1.00
 High0.570.15–2.060.388
5P_tRNA-Leu-CAA-4-1
 Low1.00
 High0.550.12–2.490.442
ts-34
 Low1.00
 High0.180.03-1.140.069
ts-49
 Low1.00
 High3.910.61–24.950.150
ts-58
 Low1.00
 High0.500.14–1.810.291
Age (per 5 years)1.160.94–1.430.157
Disease Stage
 Stage I1.00
 Stage II0.530.11–2.710.449
 Stage III or IV4.370.74–25.680.103
Histological type
 Ductal1.00
 Lobular0.990.19–5.320.999
 Mix3.650.33–40.560.292
 Other6.211.39–27.710.017

