1. Introduction
Breast cancer is the most common form of cancer, as well as the second leading cancer-related death among Canadian women [
1]. According to Canadian Cancer Statistics, 1 in 8 Canadian women will develop breast cancer in their lifetime, while 1 in 33 will die from it [
1]. Understanding the complexity of the disease is urgently required to find personalized therapy for various kinds (i.e., estrogen receptor (ER)-positive and ER-negative; progesterone receptor (PR)-positive and PR-negative; human epidermal growth factor receptor 2 (HER2)-positive and HER2-negative; and triple-negative (ER-PR-HER2-negative)) of breast cancer, as there is no single target for treating such a complex malignancy. One of the factors that contribute to the complexity of tumor growth, metastasis, and patient survival in breast cancer is the level of hypoxia (oxygen deficiency) within the tumor microenvironment [
2]. Due to their rapid proliferation, cancer cells outgrow the available blood supply. This limits the delivery of oxygen and nutrients to the cells, making the center of the aggressively growing tumor largely hypoxic [
2]. To counteract hypoxia, cancerous cells secrete growth factors and stimulants that facilitate tumor-associated angiogenesis in the tumor microenvironment to deliver the required oxygen and nutrients to dividing tumor cells [
3].
Hypoxia influences multiple signaling pathways in cells, including the hypoxia-inducible factor (HIF), NFκB, ERK, and PI3K/Akt/mTOR pathways, which regulate apoptosis, migration, proliferation, and inflammation in cancer [
4,
5,
6]. HIF-1 is a heterodimer composed of the HIF-1α and HIF-1β subunits. Under normoxia (physiologically normal oxygen levels), both the HIF-1α and -1β subunits are constitutively expressed, but the HIF-1 dimer is not formed as the HIF-1α subunit is degraded in the presence of oxygen [
4]. Under normoxic condition, the oxygen-dependent degradation domain of HIF-1α is hydroxylated by the PHD (prolyl hydroxylase domain) enzyme, which further allows the tumor suppressor pVHL (Von Hippel-Lindau) to catalyze the ubiquitin-dependent degradation of the HIF-1α protein [
7]. In hypoxic conditions, this hydroxylation does not occur, and pVHL does not catalyze the ubiquitination of the HIF-1α protein, allowing it to avoid degradation. The HIF-1α subunit can then dimerize with the HIF-1β subunit to form HIF-1 [
5]. HIF-1 is a transcription factor that binds to promoter regions and regulates the expression of multiple genes, including vascular endothelial growth factors (
VEGFs) (a pro-angiogenic agent), anaerobic respiration enzymes, glucose metabolism, and regulates microRNA (miRNA, miR) biogenesis and functions [
8,
9,
10]. The net effects of these changes increase the amount of ATP available to the tumor cell, promoting rapid growth.
miRNAs are defined as a group of endogenously-produced, small, non-coding RNAs that can downregulate gene expression of target messenger RNAs (mRNAs) at the post-transcription level by complete or partial complementary base pairing. Dysregulated miRNA expression has been associated with various cancers, including breast cancer [
3,
11,
12,
13,
14]. Using gene expression and miRNA microarray assays, we have identified that the overexpression of COX-2 in a poorly metastatic MCF7 cells (an ER/PR-positive and HER2-negative breast cancer cell line) upregulates two miRNAs, miR526b and miR655, which have been classified as oncogenic miRNAs in human breast cancer [
13,
14]. We found that miR526b and miR655 collectively target a total of 13 genes in COX-2 overexpressing MCF7 cells (MCF7-COX2), 12 of which are classified as tumor-suppressor-like genes [
15]. The single gene targeted by both miRNAs was identified as cytoplasmic polyadenylation element-binding protein 2 (
CPEB2). Recently, it was identified that
CPEB2 is a tumor suppressor gene, further validating miR526b and miR655 as oncogenic miRNAs promoting breast cancer by collectively targeting this gene [
15]. We have previously shown that in SKBR3, MDA-MB-231, and MCF7-COX2 cell lines COX-2, miR526b, and miR655 were upregulated, while
CPEB2 was downregulated [
15]. miR526b is located on a large cluster of miRNAs on chromosome 19 with the chromosomal location 19q13.42, in the gene family miR515 [
16,
17]. miR655 is located on a large cluster of miRNA on chromosome 14 on the host gene miR381HG in the chromosomal location 14q32.31 and belongs to the miR154 gene family [
17,
18].
We have also shown that miR526b and miR655 overexpression in ER-positive breast cancer cell line MCF7 and an ER-negative HER2-positive breast cancer cell line SKBR3 promotes epithelial-to-mesenchymal transition (EMT), cell migration, invasion, induction of stem-like cells (SLCs) phenotype, tumor growth, and metastasis in vivo [
13,
14]. In growing tumors, the core of the mass becomes hypoxic and requires a new means for oxygen delivery. This is achieved through tumor-associated angiogenesis, a phenotype that can be induced by the expression of certain miRNAs [
3,
19,
20]. We have identified that overexpression of miR526b/miR655 in MCF7 cells enhances tumor-associated angiogenesis and lymphangiogenesis by the production of VEGFA and that miRNA cell secretion enhances tube formation in vascular endothelial cells [
3]. Cancer cells can also mimic the properties of vascular endothelial cells to induce tumor-associated angiogenesis, known as vascular mimicry [
21,
22]. We have shown that in human breast tumors, miR526b and miR655 expression is highly correlated with angiogenesis and lymphangiogenesis markers (VEGFA, VEGFC, and VEGFD) [
3]. In this article, we investigated the roles of miRNA in promoting angiogenic marker expression and vascular mimicry in hypoxia.
EMT is an important biological process characterized by the progressive loss of cell-to-cell adhesion, alterations in cellular polarity, and actin cytoskeletal rearrangements leading to the formation of filopodia and upregulation of mesenchymal phenotypes and markers [
23]. Tumor cells lose intercellular junction proteins such as E-Cadherin (CDH1) and are able to travel through the extracellular matrix, in a process known as cell migration [
24]. EMT is necessary for the migration of embryonic cells to establish the development of an embryo, and to complete wound healing in adult tissues. However, EMT in cancer leads to the promotion of aggressive phenotypes, such as migration, invasion, angiogenesis, stem-like phenotypes in cancer cells, and resistance to chemo-radiotherapy [
25]. Previously, we have shown that miR526b and miR655 induce EMT in breast cancer, promote tumor cell migration and invasion [
13,
14], and that miRNA cell secretions enhance the migration of vascular endothelial cells to enhance angiogenesis [
3]. However, hypoxia’s influence on miRNA-induced EMT is not clear.
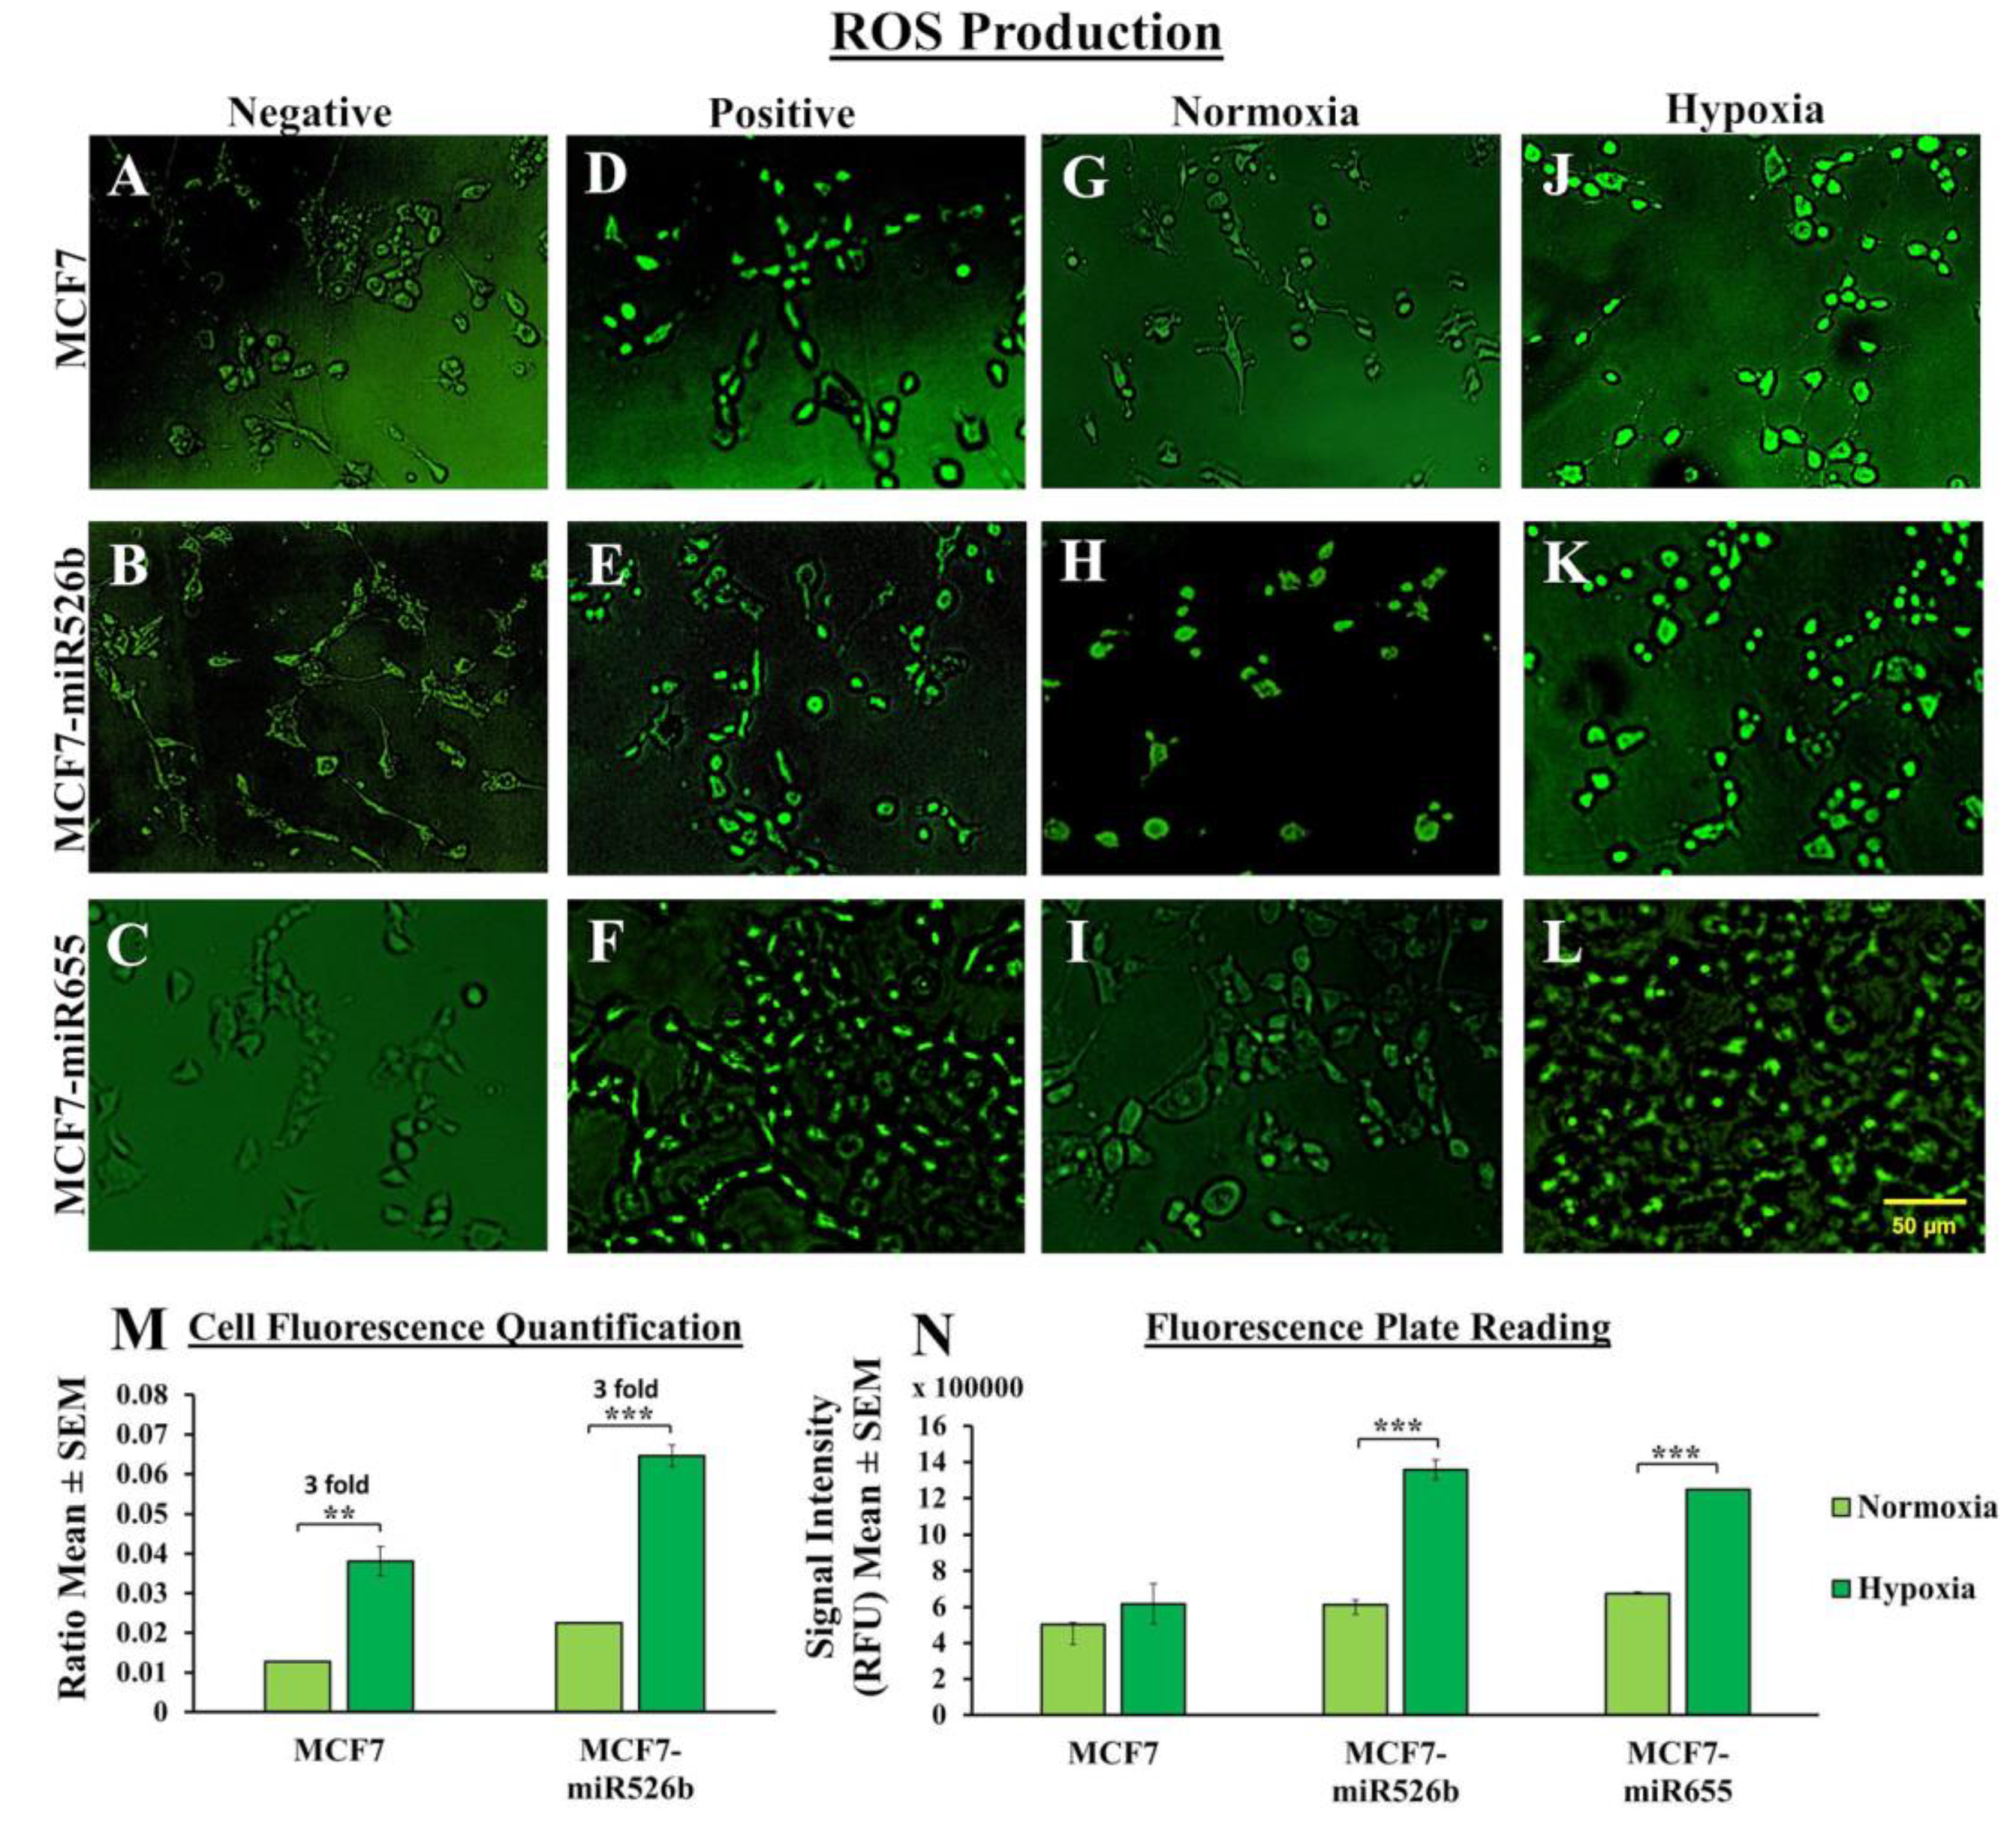
Another known phenotype in hypoxic tumors is the formation of reactive oxygen species (ROS), such as superoxide (SO), which are byproducts of cellular metabolism. Cellular inability to neutralize and eliminate these ROS leads to oxidative stress. Furthermore, increased levels of SO have shown regulation of signaling cascades for cell proliferation and survival [
26]. We have shown that a dynamic relationship exists between oxidative stress and miR526b/miR655 expression, where an increase in miRNA leads to an increase in ROS and SO. Likewise, an increase in ROS was shown to significantly increase miR526b and miR655 expression, suggesting that a positive feedback loop relationship between both miRNAs and oxidative stress is present in human breast cancer [
27]. We have previously shown that when we treat poorly metastatic breast cancer tumor cell line MCF7 and primary endothelial cell line human umbilical vein endothelial cells (HUVECs) with cell secretions from miR526b and miR655-overexpressing cells, there is an increase in ROS, SO, and oxidative stress marker thioredoxin reductase 1 (TXNRD1) expression. This suggests that miR526b/miR655-high cells’ metabolites induce oxidative stress in the tumor microenvironment. Thus, we wanted to investigate the effect of hypoxia on miRNA-induced oxidative stress in breast cancer cells.
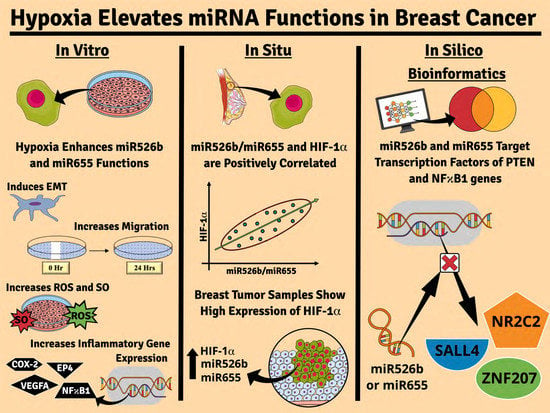
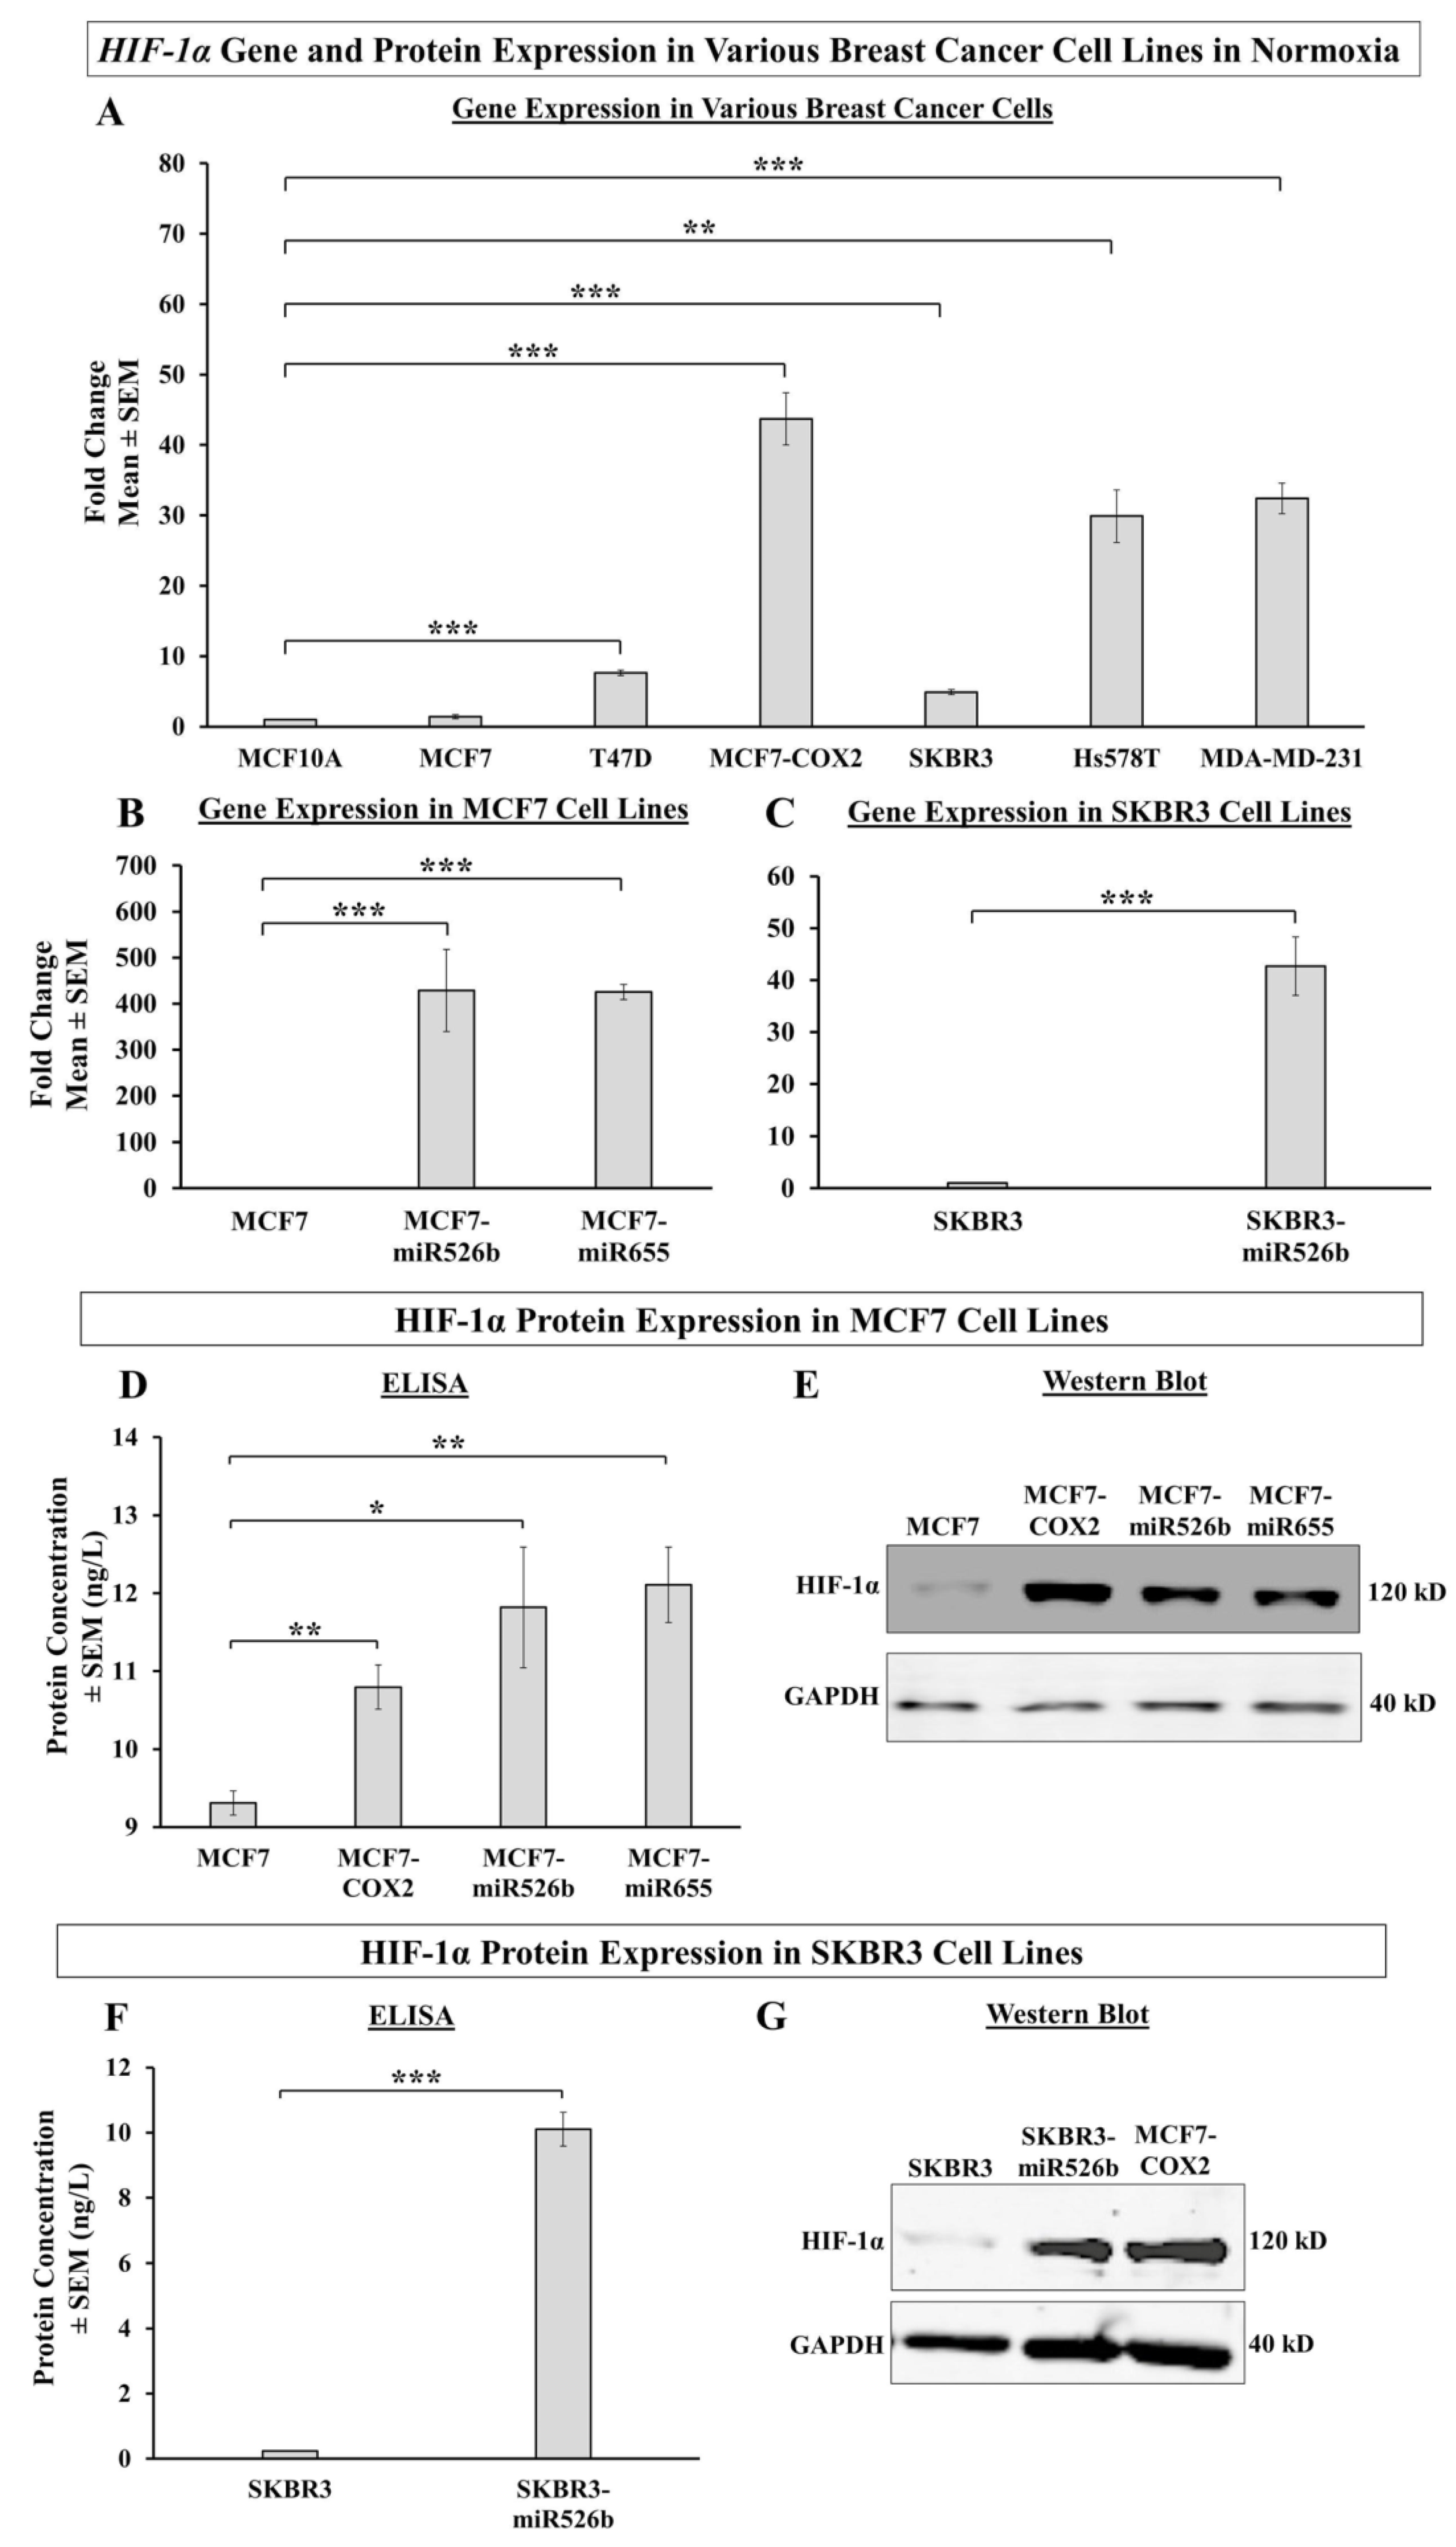
For the first time, with this specific research, we investigate the capability of miR526b, miR655, and hypoxia collaborating to promote aggressive breast cancer phenotypes. First, we show that highly metastatic and miRNA-high cell lines show high expression of
HIF-1α in normoxia, while poorly metastatic, miRNA-low cell lines show low expression. Next, we used CoCl
2 to induce hypoxia in ER-positive MCF7, MCF7-miR526b, and MCF7-miR655 cells, as well as HER2-positive SKBR3 and SKBR3-miR526b cells, since CoCl
2 has long been used as a chemical inducer of hypoxia and has been shown to induce
HIF-1α expression [
28,
29]. We further verified the effects of hypoxia enhancing miRNA-induced oxidative stress, cell migration, induction of EMT, expression of hypoxia-linked genes such as
VHL,
HIF-1α, and
NFκB1, and expression of inflammation-associated genes such as
VEGFA,
COX-2, and
EP4 in breast cancer cell lines. Here we demonstrated that hypoxia enhances oncogenic miRNA functions in breast cancer, which can be inhibited by COX-2, EP4, and PI3K/Akt signaling pathway inhibitors. In silico bioinformatics analysis further confirms that miRNA functions in hypoxia are regulated by COX-2/EP4/PI3K/Akt pathways and that miRNA has a negative correlation with transcription factors that regulate the expression of
NFκB1 and
PTEN. In human breast tumors,
HIF-1α expression is significantly high and we estimated the highest expression in the ER-positive, PR-positive, and HER2-negative breast tumors. Both miR526b and miR655 expression in breast tumors is positively and significantly correlated with
HIF-1α expression in the set of tumor samples we used in this study and also data extracted from The Cancer Genome Atlas (TCGA) cBioPortal database, which includes data from 16 different breast cancer studies, strongly suggesting that hypoxia and miRNAs collaborate to promote breast cancer progression. This is a novel function of miR526b and miR655 in breast cancer.
3. Discussion
The tumor microenvironment plays a major role in tumor growth and metastasis. An aggressively growing tumor goes through a phase of hypoxia, in which the center of the tumor mass is deprived of oxygen. In order to survive, tumor cells release growth factors and chemokines, which in turn promote angiogenesis, thus allowing the tumor to bypass apoptosis [
19,
30]. Hypoxia promotes angiogenesis, EMT, and oxidative stress in the tumor microenvironment [
30]. Our previous studies have demonstrated the roles of miR526b and miR655 as oncogenic miRNAs, promoting aggressive breast cancer phenotypes such as cell migration, invasion, tumor associated angiogenesis, cancer stem cell induction, oxidative stress, tumor growth, and metastasis [
3,
13,
14,
27]. Involvement of miRNAs to change and modulate the tumor microenvironment to promote breast cancer metastasis is a growing field of research. Thus, in this article, we tested the interaction and change of functions in two oncogenic miRNAs, miR526b, and miR655, in hypoxia.
Both hypoxia and miRNAs have been associated with the promotion of cancer in various studies, and one has been shown to regulate the other. For instance, Bandara et al. have shown that hypoxia-enhanced miRNAs play an important role in the hypoxic adaptation of cancer cells, and have demonstrated that hypoxia is also a regulator of miRNA biogenesis [
39]. Here we observed that hypoxia enhances miR526b and miR655 expression in ER-positive breast cancer cells. Another study by Bhandari et al. also shows hypoxia-enhanced miRNA dysregulation in various cancers, and identified miR133a-3p as a hypoxia-modulated miRNA [
40]. Hypoxia-induced miR590-5p was shown to stimulate matrix metalloprotease activity and stimulate cell migration and invasion [
41]. Conversely, Krutilina et al. discovered that miR-18a directly targets
HIF-1α, and downregulates hypoxic gene expression [
12] and in colon cancer miR22 was shown to inhibit hypoxia [
42].
HIF-1α is a transcription factor that acts as a marker for hypoxia in cells. In this study, we observed that aggressive miR526b/miR655-overexpressing cell lines (MCF7-COX2, MCF7-miR526b, MCF7-miR655, SKBR3-miR526b) produce high HIF-1α in normoxia, while poorly metastatic miRNA-low cell lines show a significantly lesser amount of HIF-1α. These results show that even under normoxic conditions, miRNA-high cell lines are naturally high in hypoxia marker expression, indicating that these miRNAs may be involved in hypoxia in breast cancer. This is supported by Kulshreshtha et al., showing miRNA directly regulates
HIF-1α gene expression in various cancers [
43]. We also observed that in hypoxia, there is a very significant increase in HIF-1α mRNA and protein expression in miRNA-high cell lines, in particular in ER-positive cells (MCF7-miR526b, MCF7-miR655) compared to miR-low MCF7 cells, indicating that this could be an ER-specific phenomena. Additionally, CoCl
2 treatment enhanced miR526b and miR655 expression in MCF7 cells as well, thus, an increase in HIF-1α expression in MCF7 cells could be due to miRNA expression upregulation. Furthermore, the expression of HIF-1α is partly controlled by a tumor suppressor pVHL, which tags HIF-1α and sends it for degradation under normoxic conditions [
44]. We found that the VHL gene was significantly downregulated in hypoxic conditions in miRNA-high cells, hence, HIF-1α expression enhanced. This established a strong link between miRNA and hypoxia.
Hypoxic conditions are the master regulators of oxidative stress, causing ROS production, DNA damage, promoting inflammation [
45,
46], and oxidative stress induces inflammatory miRNA production [
39,
47]. In our previous study, we have shown that miR526b and miR655 directly upregulate oxidative stress in breast cancer [
27]. Here, we observed that in MCF7-miR526b and MCF7-miR655 cells, ROS and SO production is further stimulated by hypoxia. The increase in ROS and SO production is greater in the miRNA-high cell lines than the increase in MCF7 cells in hypoxia. TXNRD1 is an enzyme that regulates the production of ROS and SO and overexpression of this enzyme is an indicative marker for oxidative stress. We found that hypoxia enhanced
TXNRD1 expression in all breast cancer cell lines, but the most significant increase was found in MCF7-miR655 cells. The marginal increase in oxidative stress in MCF7 cells after CoCl
2 treatment could be a combined effect of hypoxia and miRNA-overexpression in this cell due to hypoxia. This suggests hypoxia and miR526b and miR655 collaborate to enhance oxidative stress in breast cancer.
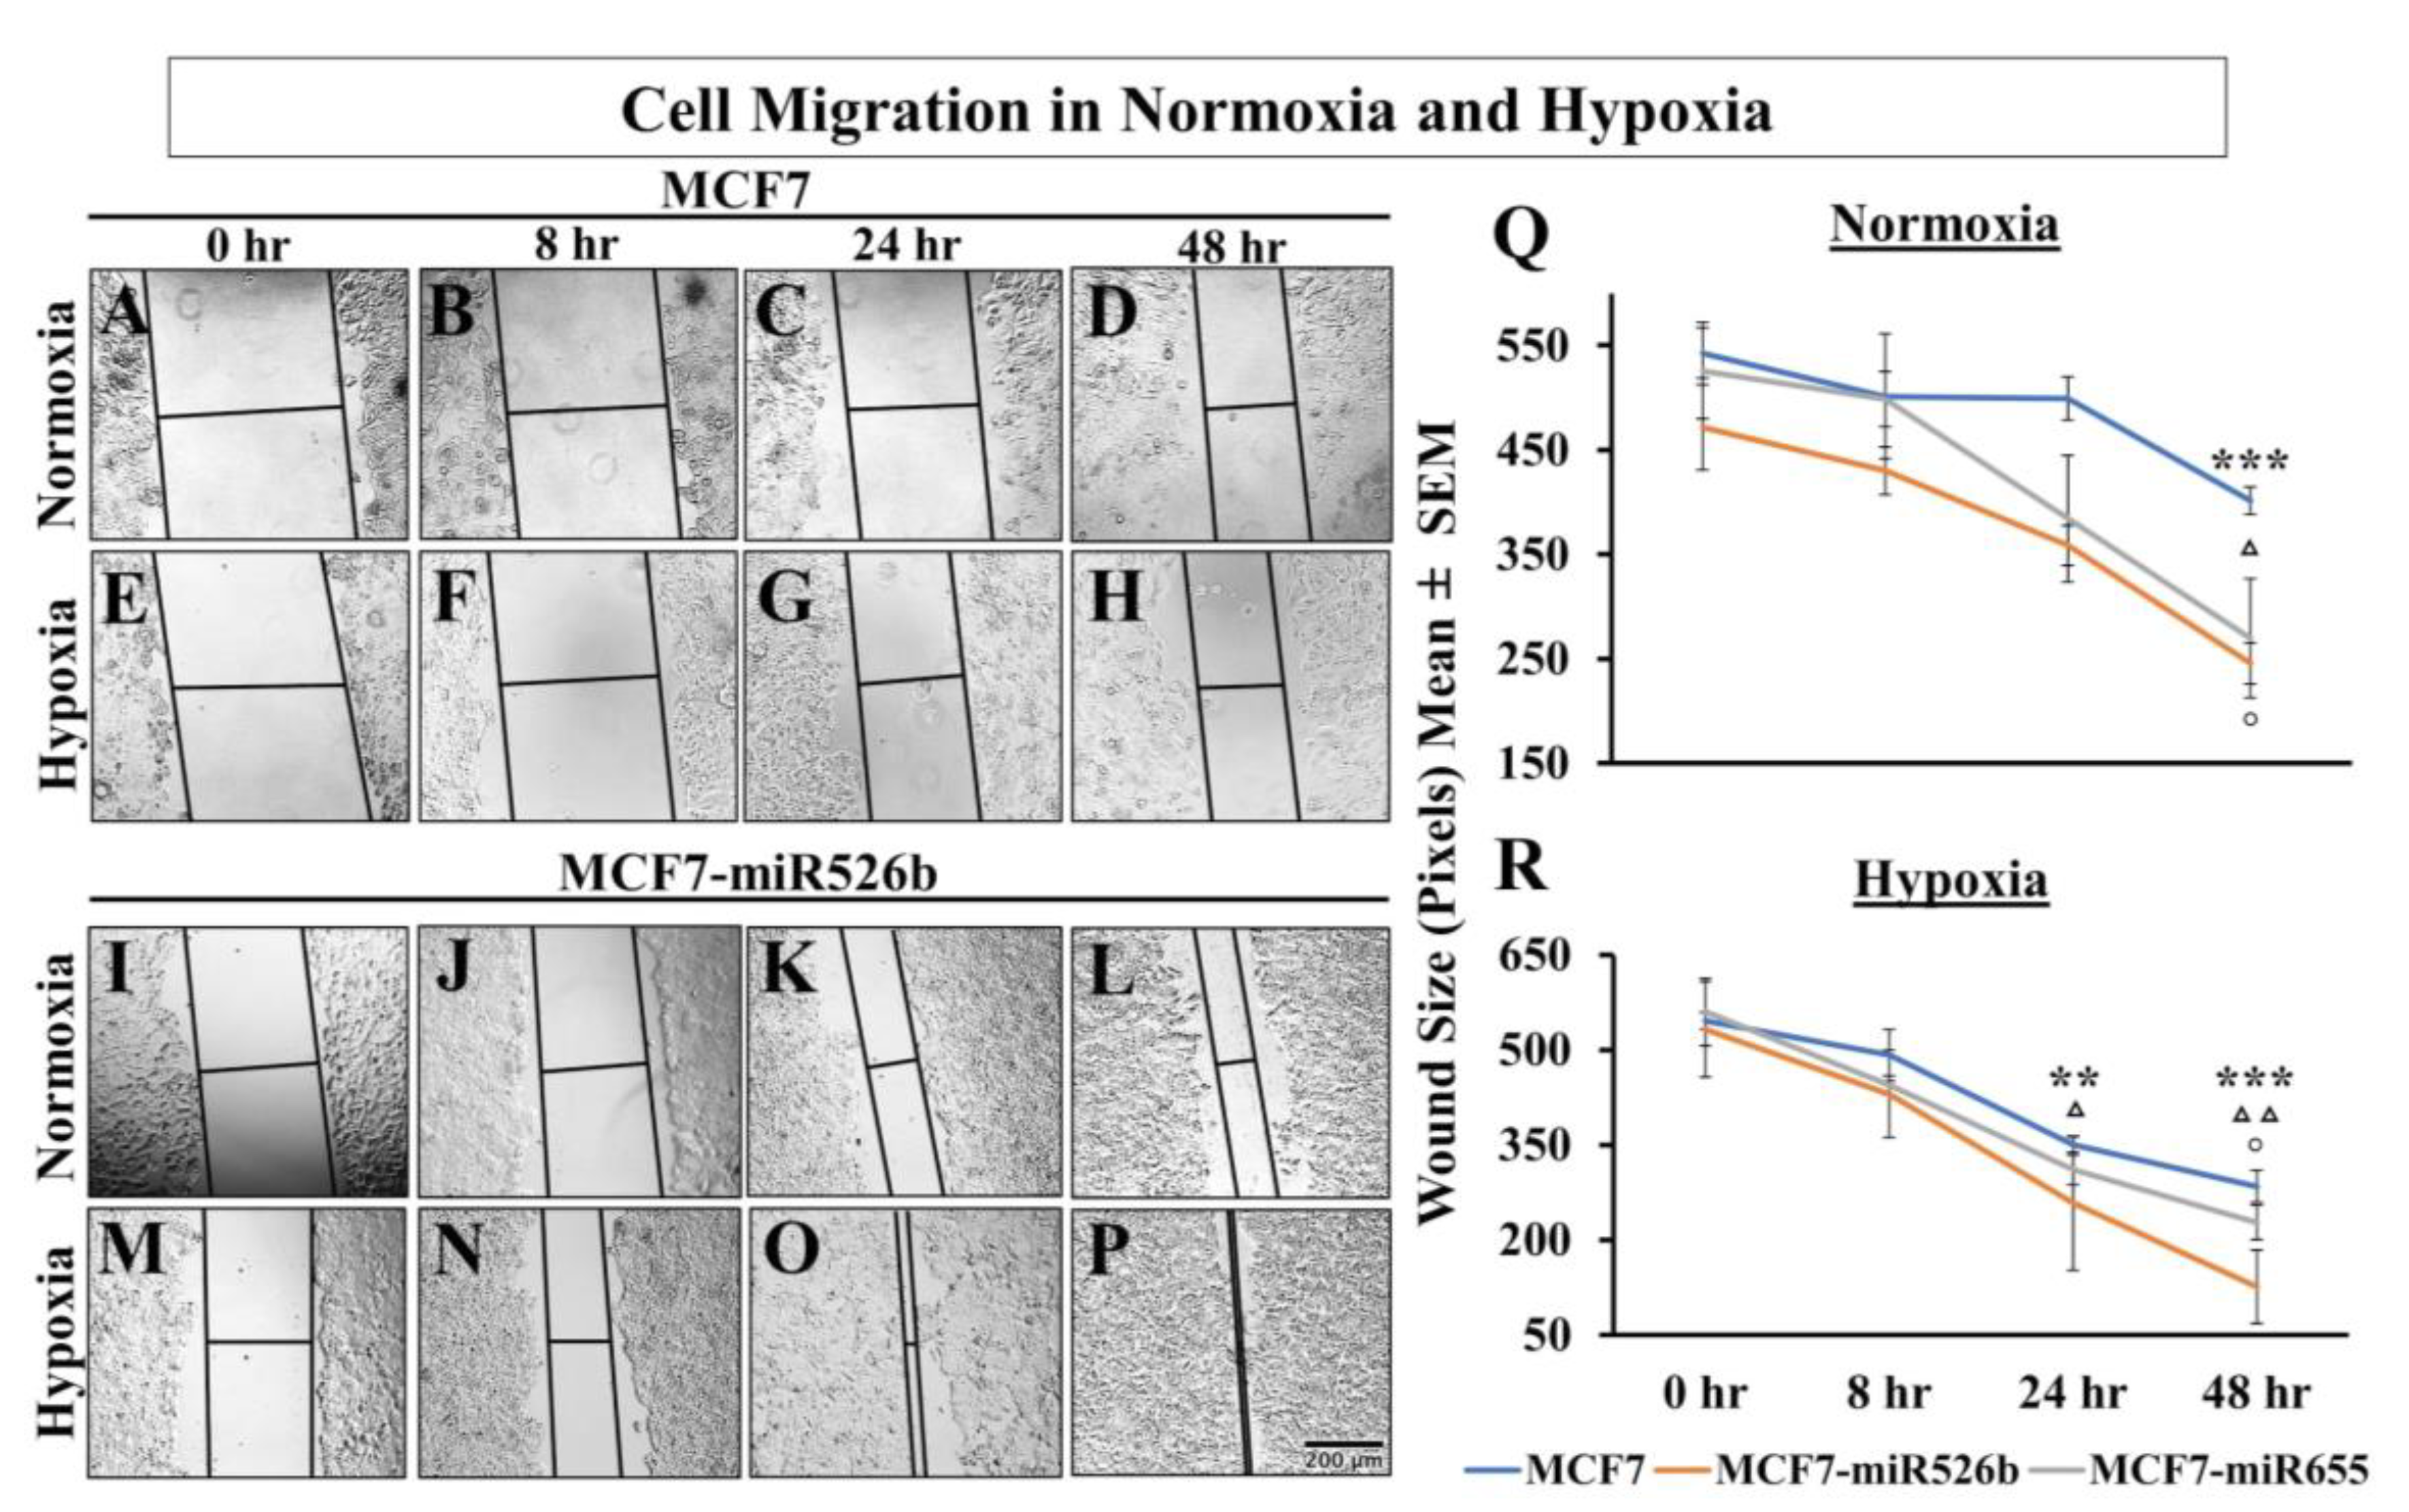
Hypoxia can completely reprogram tumor cells to induce EMT, and stimulate vasculogenesis to enhance cell migration [
48]. We have shown that miR526b and miR655 overexpression in breast cancer cells promotes EMT, cell migration, as well as
VEGFA upregulation [
3,
13,
14]. Here, we identified that MCF7-miR526b and MCF7-miR655 had higher levels of the mesenchymal markers (
VIM,
TWIST1,
SNAIL) and lower levels of the epithelial marker
CDH1 expression in hypoxia compared to normoxia. Mesenchymal cells are highly migratory, thus, a scratch-wound migration assay was performed and found that the scratch wound closes faster in miRNA-high cells in hypoxia compared to MCF7 cells in hypoxia. We also observed that miRNA-high cell lines show vascular mimicry and promote tube formation in hypoxia. All these phenotypes support that hypoxia enhances functions of miR526b and miR655 to promote breast cancer cell aggressiveness.
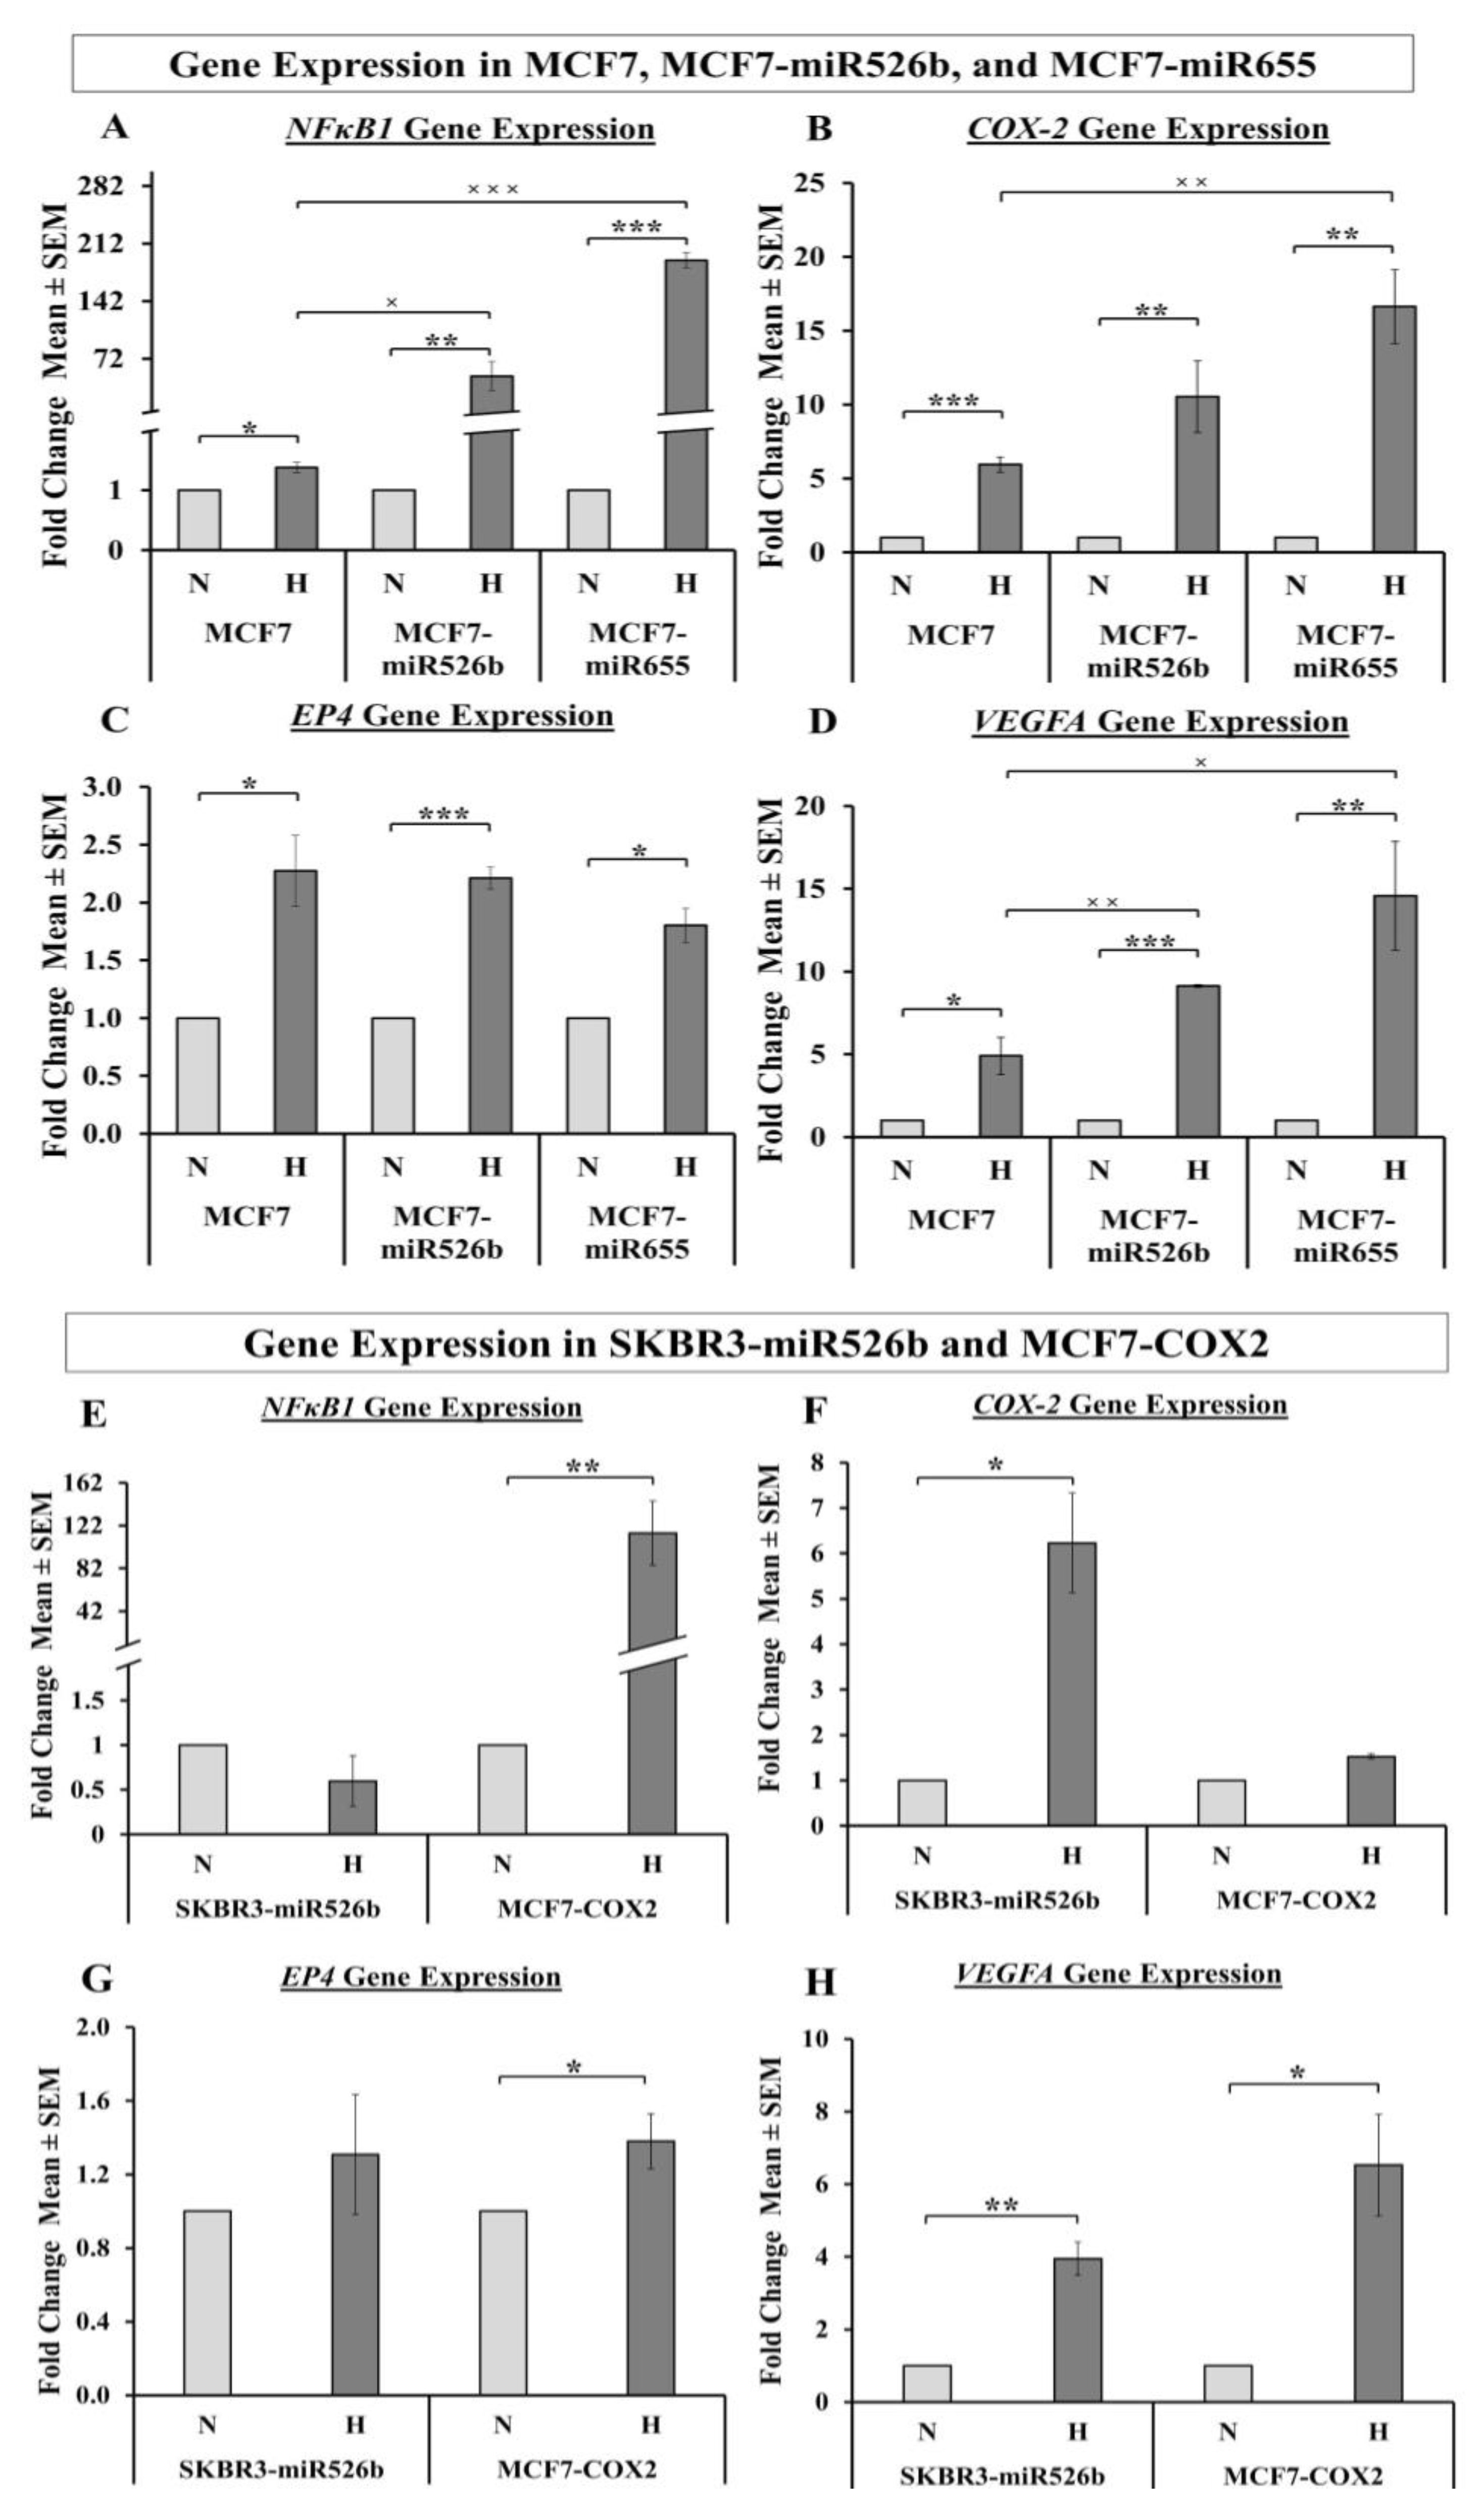
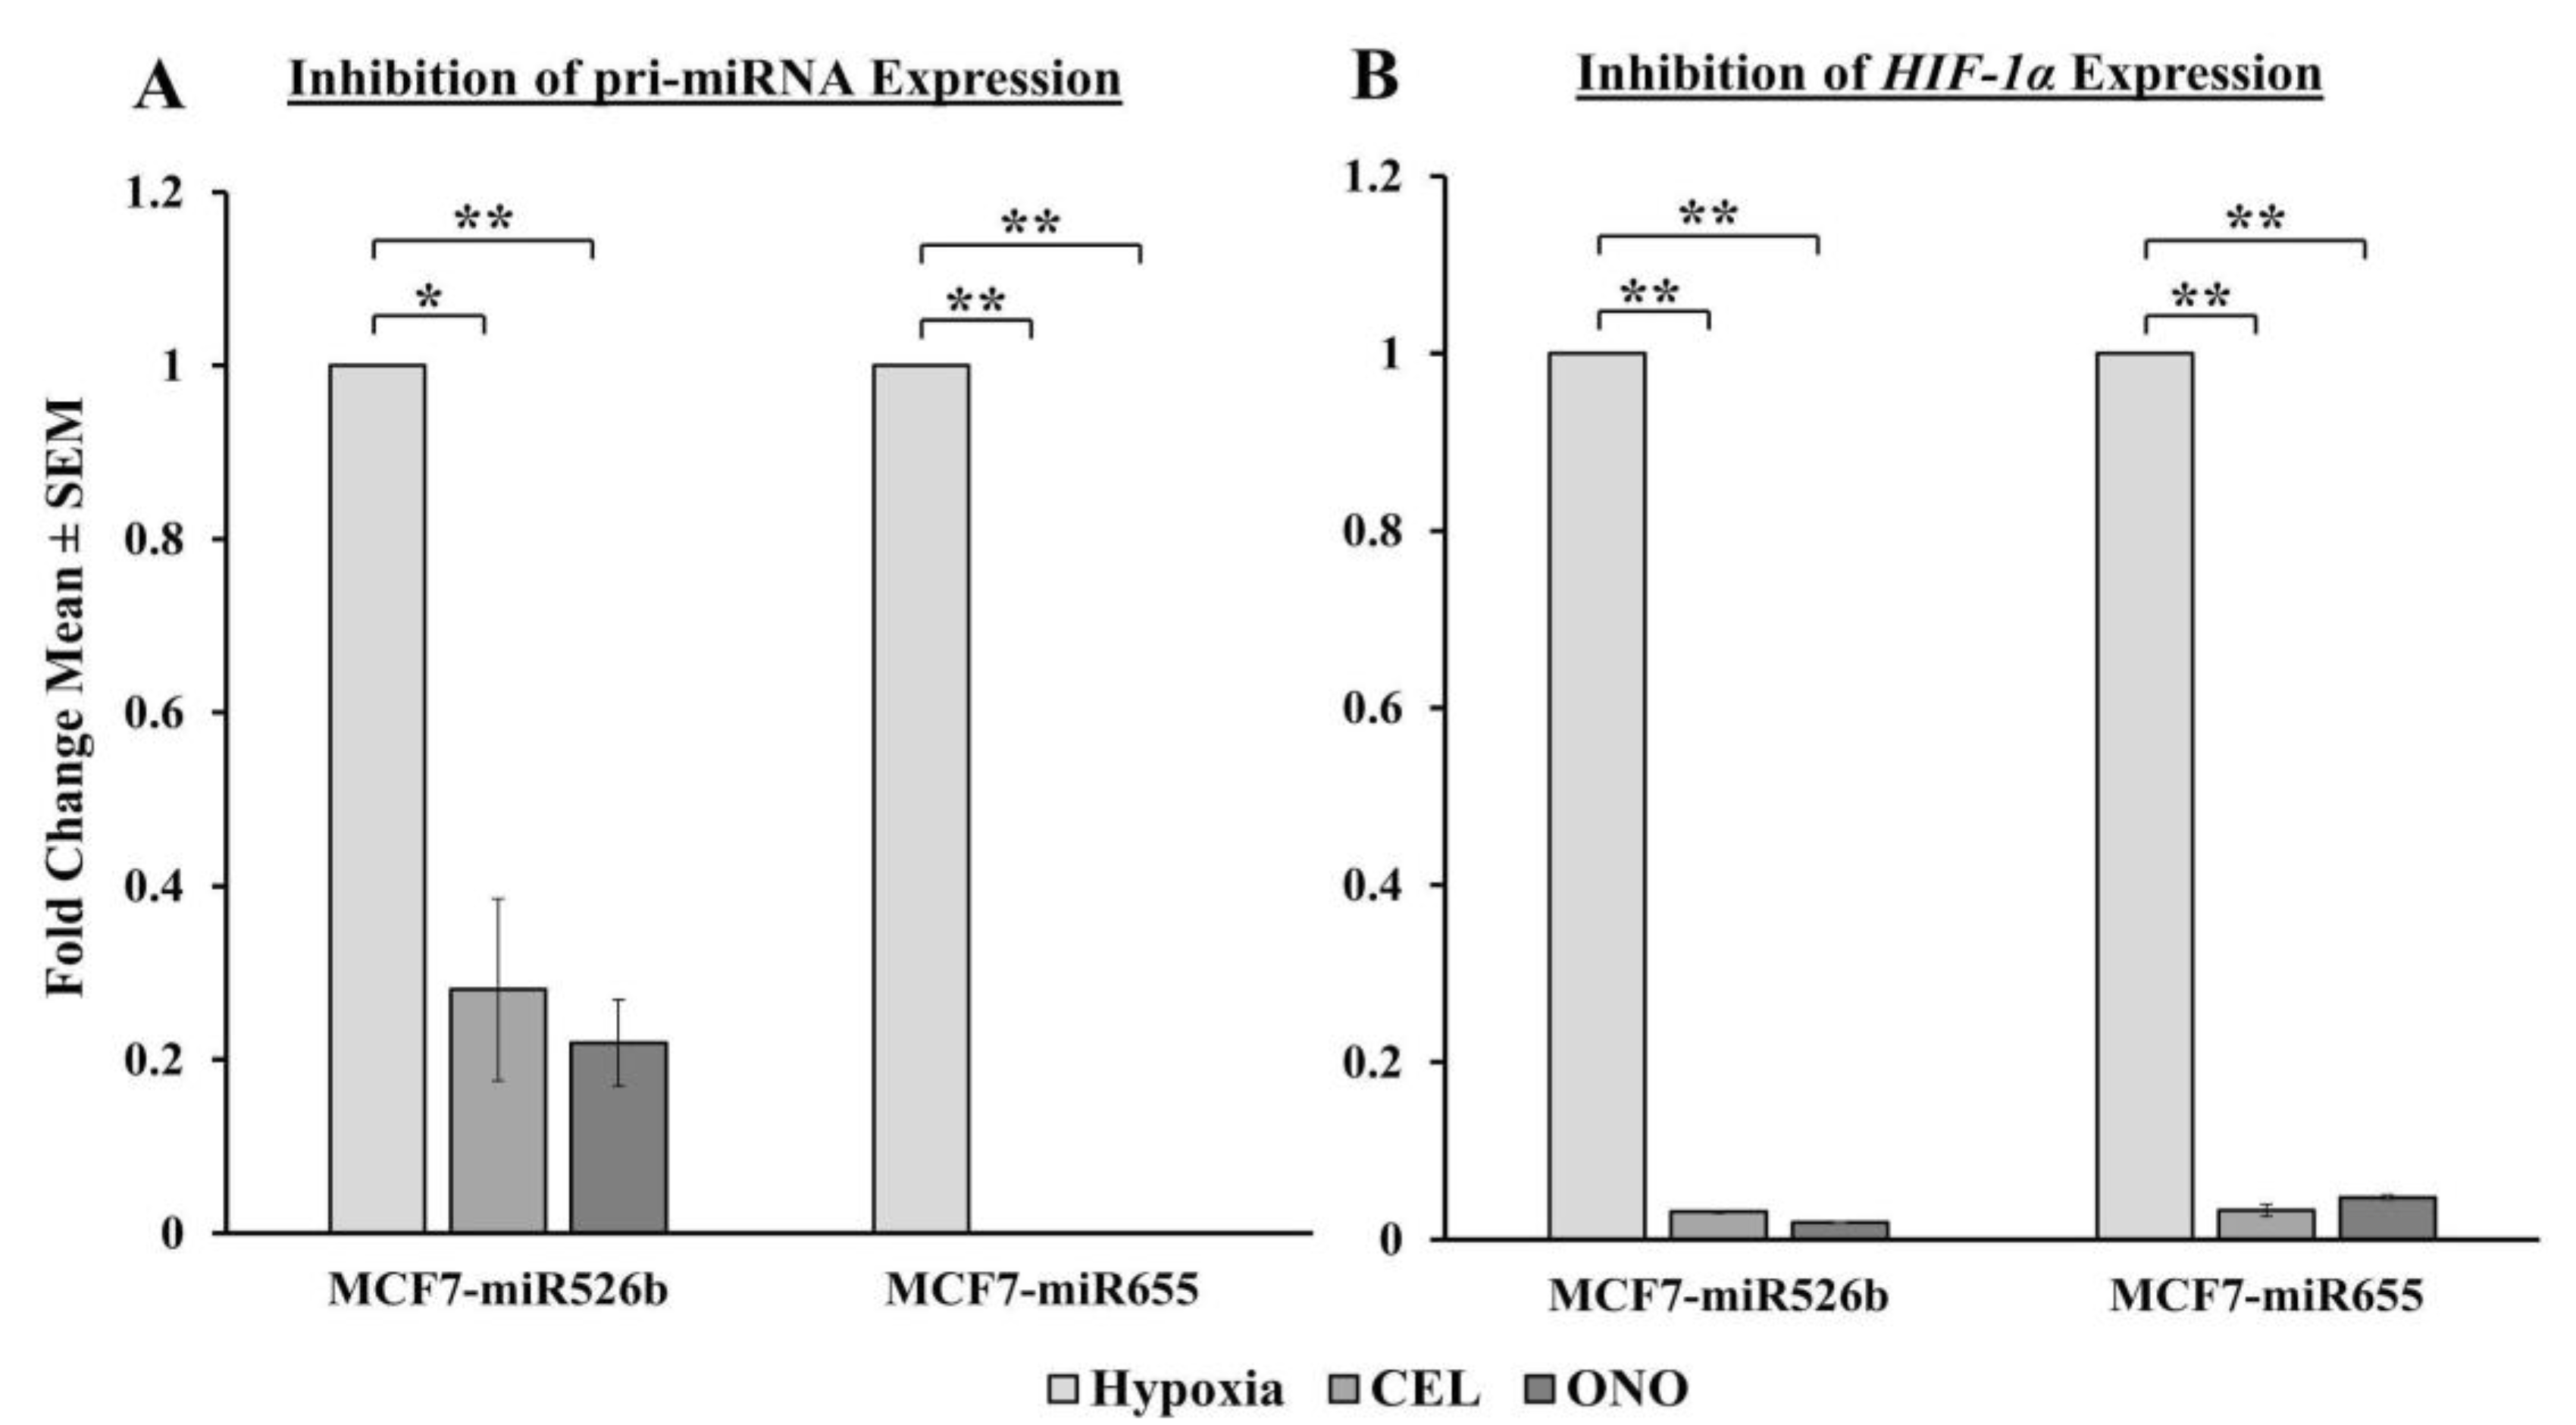
In the past research, we have identified that in ER-positive MCF7 breast cancer cells,
COX-2 overexpression significantly upregulates the expression of miR526b and miR655. miR526b and miR655 are known to upregulate
COX-2 and
EP4 expression, and we proposed that miRNA could regulate
COX-2/
EP4 expression through the NFκB pathway [
13,
14]. COX-2 activity produces PGE2, which in turn binds to the EP4 receptor. EP4 activation induces PI3K/Akt signaling, which regulates angiogenesis during embryogenesis and in breast cancer metastasis [
33,
35,
49,
50]. We have also shown that COX-2, EP4, and PI3K/Akt inhibition could abrogate miRNA-induced angiogenesis in vitro [
3]. A link between miRNA regulating HIF-1α expression via PI3K/Akt signaling was shown in other tumor models as well [
51]. In the current study, we show that hypoxic conditions enhance
COX-2/
EP4 and
NFκB1 expression in ER-positive breast cancer cells, and both COX-2 inhibitor Celecoxib (CEL) and EP4 antagonist ONO-AE3-208 (ONO) significantly abrogate miRNA expression. Therefore, we attempted to block the cancer-promoting phenotypes enhanced by hypoxic conditions in miRNA-high cells. Our findings show that MCF7-miR526b and MCF7-miR655 cell migration, oxidative stress, and vascular mimicry was inhibited by the application of a COX-2 inhibitor, EP4 antagonist, and an irreversible PI3K/Akt inhibitor Wortmannin (WM). The hypoxia-enhanced functions of miRNA-high cells were inhibited to a greater extent than that of miRNA-low MCF7 cells. These results strongly suggest that, in hypoxia, COX-2/EP/PI3k/Akt signaling pathways regulate miRNA functions. However, this does not show the effect of miRNA knockdown or inhibition of miRNA expression in aggressive cell lines. While we have shown in previous studies that the knockdown of miR526b and miR655 in aggressive breast cancer cell lines reduces aggressive breast cancer phenotypes [
13,
14], here we were unable to test the direct effects of miRNA knockdown in hypoxia. In the future, it would be interesting to investigate the effects of miR526b and miR655 knockdown on hypoxia in breast cancer.
We previously validated that both miR526b and miR655 target
CPEB2, which is a tumor suppressor gene and strongly correlated with p53 expression in breast cancer [
15]. We have previously shown that
PTEN expression is downregulated in miRNA-overexpressed MCF7 cell lines [
3].
PTEN is also a tumor suppressor that downregulates the expression of
HIF-1α and regulates the PI3K/Akt pathway. In the absence of
PTEN,
HIF-1α is able to act as a transcription factor for VEGFA, increasing angiogenesis, as well as activating other pathways that promote aggressive cancer phenotypes [
9].
NFκB1 is a transcription factor frequently activated in tumors that is involved in growth, progression, and resistance to chemotherapy. Various alarmin receptors are activated by
HIF-1α, which in turn strongly activates NFκB and pro-inflammatory pathways, furthering the progression of the malignant phenotype [
52]. Here we showed that in the hypoxic conditions,
NFκB1 is upregulated most significantly in miRNA-high MCF7 cells, suggesting that miRNA induces
NFκB1 expression in hypoxic conditions. To establish miRNA-signaling pathways, we examined miRNA target genes list.
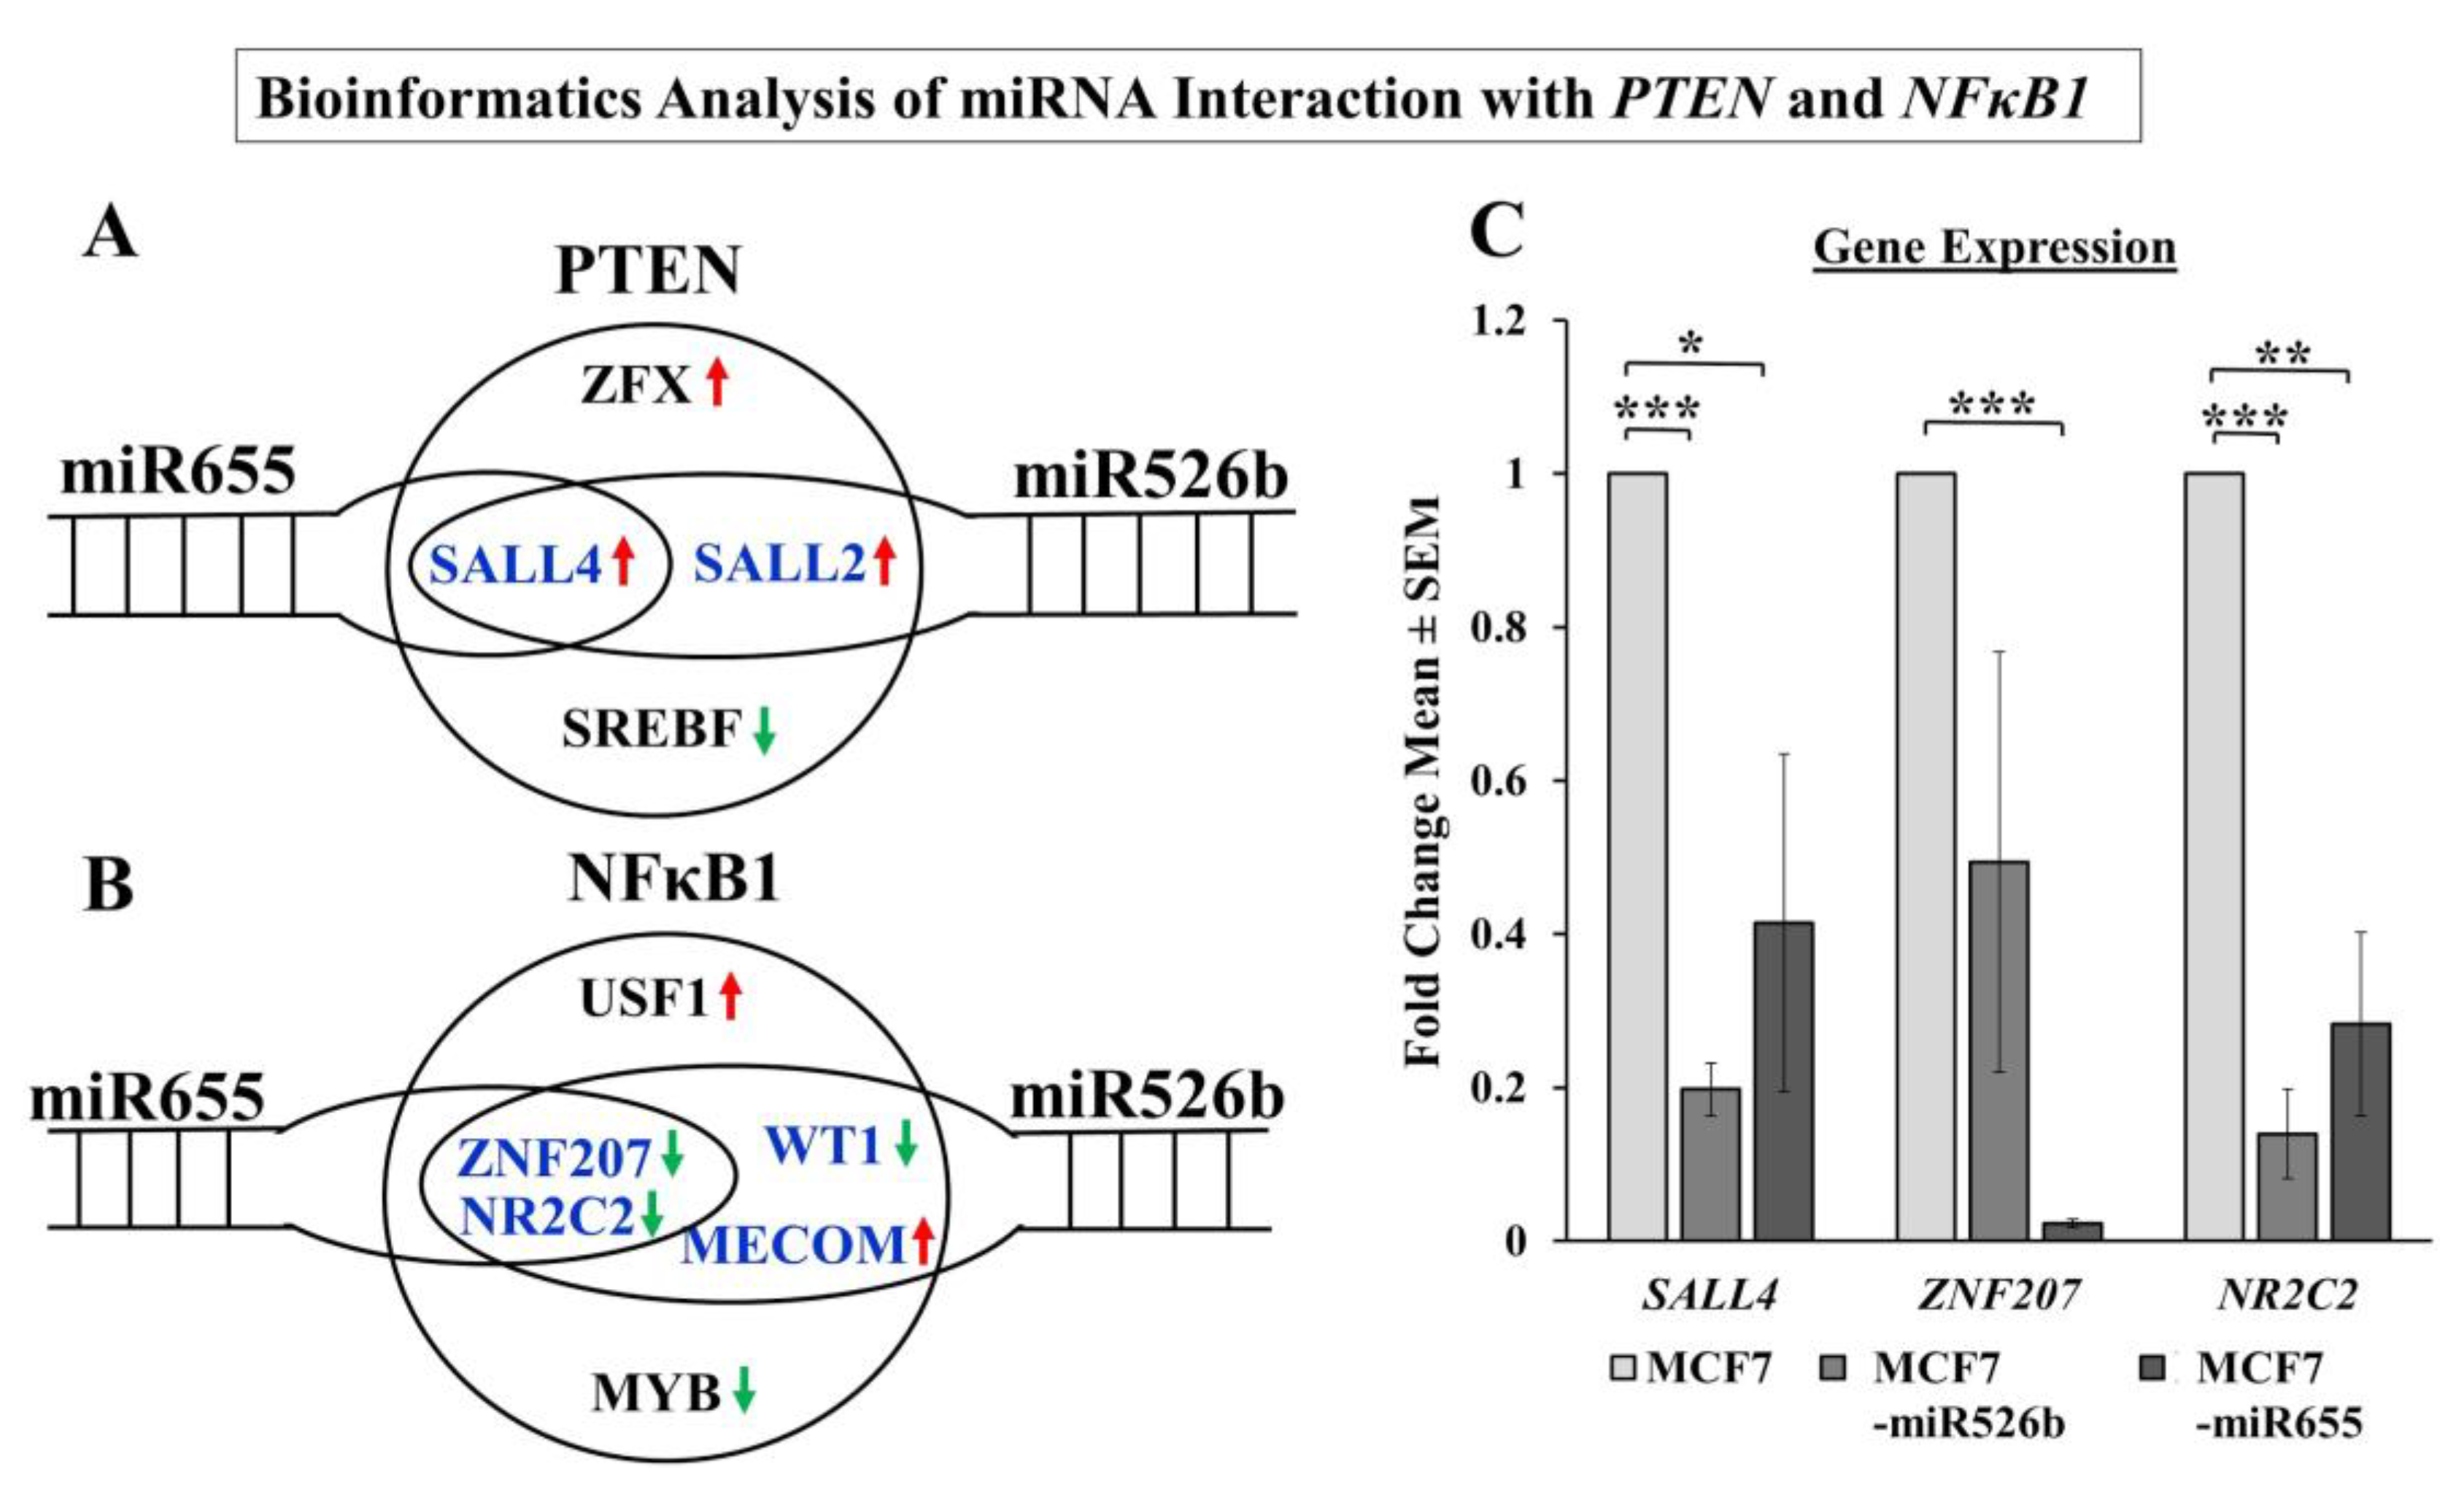
Additionally, a bioinformatics approach was taken to determine the direct connection between miR526b and miR655 with
NFκB1 and
PTEN. A number of transcription factors regulating
NFκB1 and
PTEN were identified as direct or indirect targets of miRNA.
SALL2 and
SALL4 are positive regulators of
PTEN and can regulate tumor metastasis [
53,
54]. In our analysis,
SALL4 expression was significantly downregulated in miRNA-high cell lines compared to MCF7. We identified
ZNF207 and
NR2C2 as transcription factors that are negative regulators of
NFκB1 are significantly downregulated in miRNA-high cells. It was shown that the ZNF207-HER2 fusion protein is oncogenic in gastric cancer [
55], and NR2C2 was shown to prevent MCF7 cell proliferation in an ER dependent manner [
56]. In our study in miRNA-high cells, both
ZNF207 and
NR2C2 are downregulated, and thus,
NFκB1 is upregulated. Although we were unable to conduct a true miRNA target validation using a luciferase reporter assay, our overall findings finally establish the link between miRNAs, NFκB1, COX-2, EP4, PI3K/Akt, PTEN, and HIF-1α signaling pathways.
To assess the translational impact of the discoveries, we tested the relation between miRNA and
HIF-1α expression using human breast cancer tissue and non-cancerous control tissues. We found that there is a significant increase in
HIF-1α gene expression in tumor tissues compared to the control tissues. In particular, ER-positive, PR-positive, and HER2-negative human breast tumor samples showed the highest expression of
HIF-1α. We also recorded that stage II and stage III tumors showed the highest expression of
HIF-1α, indicating hypoxia enhances miRNA-induced aggressive breast cancer phenotypes at progressive disease states. In this same set of tumors, we previously published that miR526b and miR655 expression was high in tumors and high expression of both miRNAs were associated with poor-patient survival [
13,
14]. In tumor tissues, we also recorded a strong correlation between miR526b and
HIF-1α and between miR655 and
HIF-1α, which suggests that
HIF-1α and miRNAs strongly interact to enhance breast cancer progression. These in situ data further confirmed the aggressive breast cancer phenotypes recorded in ER/PR-positive, HER2-negative, and miRNA-overexpressing MCF7-miR526b and MCF7-miR655 cell lines under hypoxia in the present article. To test the correlation between miRNA-cluster expressions with
HIF-1α expression within tumors in an independent data set, we also extracted data from cBioPortal, which includes data from 16 different breast cancer studies. These independent data sets results also showed a strong and positive correlation between miR526b and miR655 cluster with HIF-1α expression, further strengthening our findings. Here, we discovered a novel collaboration between hypoxia and miR526b/miR655 in breast cancer metastasis. It would be interesting to investigate in the future if these two miRNAs can serve as breast cancer biomarkers, specifically in ER-positive breast cancer, which is the most common type of breast cancer incidence in Canada.
4. Materials and Methods
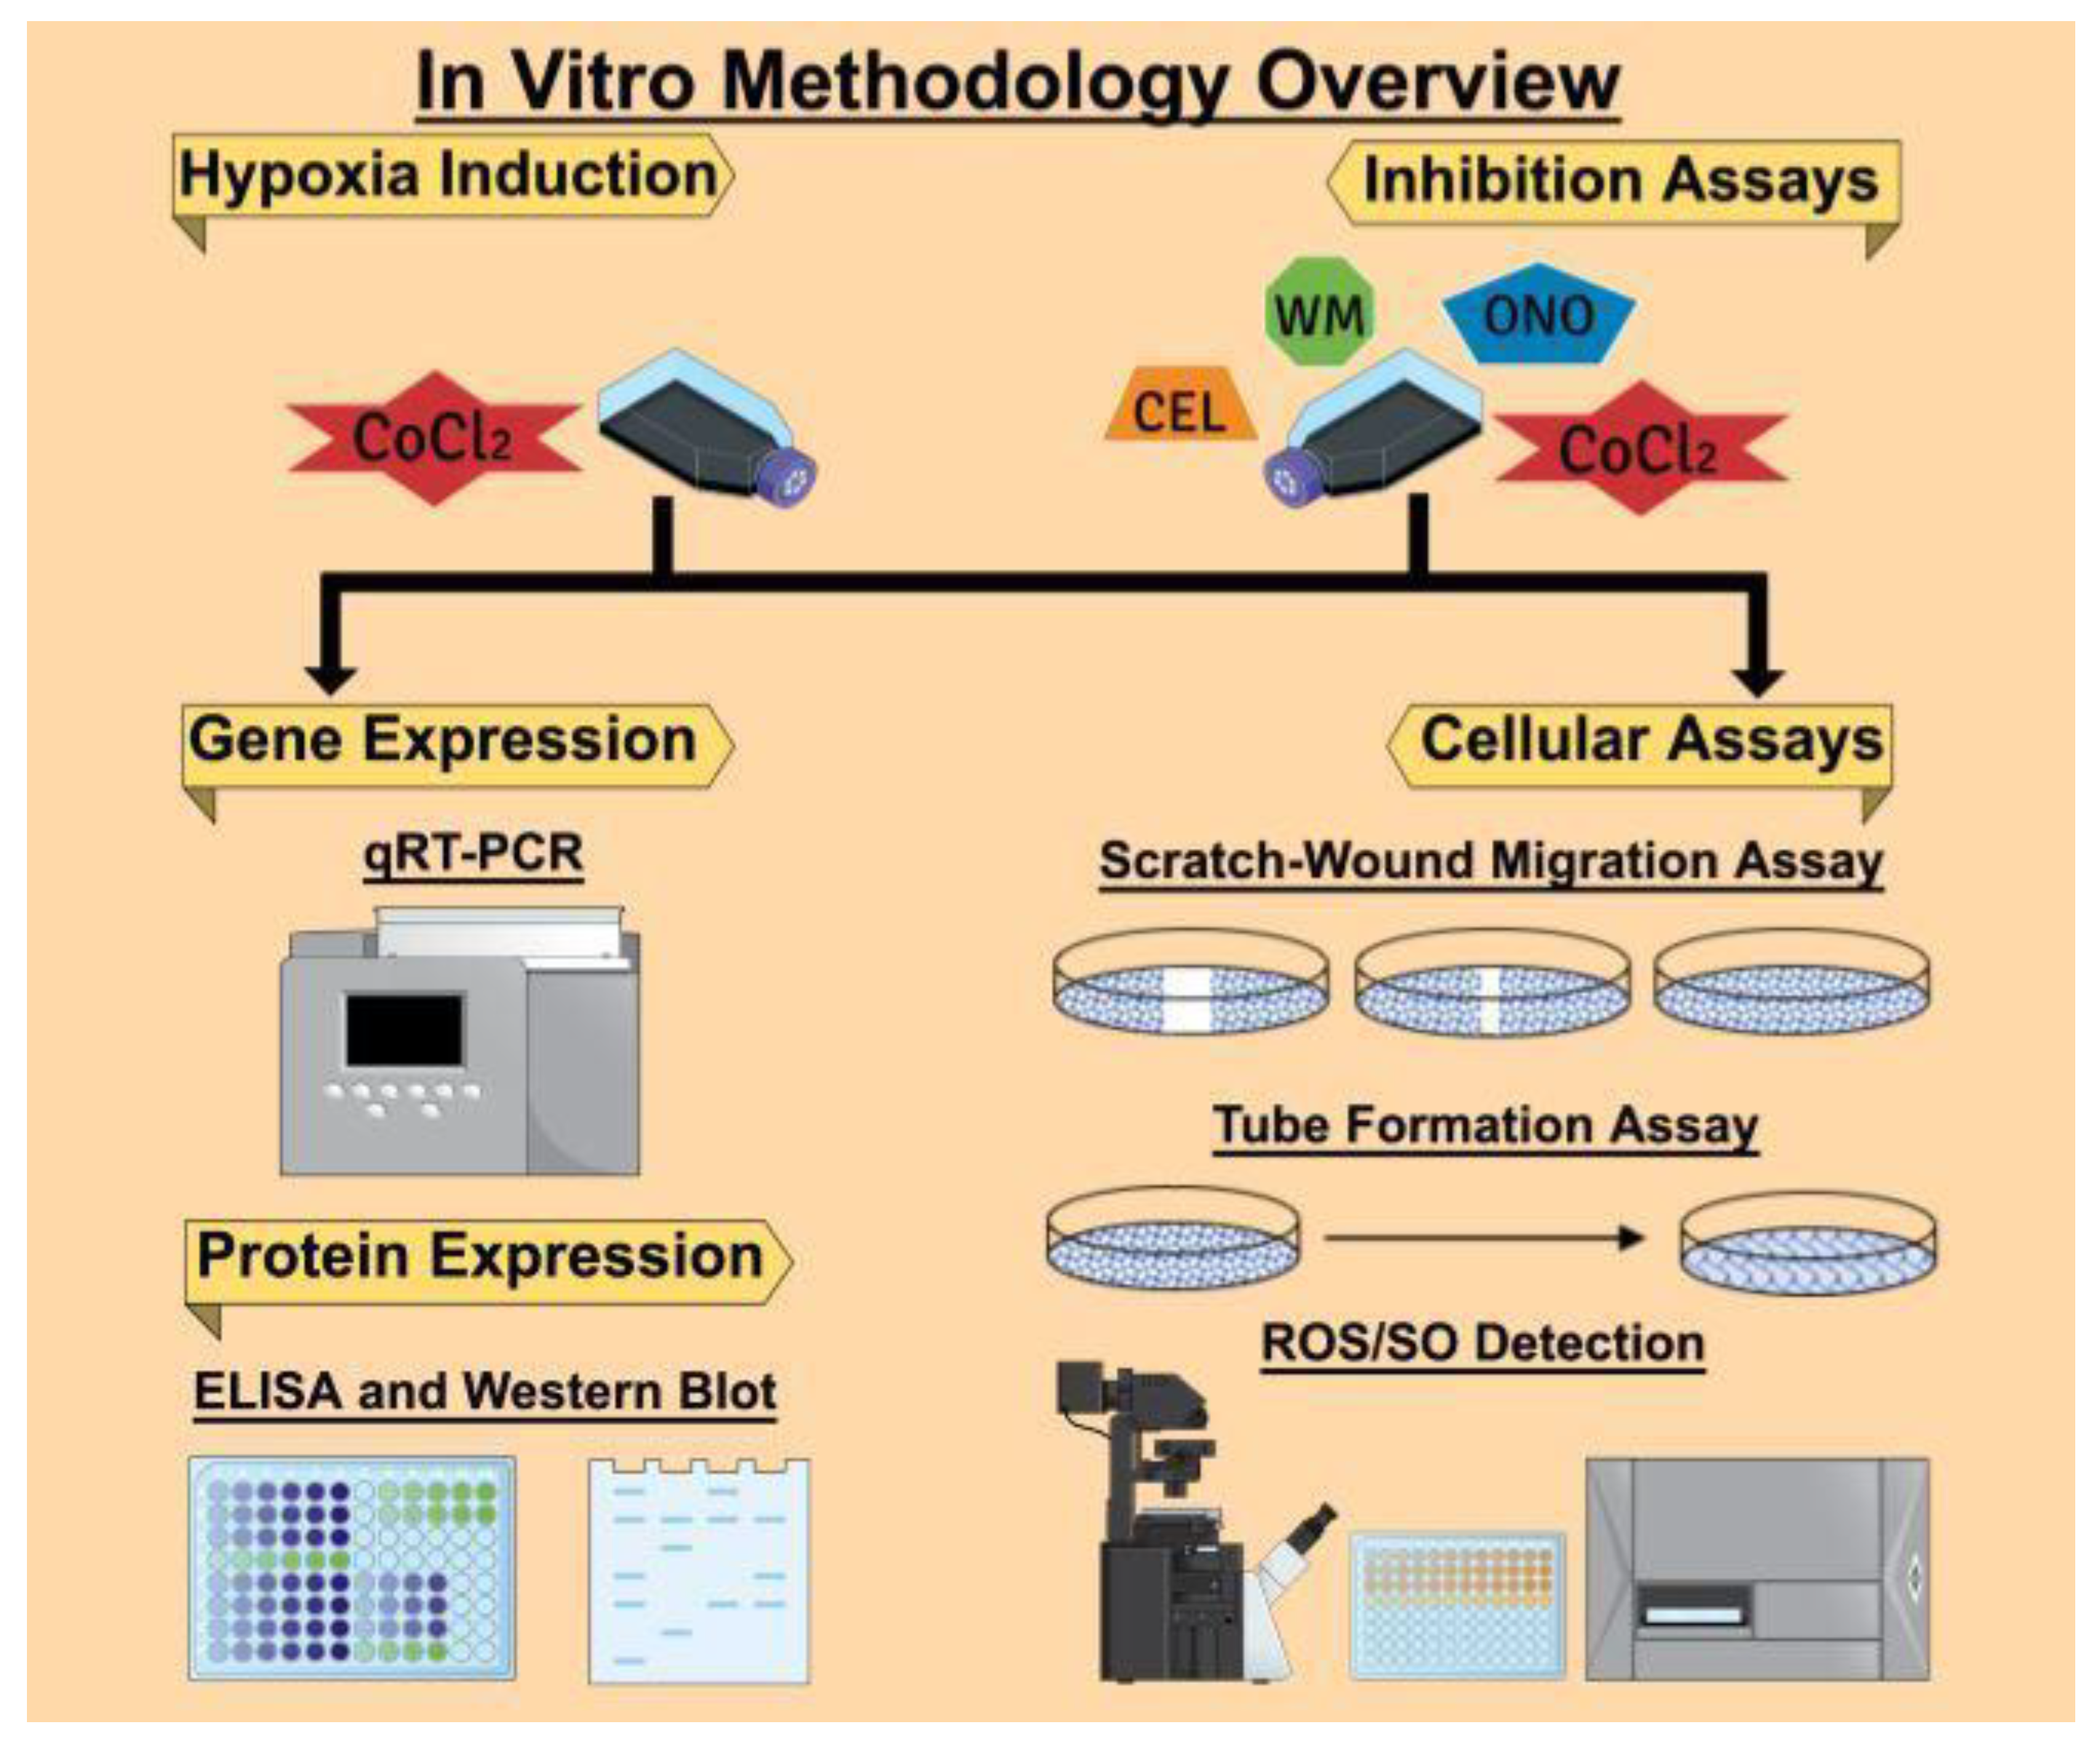
The overall in vitro methodologies followed in this article are presented in
Figure 13. We used the Mind the Graph Platform to create the graphical images.
4.1. Ethics Statements
The experiments were conducted at the Department of Biology in Brandon University, following the regulations of Brandon University Research Ethics (#21986, approved on 21 April 2017) and Biohazard Committee (#2017-BIO-02, approved on 13 September 2017).
4.2. Cell Culture
MCF7, T47D, SKBR3, Hs578T, and MDA-MB-231 breast cancer cell lines were purchased from the American Culture Type Collection (ATCC, Rockville, MD, USA). Stable miRNA-overexpression MCF7-miR526b, MCF7-miR655, and SKBR3-miR526b cell lines and COX-2-overexpressing MCF7-COX2 cell line were created by transfecting MCF7 and SKBR3 cells with respective miRNA or COX-2 overexpression plasmids. Transfected cell lines were sustained with Geneticin (Gibco, Mississauga, ON, Canada) following protocols as previously described [
13,
14,
32]. MCF7, MCF7-miR526b, MCF7-miR655, and SKBR3-miR526b cell lines were grown in Roswell Park Memorial Institute (RPMI) 1640 medium (Gibco, Mississauga, ON, Canada), supplemented with 10% fetal bovine serum (FBS) and 1% Penstrep. T47D, SKBR3, MCF7-COX2, Hs578T, and MDA-MB-231 cell lines were grown in Dulbecco’s Modified Eagle Medium (DMEM) (Gibco, Mississauga, ON, Canada) supplemented with 10% FBS and 1% Penstrep. All cell lines were maintained in a humidified incubator at 37 °C and 5% CO
2. MCF10A mammary epithelial cells were grown and maintained in Dr. Lala’s laboratory at the University of Western Ontario following ATCC protocol. An aliquot of cDNA samples was then transferred to Dr. Majumder laboratory at Brandon University.
4.3. Drugs and Chemicals
Celecoxib (COX-2 inhibitor, CEL) was purchased from Pfizer (Groton, CT, USA). ONO-AE3-208 (selective EP4 antagonist, EP4A, ONO) was a gift from ONO Pharmaceuticals (Osaka, Japan). Wortmannin (irreversible PI3K/Akt inhibitor, WM) was purchased from Sigma-Aldrich (Saint Louis, MO, USA). CoCl2 was purchased from Fisher Scientific (Mississauga, ON, Canada). For all treatments in vitro, hypoxia (CoCl2) served as the positive control and normoxia (sterile water, the solvent of CoCl2) served as the negative control.
4.4. Hypoxia Induction In Vitro with CoCl2 Treatment
Concentrations of CoCl
2 were chosen based on other publications tested with breast cancer cells [
29,
30]. Once 70% confluent, cells were serum starved for 12 h. and CoCl
2 was administered at a concentration of either 50 µM or 150 µM. 24 h after CoCl
2 treatment, cells were harvested for RNA extraction or used for cell functional assays as described below. We observed that 150 µM induced maximum HIF-1α expression (
Figure S1), thus, for all treatments in vitro, 150 µM of CoCl
2 treatment was considered as hypoxia, and sterile H
2O served as normoxia.
4.5. RNA Extraction, cDNA Synthesis, and Quantitative Real-Time PCR
Using the miRNeasy Mini Kit (Qiagen, Toronto, ON, Canada), total RNA extractions were done from non-treated T47D, SKBR3, MCF7-COX2, SKBR3-miR526b, Hs578T, MDA-MB-231, MCF7, MCF7-miR526b, and MCF7-miR655 cell lines, as well as CoCl2-treated MCF7, MCF7-miR526b, MCF7-miR655, SKBR3-miR526b, and MCF7-COX2 cell lines. The RNA was then reverse transcribed into cDNA using the High-Capacity cDNA Reverse Transcription Kit (Applied Biosystems, Waltham, MA, USA).
For quantitative Real-Time PCR (qRT-PCR), the TaqMan Gene and miRNA Expression Assays were used. Two genes,
Beta-actin (Hs01060665_g1) and
RPL5 (Hs03044958_g1) were used as endogenous control genes and RNU44 (assay ID #001094) was considered as an internal control miRNA. The expressions of pri-miR526b (Hs03296227_pri), pri-miR655 (Hs03304873_pri), hsa-miR-526b-5p (assay ID #002382), hsa-miR-655-3p (assay ID #001612),
HIF-1α (Hs00153153_m1),
VEGFA (Hs00900055_m1),
COX-2 (Hs00153133_m1),
EP4 (Hs00964382_g1),
VHL (Hs03046964_s1),
NFκB1 (Hs00231653_m1),
TWIST1 (Hs04989912_s1),
VIM (Hs00185584_m1),
SNAIL (Hs00195591_m1),
CDH1 (Hs00170423_m1),
TXNRD1 (Hs00917067_m1),
SALL4 (Hs01010838_g1),
ZNF207 (Hs01045973_m1), and
NR2C2 (Hs00991824_m1) were quantified using relative gene expression analysis. A relative fold change of gene expression was used using the comparative threshold cycle (∆Ct) followed by fold change using the 2
-∆∆Ct method [
3,
13,
14,
32].
4.6. Enzyme-Linked Immunosorbent Assay (ELISA) Analysis of HIF-1α
HIF-1α protein quantification was carried out using the ab171577-HIF1a Human SimpleStep ELISA Kit (Abcam, Toronto, ON, Canada). This assay is specific to the HIF-1α protein and does not cross-react with HIF-1α homologues, such as HIF-2α (EPAS-1). Three different passages of MCF7, MCF7-miR526b, MCF7-miR655, SKBR3-miR526b, and MCF7-COX2 cell lines were seeded into a six-well plate and grown to 80% confluence. Cells were treated with 150 µM CoCl2 for 24 h. Three experimental replicates were performed for each condition for each passage. The ELISA kit provided standards and was prepared following the manufacturer’s instructions. The cells were washed with PBS then solubilized with 1X Cell Extraction Buffer PTR. The cell lysate was then centrifuged, and the supernatant (total protein) was collected. In a 96-well plate, 50 μL of each of the sample protein and prepared standards were added to the wells. Additionally, 50 μL of the HIF-1α antibody cocktail was added, and the plate was incubated on a plate shaker. Next, the wells were washed with 1X Wash Buffer PT, and 100 µL of TMB Substrate was added to each well and incubated. Finally, 100 µL of Stop Solution was added to each well and mixed gently. Microplate readings were then recorded with OD at 450 nm to measure HIF-1α protein levels. Data was collected using the SoftMax Pro 6 Microplate Data Acquisition and Analysis software (Molecular Devices, San Jose, CA, USA). Calculations were performed following the manufacturer’s instructions. In all cases, negative control data were subtracted from experimental data for normalization. Provided samples were used to generate a standard curve for protein quantification.
4.7. Western Blot Analysis
Cells were treated with M-PER® Mammalian Protein Extraction Reagent (Thermo Scientific, Rockford, IL, USA), HALT Protease Inhibitor Cocktail (Thermo Scientific), and Phosphatase Inhibitor Cocktail (Thermo Scientific) to extract total protein. Approximately, 15–20 µg of total protein were electrophoresed per well on an 8–10% SDS-polyacrylamide gel and transferred onto Immobilon-FL PVDF membranes (Millipore, Billerica, MA, USA). Blots were incubated with the HIF-1α primary antibody (H1alpha 67): sc-53546 (Santa Cruz Biotechnology, CA, USA) at 1:500 dilution and monoclonal GAPDH antibody (MAB374, from Millipore, Billerica, MA, USA) at 1:10,000 dilutions overnight. After blocking with primary antibodies, membranes were washed and then probed with a mixture of IRDye polyclonal secondary antibodies (LI-COR Biosciences, Lincoln, NE, USA). Images were read with an Odyssey infrared imaging system (LI-COR Biosciences, Lincoln, NE, USA).
4.8. Fluorescence Microplate Assay
Three different passages of MCF7, MCF7-miR526b, and MCF7-miR655 cell lines were seeded in a 96-well plate. Once the cells were grown to 70% confluency, they were treated with either 50 µM or 150 µM of CoCl
2 for 24 h. ROS and SO levels were then detected using the ROS-ID Total ROS/SO detection kit (Enzo Life Sciences, Farmingdale, NY, USA), following the manufacturer’s protocol. First, the cells were washed with PBS to wash off cell culture media, and ROS/SO detection dyes were added to quantify ROS/SO production. One hour following the addition of detection dyes, microplate readings were done using the standard Fluorescein filter (Excitation/Emission: 485/535 nm) and Rhodamine filter (Excitation/Emission: 550/625 nm). Data was collected using the SoftMax Pro 6 Microplate Data Acquisition and Analysis software (Molecular Devices, San Jose, CA, USA). Concentrations of the ROS and SO produced by cells were determined based on the manufacturer’s instructions as we published earlier [
27]. ROS/SO production was quantitatively shown as a ratio of hypoxia emissions (emissions from hypoxic cells) to negative control emissions (emissions from normoxic cells). The same process was used for the fluorescence microplate assay with the use of inhibitors, except cells were treated with 150 µM of CoCl
2 and supplemented with either 20 µM Celecoxib, 50 µM ONO-AE3-208, or 10 µM Wortmannin for 24 h. To measure the effect of inhibitors, hypoxia treatment was considered as control.
4.9. Fluorescence Microscopy Assay
After total fluorescence emission measurement, we used the same ROS/SO detection kit to determine the total number of cells showing fluorescence and producing ROS and SO following the manufacturer’s protocol. MCF7, MCF7-miR526b, and MCF7-miR655 cell lines with or without CoCl
2 were seeded in 96 well plates and grown until 70% confluent, then the cells were washed with PBS, and next, ROS/SO detection dyes were added. After 15 min of incubation, images were captured with a Nikon Ds-Ri1 microscopy camera and data were analyzed using the NIS Elements Advanced Research software (Nikon, Melville, NY, USA). The fluorescent cells in each experiment were quantified using the ImageJ software (National Institute of Health, Bethesda, MD, USA) as previously described [
27]. For each condition, the negative control (normoxia) was used as a threshold for quantification of hypoxia effect. Total ROS/SO production was presented as quantification ratios, which were calculated by dividing all quantifications by negative control quantifications (i.e., the number of fluorescence-positive cells in the sample divided by the number of fluorescence-positive cells in the control), then dividing the resulting number by the total number of cells present in the well. The same process was used for the fluorescence microscopy assay with the use of inhibitors, except cells were treated with 150 µM of CoCl
2 and supplemented with either 20 µM Celecoxib, 50 µM ONO-AE3-208, or 10 µM Wortmannin. To measure the effect of inhibitors, hypoxia treatment was considered as control.
4.10. Scratch-Wound Migration Assay
Cells were grown in RPMI complete (serum-supplemented) media until 90% confluent, then harvested and resuspended in complete RPMI, after which 300 μL of suspended cells (approximately 20,000 cells/mL) was added to a six-well cell culture plate and maintained until 90% confluency. A sterile 2 μL pipette tip was used to scratch the surface of each well, after which the cells were washed with PBS to remove detached cells. The treatment conditions were then applied to the wells. For the hypoxia-mediated migration assay, sterile H
2O was used as the negative control (normoxia), and 150 μM of CoCl
2 treatment was considered as hypoxia. A total of 2 mL of the respective conditions (treatments in RPMI basal media) were added to each well. The migratory progress and wound size were captured using a Nikon Ds-Ri1 microscope camera at 0, 16, 24, and 48 h time points. To ensure that we were taking pictures of the same wound-healing site over time, each well was separated into four quadrants manually with a marker pen, and a wound/scratch was made once per coordinate. Additionally, the microscope’s coordinate system was used for double validation to ensure photos were taken in the same field of view. We have captured five pictures per quadrant to ensure that the entire wound was captured. Thus, per well, we took at least 20 pictures. NIH ImageJ software was used to measure the width of the scratch wound in pixels and mean data of 20 pictures were considered as data for a single experimental replicate. We used three experimental wells or replicates and three biological replicates per condition [
3]. The same process was used for the migration assay with the use of inhibitors, to determine the roles of COX-2, EP4 receptor, and the PI3K/Akt signaling pathways, except the cells were seeded in 24-well plates and treated with 150 μM CoCl
2 for 24 h, then supplemented with either 20 µM Celecoxib, 50 µM ONO-AE3-208, or 10 µM Wortmannin for another 24 h. All quantifications were done after 24 h of inhibitor treatment (which is equivalent to 48 h of CoCl
2 treatment), as we found an increase in cell death and difficulty in quantification after 24 h.
4.11. Tube Formation Assay
Tube formation assays were carried out as previously described in a 24-well plate [
3]. Diluted Matrigel media was prepared as a 1:1 ratio of growth factor reduced Matrigel (BD Biosciences, Bedford, Massachusetts, USA) and basal RPMI media. 200 µL of diluted Matrigel was added to each well in a 24-well plate and incubated for 1 h at 37 °C to allow the Matrigel to crosslink and form the extracellular matrix. Next, 200 µL cells were then seeded into the Matrigel coated plate with a density of approximately 20,000 cells per well. MCF7, MCF7-miR655 and MCF7-miR526b cell lines were resuspended in either RPMI complete media; CoCl
2 (150 µM)-RPMI media; or CoCl
2-RPMI media along with either 20 µM Celecoxib (COX-2 inhibitor) or 50 µM ONO-AE3-208 (EP4 antagonist), or 10 µM Wortmannin (Irreversible PI3K/Akt pathway inhibitor) as inhibitory conditions. Each condition was tested twice (experimental replicates) and repeated three times (biological replicates). Tube formation was measured at 24 and 48 h, and images were obtained using a Nikon inverted microscope. Quantification of tubes and branching points was carried out using NIH ImageJ software (NIH, Bethesda, MD, USA).
4.12. Bioinformatics Analysis
miRbase [
36] and Enrichr [
57] were two online databases used for conducting bioinformatics analysis in this study. miRbase is a miRNA database, which provides predicted miRNA target genes along with miRNA cluster information. The complete target gene list for miR526b and miR655 was downloaded using TargerScanVert release 7.1 [
58] in miRbase for five prime mature sequences hsa-mir-526b and hsa-mir-655. The Enrichr database uses enrichment analysis to identify transcription factors regulating genes. All transcription factors associated with
PTEN and
NFκB1 were downloaded. The two lists generated from miRbase and the Enrichr database were then cross-examined to determine shared target genes and transcription factors.
4.13. Human Breast Cancer Tissue Samples
Frozen human breast tissue samples were obtained from the Ontario Tumour Bank after ethical approval by Ontario Cancer Research Ethics Board (Tec # 010-11), then following approval by the Ethics Review Board of the Tumor bank and collected at the University of Western Ontario at Dr. Lala’s laboratory. Qiagen miRNeasy mini kit was used to extract mRNA or miRNA from tissue samples, followed by cDNA synthesis using cDNA Reverse Transcription Kit (Applied Biosystems, USA). An aliquot of all the cDNA samples were transferred to Dr. Majumder’s laboratory at Brandon University following the Material Transfer Agreement (MTA) between Brandon University and the University of Western Ontario. All further experiments were conducted at the Department of Biology at Brandon University following Brandon University Ethics and Biohazard protocols.
4.14. In Silico Analysis of cBioPortal Data via TCGA
miR526b and miR655 cluster information was extracted from the miRbase miRNA database [
36]. We identified that there are 20 miRNAs within each miRNA cluster for miR526b and miR655. Next, we used the cBioPortal database within TCGA, which includes data from 16 breast cancer studies to extract miR526b and miR655 cluster miRNA expression, along with
HIF-1α mRNA expression, which were both presented as z-scores [
37,
38]. For the miR526b miRNA cluster, the cBioPortal database contained miRNA expression data for miR516a-1 and miR516a-2. As for miR655s miRNA cluster, nine miRNA had expression in the cBioPortal database (miR154, miR369, miR381, miR382, miR409, miR410, miR487b, miR539, and miR889). The mean of available miRNAs z-score within each cluster was considered and compared to the
HIF-1α z-score to determine a correlation between miR526b and miR655 miRNA clusters and
HIF-1α.
4.15. Statistical Analysis
Statistical calculations were performed using GraphPad Prism (GraphPad Software, Version 8.4.3., San Diego, CA, USA). All parametric data were analyzed with one-way analysis of variance (ANOVA) by Tukey–Kramer or Dunnett post-hoc comparisons. The student’s t-test was used when comparing the means of two datasets, and Pearson’s correlation coefficient was employed to assess statistical correlations. Statistically relevant differences between means were accepted at p < 0.05.

 ,
, 


