1. Introduction
18F- Fluorodeoxyglucose (FDG) PET/CTs provide information based on the increased glycolysis of cancer cells, and are successfully used for the diagnosis, staging, treatment response monitoring, and prognostication of cancers. In cerebral gliomas, higher
18F-FDG uptake correlates with higher pathological grades and patient prognosis [
1]. Although
18F-FDG PET/CT is accessible and validated for functional tumor imaging, it has limitations for cerebral gliomas. Most significantly, there is a high rate of physiologic glucose uptake in the cerebral cortex, which can be as high as high-grade tumors or higher than low-grade gliomas [
2,
3]. Therefore, accurate characterization of the tumor and delineation of the tumor boundary is challenging with
18F-FDG PET/CT.
Radiolabeled amino acid tracers, which are associated with increased cellular proliferation and protein synthesis are considered superior alternatives to
18F-FDG for cerebral gliomas. They are excellent for tumor detection and delineation due to their low background uptake in the normal cortex and high radiolabeled amino acid uptake in tumors, including low-grade gliomas [
4]. However, the predictive values for grading are less clear because of the significant overlap in amino acid metabolism between grades [
5]. In particular, the ability to discriminate oligodendrogliomas (ODs) from high-grade astrocytic gliomas is challenging with radiolabeled amino acid tracers. Magnetic resonance imaging (MRI) has been widely used as a diagnostic modality for gliomas. However, enhanced MRI has limitations in that it cannot accurately provide the stage of the glioma or discriminate clearly between the tumor and the surrounding edema [
6,
7]. Recently, advanced MRI techniques, have been used to provide functional, physiological and molecular information on glioma, including perfusion MRI using relative cerebral blood volume (rCBV) and magnetic resonance spectroscopy (MRS) using the concentration of water-soluble metabolites. However, MRS is not able to provide a clear image due to the presence of susceptibility artefacts and it has methodological limitations due to the lack of standardization for image acquisition and processing [
8].
The results of different studies vary with regard to the correlation between the blood glucose level and
18F-FDG uptake in different organs and tumors. However, all studies agree that there is a significant inverse relationship between blood glucose level and
18F-FDG uptake in the normal cerebral cortex [
9,
10,
11,
12]. A blood glucose level above 110 mg/dL decreases
18F-FDG uptake in the cerebral cortex [
12]. The guidelines for tumor imaging recommend at least 4 h of fasting before
18F-FDG PET/CT to avoid reducing the tumor detection sensitivity [
13,
14]. However, for cerebral gliomas, an increased blood glucose level might be beneficial because it decreases the background
18F-FDG uptake in the cerebral cortex, and thus ensures high tumor-to-normal cortex contrast. In this study, the effect of various blood glucose levels on
18F-FDG uptake in the normal cerebral cortex and cerebral gliomas, and the blood glucose level required to obtain the best TNR were investigated in mouse tumor models, glioblastoma (GBM) cell lines, and patients with cerebral gliomas.
3. Discussion
A high blood glucose level decreases radioactive glucose uptake in tumors. Therefore, at least 4 h of fasting is recommended so as not to decrease detection sensitivity before an
18F-FDG PET/CT in patients with cerebral gliomas [
13,
14]. However, fasting increases background
18F-FDG uptake in the normal cortex. On the other hand, high blood glucose levels decrease
18F-FDG uptake in the normal cortex, with the risk of decreasing
18F-FDG uptake in the tumors. In this prospective study, we found that glucose loading led to a greater reduction in
18F-FDG uptake in the normal cortex than in tumors, especially in high-grade gliomas. Thus, the TNR increased after glucose loading, which increased the usefulness of
18F-FDG PET/CT for grading cerebral gliomas.
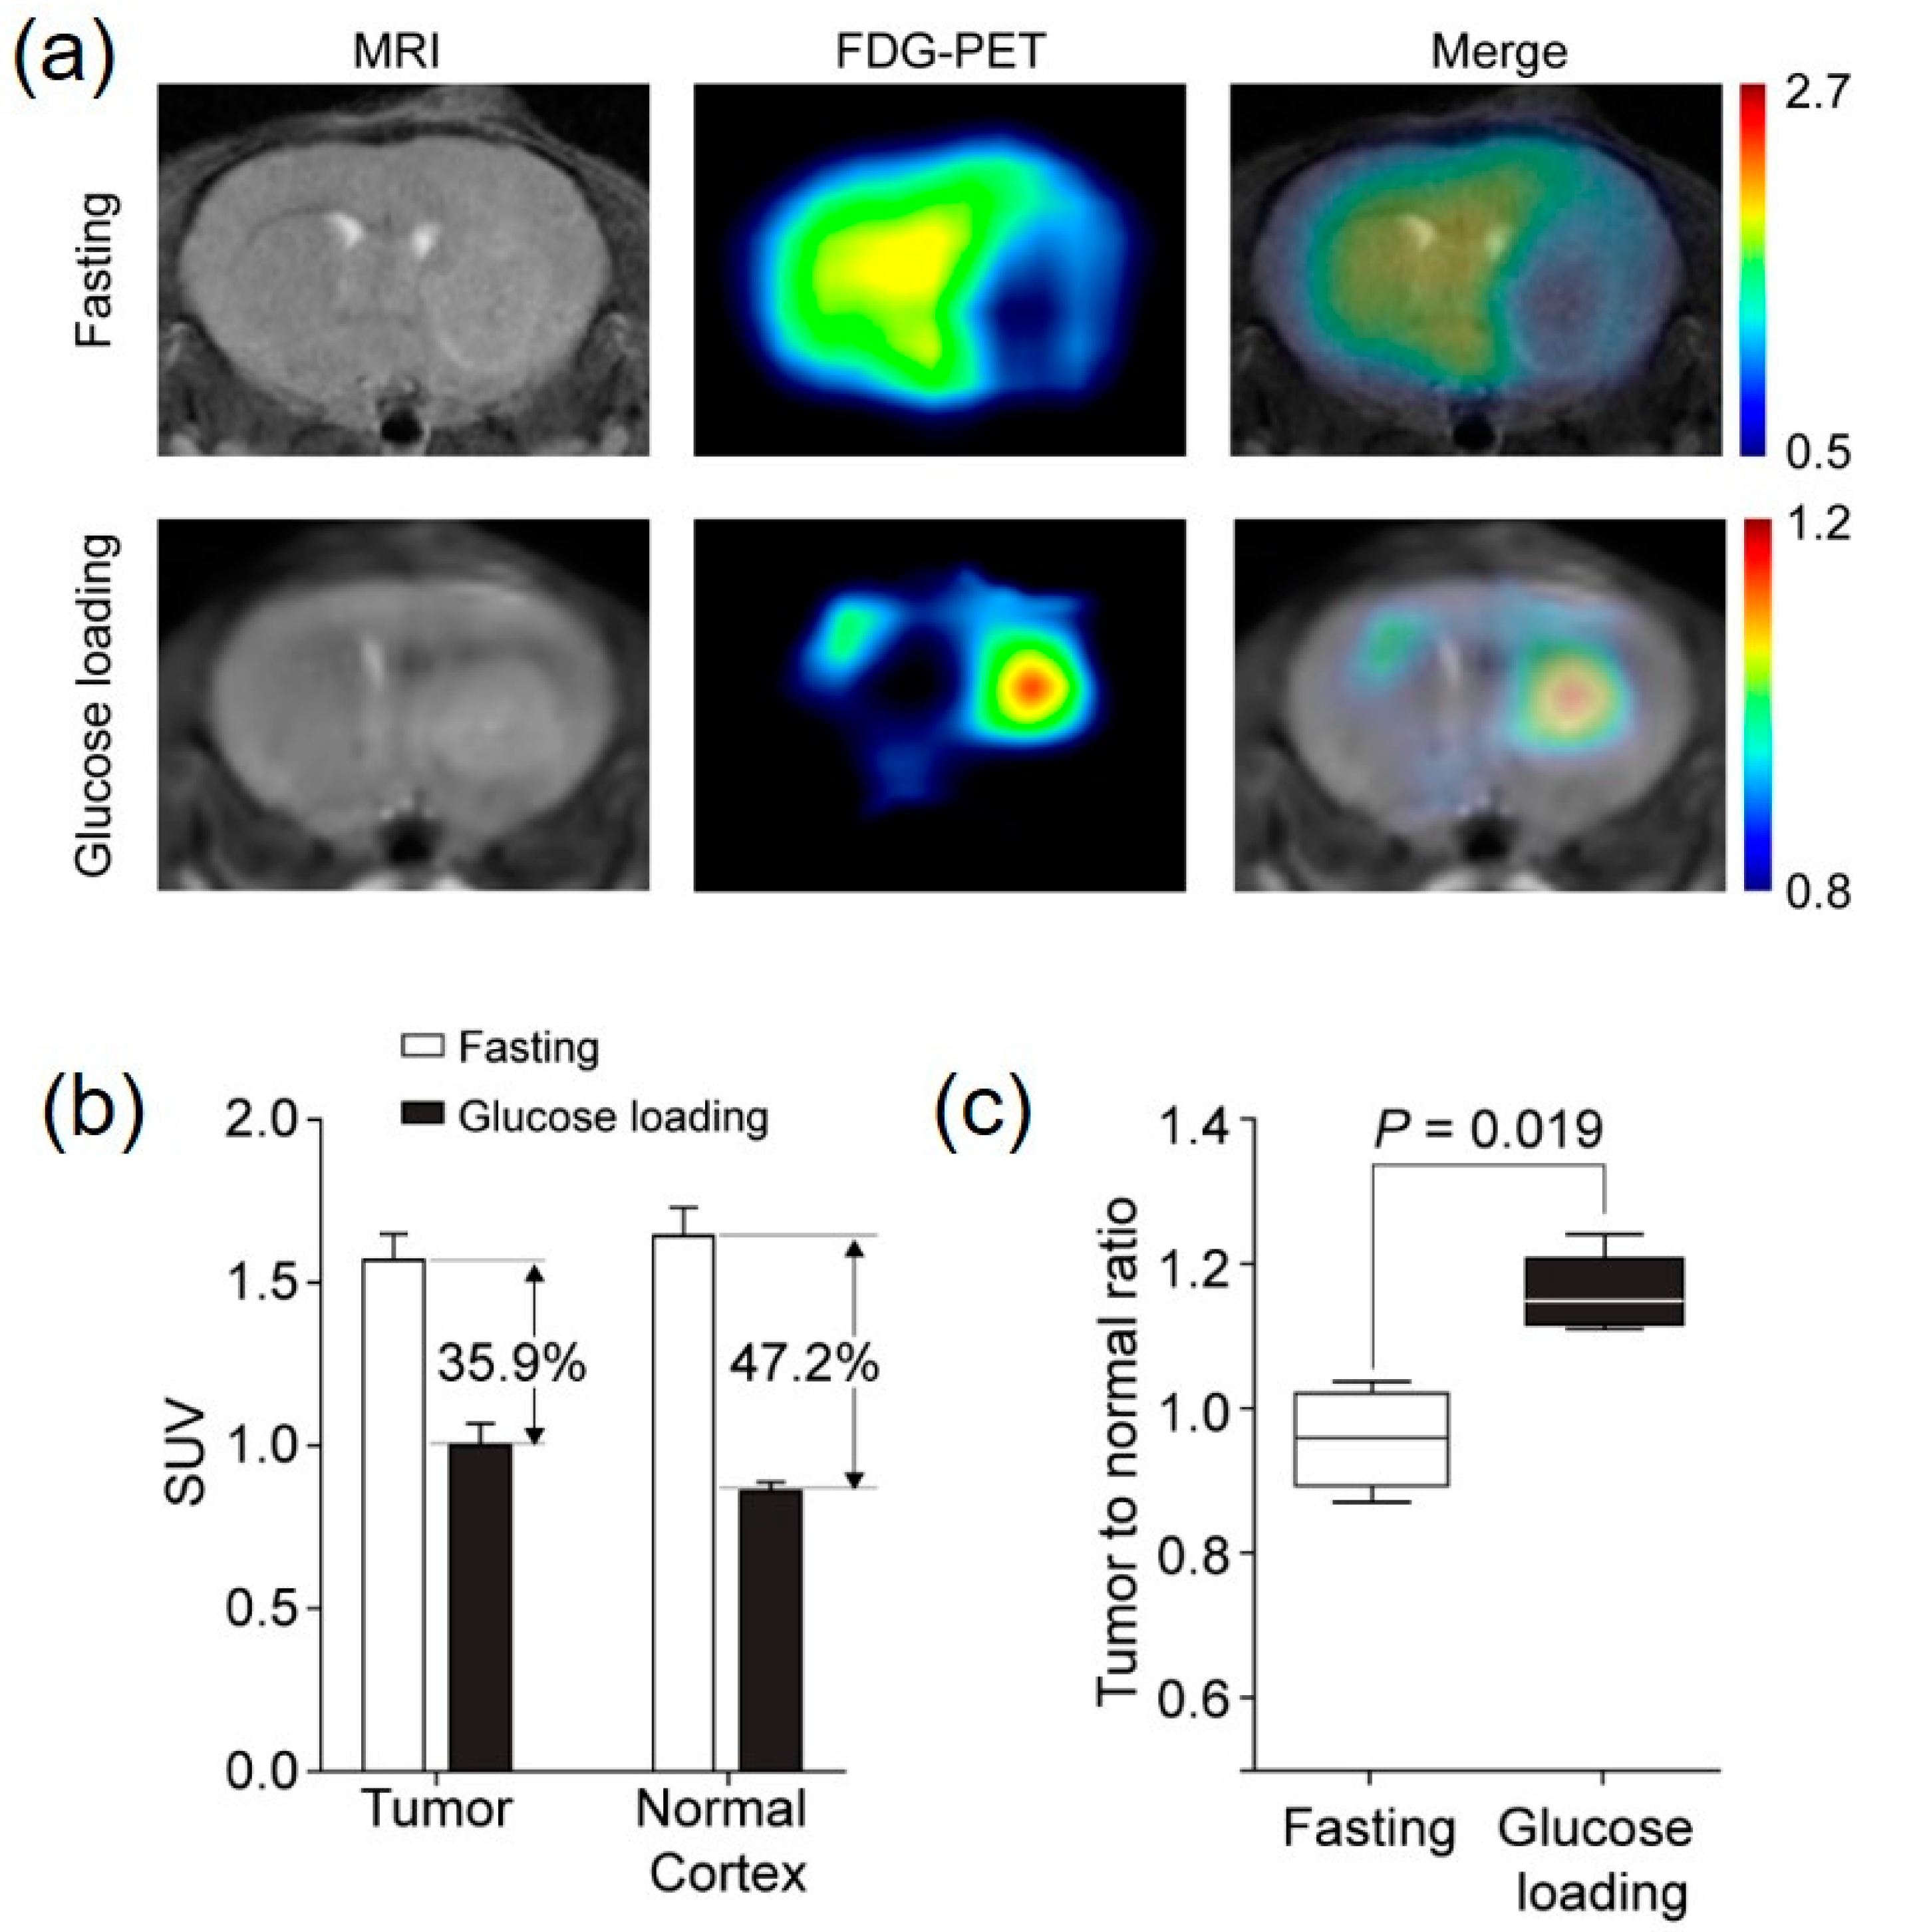
Orthotopic mouse tumor models using the human GBM cell line (U87MG) were imaged twice with 18F-FDG PET (once with fasting and once with glucose loading) to determine the feasibility of glucose loading for enhancing tumor to normal cortex contrast. After fasting, 18F-FDG uptake in the normal cerebral cortex was higher than in the tumor. In fact, the tumor was shown as a round, cold defect compared to the cortex, and the delineation of the tumor for the SUV measurement was difficult without MRI co-registration. In contrast, 18F-FDG uptake in the normal cortex decreased significantly, and there was a clear delineation of the tumor on PET/CT images after glucose loading. The tumor appeared clear, and the SUV measurement could be performed without the help of MRI co-registration. The higher reduction (49.2%) in the SUVmax in the normal cortex compared to that (35.9%) in the tumor led to a significantly higher TNR after glucose loading. The mouse tumor models showed the potential benefits of glucose loading in terms of increasing the contrast between the tumor and the normal cortex.
Studies have evaluated the effect of high blood glucose levels on
18F-FDG uptake in the cerebral cortex, liver, and blood pool. The normal cerebral cortex is the organ that is most consistently affected by different levels of blood glucose. In a recent report, the mean brain SUVmax reduced gradually with a blood glucose level of 110 mg/dL or higher. The SUVmax of the cerebral cortex was reduced by 20, 35, 50, 60, and 65% for blood glucose ranges of 111–120, 121–140, 141–160, 161–200, and greater than 20 mg/dL, respectively [
9]. This earlier study suggested a formula to correct SUV in which the measured SUVmax was multiplied by a reduction factor of 1.25, 1.5, 2, 2.5, and 2.8 for the same blood glucose ranges. Regardless, there is limited information on the effect of various blood glucose levels on
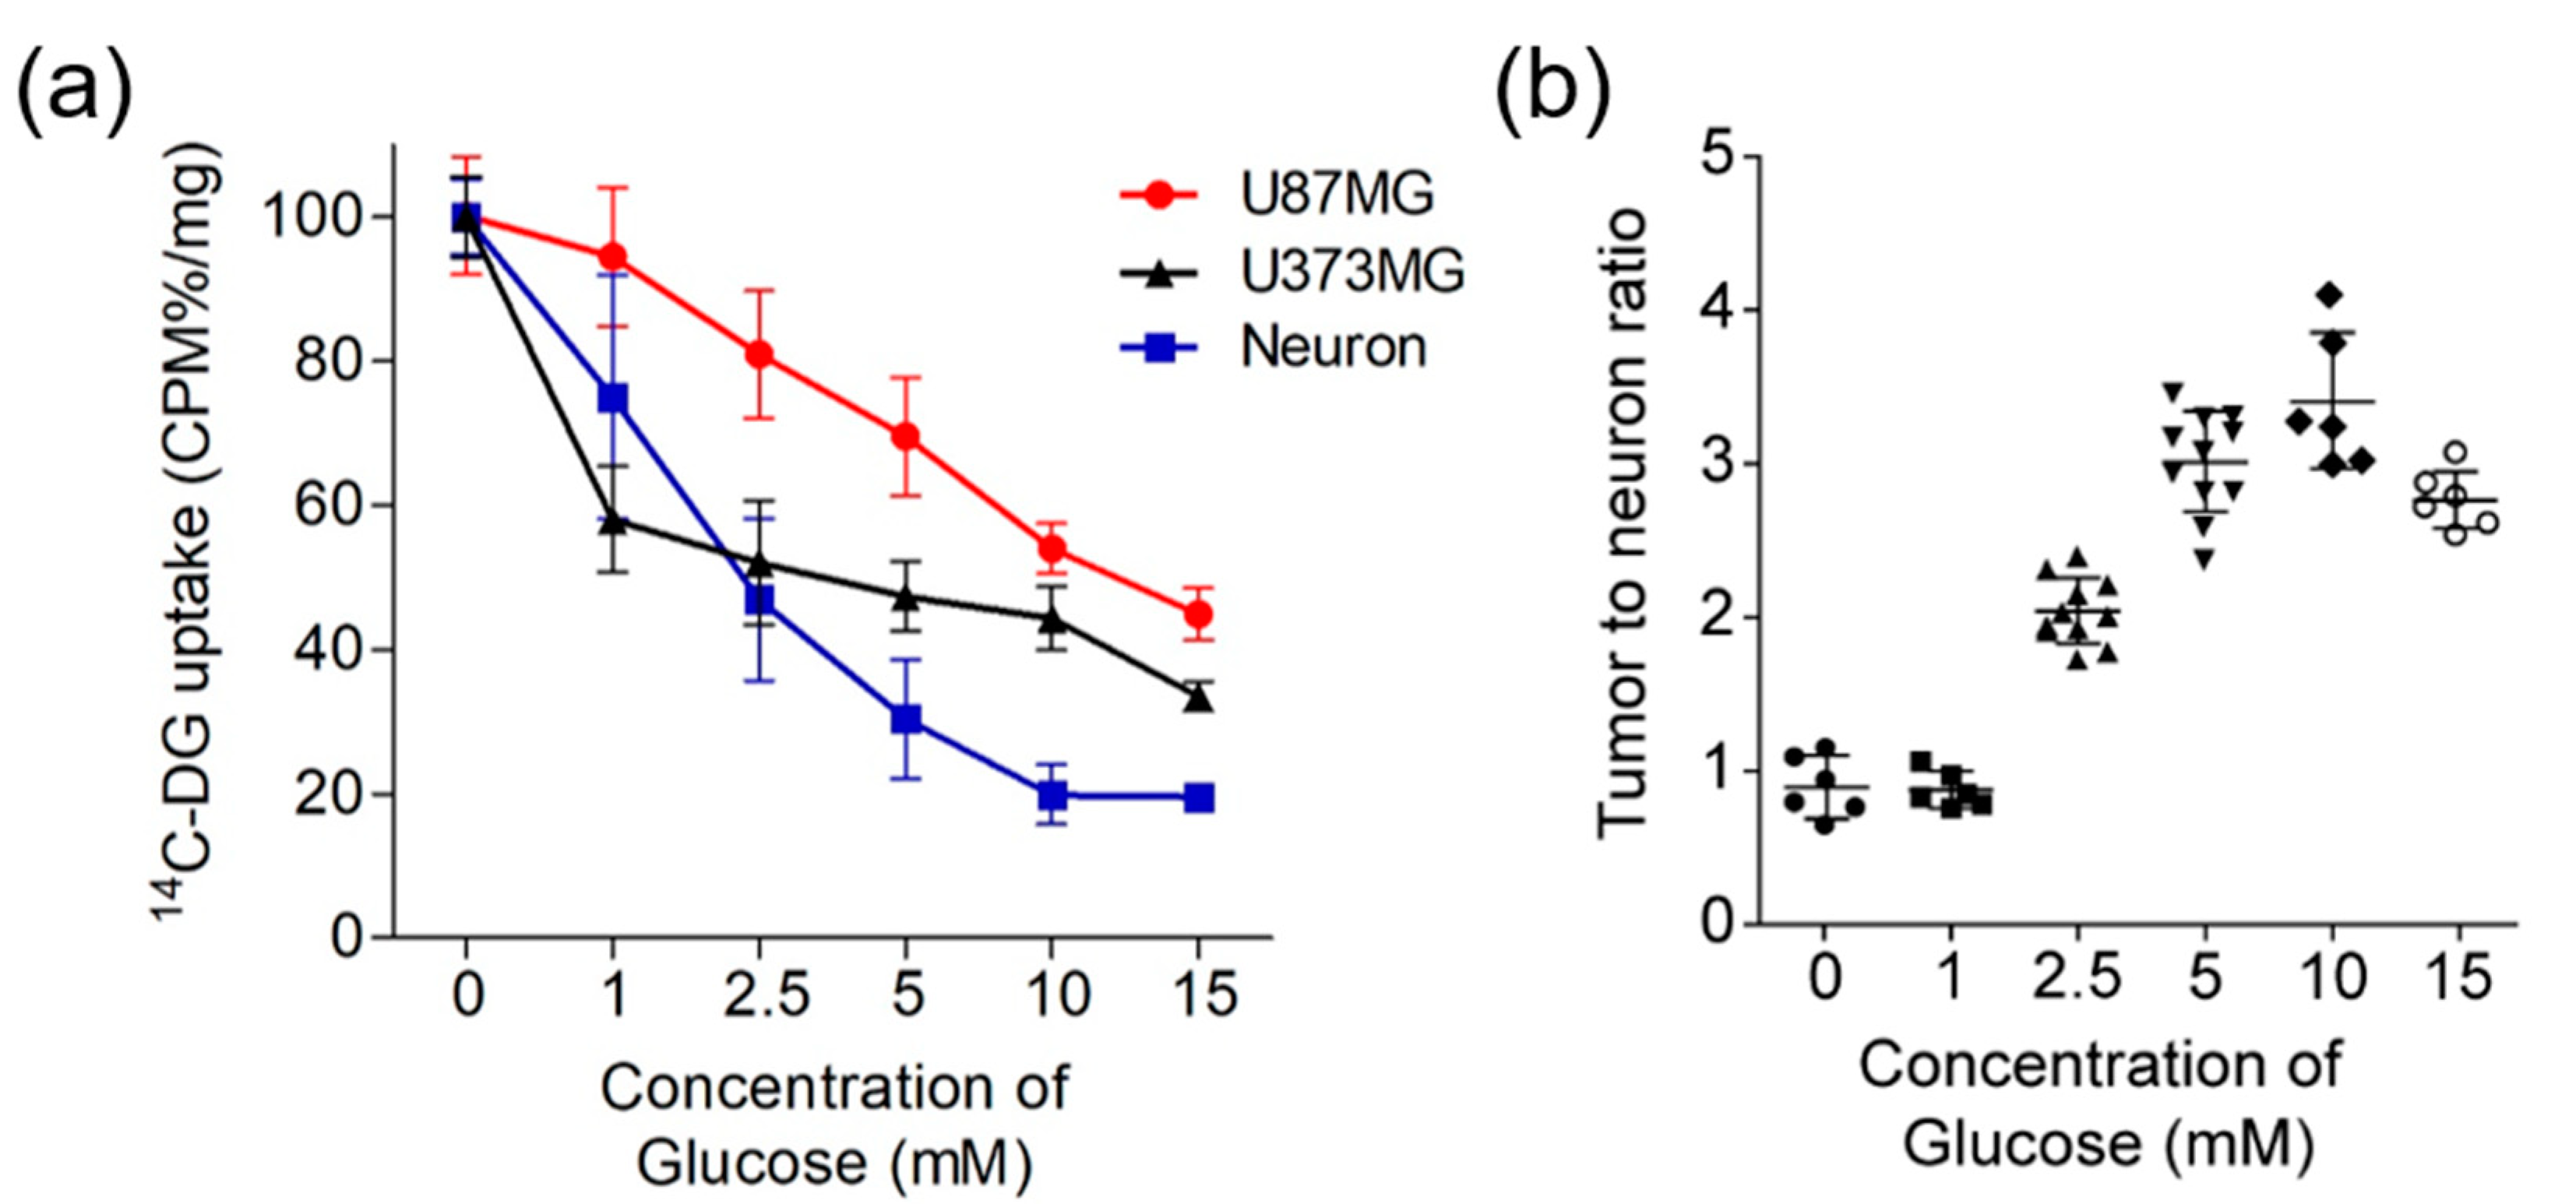
18F-FDG uptake in cerebral gliomas and the blood glucose level, and which level can obtain the highest TNR. Using the U87MG, U373MG cell lines and primary neuron with different concentrations of glucose ranging from 0 to 15 mM, we found decreased
14C-DG uptake at all glucose levels in all three types of cells, but the rates of decrease differed among the primary neurons, U87MG and U373MG cells.
14C-DG uptake of U87MG and U373MG cells showed similar values to neurons at low concentrations of glucose, but higher values than neurons at high concentrations of glucose. The tumor-to-neuron ratio increased continuously up to 10 mM and then decreased from 15 mM. Glucose uptake remained higher in the tumor cells than the primary neurons even at higher concentrations of glucose.
So far, only one report has evaluated the effect of high blood glucose levels on brain tumor detection. Ishizu et al. showed that glucose loading enhanced the detection of brain tumors in eight patients with recurrent or residual glioma and one patient with brain metastasis [
15]. They started the infusion of 10% glucose solution 10–15 min before the
18F-FDG injection, and maintained it until the end of the study, finally providing approximately 500 mL (50 g of glucose). The glucose loading decreased
18F-FDG uptake in the cerebral cortex (54.2% ± 13.8%) in an almost inverse proportion to the glucose level while the tumors also showed a decrease (42.5% ± 15.6%), and the resulting TNR increased by 26.0% ± 5.7%. Although these results are feasible, the limited number of patients included in the study (6 GBMs, 1 OD, 1 astrocytoma) make it difficult to accurately evaluate the value of glucose loading.
In this study, based on the results of the previous report and our cell line and mouse studies, we performed
18F-FDG PET/CT scans after fasting and intravenous infusion of 250 mL of 10% glucose for a total of 35 min, 25 min before
18F-FDG injection and 10 min after the injection. Glucose loading induced a significant reduction in
18F-FDG uptake in both the tumor and normal cortex (42.5% in tumors vs. 53.6% in the normal cortex,
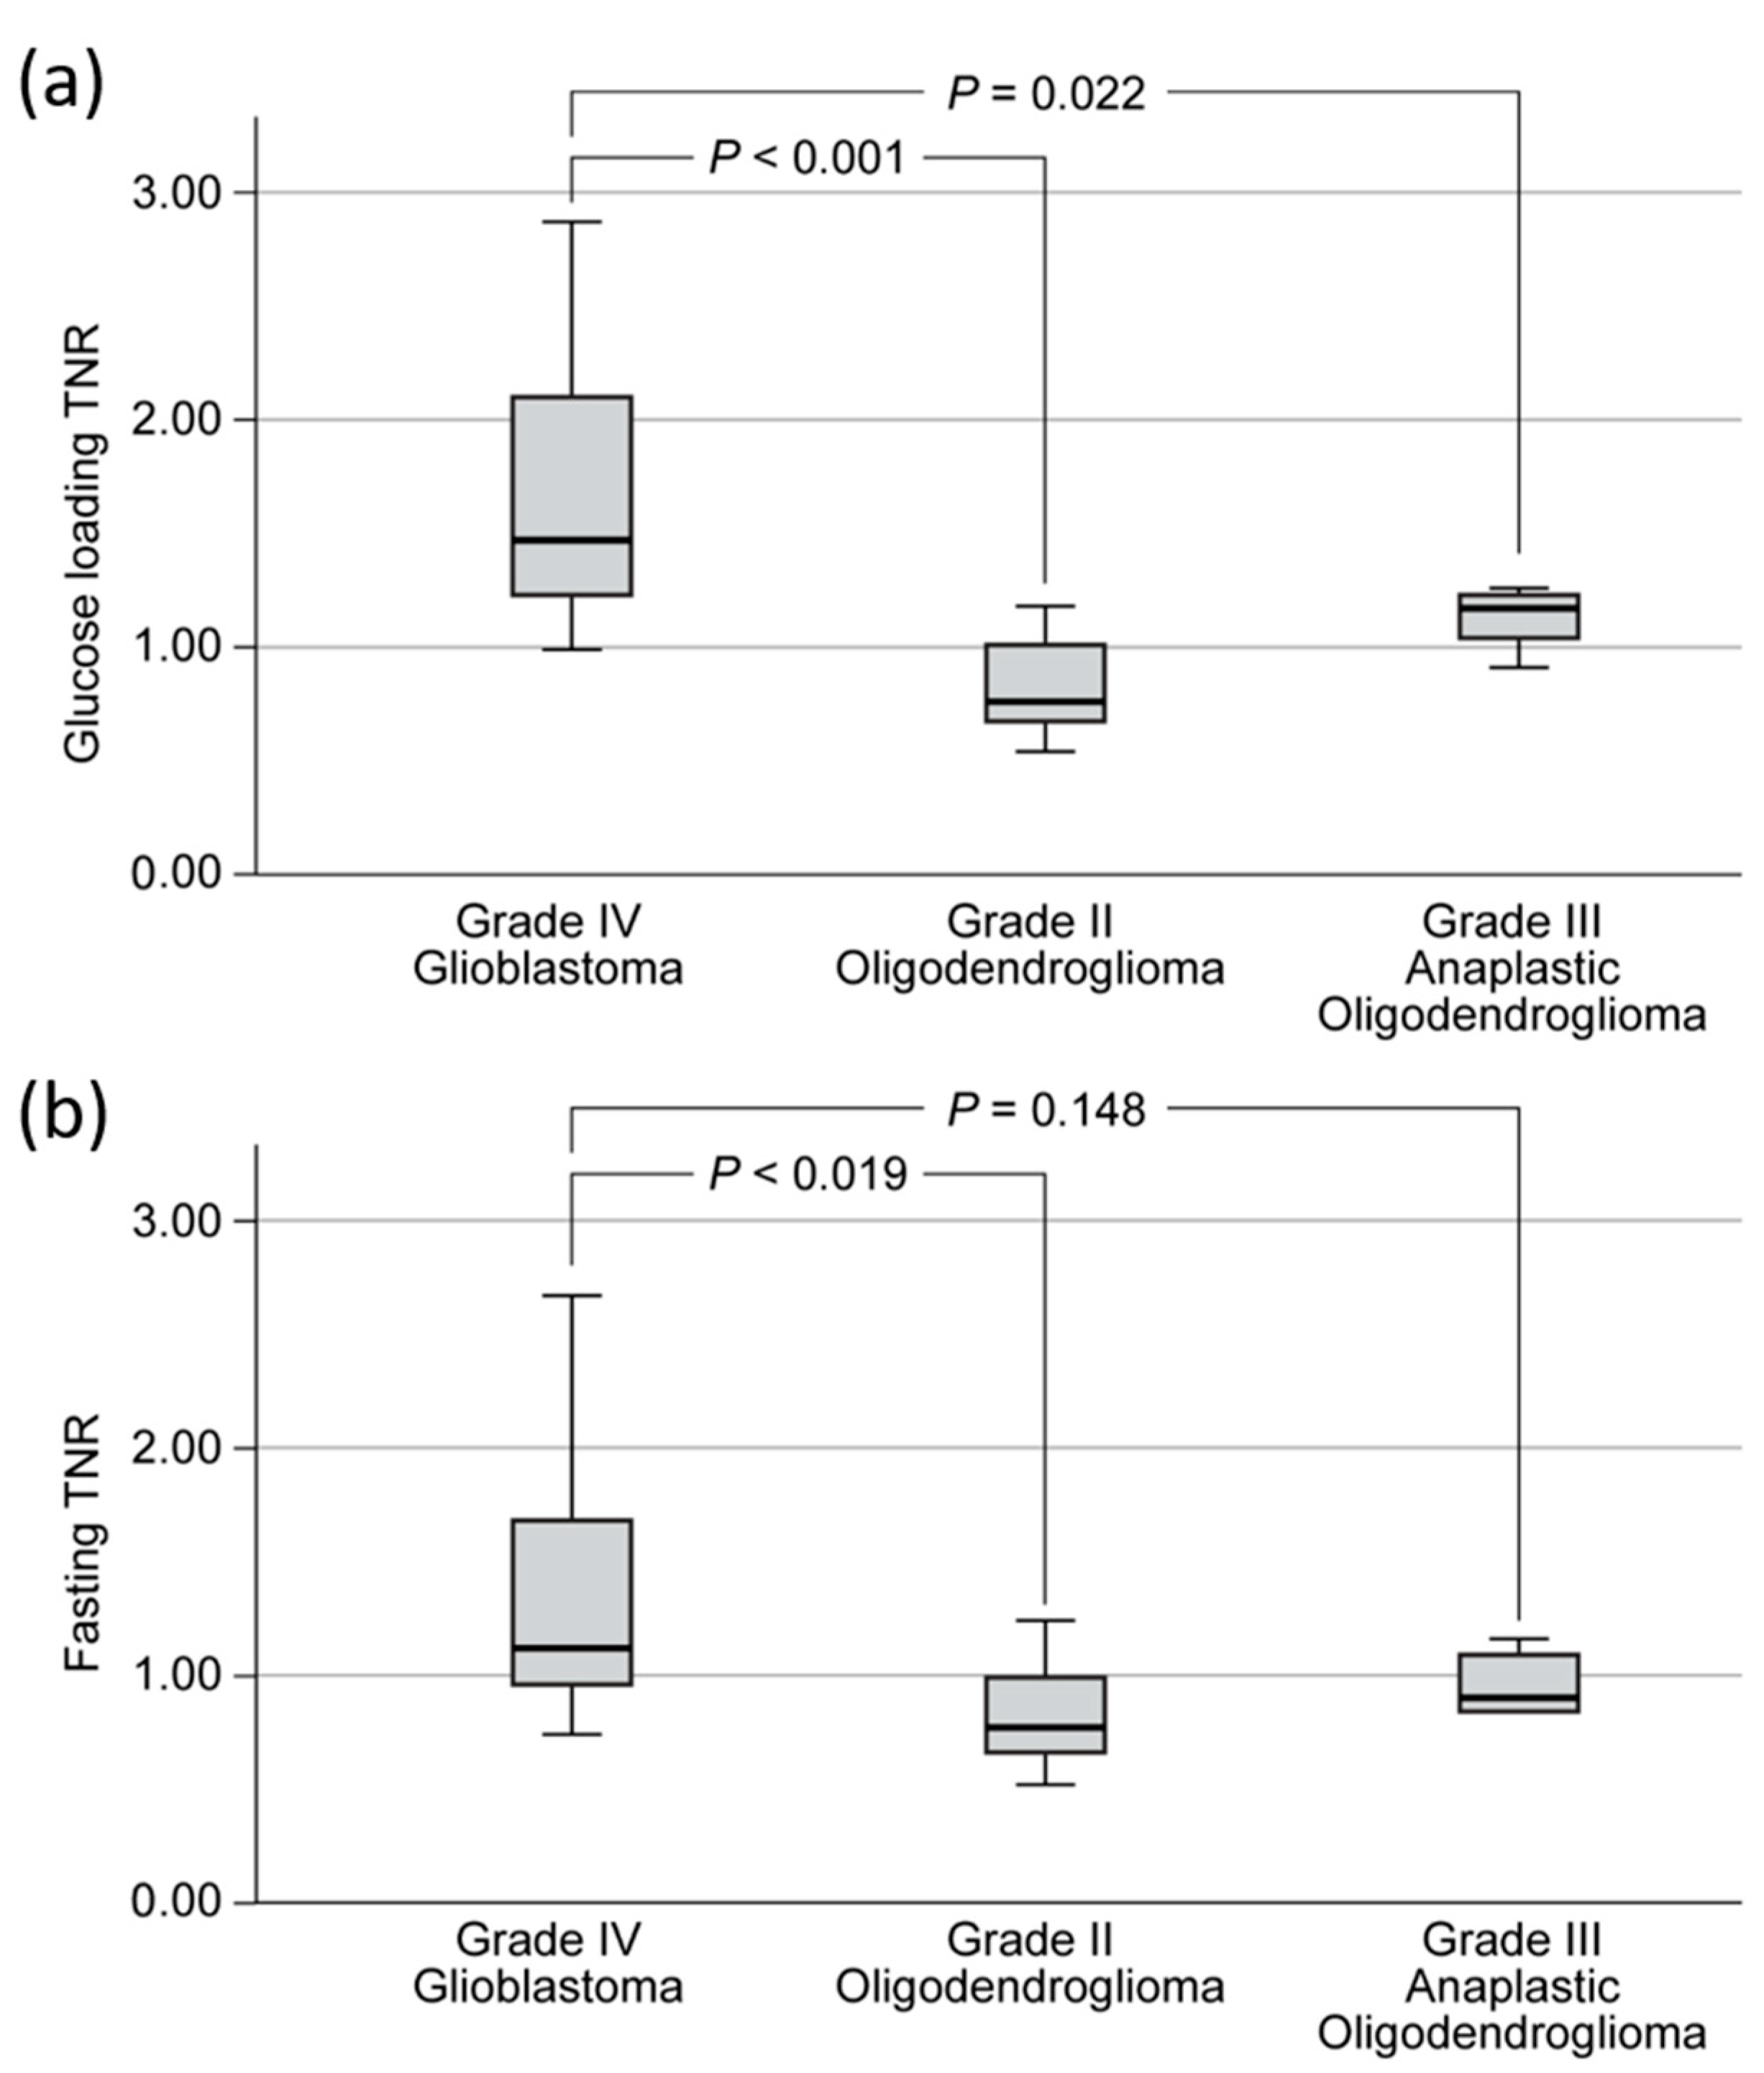
p = 0.0261). The effect of high blood glucose was more beneficial in high-grade than low-grade gliomas. In high-grade gliomas, the median TNR increased by 25% after glucose loading compared to fasting. In low-grade gliomas, there were no significant differences in the median TNRs between fasting and glucose loading. Previously, fasting FDG PET/CT studies have shown relatively low AUC values for grading high- vs. low-grade gliomas (AUC: 0.76–0.80) [
15,
16]. MRI studies have also shown similar AUC values (0.78–0.86) [
17,
18]. In our study, with a TNR cut-off of 0.81, we found a significantly higher AUC value for grading after glucose loading than fasting (0.953 vs. 0.847;
p = 0.0431). This high diagnostic power could help patients who cannot undergo any surgical procedures or biopsy due to the location of lesions. Further studies are needed to see whether additional data from advanced MRI techniques, including perfusion MRI, apparent diffusion coefficient (ADC), and MRS will improve the performance of glucose loading
18F-FDG PET/CT.
Currently, radiolabeled amino acid tracers such as
11C-methionine, 3,4-dihydroxy-6-
18F-fluoro-l-phenylalanine (
18F-FDOPA), and O-(2-
18F-fluoroethyl)-L-tyrosine (
18F-FET) are preferred to
18F-FDG. Other than lower background uptake in the cortex, they are better at showing IDH-wildtype low-grade gliomas [
16,
17,
18]. However, their value in differentiating low-grade vs. high-grade glioma needs further validation due to the high uptake in ODs, which is as high as that for high grade IDH1-wildtype gliomas [
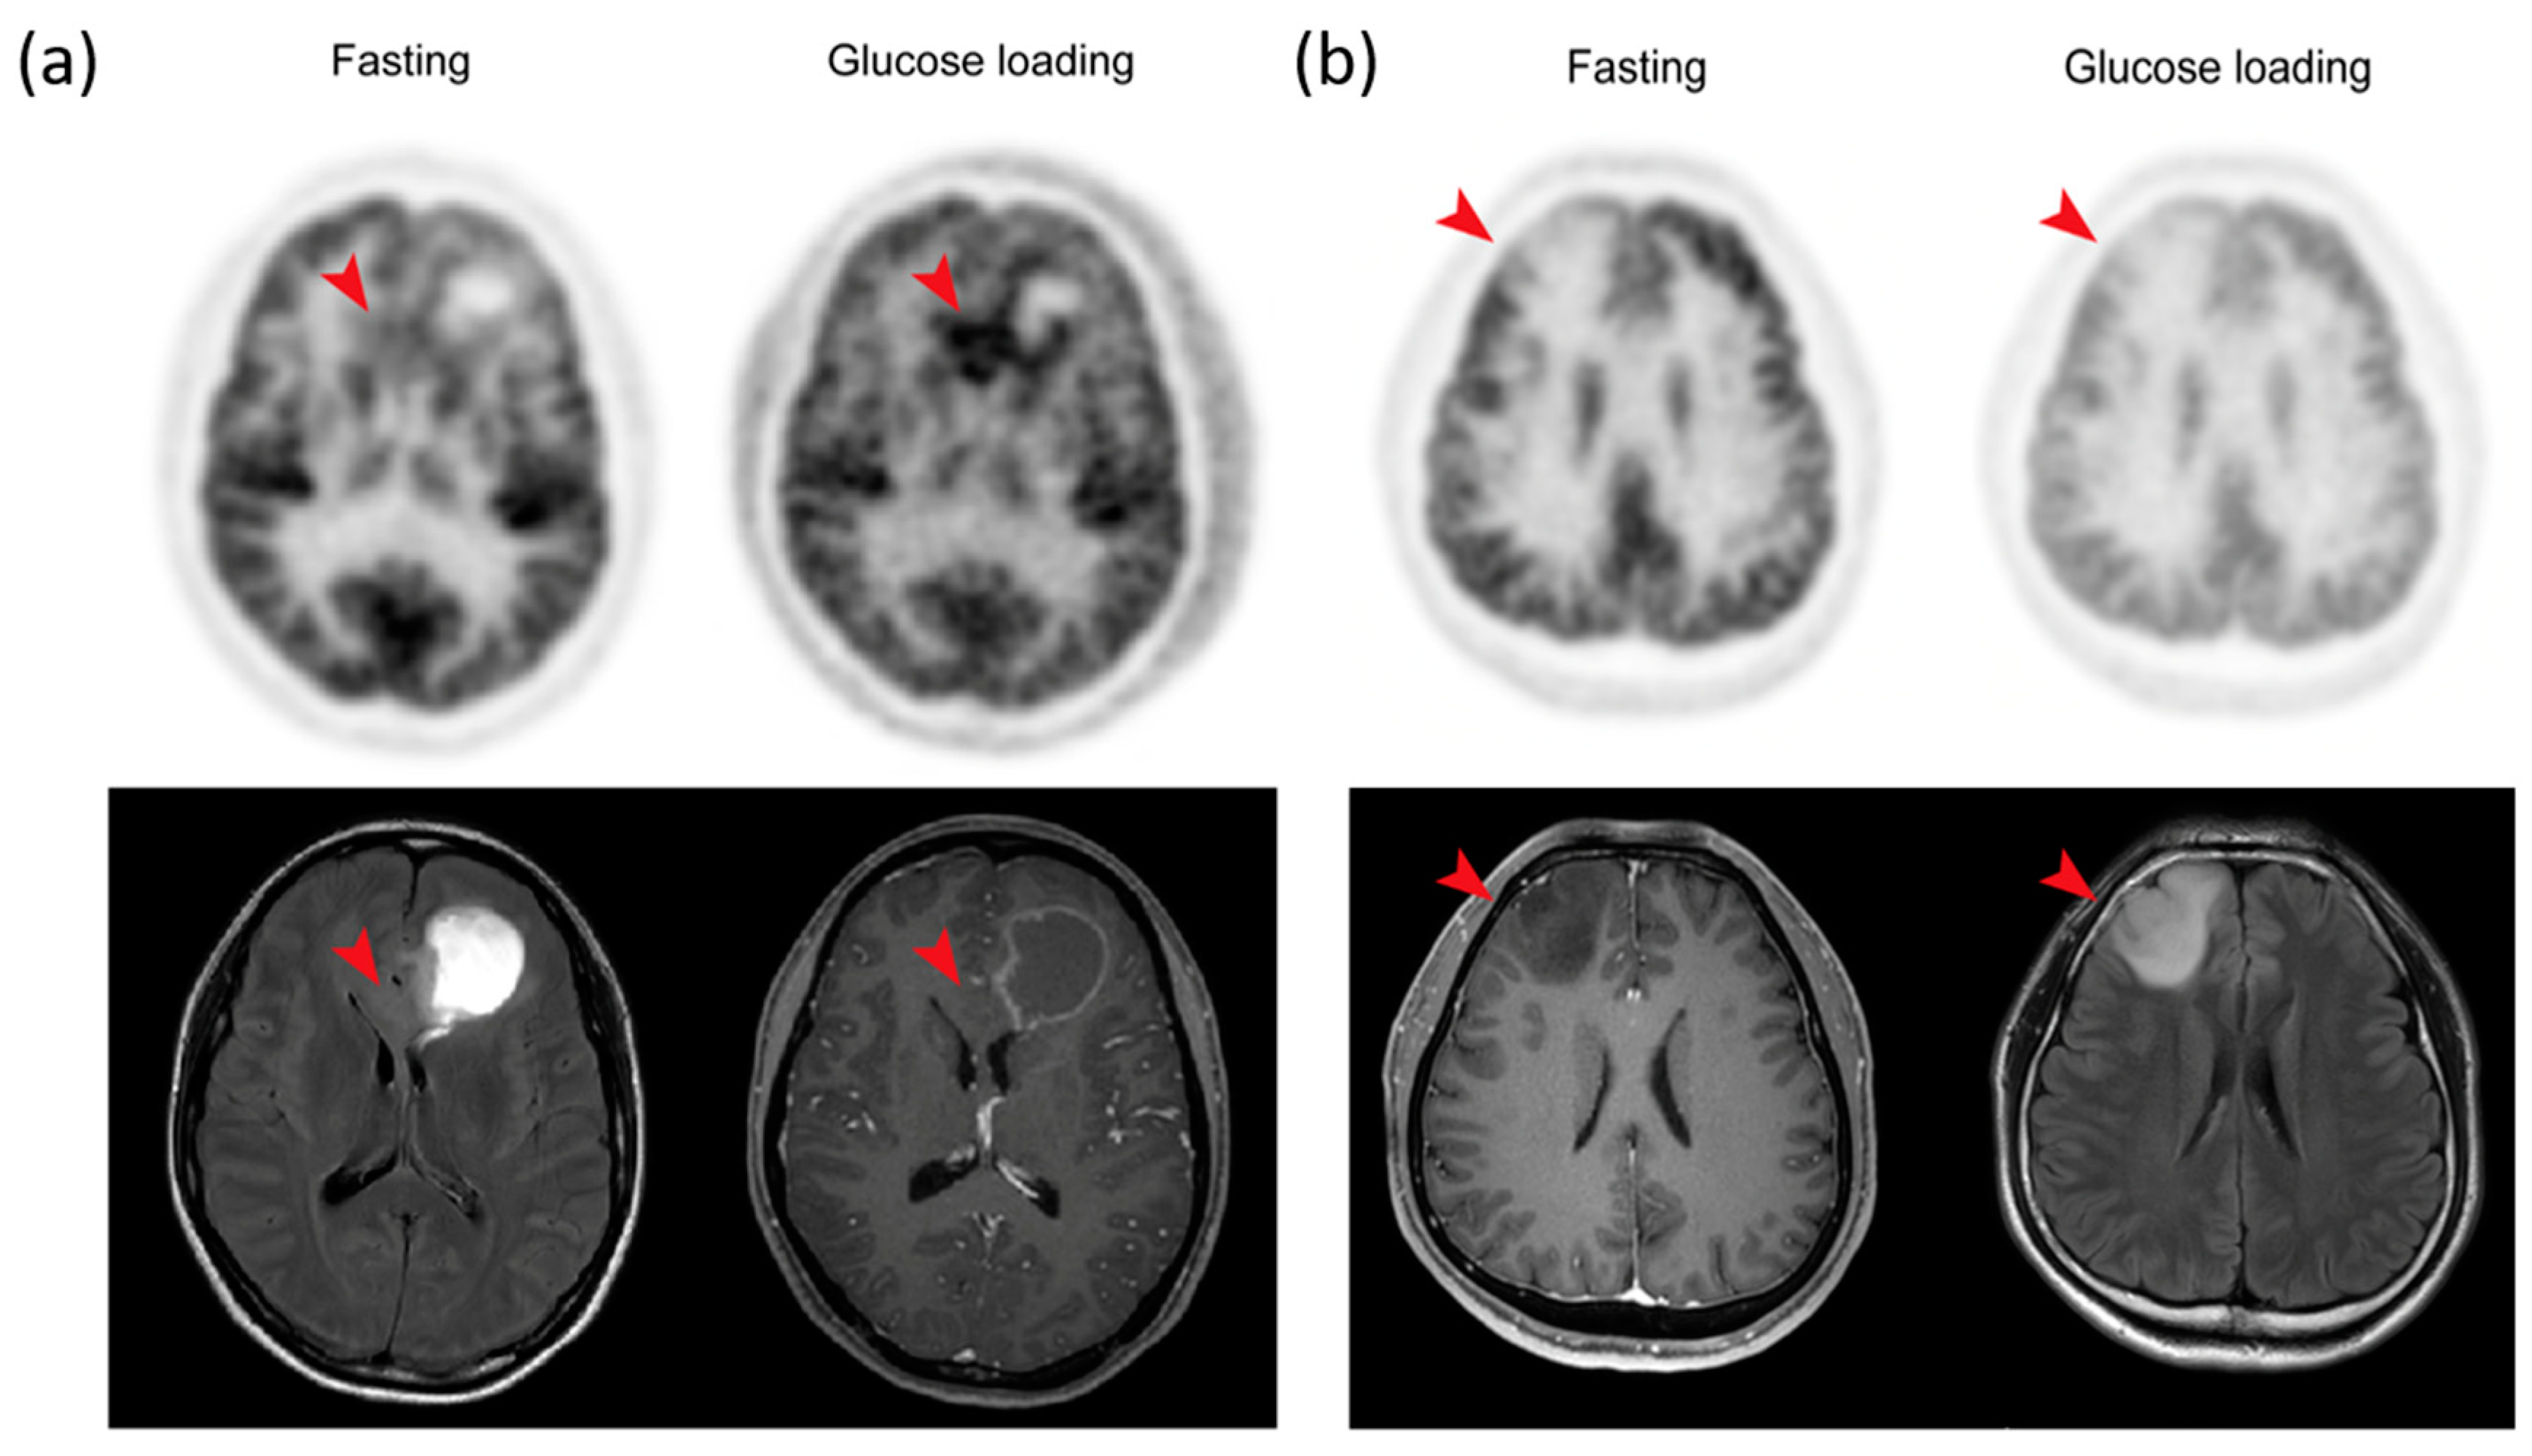
4]. In this study, glucose loading
18F-FDG PET/CT was able to discriminate ODs from IDH-wildtype GBMs. Although high and variable normal cortical uptake has limited the use of
18F-FDG PET/CT,
18F-FDG has advantages in representing the metabolic hallmarks of malignant tumors. Based on our study,
18F-FDG PET/CT with glucose loading might be an opportunity to revisit the use of
18F-FDG in patients with cerebral gliomas. Additional studies comparing
18F-FDG PET/CT with glucose loading and amino acid radiotracers might help to further evaluate this issue.
There were limitations to this study. Patients with diabetes were not included because their baseline blood glucose levels can be highly variable. Further studies are needed to personalize glucose loading methods based on a patient’s individual diabetic status and to control excessive hyperglycemia. Secondly, the metabolic tumor volume related to patient prognosis was not measured, although it was easier to delineate tumor margins due to the lower background in high-grade tumors. Future studies are needed to investigate whether 18F-FDG PET/CT after glucose loading makes it easier to determine the resection margin and metabolic tumor volume of high-grade cerebral gliomas.
4. Materials and Methods
4.1. Glioblastoma Mouse Model
All animal experiments were approved by the Institutional Animal Care and Use Committee (IACUC) of Yonsei University College of Medicine (approval code 2018-0202). Balb/c nude female mice 6 to 8 weeks old (OrientBio, Seongnam, Korea) were used for all animal experiments. U87MG (human glioblastoma) cells (5 × 10⁵ in 2 μL phosphate buffered saline [PBS]) were stereotactically implanted into the right frontal lobe of the mice. The glioma-bearing mice were imaged 4 weeks post-implantation.
4.2. Animal PET
All mice (n = 5) were imaged twice on a microPET scanner (Inveon, Siemens Healthcare, Erlangen, Germany), once after overnight fasting and again after glucose loading. For 18F-FDG PET imaging, the mice were anesthetized with 2.5% isoflurane. In the glucose loading study, blood glucose levels were measured using a glucometer (Accu-Chek Performa, Accu-Chek Inform II test strips; Roche Diagnostics, Indianapolis, IN, USA) 5 min after the subcutaneous injection of 5% dextrose solution (200 μL). Then, the mice were intravenously administered with 18F-FDG (7.4 MBq/0.2 mL in saline) and allowed to rest for 1 h on a heating pad under 2% isoflurane anesthesia. 18F-FDG PET data were acquired for 10 min. After imaging, the animals were kept under a heat lamp until awake, then placed in an isolation room for 24 h to eliminate radiation hazards. The PET data were reconstructed with three-dimensional (3D) ordered subset expectation-maximization (OSEM) with 2 iterations and 18 subsets. The matrix size was 128 × 128 × 159, and the voxel size was 0.776 × 0.776 × 0.796 mm. The SUV was calculated by the tissue concentration kBq/cm3 per injected dose (kBq per gram of body weight).
4.3. Animal Magnetic Resonance Imaging
Magnetic resonance imaging (MRI) of the implanted brain tumor was performed using a 9.4 T preclinical MRI (Bruker BioSpec 94/20 USR, Ettlingen, Germany; software: ParaVision 5.0) with water-cooled gradient coils (maximum gradient strength, 400 mT/m) before PET imaging. The mice were kept warm on a heating pad and anesthetized by 2% isoflurane during the MRI, which was performed with a respiration-triggered and fat-suppressed T2-weighted rapid acquisition with relaxation enhancement (RARE) sequence [
19]. A two-dimensional (2D) set of axial images were acquired (TR, 4900 ms; TEeff, 24 ms; pixel-size, 208 μm
2; slice-thickness, 500 μm).
4.4. Animal Image Analysis
Image processing and analyses were performed using PMOD software (PMOD Technologies Ltd., Zurich, Switzerland). 18F-FDG PET images were co-registered to the corresponding T2-weighted MRI images and manually transformed for minor misalignments. Two regions of interest (ROI) were manually drawn over the MRI images (one for the tumor to measure the maximum SUV and the other for the contralateral cortex to measure the mean SUV). The TNR were calculated and the fasting and glucose loading scans were compared.
4.5. In Vitro 14C-DG Uptake in Glioma Cells and Neurons
The cells (U87MG, U373MG and mouse primary neuron: 5 × 10
4) were seeded in 1 mL growth medium per well in 24-well plates and incubated in a standard culture medium for 24 h. The cells were washed twice with glucose-free medium and cultured in 0, 1, 2.5, 5, 10, and 15 mM glucose-concentration medium for 2 h. Subsequently,
14C–DG (PerkinElmer, Waltham, MA, USA) 3.7 kBq/mL was added to each sample, and the cells were incubated for 30 min. Then, the medium was removed and the cells were rinsed twice with ice-cold PBS. The resultant cells were lysed with 500 μL of 0.2 N NaOH for 2 h at room temperature. The radioactivity was measured with a liquid scintillation counter (Tri-Carb, PerkinElmer, Waltham, MA, USA). The measured radioactivity was normalized to protein concentration by previously described methods [
20]. The experiments were performed three times using three replicates for each condition.
4.6. Patients
This prospective study included 27 patients suspected of cerebral gliomas (11 men, 16 women; median age, 50.0 years; range, 27–75 years) between June 2019 and December 2019. All patients had undergone contrast-enhanced MRI (CE-MRI) and two 18F-FDG PET/CT scans, one after fasting and the other after glucose loading. The interval between the two 18F-FDG PET/CT scans was 1 to 14 days, with a median interval of 1 day. Patients underwent surgery shortly after imaging (median, 3 days; range, 1–20 days). No therapeutic intervention, such as any other surgery, radiotherapy, or chemotherapy was performed before surgery in any of the patients. All gliomas were classified using the 2016 World Health Organization (WHO) guidelines. The Institutional Review Board of Yonsei University College of Medicine approved this prospective study (approved code: 2018-0202), and informed consent was obtained from all patients (IRB No. 4-2019-0455). This study was registered at cris.nih.go.kr (KCT0004466).
4.7. 18F-FDG PET/CT Protocol
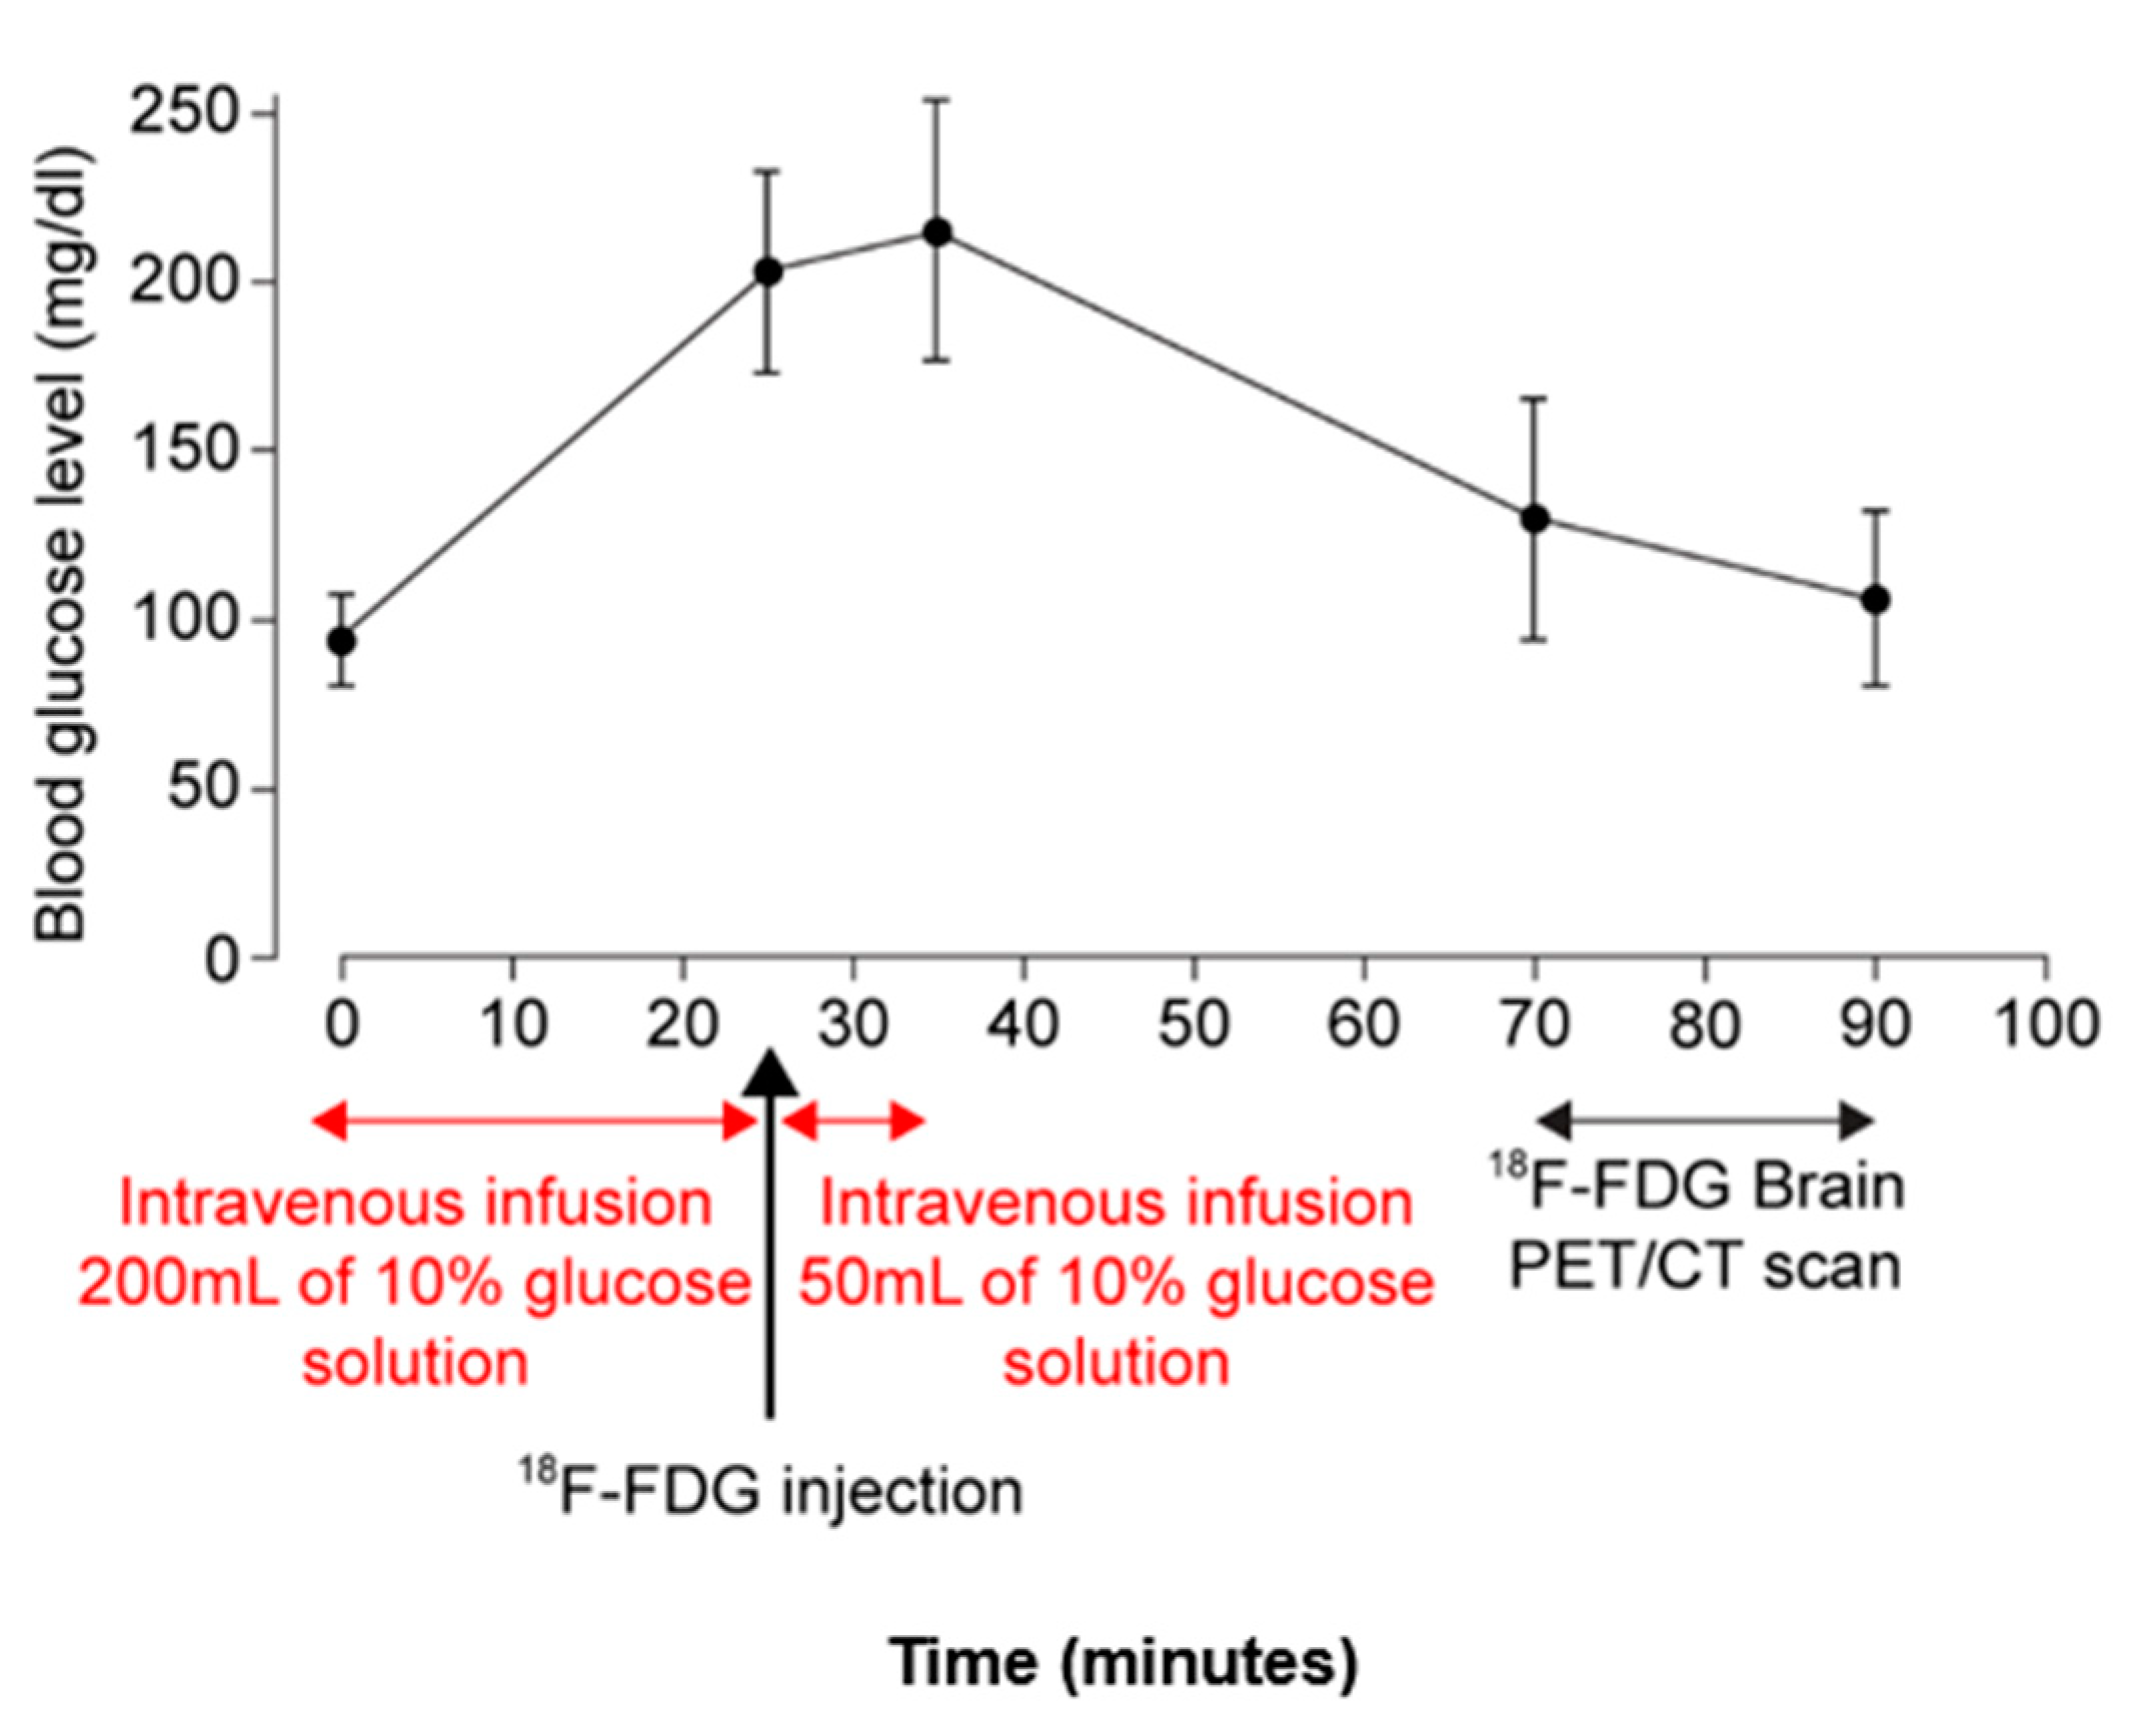
For fasting scans, all patients fasted for at least 6 h, then, blood glucose concentration was confirmed as less than 140 mg/dL before an injection of 18F-FDG. For glucose loading scans, all patients were asked to fast for at least 6 h to ensure their blood glucose level was less than 140 mg/dL. The glucose loading was started by intravenous infusion of 250 mL of 10% glucose solution, with 200 mL given first for 25 min at a rate of 8 mL/min, then, approximately 5.5 MBq of 18F-FDG per kilogram of body weight was administered, and finally, the remaining 50 mL of 10% glucose solution was further infused for 10 min (infusion speed of 5 mL/min). Blood glucose levels were measured five times: on arrival, just before 18F-FDG injection, 10 min after 18F-FDG injection, before scanning, and after scanning.
Imaging was performed using a PET/CT scanner (Discovery 600, GE Healthcare, Waukesha, WI, USA) with an axial field-of-view of 15.7 cm and a spatial resolution of 4.0 mm at full-width at half maximum at 1 cm from center. Sixty minutes after the 18F-FDG injection, CT images were obtained with an eight-slice helical CT unit (Light Speed, GE Healthcare, Waukesha, WI, USA) using the following parameters: 120 kVp, 200 mA; 0.8 s rotation time; 3.3 mm scan reconstruction; 25 cm field-of-view; and a 256 × 256 matrix. Whole-brain, 3D PET images were obtained over 10 min. PET data were reconstructed iteratively using an ordered-subset expectation-maximization algorithm. The CT datasets were used for attenuation correction.
4.8. Data Analysis
PET/CT images were reviewed and analyzed on a dedicated workstation by two nuclear medicine physicians who reached consensus. The PET/CT images were registered to contrast-enhanced MRI images using a fusion software (MIM-6.5; MIM Software Inc., Cleveland, OH, USA). A volume of interest (VOI) was manually drawn over the hottest area of each tumor, and the SUVmax of the tumor was measured. When no increases in 18F-FDG uptake were observed, the SUVmax was measured within the boundary of the tumor on the MRI images. The SUV of a VOI was calculated as follows: (decay-corrected activity (kBq per tissue volume (mL))/(injected 18F-FDG activity (kBq) per body mass (g)). To obtain reference (background) regions, three VOIs were manually drawn in the regions of the contralateral cerebral cortex with a normal appearance, the SUVmean values of the three VOIs were averaged, and the TNR was calculated.
4.9. Statistical Analysis
The Mann–Whitney U test was used to compare the TNR of the 18F-FDG uptake on PET after fasting versus after glucose loading. ROC analysis was used to compare the diagnostic performance of the two 18F-FDG PET/CT protocols for glioma grading. The Bonferroni methods was used in post hoc analyses. All statistical analyses were performed using IBM SPSS Statistics for Windows, version 25 (IBM Corp, Armonk, NY, USA). Except for post hoc analyses, a p-value less than 0.05 was considered statistically significant.

 ,
, 


