Article

Prognostic Value of CD200R1 mRNA Expression in Head and Neck Squamous Cell Carcinoma

1
Department of Medical Oncology, International St Mary’s Hospital, Catholic Kwandong University College of Medicine, Incheon 22711, Korea
2
Division of Hematology and Medical Oncology, Department of Internal Medicine, Kangbuk Samsung Hospital, Sungkyunkwan University School of Medicine, Seoul 03181, Korea
3
Division of Oncology, Department of Internal Medicine, Eunpyeong St. Mary’s Hospital, College of Medicine, The Catholic University of Korea, Seoul 03312, Korea
4
Division of Oncology, Department of Internal Medicine, Incheon St. Mary’s Hospital, College of Medicine, The Catholic University of Korea, Incheon 21431, Korea
5
Division of Hematology and Medical Oncology, Department of Internal Medicine, Konyang University Hospital, Daejeon 35365, Korea
6
Division of Hematology/Oncology, Department of Internal Medicine, Keimyung University Dongsan Hospital, Daegu 51448, Korea
7
Division of Oncology/Hematology, Department of Internal Medicine, Korea University College of Medicine, Seoul 02841, Korea
8
Department of Internal Medicine, Seoul National University Bundang Hospital, Seoul National University College of Medicine, Seongnam 13620, Korea
9
Division of Medical Oncology, Department of Internal Medicine, Yonsei University College of Medicine, Yonsei Cancer Center, Seoul 03722, Korea
10
Department of Internal Medicine, Seoul National University Boramae Medical Center, Seoul 07061, Korea
11
Department of Hematology-Oncology, Ajou University School of Medicine, Suwon 16499, Korea
12
Division of Hematology-Oncology, Department of Internal Medicine, Yeungnam University College of Medicine, Daegu 42415, Korea
13
Division of Hematology/Oncology, Department of Internal Medicine, Chung-Ang University Hospital, Chung-Ang University College of Medicine, Seoul 06973, Korea
14
Department of Biomedical Systems Informatics and Brain Korea 21 PLUS Project for Medical Science, Yonsei University College of Medicine, Seoul 03722, Korea
15
HERINGS, The Institute of Advanced Clinical & Biomedical Research, Seoul 08378, Korea
*
Author to whom correspondence should be addressed.
These authors contributed equally to this work.
Cancers 2020, 12(7), 1777; https://doi.org/10.3390/cancers12071777
Submission received: 16 May 2020 / Revised: 23 June 2020 / Accepted: 1 July 2020 / Published: 3 July 2020
(This article belongs to the Section Cancer Biomarkers)

Abstract

:
Immune system dysfunction is associated with head and neck squamous cell carcinoma (HNSCC) development and progression and immune checkpoint inhibitors have demonstrated substantial survival benefits in platinum-refractory HNSCC; therefore, we examined the prognostic value of immune-related gene (IRG) expression in HNSCC. We analyzed the expression of 82 IRGs in 71 patients with HNSCC enrolled in a feasibility study for a prospective HNSCC biomarker-driven umbrella trial (Korean Cancer Study Group TRIUMPH study, NCT03292250). CD200R1 was identified as an independent prognostic factor and validated in GEO and TCGA database. CD2000R1 mRNA expression was found to be an independent favorable prognostic factor in patients with HNSCC. Moreover, CD200R1 was found to affect genes and pathways associated with the immune response, while seven differentially expressed genes (CD8A, DOK2, CX3CR1, TYROBP, CXCL9, CD300LF, IFNG) were associated with CD200R1 expression. Samples with higher CD200R1 expression displayed higher tumor-infiltrating immune cell counts both in silico and in histological analysis. These findings will help in the development of more accurate prognostic tools and suggest CD200R1 modulation as a HNSCC immunotherapy.

1. Introduction

Head and neck squamous cell carcinoma (HNSCC) is one of the most common cancers worldwide, with more than 350,000 related deaths per year [1,2]. Despite the presence of established combined and multidisciplinary therapies against HNSCC, treatment outcomes remain poor and have improved little in recent decades [3]. Major prognostic factors associated with HNSCC, include invasive depth, cervical lymph node metastasis, and distant metastasis; however, the identification of clinical prognostic factors remains challenging despite increasing knowledge of cancer genomics [4]. Thus, new prognostic biomarkers for HNSCC are urgently needed to enable clinicians to select appropriate treatments.
The immune system is known to be significantly involved in HNSCC progression [5,6,7], and anti-programmed cell death protein 1 (PD-1) immune checkpoint inhibitors have been approved to treat recurrent and/or metastatic HNSCCs that are refractory to platinum therapy [8,9]. Several immune-biomarkers have been highlighted as useful prognostic indicators for HNSCC [10,11,12,13]; for instance, circulating CD8+ T cell levels prior to treatment have been found to be associated with improved survival in patients with advanced oropharyngeal cancer [10], while high tumor-infiltrating lymphocyte levels are related with increased overall survival (OS) [11], and increased CD68+ macrophage counts in oral squamous cell carcinoma are known to be significantly correlated with mortality [12]. However, the molecular characteristics of tumor-immune interactions remain largely unclear, and few studies have evaluated the prognostic value of immune-related genes (IRGs) in a large HNSCC database.
In this study, we explored the prognostic value of IRGs in patients with HNSCC from a retrospective Korean cohort, and validated their prognostic significance using data from the Gene Expression Omnibus (GEO) and The Cancer Genome Atlas (TCGA) databases. In addition, we investigated the potential mechanism of action of the IRGs, and quantified immune cell infiltration which was stratified based on IRG expression.

2. Results

2.1. Patient Characteristics

The clinicopathological characteristics and CD200R1 mRNA expression status of the 71 patient tumors included in this study are shown in Table 1. The cohort included 58 (82%) men and 13 (18%) women between the ages of 28 and 81, and almost 29% of the patients had never smoked. Most of the tumors were human papillomavirus (HPV)-negative and more than 66% had reached advanced clinical stages (III or IV). The most common sites of tumor origin were the oral cavity (37%) and the oropharynx (24%).

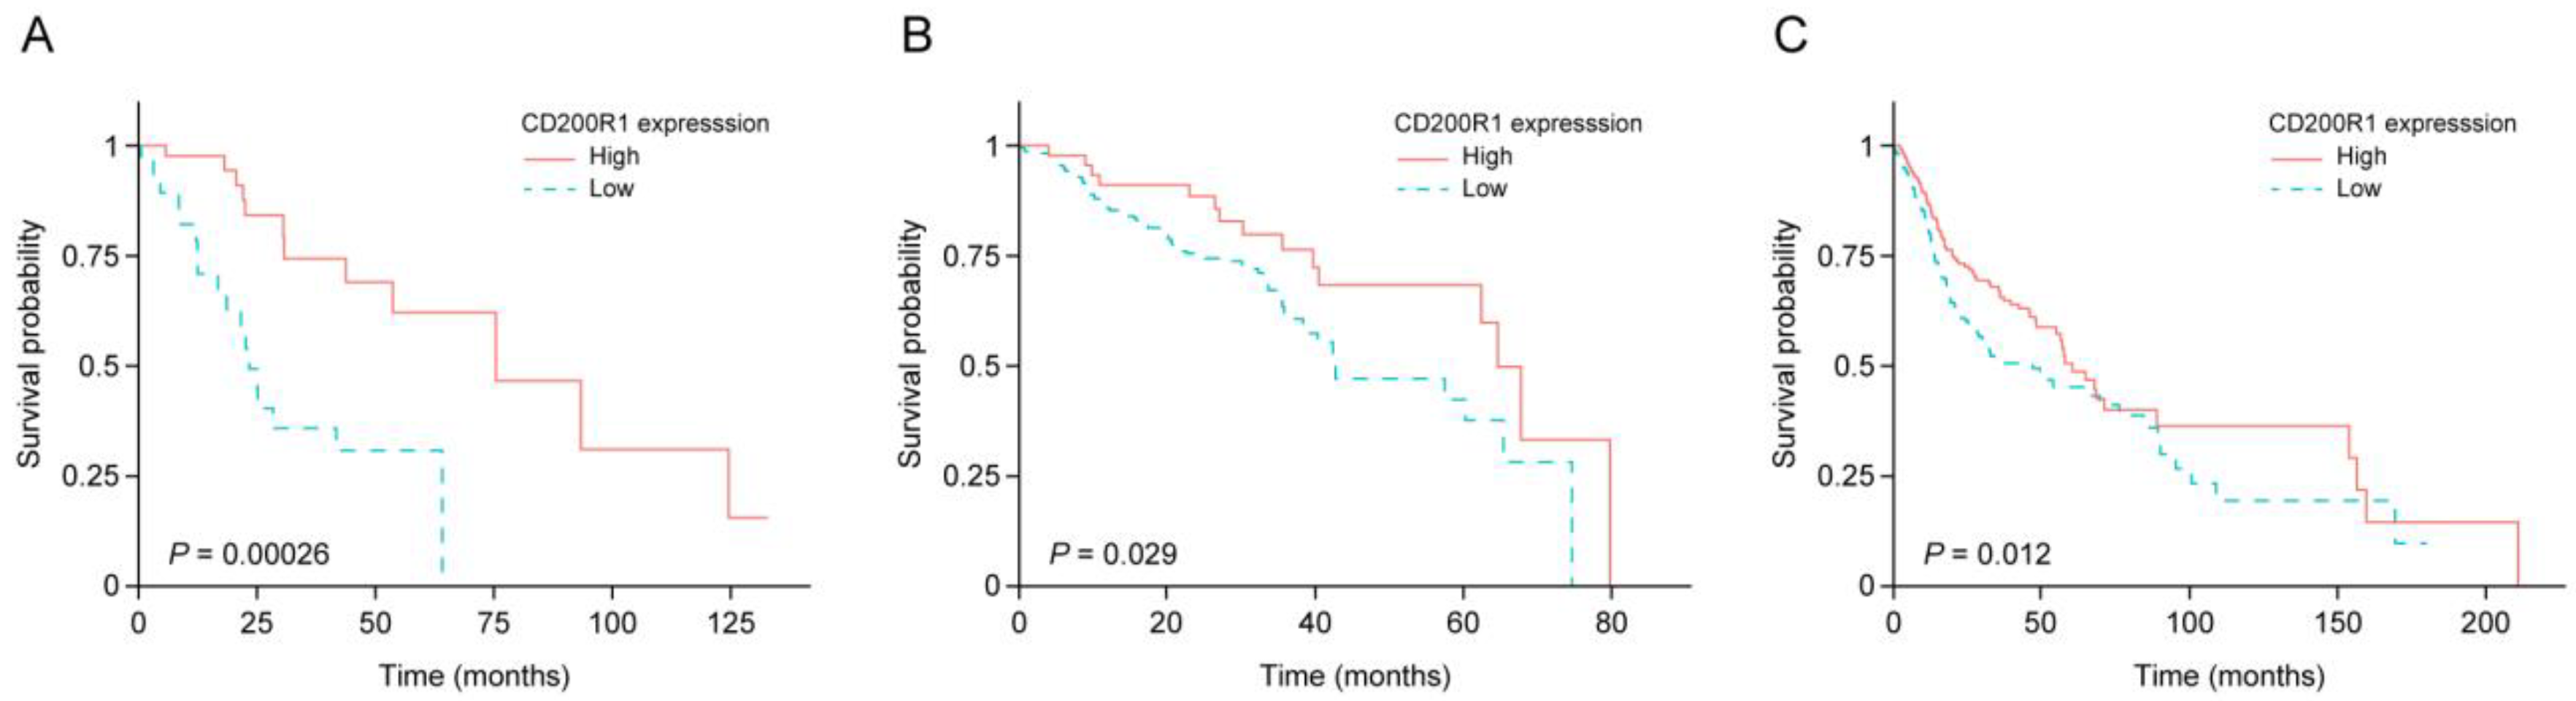
2.2. IRG Expression and Survival of Patients with HNSCC

To determine the relationship between gene expression and prognosis, IRG expression was analyzed using a Nanostring assay and log-rank tests were conducted to evaluate the prognostic effect of IRG mRNA expression on OS (Table S1). Among the 82 IRGs, 47 were significantly correlated with OS (p < 0.05) and underwent regularized Cox regression which identified 12 IRGs as being significantly associated with OS (Coxnet beta ≠ 0). To confirm the prognostic reproducibility and stability of the selected genes, we conducted external validation using TCGA and GEO (GSE65858) HNSCC data. CD200R1 was identified as a significant OS-related factor in the Korean cohort, TCGA, and GEO data (Figure 1).
Next, a Cox proportional-hazard model was used to verify the independent prognostic value of CD200R1 mRNA levels and well-known clinical factors. CD200R1 mRNA expression was found to be an independent predictor of OS in the Korean cohort and TCGA and GEO data after adjusting for clinical features (Table 2). High CD200R1 expression was correlated with longer median survival than low CD200R1 expression in the Korean cohort [median survival 75.5 vs. 23.4 months, hazard ratio (HR): 0.18, (95% confidence interval (CI): 0.05–0.54; p < 0.01), TCGA data (median survival: 60.4 vs. 47.0 months, HR: 0.72, 95% CI: 0.53–0.98; p < 0.05), and GEO data (median survival: 64.6 vs. 42.3 months, HR: 0.52, 95% CI: 0.28–0.94; p < 0.05; Figure 1). These findings demonstrated that CD200R1 expression was an independent prognostic IRG in all three HNSCC cohorts.

2.3. Performance of CD200R1 mRNA Expression as a Biomarker

To assess the prognostic performance of CD200R1, we compared its ability to predict OS with that of other clinical factors using Uno’s C-index and AUC values (Table 3). Compared to the other clinical factors, CD200R1 mRNA expression yielded a higher C-index value for five-year survival in the Korean cohort alongside a higher AUC value, but exhibited similar performance for the GEO and TCGA data. These means that the performance of CD200R1 was compatible with known clinical prognostic factors.

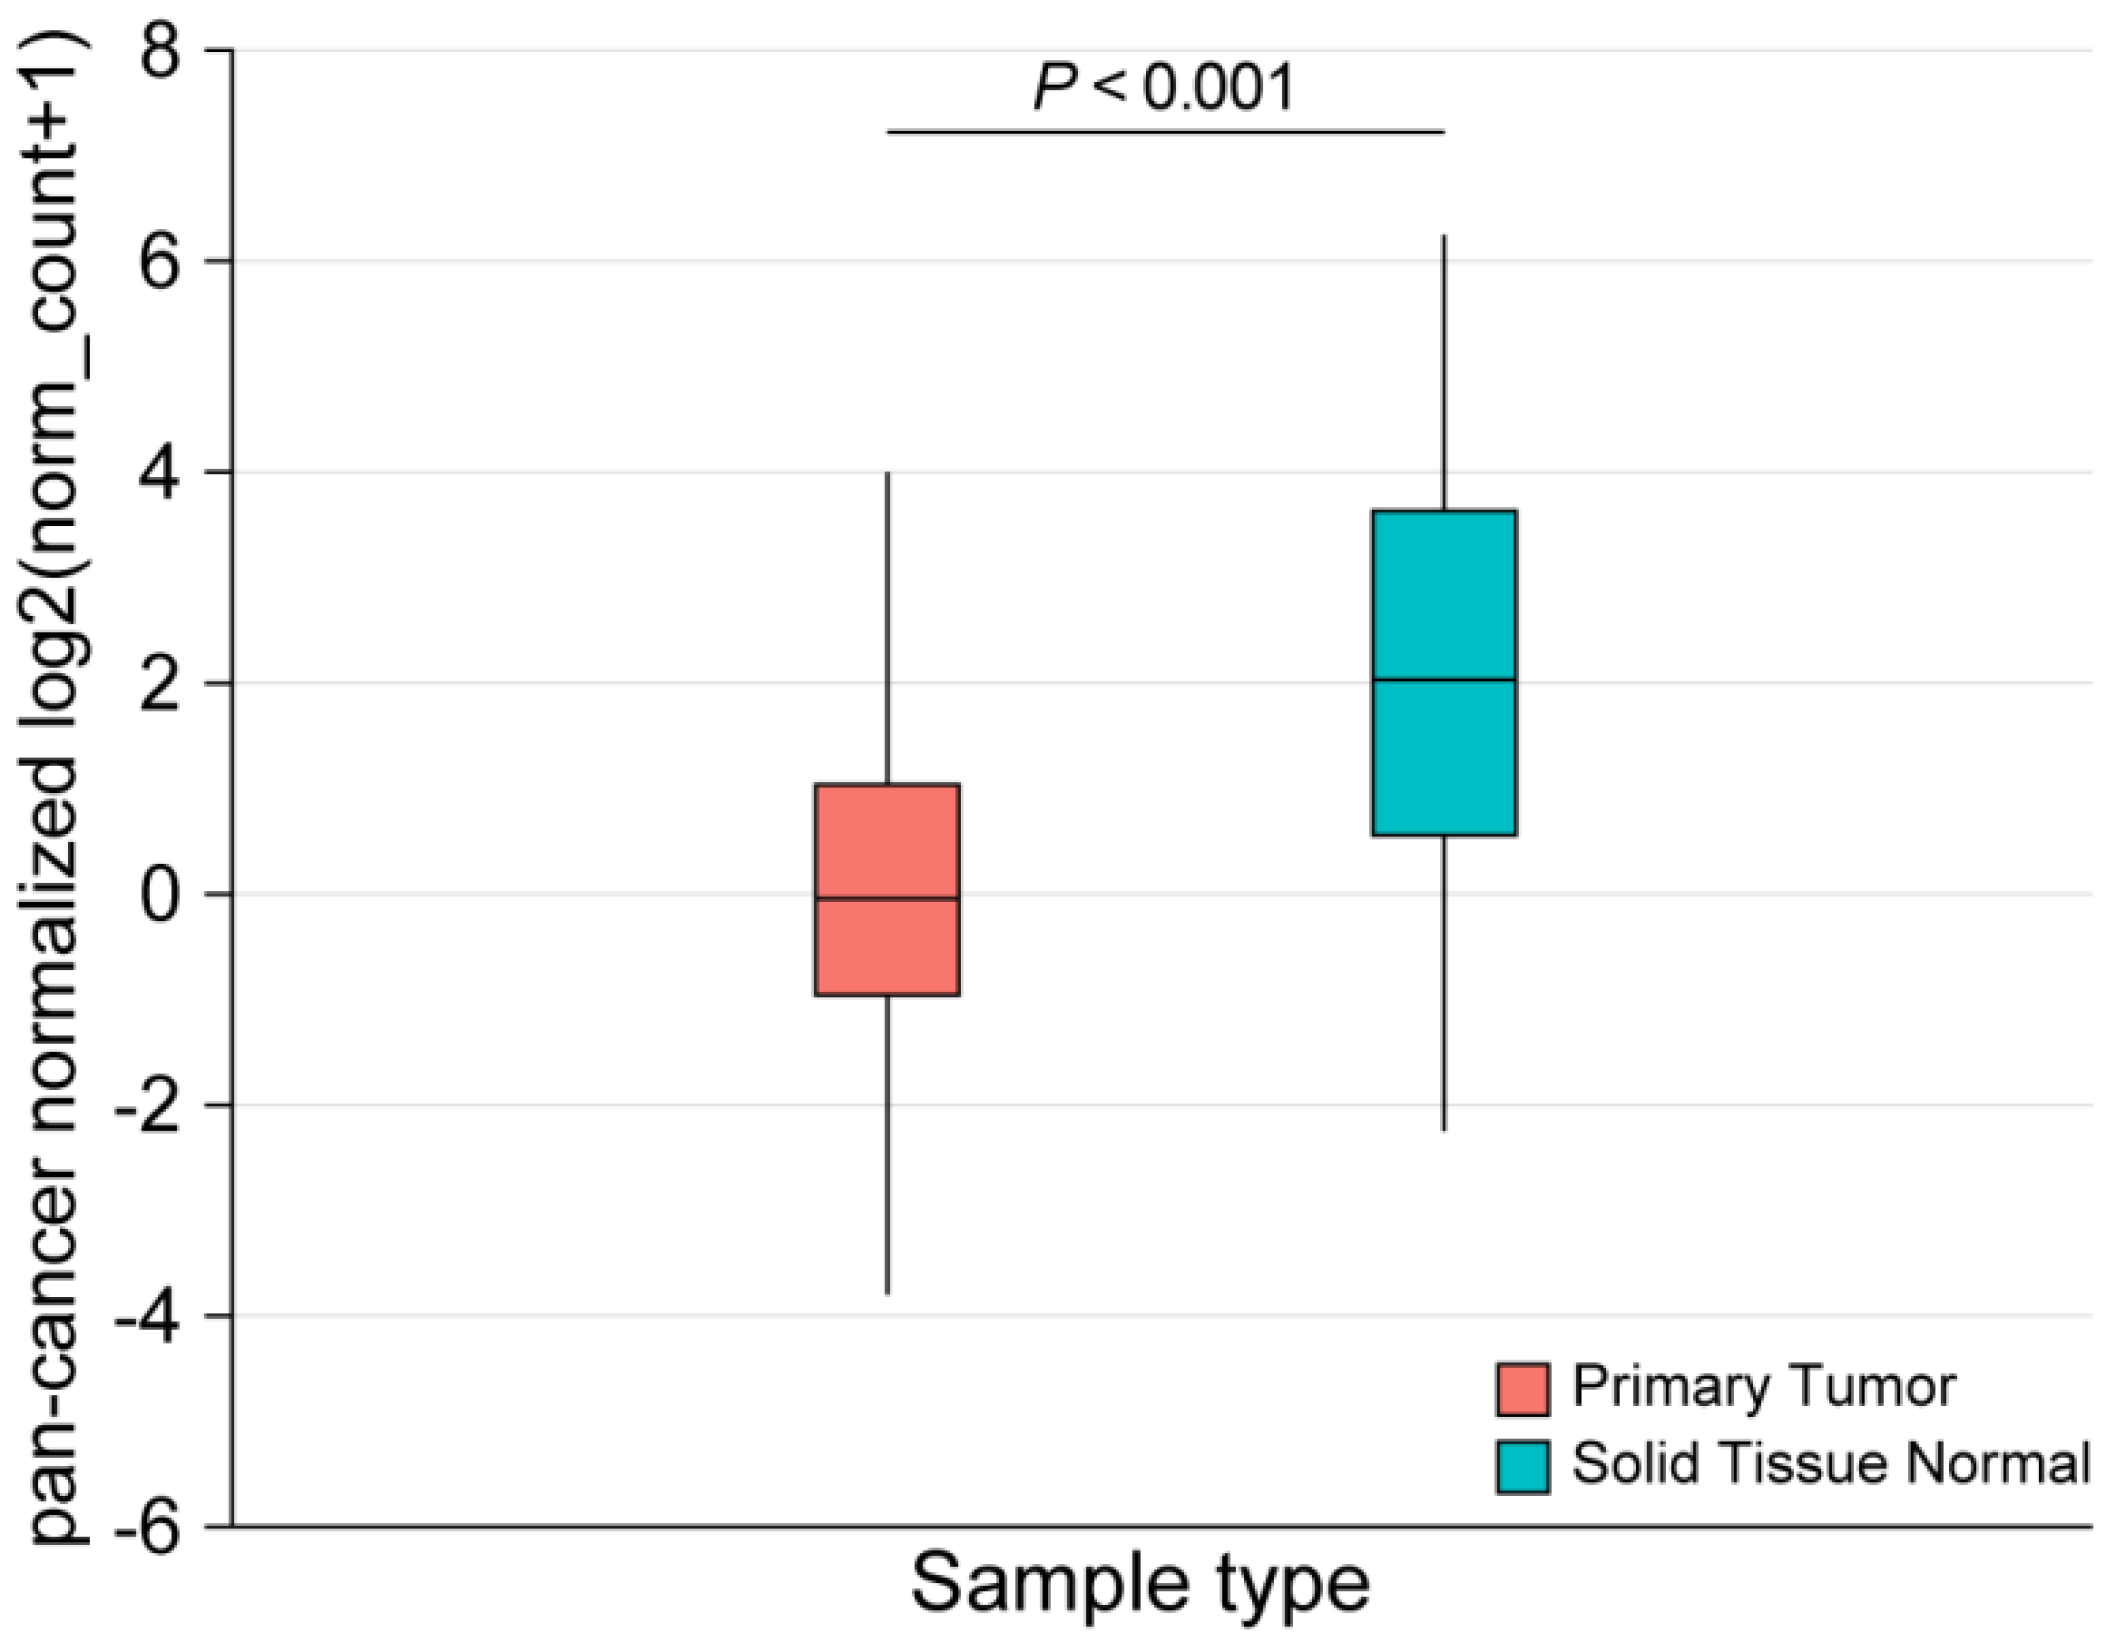
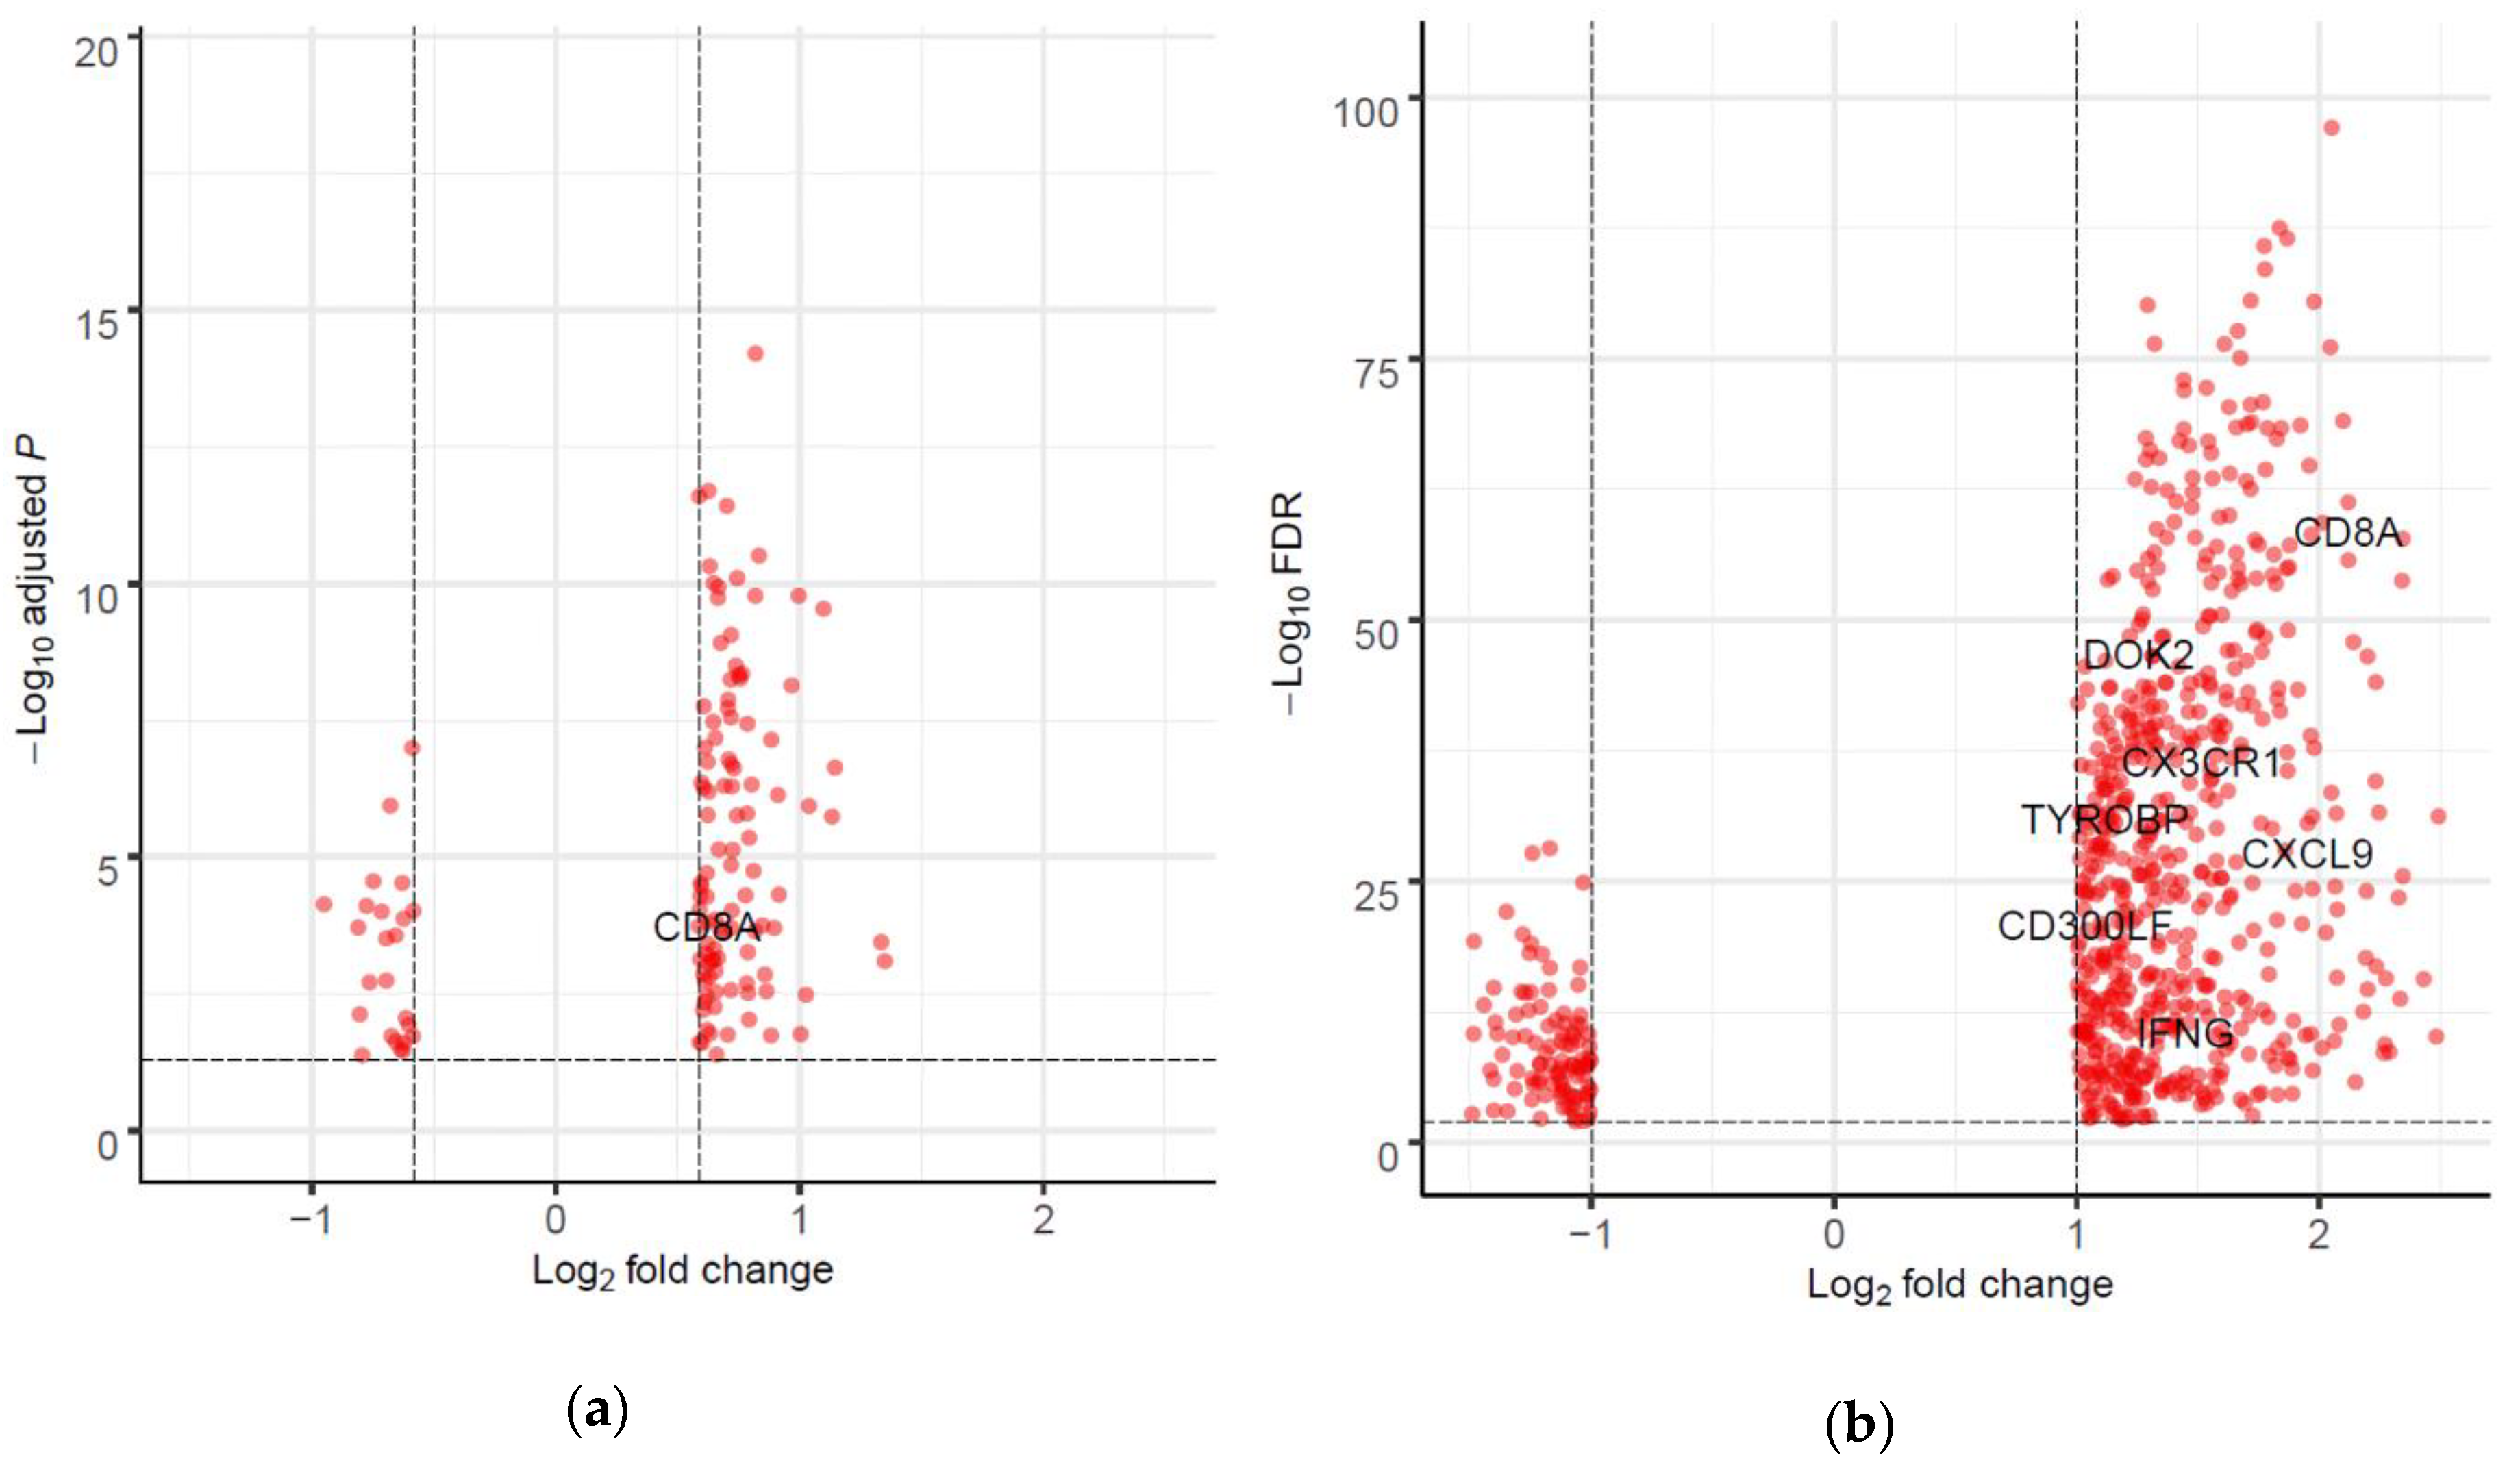
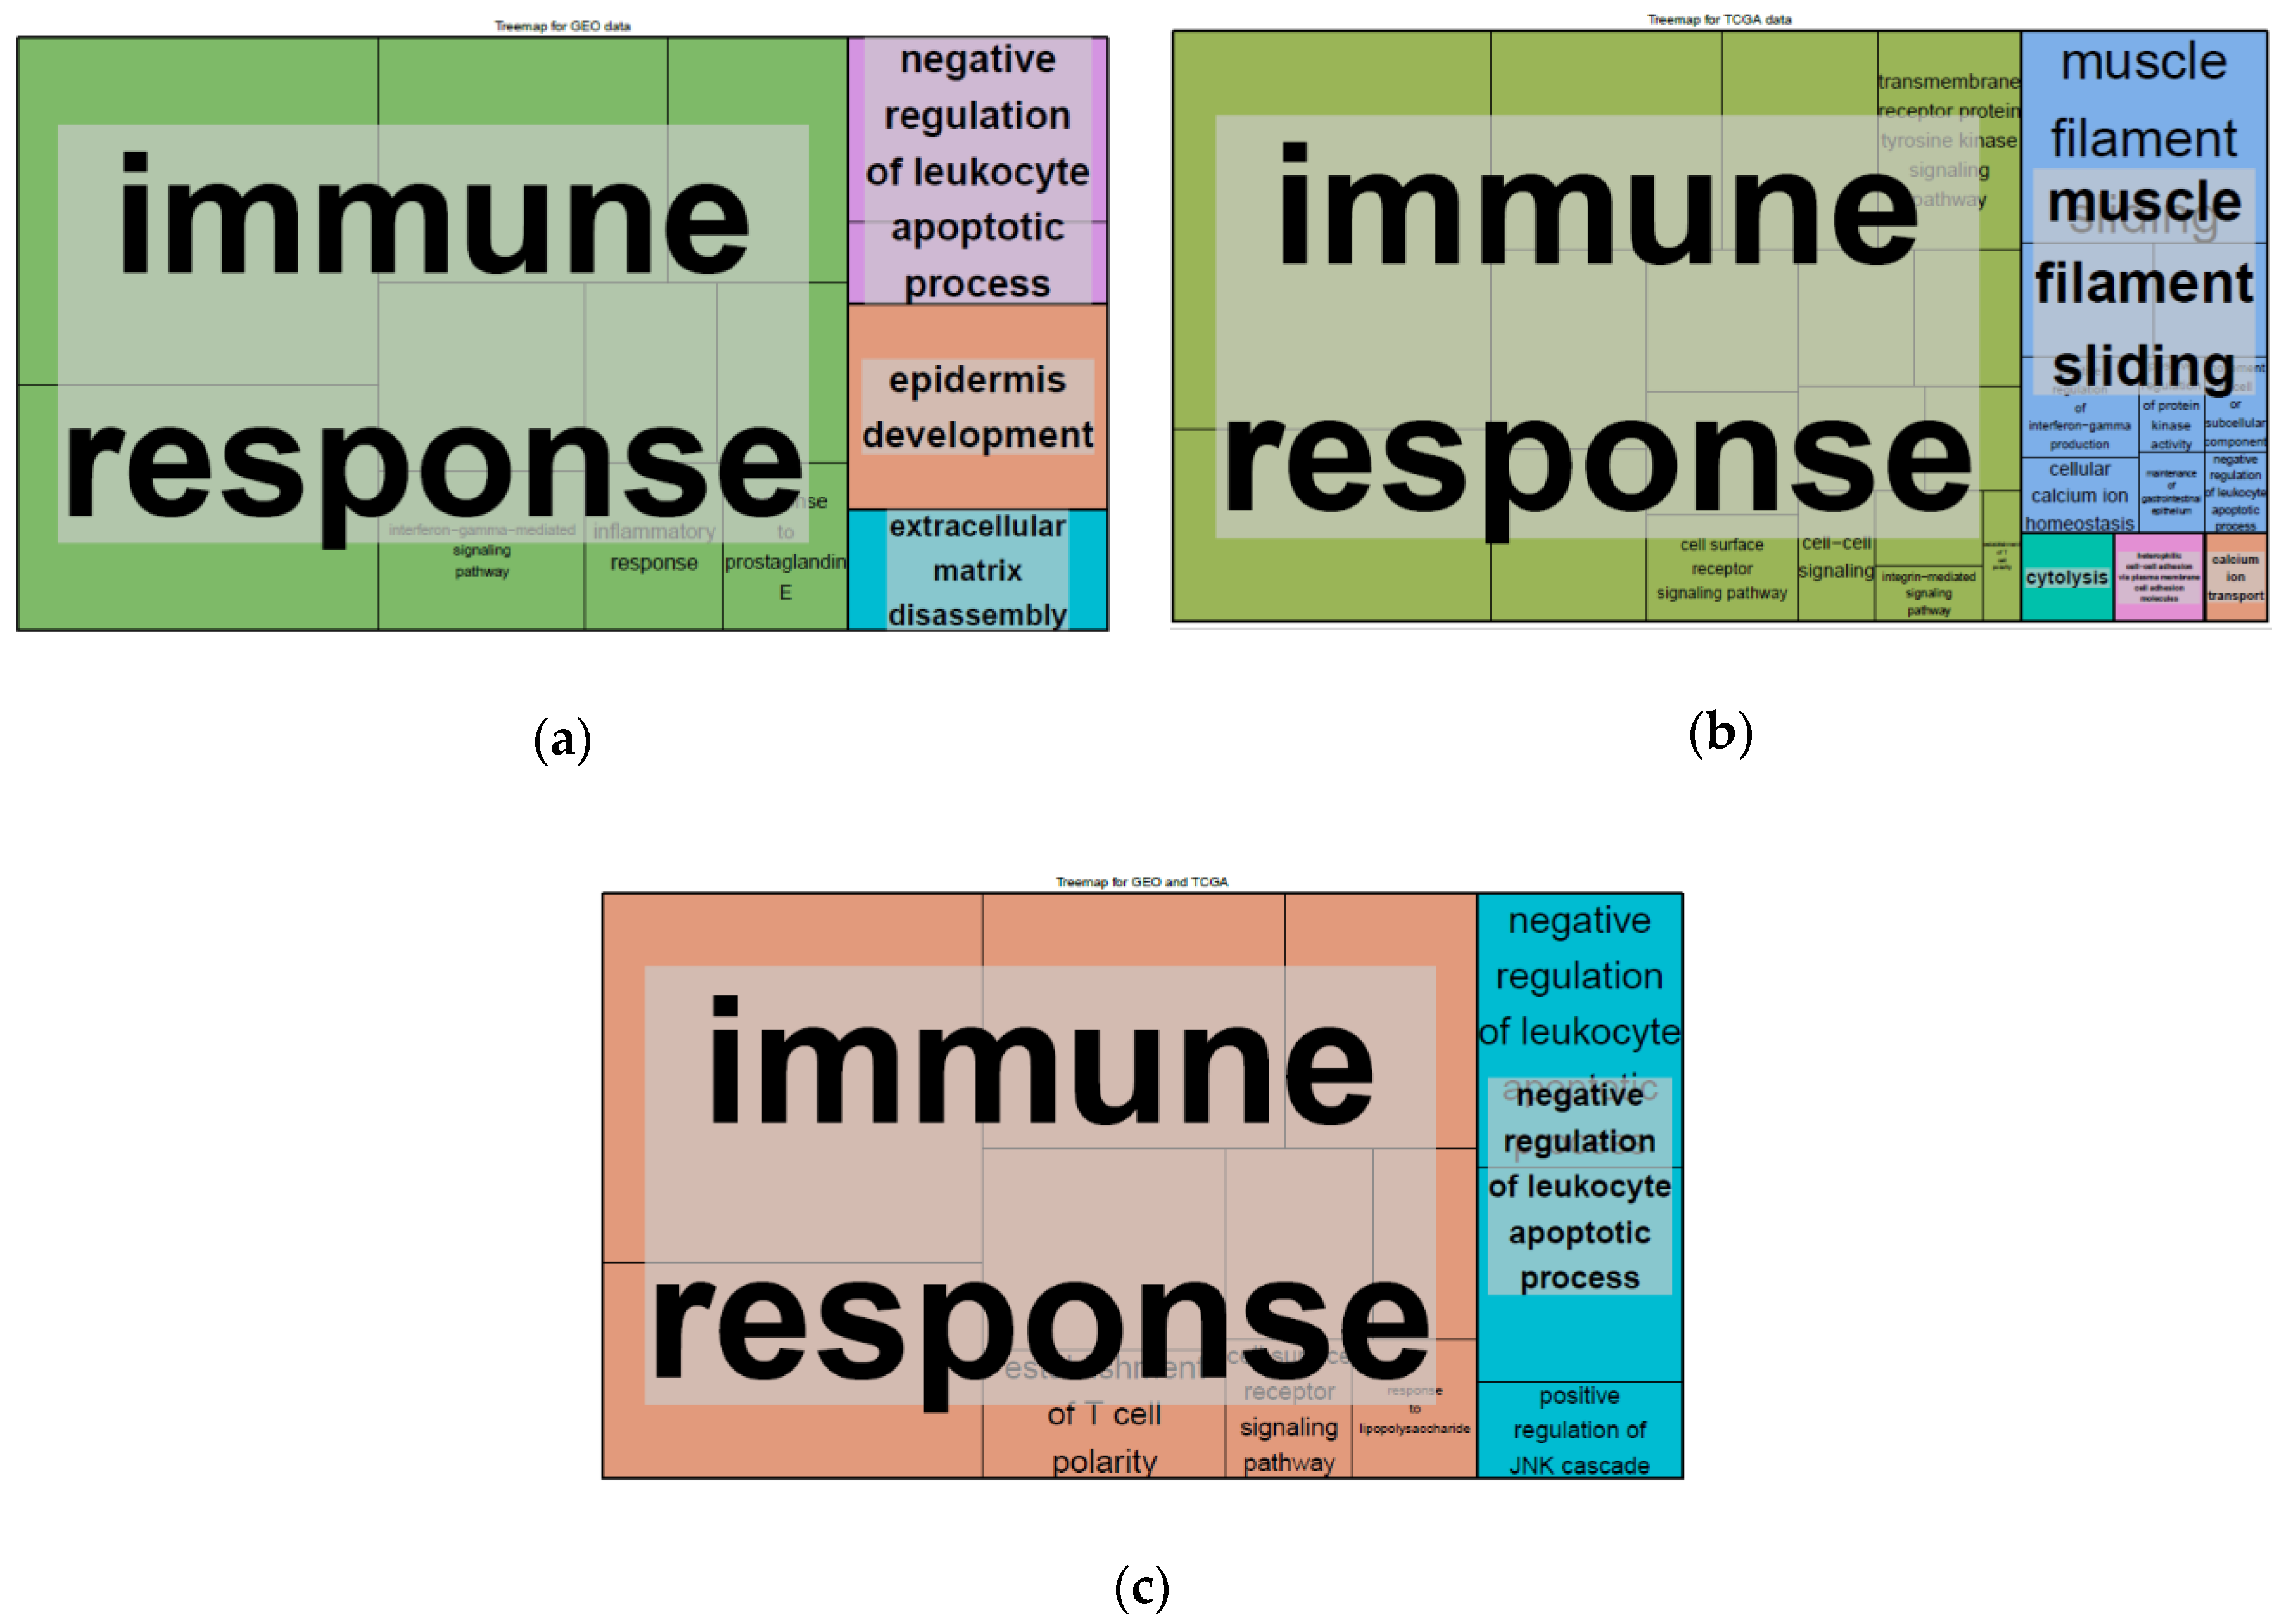
2.4. Differentially Expressed Genes (DEGs) and Gene set Enrichment Analysis

To explore the role of CD200R1 in HNSCC, we determined CD200R1 mRNA expression in normal and tumor tissues in TCGA datasets from the University of California, Santa Cruz Xena platform [14]. Significantly lower CD200R1 expression (Welch’s t-test, p < 0.001) was observed in the tumor tissue than that in normal tissue (Figure 2).
To further elucidate the biological function of CD200R1, we performed differential expression (DE) analysis between tumors with high and low CD200R1 expression from the GEO and TCGA datasets, respectively. A total of 130 genes were identified in the GEO data with a fold change > 1.5 and adjusted p-values of <0.05 using the Benjamini‒Hochberg method (Figure 3a).
To better understand the different underlying biological processes associated with these genes, we performed GO enrichment analysis on the DEGs that met our differential expression criteria in tumors with high and low CD200R1 expression. We identified GO biological process terms, with a Benjamini-Hochberg corrected p-value of <0.05, which were summarized using a REVIGO tree map (Figure 4a and Table S2). The enrichment of biological processes was mainly associated with the immune response and the regulation of leucocyte apoptosis.
In the TCGA data, 800 genes with a fold change > 2.0 and an FDR of <0.01 (Figure 3b) were subjected to GO enrichment analysis. A REVIGO map of these DEGs revealed that the immune response was an important enriched biological process (Figure 4b and Table S2), while REVIGO analysis of 67 common DEGs between the GEO and TCGA data showed that the immune response and negative regulation of leukocyte apoptosis were essential biological processes (Figure 4c and Table S2).

2.5. Interaction between CD200R1 and IRGs

We generated a set of genes known to interact with CD200R1 by searching the STRING database and conducting a literature review [15,16,17]. Seven DEGs (CD8A, DOK2, CX3CR1, TYROBP, CXCL9, CD300LF, IFNG) in the TCGA data and one DEG (CD8A) in GEO were likely to be functionally related to CD200R1 (Figure 3). Of these, CD8A was significantly correlated with CD200R1 expression (Pearson correlation coefficient (r) = 0.20, p < 0.1 for Korean cohort; r = 0.47, p < 0.001 for GEO data; and r = 0.33, p < 0.001 for TCGA data). These suggest that CD200R1 had interactions with other IRGs including CD8A.

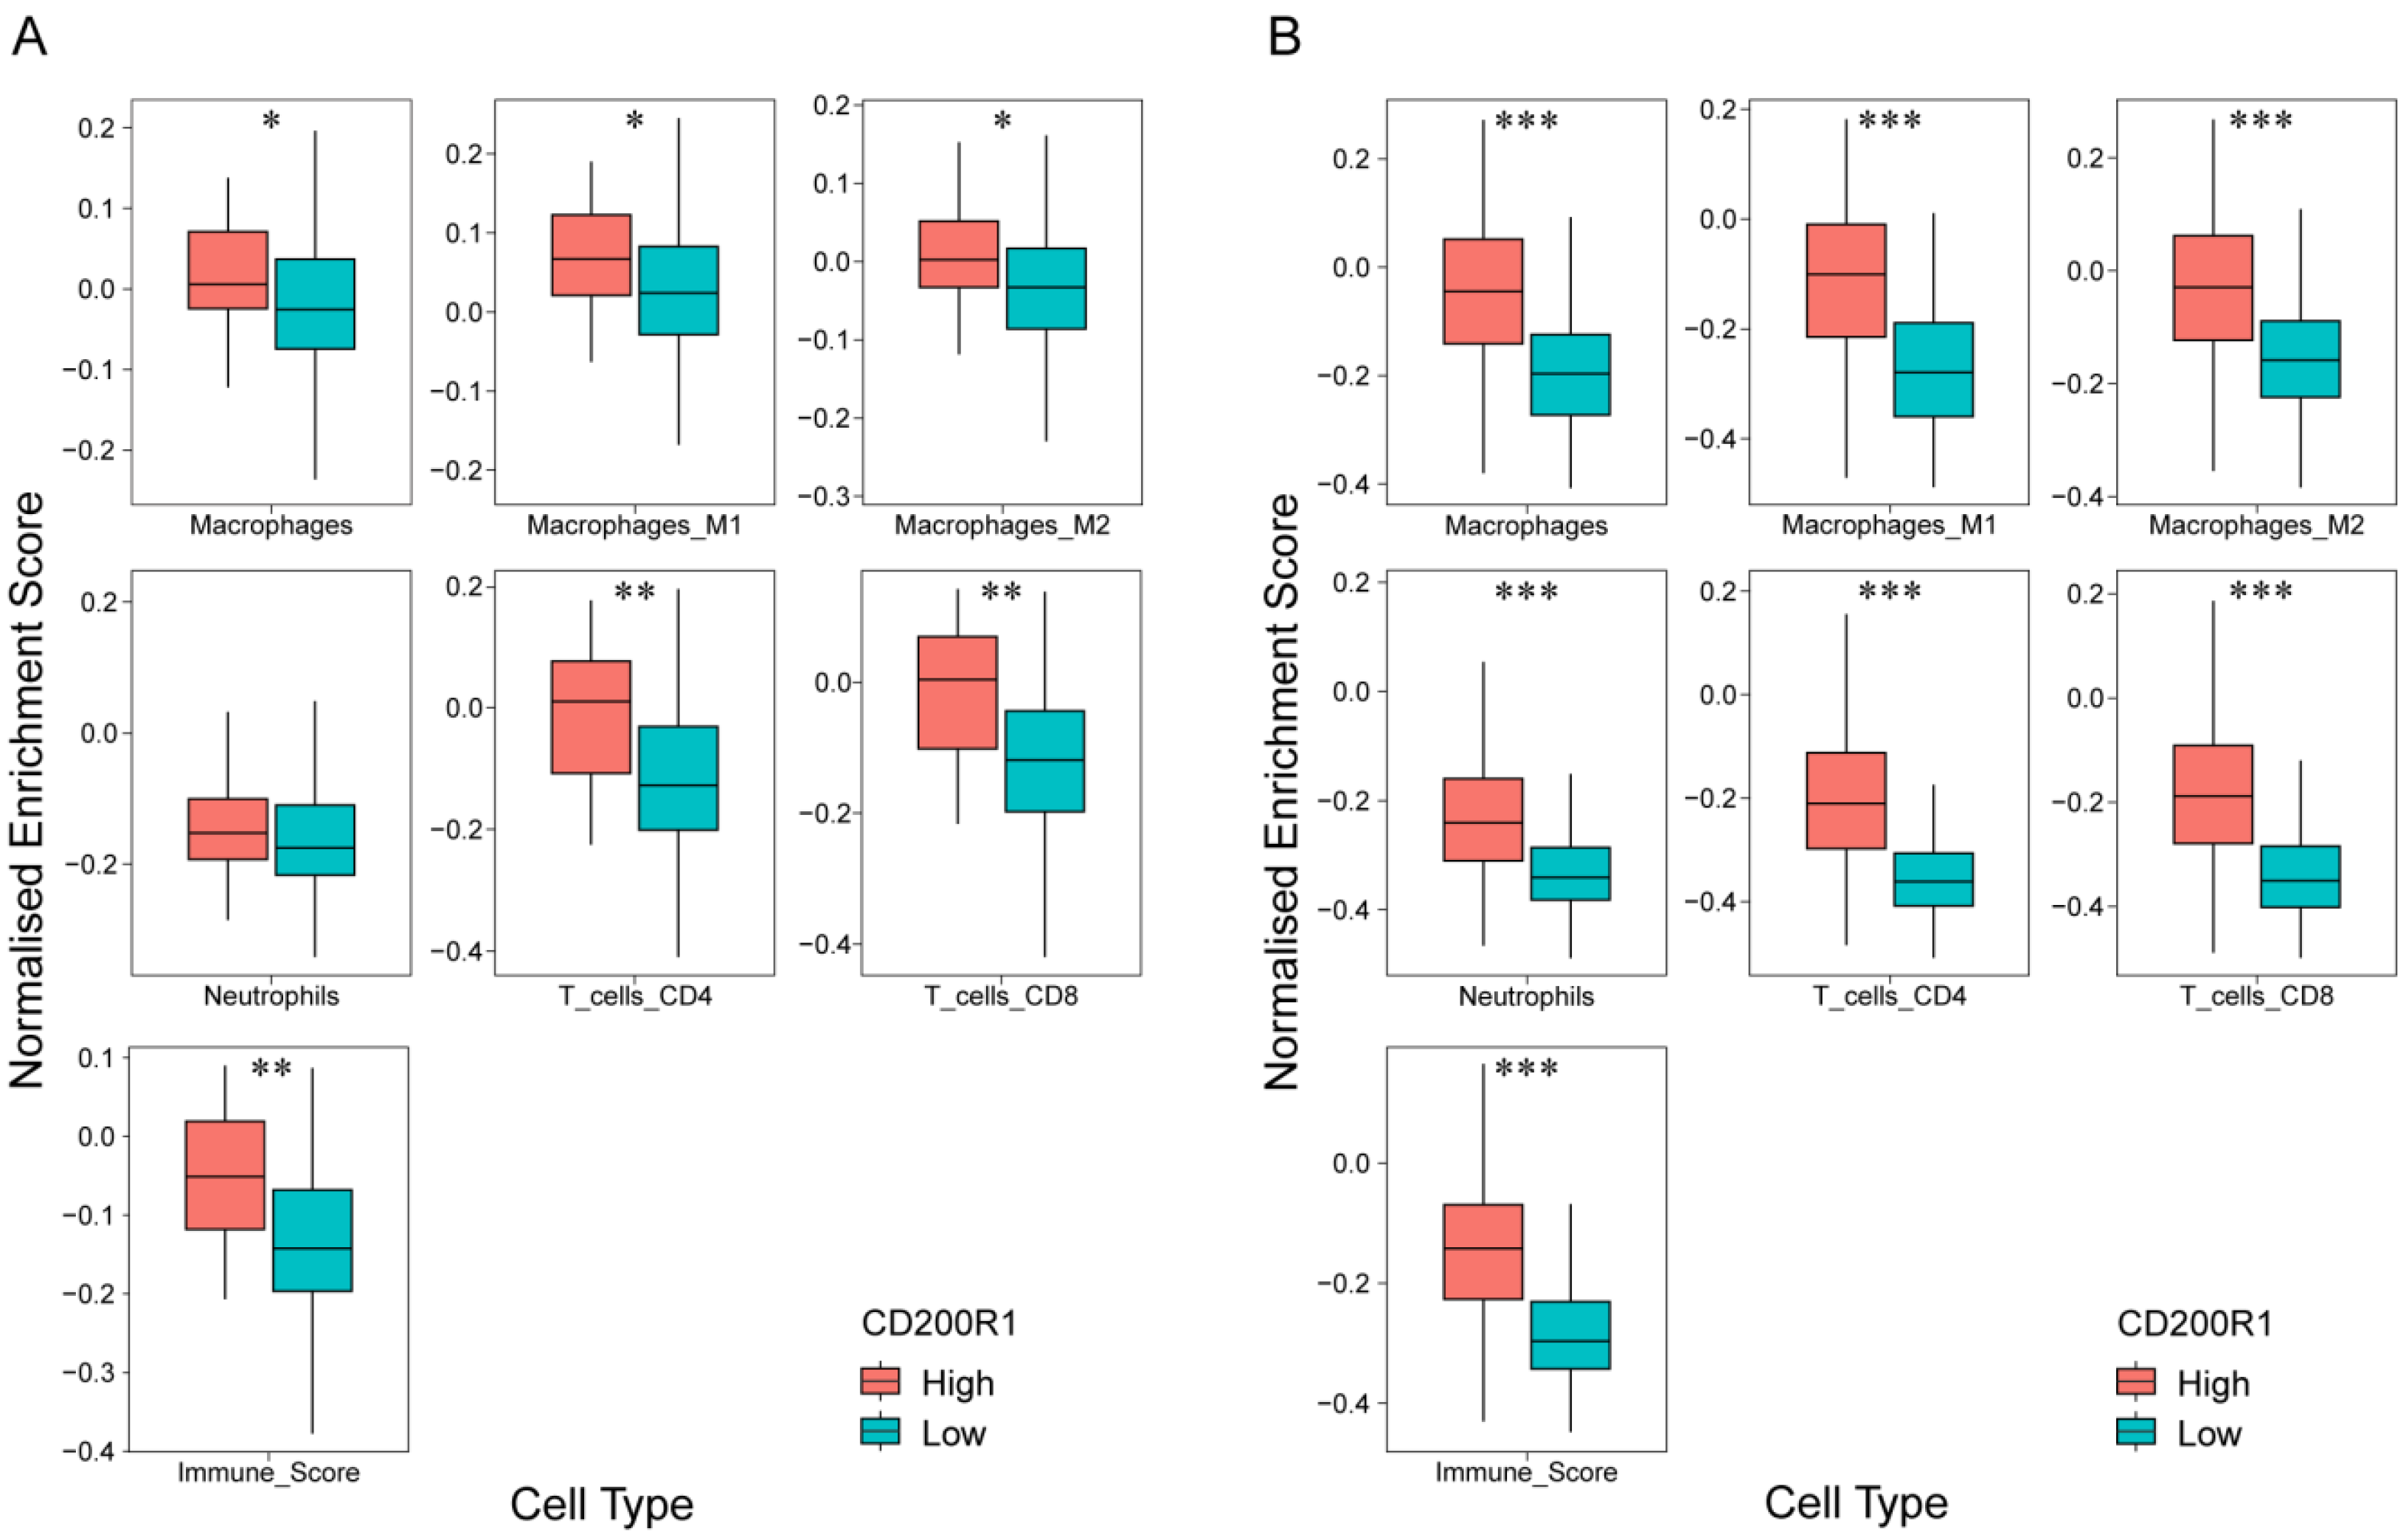
2.6. Correlation of CD200R1 with Immune Cell Signatures

CD200R1 is strongly expressed in macrophages, neutrophils, and other leucocytes such as monocytes and mast cells; therefore, we deconvoluted gene expression in the GEO and TCGA data to estimate microenvironmental composition by ConsensusTME analysis. Significant enrichment in CD8+ and CD4+ T cells was observed in samples with high CD200R1 mRNA expression compared to those with low CD200R1 expression in both the GEO and TCGA datasets (Figure 5). Furthermore, M1 and M2 macrophage scores were significantly higher in samples with high CD200R1 mRNA expression and higher immune scores were observed in tumors with high CD200R1 expression. These indicated that tumors with high CD200R1 expression have a ‘immune-rich’ microenvironment.

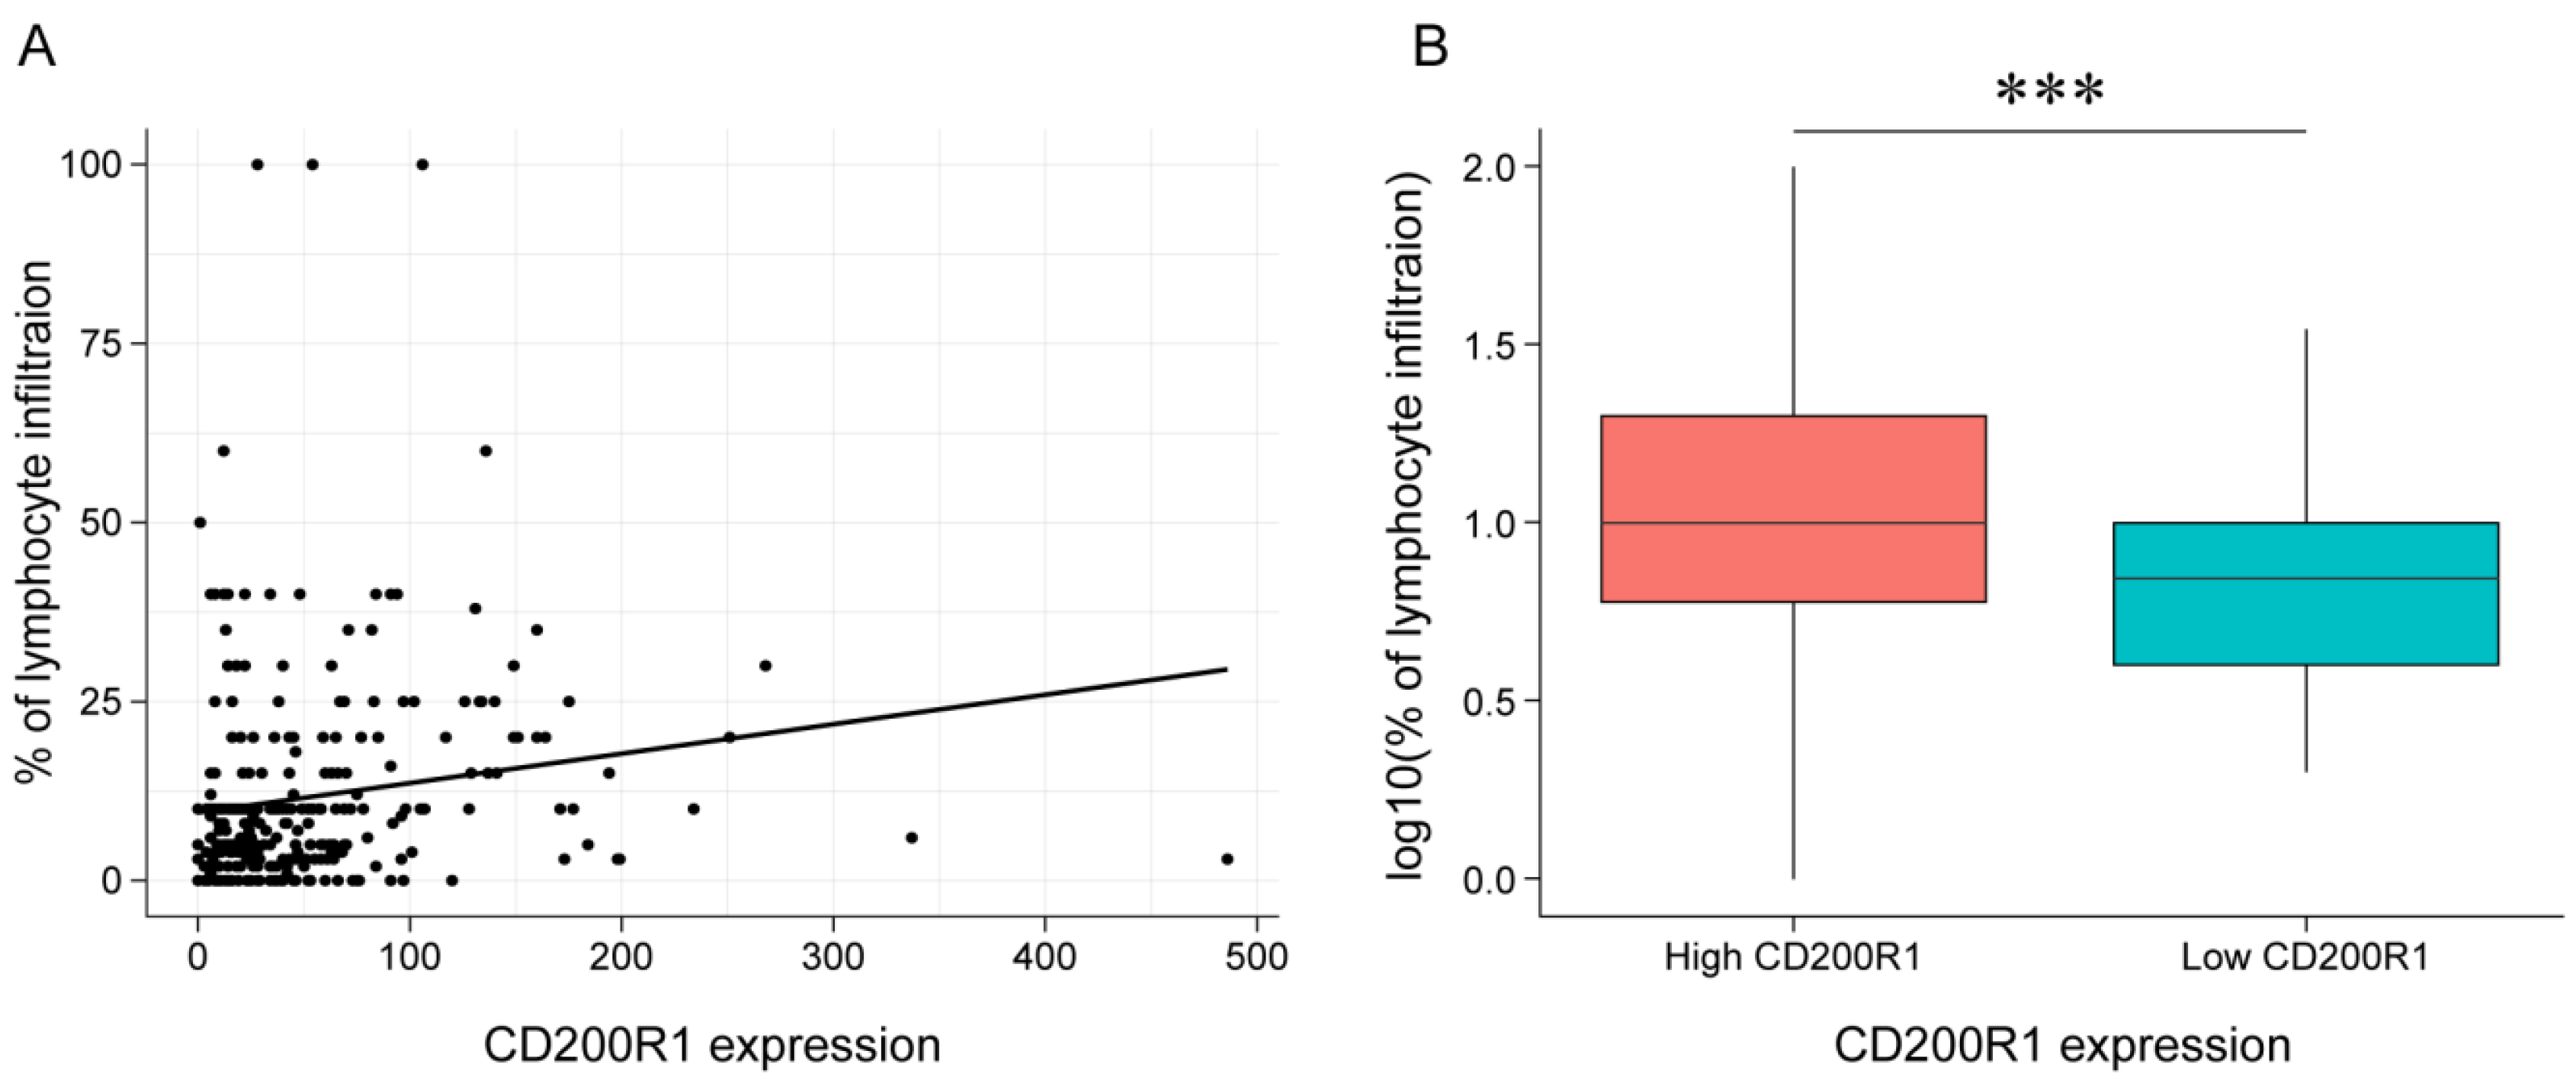
2.7. Association between CD200R1 and Lymphocyte Infiltration

To confirm the association between CD200R1 expression and lymphocyte infiltration in tumor tissue, we examined TCGA patient cohorts with matched histology-based lymphocytes infiltration scores and gene expression data. A clear positive association was found between CD200R1 expression and tissue-based quantitation of lymphocyte infiltrates (r = 0.16; p = 0.003) (Figure 6A), and significantly higher lymphocyte infiltration was detected in samples with high CD200R1 expression than in those with low CD200R1 expression (Welch t-test, p < 1 × 10e−3) (Figure 6B). These demonstrated that HNSCC with high CD200R1 expression were characterized by a microenvironment rich in lymphocytes.

3. Discussion

In this study, we aimed to identify IRG markers to predict the prognosis of patients with HNSCC. CD200R1 was found to be an immune prognostic biomarker in the Korean HNSCC cohort and its predictive significance was systematically validated using the large GEO and TCGA databases. In particular, we demonstrated that patients with HNSCC and high tumor tissue CD200R1 mRNA expression displayed significantly better OS than those with low CD200R1 expression. Multivariate analysis with clinical factors further confirmed that CD200R1 expression was an independent prognostic indicator in all three HNSCC cohorts. To explore the mechanisms of action of CD200R1 in HNSCC, we systematically investigated the GEO and TCGA datasets and found that CD200R1 was positively associated with an enhanced immune response. In silico and histological analyses revealed that samples with high CD200R1 expression contained more tumor-infiltrating immune cells, while cyto-chemokine networks (CX3CR1, CXCL9, IFNG) and immuno-receptor and adaptor proteins (DOK2, TYROBP, CD300LF) were likely to contribute to antitumor cell immunity in tumors with high CD200R1 expression.
Cox regression analysis of CD200R1 expression could improve our understanding of the biological role of CD200R1 in cancer [18,19] as CD200R1 signaling is associated with tumor growth and metastasis [17,20]. CD200R1 deficiency was found to alter the tumor microenvironment (TME), leading to accelerated tumor growth and reduced T cell infiltration and/or effector function, while CD200R1 expression was significantly lower in HNSCC tumors than that in normal tissues. These findings are consistent with a previous study on patients with gastric cancer, which found that the frequencies of CD3+, CD3+/CD4+, and CD3+/CD8+ T cells expressing CD200R1 were lower in the peripheral blood of patients with gastric cancer than that in the healthy control patients [21].
DAVID and REVIGO analyses revealed that DEGs were enriched for the immune response and the negative regulation of leucocyte apoptosis. A previous study using B16 melanoma and J558 plasmacytoma mouse syngeneic models found that CD200 expression could inhibit tumor growth and metastasis by shaping the TME [17,20], while another indicated that CD200R1-deficient mice display accelerated CD200+ B16 melanoma growth [16]. Indeed, the livers of these CD200R1-deficient mice exhibited increased metastatic CD200+ tumor growth which contained higher numbers of CD11b+Ly6C+ myeloid cells, displayed VEGF and HIF1a gene expression with increased angiogenesis, and showed significantly reduced CD4+ and CD8+ T cell infiltration [16]. Together with our results, these studies linking CD200R1 and immune cell infiltration suggest a positive association between CD200R1 expression and the immune response. Immune cell mRNA deconvolution using ConsensusTME showed that tumors with high CD200R1 expression contained more tumor-infiltrating cells such as macrophages and T cells, consistent with the significantly higher histology-based lymphocyte infiltration score observed in samples with high CD200R1 expression. These findings are particularly noteworthy as they were derived from different data types (i.e., mRNA vs. microscopy-based images).
Several potential mechanisms have been associated with CD200R1 and immune responses [17,20,22]. For instance, 4THM breast cancer cell growth and invasion were increased in CR200R1KO mice and decreased in mice over-expressing CD200, with a lack of CD200R1 expression related to decreased CD8+ and CD3+CD25+ T cells [23]. In contrast, CD200 overexpression in CD200 transgenic mice was found to increase tumor-induced IFN-γ and decrease inflammatory cytokine, TNF-α, and IL-6 expression. Moreover, CD200fc, which mimics the effect of CD200, significantly decreased tumor growth and metastasis in a mouse model of breast cancer, increased IFN-γ and decreased IL-6 expression, and time-dependently altered IL-10 and IL-17 levels [22]. In this study, we analyzed genes that are biologically related to CD200R1 using the STRING database and by conducting a literature review. CD8A, DOK2, CX3CR1, TYROBP, CXCL9, CD300LF, and IFNG were identified as significant DEGs between tumor samples with high and low CD200R1 expression.
CX3CR1 expression is observed in monocytes, macrophages, dendritic cells, T cells, and natural killer cells, while CX3CR1 is known to bind to CXCL6 and CXCL8 [24,25]. In addition, CX3CR1 levels have been shown to correlate with the degree of effector CD8+ T cell differentiation and CX3CR1+ cells are the predominant memory T cells in peripheral tissues [26]. CXCL9 is an IFN-γ-inducible chemokine that has been associated with the activation of T helper type 1 immunity in the TME and favorable responses to chemotherapy and immunotherapy in melanoma [27]. Although IFN-γ signaling has diverse biological functions, it is primarily related to host defense and immune regulation, including anti-viral and anti-bacterial defense, anti-tumor functions, cell cycle, apoptosis, inflammation, and innate and acquired immunity [28]. DOK2 encodes docking protein 2 which is preferentially expressed in hematopoietic cells and is involved in the negative regulation of signaling pathways downstream of various immunoreceptors, such as B cell, T cell, Fc, and Toll-like receptors [29]. Moreover, DOK2 can bind to the intracellular domain of CD200R1 and recruit the Ras-GTPase activator protein which is required for inhibition of myeloid cell activation by CD200R1 [30]. TYRO is a protein tyrosine kinase-binding protein encoded by TYROBP that is an immunoreceptor tyrosine-based activation motif (ITAM)-bearing transmembrane adaptor protein, which is expressed in NK cells, granulocytes, monocytes, macrophages, dendritic cells, and mast cells [31]. TYRO signals via the ITAM within its cytoplasmic domain and induces cellular activation characterized by cytokine production, proliferation, and survival in macrophages and antigen presentation, maturation, and survival in dendritic cells [32]. Finally, CMRF35-like molecule 1, encoded by CD300LF, acts as an inhibitory receptor in myeloid cells and mast cells [33], with anti-human CMRF35-like molecule 1 antibodies displaying complement- and antibody-dependent cell cytotoxicity against CMRF35-like molecule 1-expressing AML-derived cell lines and freshly isolated blasts from AML patients in vitro [34].
Collectively the associations between CD200R1 and these diverse immune-related proteins suggest that CD200R1 is involved in a variety of immune mechanisms and may explain why HNSCC with high CD200R1 expression is related to an ‘immune-rich’ microenvironment with high immune cell estimates. Thus, our findings suggest that modulation of the CD200R1 pathway could be used as an immunotherapeutic strategy in patients with HNSCC [22,35,36].

4. Materials and Methods

4.1. Patients and Data Collection

We analyzed 71 patients with HNSCC enrolled in a feasibility study for a prospective HNSCC biomarker-driven umbrella trial (Korean Cancer Study Group TRIUMPH study, NCT03292250). The data collection methods have been described previously [37]. Briefly, pretreatment tumor tissues and matched normal DNA were obtained from retrospectively recruited patients with HNSCC between 2016 and 2017 through the approval of the Institutional Review Boards of 19 institutions in the Republic of Korea. Clinicopathological data were collected from the electrical medical records of the patients in accordance with an IRB-approved protocol (NCT03292250); these included age, sex, the anatomic site of the tumor, tobacco and alcohol use, clinical stage based on the American Joint Committee on Cancer (AJCC) 7th edition, treatment history, and survival data. All patients provided written informed consent for the genomic testing conducted for this study.

4.2. Nanostring Assay

Briefly, total tumor RNA was isolated using an RNeasy kit (Qiagen, Valencia, CA, USA) [37]. NanoString nCounter assays were performed according to the manufacturer’s standard protocol and raw data were normalized using nSolver Analysis Software version 4.0 (NanoString Technologies, Seattle, WA, USA) and log2-transformed for further analysis. Twenty-two samples with normalization flags were removed prior to final analysis. The remaining 71 samples were finally included in the present analysis. The complete list of 82 IRGs is shown in Table S1.

4.3. TCGA and GEO Data Analysis

mRNA expression and clinical data were downloaded from TCGA HNSCC database in January 2019 [38,39] and analyzed using R statistical software with the cgdsr package. The comparison of CD200R1 mRNA expression between tumor and normal tissues were analyzed by using the UCSC Xena browser (http://xena.ucsc.edu/) [14]. The GSE65858 dataset analyzed using, Illumina HumanHT-12 V4.0 Expression Beadchips (Illumina, San Diego, CA, USA) included 270 HNSCC tumor samples with clinical and prognostic variables and was downloaded from the GEO database (www.ncbi.nlm.nih.gov/geo/) using the GEOquery R package in January 2019 [40,41].

4.4. Statistical Methods

Statistical evaluation is summarized in Figure S1. In the training phase with the Korean cohort, the Kaplan‒Meier method with log-rank test was used for OS analysis to elucidate IRG expression. OS was measured from the date of diagnosis until the date of death from any cause, excluding patients who were alive at their last follow-up. Patients were divided into low- and high-expression groups using optimal cut-off points for IRG expression determined using R software with the MaxStat package, which computes the maximal log-rank statistic to identify the cutoff that provides the best separation (i.e., where standardized statistics are maximal) [42]. Kaplan‒Meier analysis was performed to estimate the survival curves of the low- and high-expression groups of each IRG and the log-rank test was used to compare the two curves. To narrow down the candidate genes, IRGs with p-values of < 0.05 from the log-rank test were selected for regularized Cox regression, which is a well-established method for selecting the most predictive markers for time-to-event analysis [43].
During the validation phase, the IRGs selected by regularized Cox regression were analyzed with GEO (GSE65858) and TCGA HNSCC data using the Kaplan‒Meier method and log-rank test. IRG cut-off points were calculated with maximally selected rank statistics using MaxStat, and the significantly validated IRGs were evaluated by multivariate Cox regression analysis to compare the effects of IRG expression and well-known clinical variables on prognosis.
Two methods were used to evaluate biomarker performance: Uno’s C-index in time-dependent area under the curve (AUC) analysis; AUC values in receiver operating characteristic curves at the five-year mark [44]. These values were obtained using the R packages survC1 and epiDisplay.

4.5. DEG Screening and Analysis

To identify DEGs associated with the selected IRGs, patients were divided into groups based on CD200R1 mRNA expression (high and low). DEGs in the TCGA data were determined using the R package TCGAbiolinks with the R/Bioconductor package edgeR [45,46]. DEGs were selected in the GEO data using the R/Bioconductor limma package [47,48]. Adjusted p-values for multiple testing were calculated using Benjamini-Hochberg correction.
The GO term enrichment analysis of subnetwork genes was carried out using DAVID Bioinformatics Resources 6.818 [49] along with the results of the GOTERM_BP_DIRECT approach with a Benjamini adjusted p-value of 0.05 or less. GO terms were summarized using REVIGO (available at http://revigo.irb.hr), excluding redundant GO terms and visualizing the remaining terms in a tree map. The p-values of the enriched GO terms were used to determine the size of tree maps.
PPI network analysis was conducted using the STRING database (http://string-db.org/) to identify proteins related to those encoded by the selected IRGs [15].

4.6. Immune Cell Analysis with In Silico Deconvolution and Microscopic Examination

The ConsensusTME method integrates cell type-specific gene markers from independent TME cell estimation methods, and uses single sample Gene Set Enrichment Analysis (ssGSEA) to compute relative TME cell type- and tumor-specific enrichment scores from bulk expression data [50]. This method has previously been thoroughly benchmarked in a pan-cancer setting. Normalized enrichment scores (NSE) for each cell type in each sample in the GEO (GSE65858) and TCGA HNSCC datasets were calculated with gene sets specific for human head and neck carcinoma. Histology-based lymphocyte infiltration scores were obtained as a percentage of the tumor from TCGA via the Genomic Data Commons (https://gdc.cancer.gov/).

5. Conclusions

This study had some limitations. Firstly, the patient population was heterogeneous due to the retrospective nature of this study. Secondly, training phase analysis was performed using a Nanostring panel encompassing selected key genes expressed in the TME. As the TME contains various immune system components, HNSCC prognosis cannot be absolutely defined by a single factor, resulting in the relatively low performance (C-index) of CD200R1 and other clinical factors in our study. Nevertheless, CD200R1 expression was confirmed to be a robust and independent prognostic factor by multivariate analysis, alongside several other clinical characteristics in the Korean, GEO, and TCGA cohorts. Further studies that analyze the prospectively-collected tissue samples with large patient numbers are required to validate our results. In conclusion, our findings suggest that CD200R1 mRNA expression is an independent favorable prognostic factor in HNSCC. This information increases our understanding of the molecular biology of HNSCC and may allow the development of tools to more accurately predict patient prognosis. In addition, our study indicates that CD200R1 may be a potential immunotherapeutic target for HNSCC.

Supplementary Materials

The following are available online at https://www.mdpi.com/2072-6694/12/7/1777/s1, Figure S1: Study Scheme, Table S1: List of immune-related genes, Table S2: GO terms for GEO, TCGA, and common terms in both datasets.

Author Contributions

Conceptualization, H.C.; methodology, H.C.; software, H.C.; validation, H.C.; Y.-G.L. and H.R.K.; formal analysis, H.C.; investigation, H.C.; resources, H.C.; Y.-G.L.; Y.H.K., J.H.C.; J.-K.C.; K.U.P.; E.J.K.; K.-W.L.; S.M.L.; J.-S.K., H.W.L.; M.K.K.; I.G.H.; S.K.; B.-H.N.; H.R.K.; data curation, Y.-G.L.; writing—original draft preparation, H.C.; writing—review and editing, H.C.; Y.-G.L.; H.R.K.; Y.H.K., J.H.C.; J.-K.C.; K.U.P.; E.J.K.; K.-W.L.; S.M.L.; J.-S.K., H.W.L.; M.K.K.; I.G.H.; S.K.; B.-H.N.; visualization, H.C.; supervision, H.R.K.; project administration, H.R.K.; funding acquisition, H.R.K. All authors have read and agreed to the published version of the manuscript.

Funding

This research was funded by the National R&D Program for Cancer Control, Ministry of Health and Welfare, Republic of Korea, grant number HA16C0015.

Acknowledgments

The authors thank Medical Illustration & Design, for providing excellent support with medical illustration, and Chan Hee Park for his technical assistance.

Conflicts of Interest

The authors declare no conflict of interest.

References

  1. Siegel, R.L.; Miller, K.D.; Jemal, A. Cancer statistics, 2018. CA Cancer J. Clin. 2018, 68, 7–30. [Google Scholar] [CrossRef] [PubMed]
  2. Bray, F.; Ferlay, J.; Soerjomataram, I.; Siegel, R.L.; Torre, L.A.; Jemal, A. Global cancer statistics 2018: Globocan estimates of incidence and mortality worldwide for 36 cancers in 185 countries. CA Cancer J. Clin. 2018, 68, 394–424. [Google Scholar] [CrossRef] [PubMed] [Green Version]
  3. Miller, K.D.; Siegel, R.L.; Lin, C.C.; Mariotto, A.B.; Kramer, J.L.; Rowland, J.H.; Stein, K.D.; Alteri, R.; Jemal, A. Cancer treatment and survivorship statistics, 2016. CA Cancer J. Clin. 2016, 66, 271–289. [Google Scholar] [CrossRef] [Green Version]
  4. Kang, H.; Kiess, A.; Chung, C.H. Emerging biomarkers in head and neck cancer in the era of genomics. Nat. Rev. Clin. Oncol. 2015, 12, 11–26. [Google Scholar] [CrossRef] [PubMed]
  5. Mirza, A.H.; Thomas, G.; Ottensmeier, C.H.; King, E.V. Importance of the immune system in head and neck cancer. Head Neck 2019, 41, 2789–2800. [Google Scholar] [CrossRef] [PubMed]
  6. Almangush, A.; Heikkinen, I.; Makitie, A.A.; Coletta, R.D.; Laara, E.; Leivo, I.; Salo, T. Prognostic biomarkers for oral tongue squamous cell carcinoma: A systematic review and meta-analysis. Br. J. Cancer 2017, 117, 856–866. [Google Scholar] [CrossRef] [Green Version]
  7. Kerrebijn, J.D.; Balm, A.J.; Knegt, P.P.; Meeuwis, C.A.; Drexhage, H.A. Macrophage and dendritic cell infiltration in head and neck squamous-cell carcinoma; an immunohistochemical study. Cancer Immunol. Immunother. 1994, 38, 31–37. [Google Scholar] [CrossRef]
  8. Ferris, R.L.; Blumenschein, G., Jr.; Fayette, J.; Guigay, J.; Colevas, A.D.; Licitra, L.; Harrington, K.; Kasper, S.; Vokes, E.E.; Even, C.; et al. Nivolumab for recurrent squamous-cell carcinoma of the head and neck. N. Engl. J. Med. 2016, 375, 1856–1867. [Google Scholar] [CrossRef]
  9. Seiwert, T.Y.; Burtness, B.; Mehra, R.; Weiss, J.; Berger, R.; Eder, J.P.; Heath, K.; McClanahan, T.; Lunceford, J.; Gause, C.; et al. Safety and clinical activity of pembrolizumab for treatment of recurrent or metastatic squamous cell carcinoma of the head and neck (keynote-012): An open-label, multicentre, phase 1b trial. Lancet Oncol. 2016, 17, 956–965. [Google Scholar] [CrossRef]
  10. Wansom, D.; Light, E.; Worden, F.; Prince, M.; Urba, S.; Chepeha, D.B.; Cordell, K.; Eisbruch, A.; Taylor, J.; D’Silva, N.; et al. Correlation of cellular immunity with human papillomavirus 16 status and outcome in patients with advanced oropharyngeal cancer. Arch. Otolaryngol. Head Neck Surg. 2010, 136, 1267–1273. [Google Scholar] [CrossRef] [Green Version]
  11. Spector, M.E.; Bellile, E.; Amlani, L.; Zarins, K.; Smith, J.; Brenner, J.C.; Rozek, L.; Nguyen, A.; Thomas, D.; McHugh, J.B.; et al. Prognostic value of tumor-infiltrating lymphocytes in head and neck squamous cell carcinoma. JAMA Otolaryngol Head Neck Surg. 2019. [Google Scholar] [CrossRef] [PubMed]
  12. Hu, Y.; He, M.Y.; Zhu, L.F.; Yang, C.C.; Zhou, M.L.; Wang, Q.; Zhang, W.; Zheng, Y.Y.; Wang, D.M.; Xu, Z.Q.; et al. Tumor-associated macrophages correlate with the clinicopathological features and poor outcomes via inducing epithelial to mesenchymal transition in oral squamous cell carcinoma. J. Exp. Clin. Cancer Res. 2016, 35, 12. [Google Scholar] [CrossRef] [PubMed] [Green Version]
  13. Kim, K.; Park, S.; Park, S.Y.; Kim, G.; Park, S.M.; Cho, J.-W.; Kim, D.H.; Park, Y.M.; Koh, Y.W.; Kim, H.R.; et al. Single-cell transcriptome analysis reveals tox as a promoting factor for t cell exhaustion and a predictor for anti-pd-1 responses in human cancer. Genome Med. 2020, 12, 22. [Google Scholar] [CrossRef] [PubMed] [Green Version]
  14. Goldman, M.; Craft, B.; Hastie, M.; Repečka, K.; McDade, F.; Kamath, A.; Banerjee, A.; Luo, Y.; Rogers, D.; Brooks, A.N.; et al. The ucsc xena platform for public and private cancer genomics data visualization and interpretation. bioRxiv 2019. [Google Scholar] [CrossRef] [Green Version]
  15. Von Mering, C.; Huynen, M.; Jaeggi, D.; Schmidt, S.; Bork, P.; Snel, B. String: A database of predicted functional associations between proteins. Nucleic Acids Res. 2003, 31, 258–261. [Google Scholar] [CrossRef]
  16. Liu, J.Q.; Talebian, F.; Wu, L.; Liu, Z.; Li, M.S.; Wu, L.; Zhu, J.; Markowitz, J.; Carson, W.E., 3rd; Basu, S.; et al. A critical role for cd200r signaling in limiting the growth and metastasis of cd200+ melanoma. J. Immunol. 2016, 197, 1489–1497. [Google Scholar] [CrossRef] [Green Version]
  17. Wang, L.; Liu, J.Q.; Talebian, F.; El-Omrani, H.Y.; Khattabi, M.; Yu, L.; Bai, X.F. Tumor expression of cd200 inhibits il-10 production by tumor-associated myeloid cells and prevents tumor immune evasion of ctl therapy. Eur. J. Immunol. 2010, 40, 2569–2579. [Google Scholar] [CrossRef] [Green Version]
  18. Jenmalm, M.C.; Cherwinski, H.; Bowman, E.P.; Phillips, J.H.; Sedgwick, J.D. Regulation of myeloid cell function through the cd200 receptor. J. Immunol. 2006, 176, 191–199. [Google Scholar] [CrossRef]
  19. Minas, K.; Liversidge, J. Is the cd200/cd200 receptor interaction more than just a myeloid cell inhibitory signal? Crit. Rev. Immunol. 2006, 26, 213–230. [Google Scholar] [CrossRef] [Green Version]
  20. Talebian, F.; Liu, J.Q.; Liu, Z.; Khattabi, M.; He, Y.; Ganju, R.; Bai, X.F. Melanoma cell expression of cd200 inhibits tumor formation and lung metastasis via inhibition of myeloid cell functions. PLoS ONE 2012, 7, e31442. [Google Scholar] [CrossRef]
  21. Zgodzinski, W.; Grywalska, E.; Surdacka, A.; Zinkiewicz, K.; Majewski, M.; Szczepanek, D.; Wallner, G.; Rolinski, J. Surface cd200 and cd200r antigens on lymphocytes in advanced gastric cancer: A new potential target for immunotherapy. Arch. Med. Sci. 2018, 14, 1271–1280. [Google Scholar] [CrossRef] [PubMed]
  22. Erin, N.; Tanriover, G.; Curry, A.; Akman, M.; Duymus, O.; Gorczynski, R. Cd200fc enhances anti-tumoral immune response and inhibits visceral metastasis of breast carcinoma. Oncotarget 2018, 9, 19147–19158. [Google Scholar] [CrossRef] [PubMed] [Green Version]
  23. Erin, N.; Podnos, A.; Tanriover, G.; Duymus, O.; Cote, E.; Khatri, I.; Gorczynski, R.M. Bidirectional effect of cd200 on breast cancer development and metastasis, with ultimate outcome determined by tumor aggressiveness and a cancer-induced inflammatory response. Oncogene 2015, 34, 3860–3870. [Google Scholar] [CrossRef] [PubMed]
  24. Kim, K.W.; Vallon-Eberhard, A.; Zigmond, E.; Farache, J.; Shezen, E.; Shakhar, G.; Ludwig, A.; Lira, S.A.; Jung, S. In vivo structure/function and expression analysis of the cx3c chemokine fractalkine. Blood 2011, 118, e156–e167. [Google Scholar] [CrossRef] [Green Version]
  25. Lee, M.; Lee, Y.; Song, J.; Lee, J.; Chang, S.Y. Tissue-specific role of cx3cr1 expressing immune cells and their relationships with human disease. Immune Netw. 2018, 18, e5. [Google Scholar] [CrossRef]
  26. Yan, Y.; Cao, S.; Liu, X.; Harrington, S.M.; Bindeman, W.E.; Adjei, A.A.; Jang, J.S.; Jen, J.; Li, Y.; Chanana, P.; et al. Cx3cr1 identifies pd-1 therapy-responsive cd8+ t cells that withstand chemotherapy during cancer chemoimmunotherapy. JCI Insight 2018, 3, e97828. [Google Scholar] [CrossRef] [Green Version]
  27. Dangaj, D.; Bruand, M.; Grimm, A.J.; Ronet, C.; Barras, D.; Duttagupta, P.A.; Lanitis, E.; Duraiswamy, J.; Tanyi, J.L.; Benencia, F.; et al. Cooperation between constitutive and inducible chemokines enables t cell engraftment and immune attack in solid tumors. Cancer Cell 2019, 35, 885–900 e810. [Google Scholar] [CrossRef]
  28. Zaidi, M.R.; Merlino, G. The two faces of interferon-gamma in cancer. Clin. Cancer Res. 2011, 17, 6118–6124. [Google Scholar] [CrossRef] [Green Version]
  29. Lahmidi, S.; Yousefi, M.; Dridi, S.; Duplay, P.; Pearson, A. Dok-1 and dok-2 are required to maintain herpes simplex virus 1-specific cd8(+) t cells in a murine model of ocular infection. J. Virol. 2017, 91. [Google Scholar] [CrossRef] [Green Version]
  30. Mihrshahi, R.; Barclay, A.N.; Brown, M.H. Essential roles for dok2 and rasgap in cd200 receptor-mediated regulation of human myeloid cells. J. Immunol. 2009, 183, 4879–4886. [Google Scholar] [CrossRef]
  31. Lanier, L.L.; Bakker, A.B. The itam-bearing transmembrane adaptor dap12 in lymphoid and myeloid cell function. Immunol. Today 2000, 21, 611–614. [Google Scholar] [CrossRef]
  32. Kobayashi, M.; Konishi, H.; Sayo, A.; Takai, T.; Kiyama, H. Trem2/dap12 signal elicits proinflammatory response in microglia and exacerbates neuropathic pain. J. Neurosci. 2016, 36, 11138–11150. [Google Scholar] [CrossRef] [PubMed]
  33. Voss, O.H.; Tian, L.; Murakami, Y.; Coligan, J.E.; Krzewski, K. Emerging role of cd300 receptors in regulating myeloid cell efferocytosis. Mol. Cell Oncol. 2015, 2, e964625. [Google Scholar] [CrossRef] [PubMed] [Green Version]
  34. Korver, W.; Zhao, X.; Singh, S.; Pardoux, C.; Zhao, J.; Guzman, M.L.; Sen, S.; Yonkovich, S.; Liu, S.; Zhan, X.; et al. Monoclonal antibodies against irem-1: Potential for targeted therapy of aml. Leukemia 2009, 23, 1587–1597. [Google Scholar] [CrossRef] [Green Version]
  35. Erin, N.; Dilmac, S.; Curry, A.; Duymus, O.; Tanriover, G.; Prodeus, A.; Gariepy, J.; Gorczynski, R.M. Cd200 mimetic aptamer peg-m49 markedly increases the therapeutic effects of pegylated liposomal doxorubicin in a mouse model of metastatic breast carcinoma: An effect independent of cd200 receptor 1. Cancer Immunol. Immunother. 2020, 69, 103–114. [Google Scholar] [CrossRef]
  36. Mahadevan, D.; Lanasa, M.C.; Farber, C.; Pandey, M.; Whelden, M.; Faas, S.J.; Ulery, T.; Kukreja, A.; Li, L.; Bedrosian, C.L.; et al. Phase i study of samalizumab in chronic lymphocytic leukemia and multiple myeloma: Blockade of the immune checkpoint cd200. J. Immunother. Cancer 2019, 7, 227. [Google Scholar] [CrossRef] [Green Version]
  37. Lim, S.M.; Cho, S.H.; Hwang, I.G.; Choi, J.W.; Chang, H.; Ahn, M.J.; Park, K.U.; Kim, J.W.; Ko, Y.H.; Ahn, H.K.; et al. Investigating the feasibility of targeted next-generation sequencing to guide the treatment of head and neck squamous cell carcinoma. Cancer Res. Treat. 2019, 51, 300–312. [Google Scholar] [CrossRef] [Green Version]
  38. Cancer Genome Atlas Research, N.; Weinstein, J.N.; Collisson, E.A.; Mills, G.B.; Shaw, K.R.; Ozenberger, B.A.; Ellrott, K.; Shmulevich, I.; Sander, C.; Stuart, J.M. The cancer genome atlas pan-cancer analysis project. Nat. Genet. 2013, 45, 1113–1120. [Google Scholar]
  39. Cerami, E.; Gao, J.; Dogrusoz, U.; Gross, B.E.; Sumer, S.O.; Aksoy, B.A.; Jacobsen, A.; Byrne, C.J.; Heuer, M.L.; Larsson, E.; et al. The cbio cancer genomics portal: An open platform for exploring multidimensional cancer genomics data. Cancer Discov. 2012, 2, 401–404. [Google Scholar] [CrossRef] [Green Version]
  40. Wichmann, G.; Rosolowski, M.; Krohn, K.; Kreuz, M.; Boehm, A.; Reiche, A.; Scharrer, U.; Halama, D.; Bertolini, J.; Bauer, U.; et al. The role of hpv rna transcription, immune response-related gene expression and disruptive tp53 mutations in diagnostic and prognostic profiling of head and neck cancer. Int. J. Cancer 2015, 137, 2846–2857. [Google Scholar] [CrossRef]
  41. Davis, S.; Meltzer, P.S. Geoquery: A bridge between the gene expression omnibus (geo) and bioconductor. Bioinformatics 2007, 23, 1846–1847. [Google Scholar] [CrossRef] [PubMed] [Green Version]
  42. Lausen, B.; Hothorn, T.; Bretz, F.; Schumacher, M. Assessment of optimal selected prognostic factors. Biom. J. 2004, 46, 364–374. [Google Scholar] [CrossRef]
  43. Simon, N.; Friedman, J.; Hastie, T.; Tibshirani, R. Regularization paths for cox’s proportional hazards model via coordinate descent. J. Stat. Softw. 2011, 39, 1–13. [Google Scholar] [CrossRef] [PubMed]
  44. Uno, H.; Cai, T.; Pencina, M.J.; D’Agostino, R.B.; Wei, L.J. On the c-statistics for evaluating overall adequacy of risk prediction procedures with censored survival data. Stat. Med. 2011, 30, 1105–1117. [Google Scholar] [CrossRef] [PubMed] [Green Version]
  45. Robinson, M.D.; McCarthy, D.J.; Smyth, G.K. Edger: A bioconductor package for differential expression analysis of digital gene expression data. Bioinformatics 2010, 26, 139–140. [Google Scholar] [CrossRef] [Green Version]
  46. Colaprico, A.; Silva, T.C.; Olsen, C.; Garofano, L.; Cava, C.; Garolini, D.; Sabedot, T.S.; Malta, T.M.; Pagnotta, S.M.; Castiglioni, I.; et al. Tcgabiolinks: An r/bioconductor package for integrative analysis of tcga data. Nucleic Acids Res. 2016, 44, e71. [Google Scholar] [CrossRef]
  47. Ritchie, M.E.; Phipson, B.; Wu, D.; Hu, Y.; Law, C.W.; Shi, W.; Smyth, G.K. Limma powers differential expression analyses for rna-sequencing and microarray studies. Nucleic Acids Res. 2015, 43, e47. [Google Scholar] [CrossRef]
  48. Choi, K.; Ratner, N. Igeak: An interactive gene expression analysis kit for seamless workflow using the r/shiny platform. BMC Genomics 2019, 20, 177. [Google Scholar] [CrossRef] [Green Version]
  49. Huang da, W.; Sherman, B.T.; Lempicki, R.A. Bioinformatics enrichment tools: Paths toward the comprehensive functional analysis of large gene lists. Nucleic Acids Res. 2009, 37, 1–13. [Google Scholar] [CrossRef] [Green Version]
  50. Jiménez-Sánchez, A.; Cast, O.; Miller, M.L. Comprehensive benchmarking and integration of tumor microenvironment cell estimation methods. Cancer Res. 2019, 79, 6238–6246. [Google Scholar] [CrossRef] [Green Version]
Figure 1. Kaplan–Meier survival curve for changes in OS according to CD200R1 mRNA expression in the Korean cohort (A), the GEO (GSE65858) (B), and TCGA HNSCC (C) data. Patients with high expression of CD200R1 (yellow solid line) showed longer OS compared with those with low expression (blue dotted line). The p-values were calculated using the log-rank test.
Cancers 12 01777 g001
Figure 2. CD200R1 mRNA expression in tumors (blue box) and normal tissues (purple box) in TCGA HNSCC (n = 602) using the Xena platform (Welch’s t-test, p < 0.001).
Cancers 12 01777 g002
Figure 3. Volcano plots of all differentially expressed genes (DEGs) between tumors with high and low CD200R1 expression. (a) DEGs in GEO dataset. Red points represent genes with a |fold change| of >1.5 and adjusted p-values of <0.05. Dotted horizontal line indicates an adjusted p-value of <0.05. Dotted vertical line indicates a |fold change| of >1.5. (b) DEGs in TCGA dataset. Red points represent genes with a |fold change| of >2.0 and a false discovery rate (FDR) of <0.01. Dotted horizontal line indicates an FDR < 0.01. Dotted vertical line indicates a |fold change| of >2.0.
Cancers 12 01777 g003
Figure 4. REVIGO tree maps of gene ontology terms for enriched biological processes in differentially expressed genes (DEGs) associated with CD200R1 expression in the GEO (GSE65858) (a) and TCGA HNSCC (b) data. (c) Common DEGs associated with CD200R1 expression in the GEO (GSE65858) and TCGA HNSCC data. Box color indicates the functional category and box size is proportional to its corrected p-value.
Cancers 12 01777 g004
Figure 5. Boxplots of immune cell gene scores (normalized enrichment scores) stratified based on CD200R1 mRNA expression in the GEO (A) and TCGA (B) datasets using ConsensusTME analysis. (A) * p < 0.001, ** p < 1 × 10e−5; (B) *** p < 2 × 10e−16.
Cancers 12 01777 g005
Figure 6. CD200R1 mRNA expression and tumor lymphocyte infiltration in the TCGA HNSCC. A plot for correlation analysis (A). Pearson correlation calculation was performed for linear correlation. A plot for mean comparison stratified based on CD200R1 mRNA expression (B) *** p < 1 × 10e−3.
Cancers 12 01777 g006
Table 1. Clinical and pathological characteristics and CD200R1 mRNA expression in the Korean HNSCC cohort.
Patient CharacteristicsNo.%High CD200R1 Expression
No./Subgroup (%)
Total7110043/71 (60.5)
SexMale5881.635/58 (60.3)
Female1318.48/13 (61.5)
Age<58 years3143.619/31 (61.2)
≥58 years4056.324/40 (60.0)
SmokingNever2028.110/20 (50.0)
Yes5171.833/51 (64.7)
Tumor locationOral cavity2636.615/26 (57.6)
Oropharynx1723.911/17 (64.7)
Hypopharynx10147/10 (70.0)
Larynx1216.98/12 (66.7)
Other68.52/6 (33.3)
StageI1115.58/11 (72.7)
II1318.38/13 (61.5)
III1723.98/17 (47.0)
IV3042.319/30 (63.3)
Human papilloma virusNegative4766.226/47 (55.3)
Positive1216.910/12 (83.3)
Unknown1216.97/12 (58.3)
Table 2. Multivariate analysis of the overall survival in the Korean cohort and the GEO (GSE65858) and TCGA HNSCC data.
FactorsKorean CohortGEO (GSE65858)TCGA HNSCC
p ValueHazard Ratio
(95% CI)
p ValueHazard Ratio
(95% CI)
p ValueHazard Ratio
(95% CI)
CD200R1
(high vs. low)
<0.01 *0.19 (0.06–0.58)<0.05 *0.54 (0.29–0.99)<0.05 *0.72 (0.53–0.98)
Smoking
(Yes vs. never)
>0.11.67 (0.37–7.48)>0.10.97 (0.55–1.70)--
T stage
(T3 + T4 vs. T1 + T2)
>0.11.12 (0.95–1.31)0.001 *2.81 (1.49–5.30)<0.001 *1.74 (1.25–2.43)
N stage
(N+ vs. N0)
>0.13.06 (0.53–17.7)>0.11.14 (0.63–2.03)<0.0001 *2.00 (1.43–2.78)
M stage
(M1 vs. M0)
>0.16.27 (0.36–115.9)>0.11.91 (0.76–4.75)>0.11.01 (0.98–1.05)
Stage
(III, IV vs. I, II)
>0.10.52 (0.09–3.01)>0.10.93 (0.33–2.59)--
Tumor grade
(2, 3 vs. 0, 1)
>0.10.94 (0.81–1.09)----
Sex
(F vs. M)
>0.12.89 (0.84–9.90)>0.11.00 (0.58–1.73)>0.10.81 (0.58–1.12)
Age>0.11.00 (0.95–1.06)>0.11.18 (0.76–1.84)>0.11.33 (0.97–1.80)
*p value < 0.05. CI: confidence interval.
Table 3. C-index and AUC values for the prediction of five-year survival by CD200R1 and clinical factors in the Korean cohort and the GEO (GSE65858) and TCGA HNSCC data.
FactorsKorean CohortGEO DataTCGA HNSCC Data
C-index95% CIAUCC-index95% CIAUCC-index95% CIAUC
CD200R10.590.41–0.770.630.580.53–0.630.580.530.49–0.570.54
T stage0.550.42–0.690.500.580.51–0.650.580.550.52–0.590.58
N stage0.550.41–0.700.590.530.45–0.600.550.560.52–0.590.58
Age0.520.39–0.660.500.640.43–0.810.620.520.47–0.560.53
Sex0.540.44–0.640.590.580.42–0.740.580.590.49–0.570.54
CI: confidence interval.

