The Interplay between Colon Cancer Cells and Tumour-Associated Stromal Cells Impacts the Biological Clock and Enhances Malignant Phenotypes

 ,
,  ,
, 
 and
and 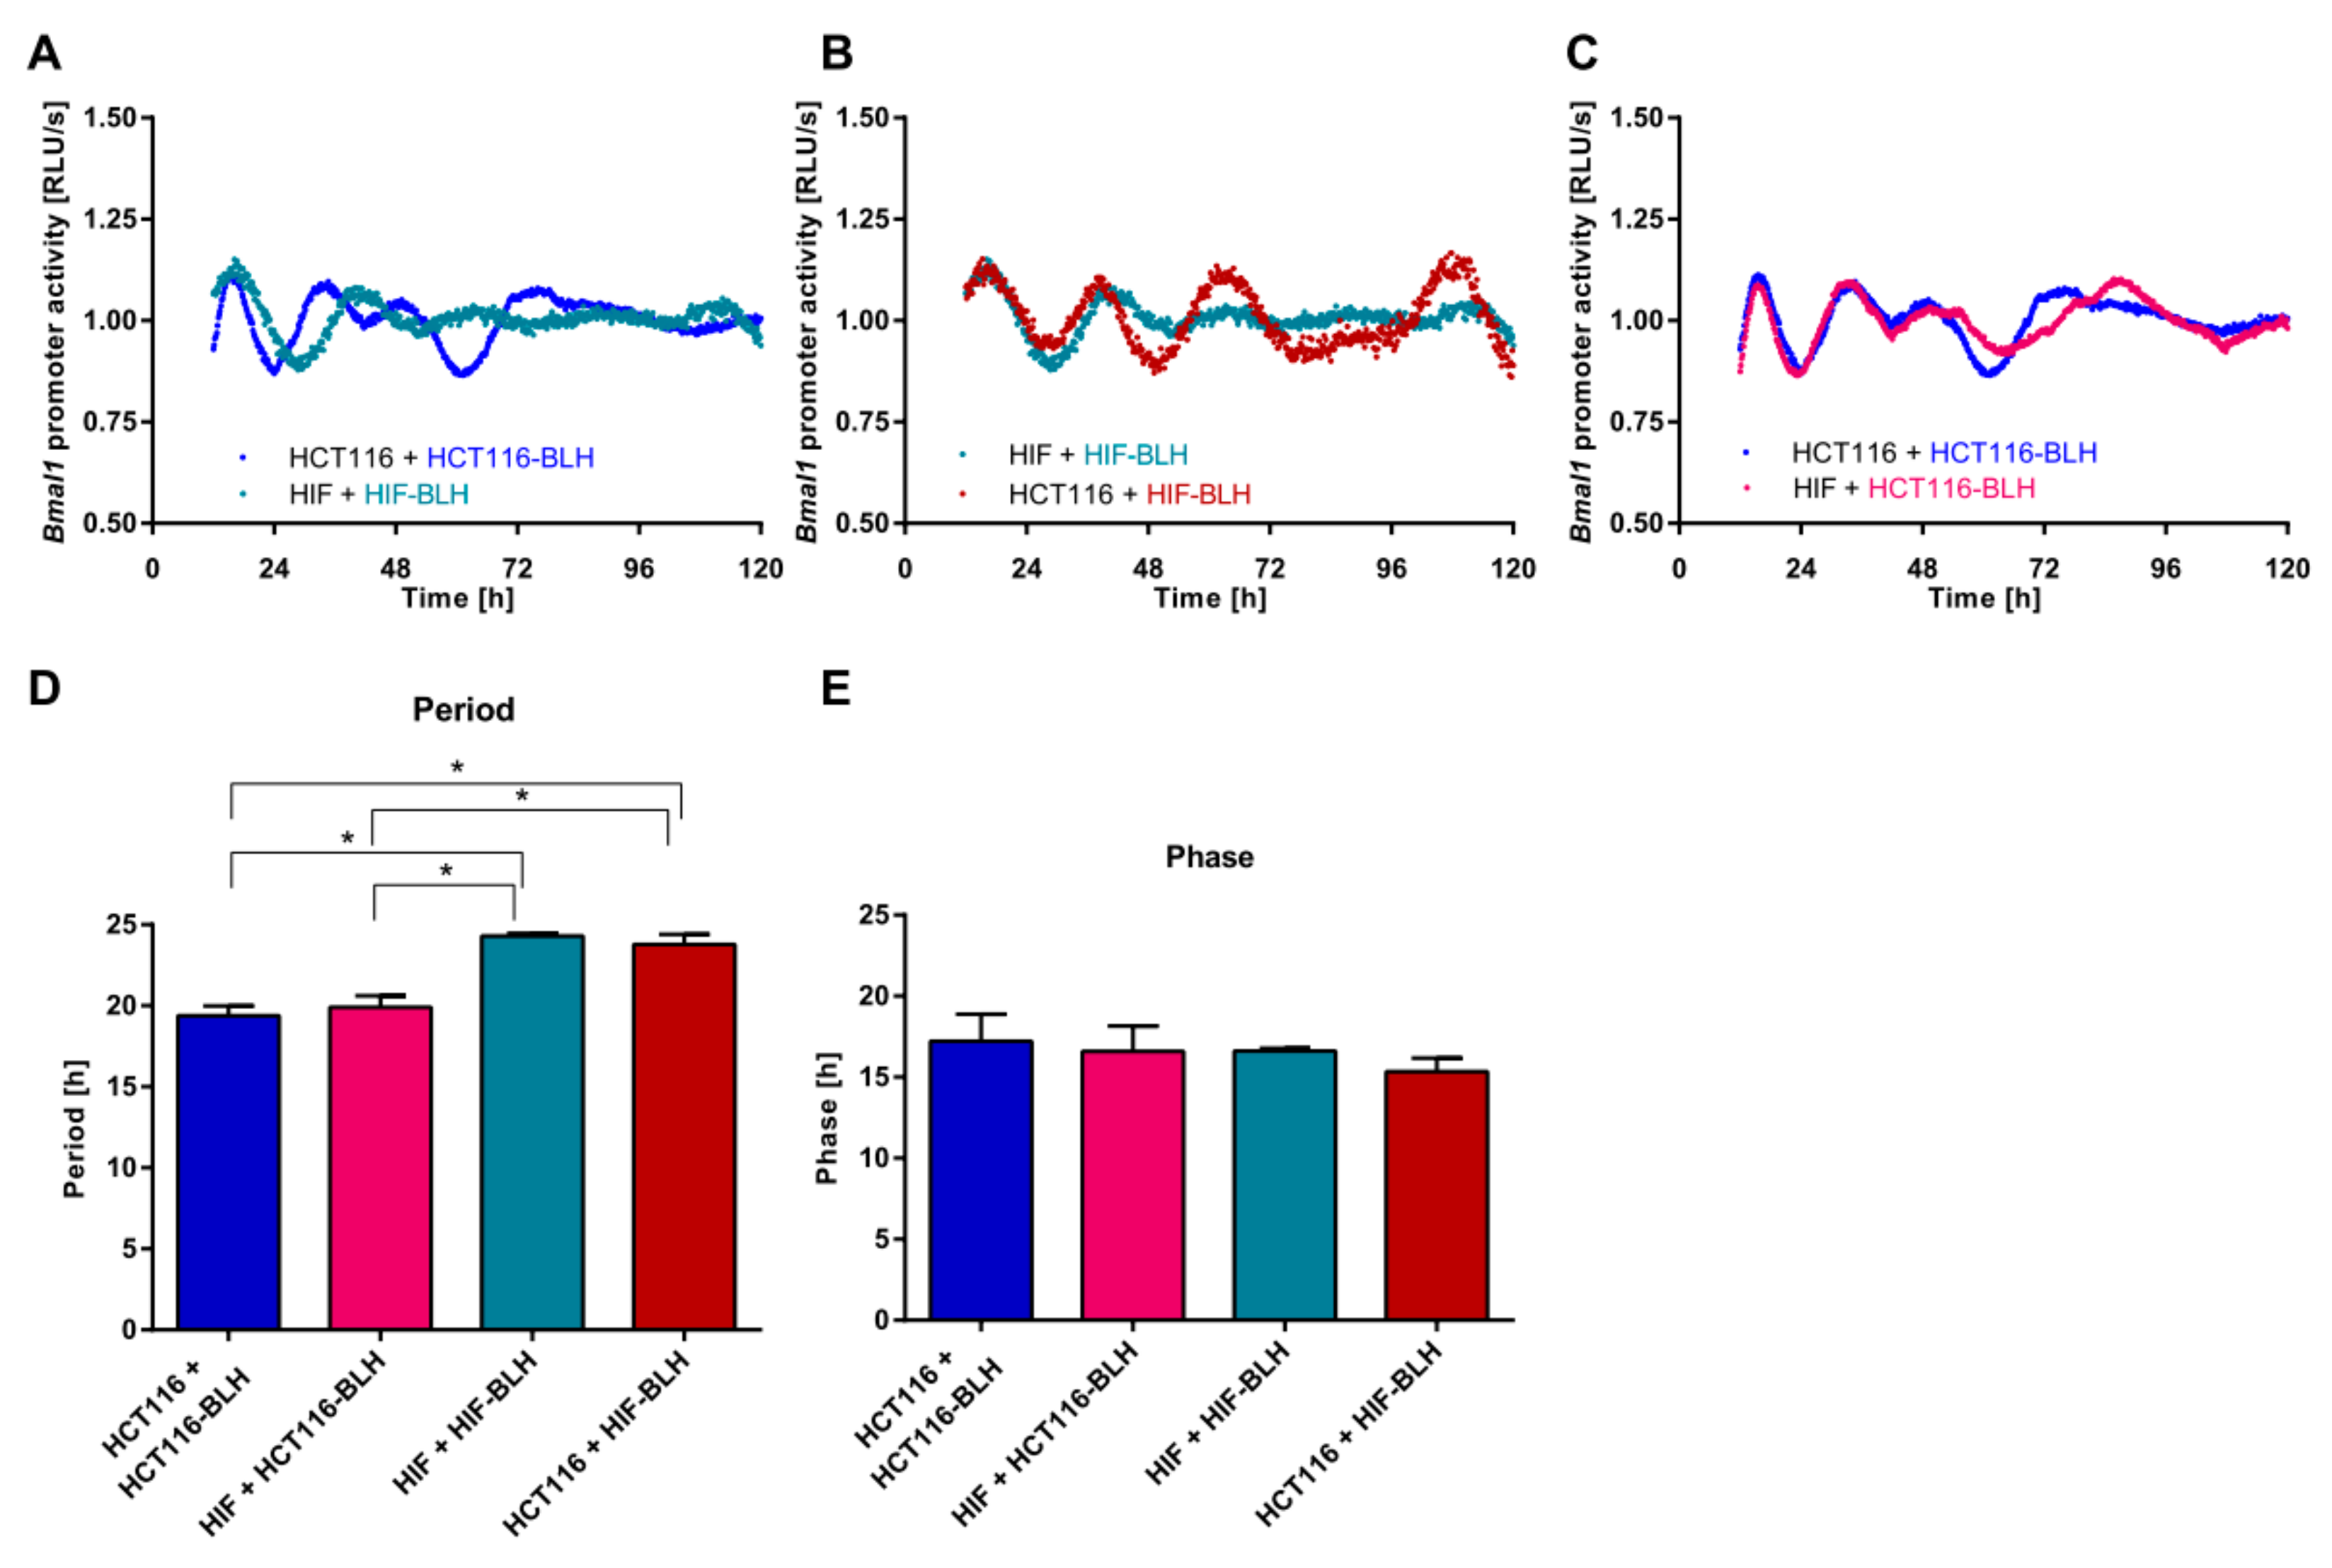
Abstract
1. Introduction
2. Results
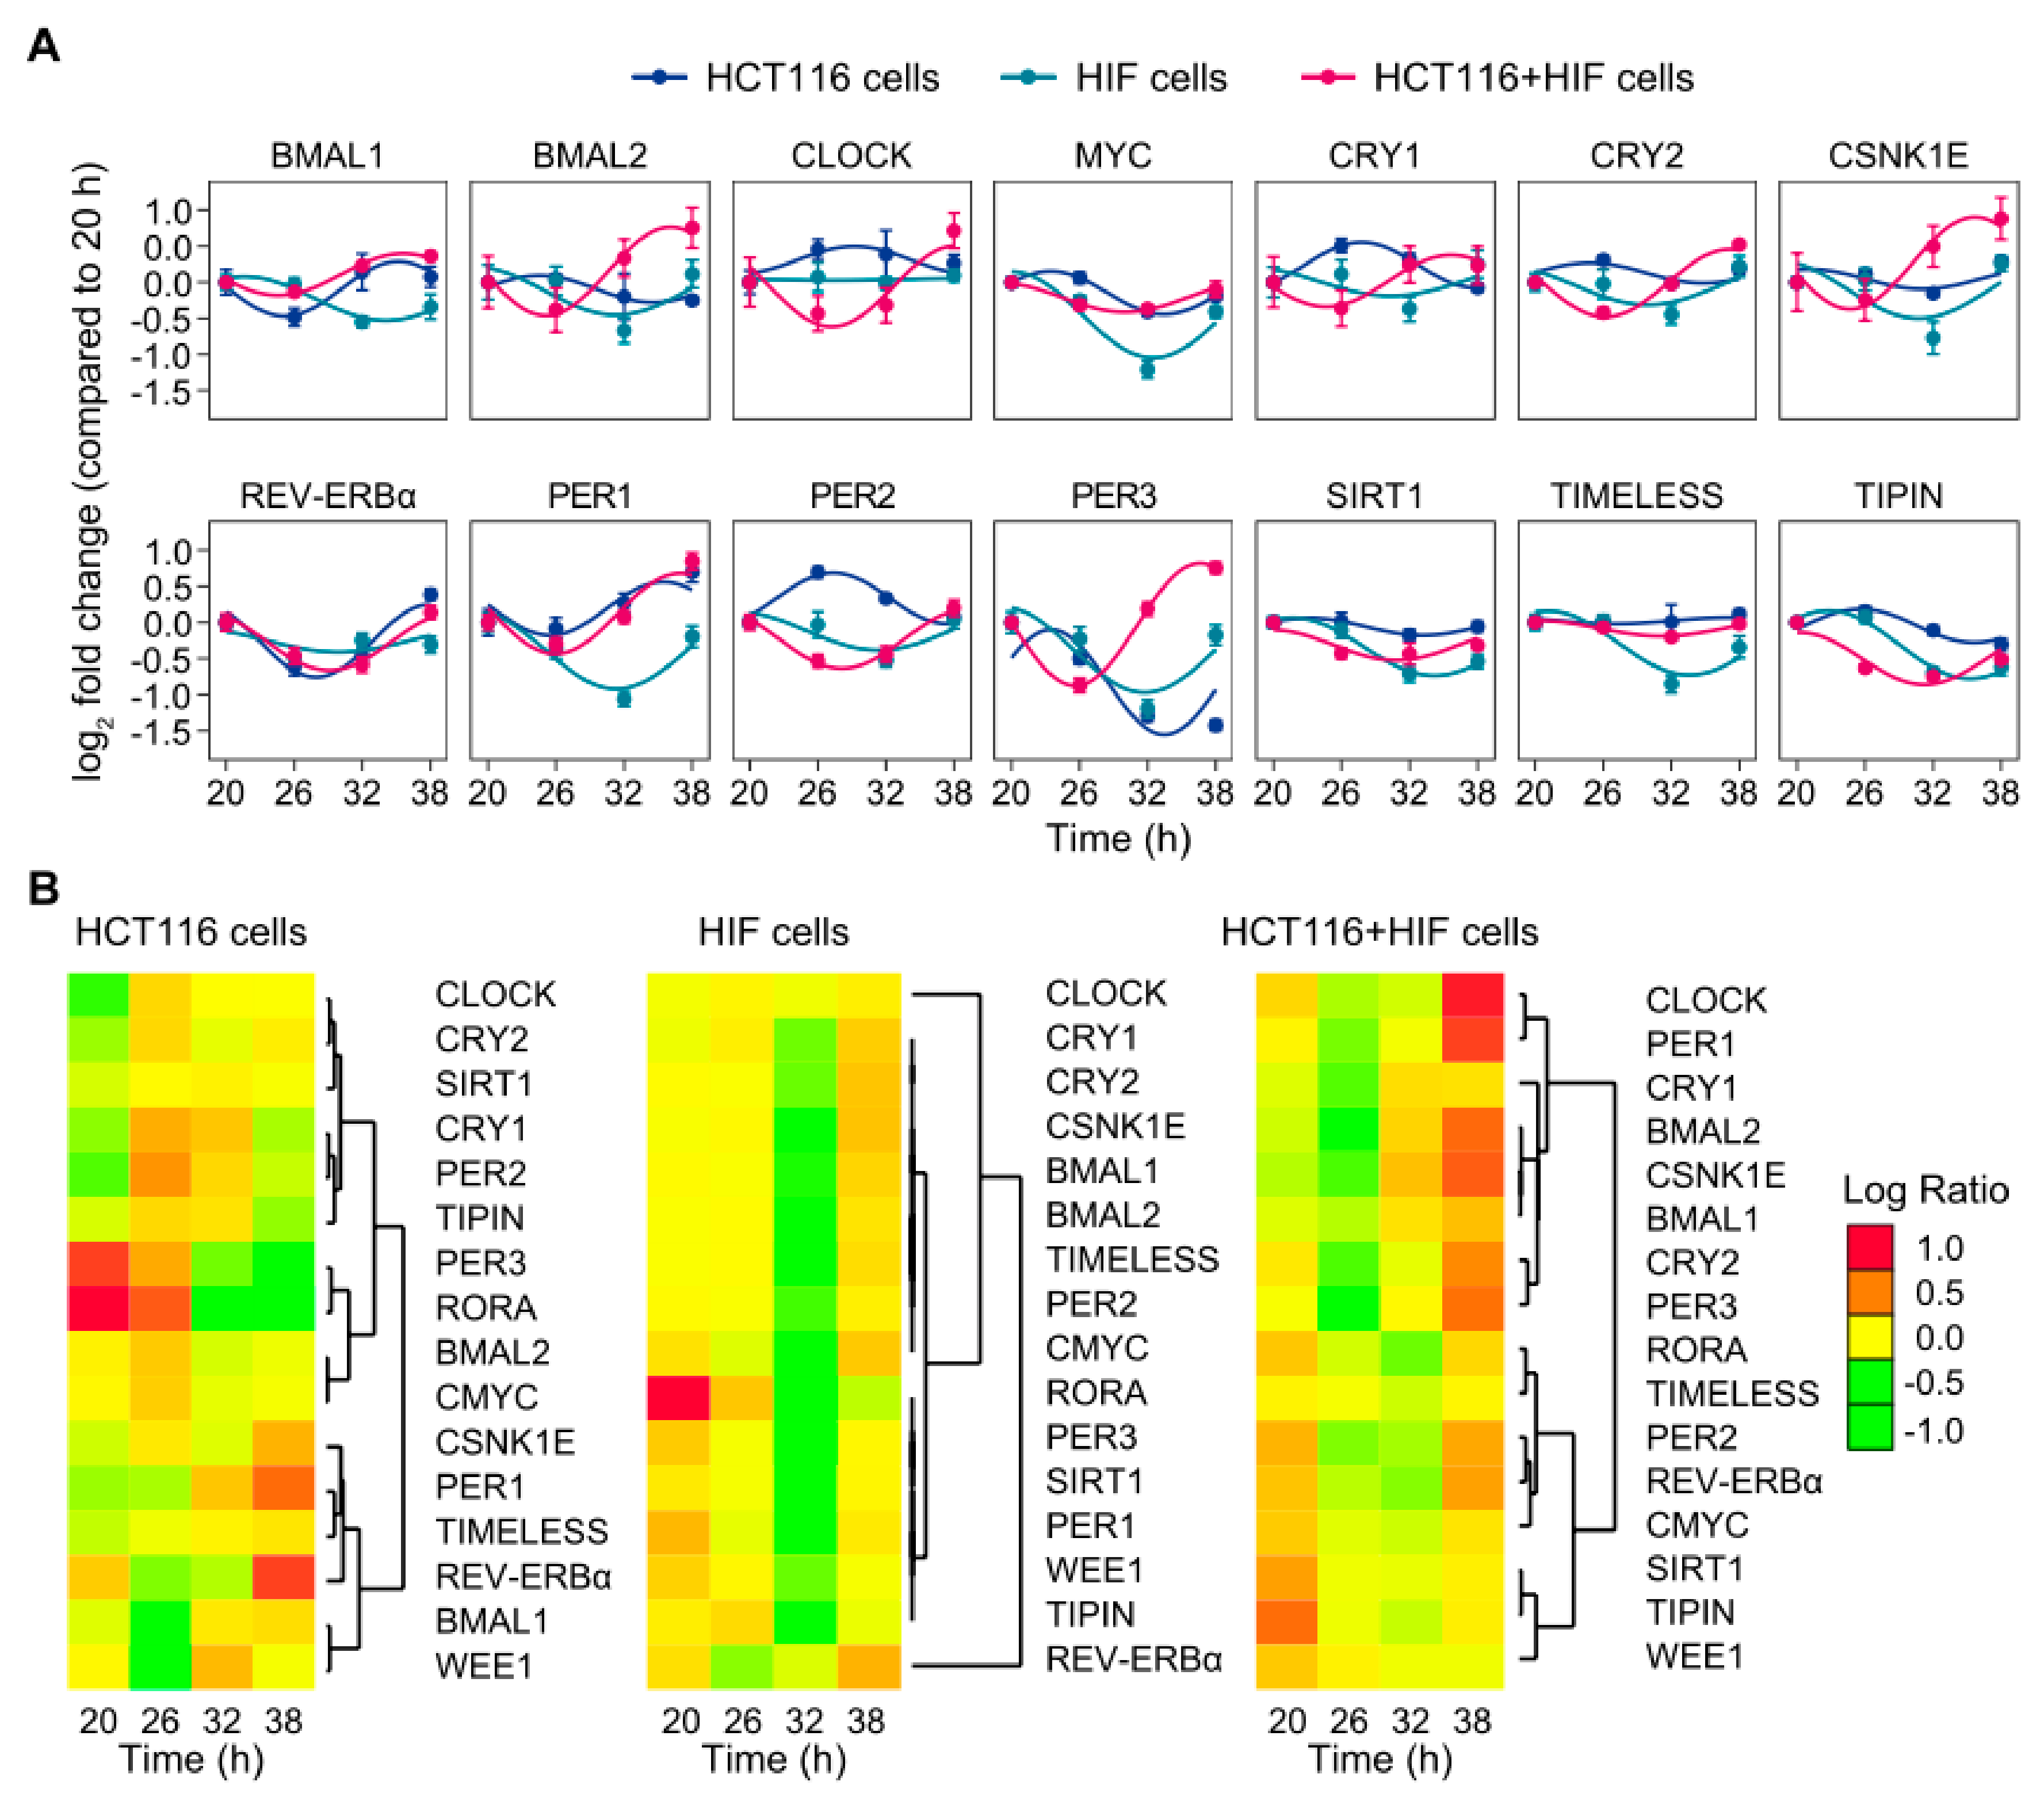
2.1. Co-Culture of Cell Lines with Different Clock Phenotypes Affects the Expression of Core-Clock Genes
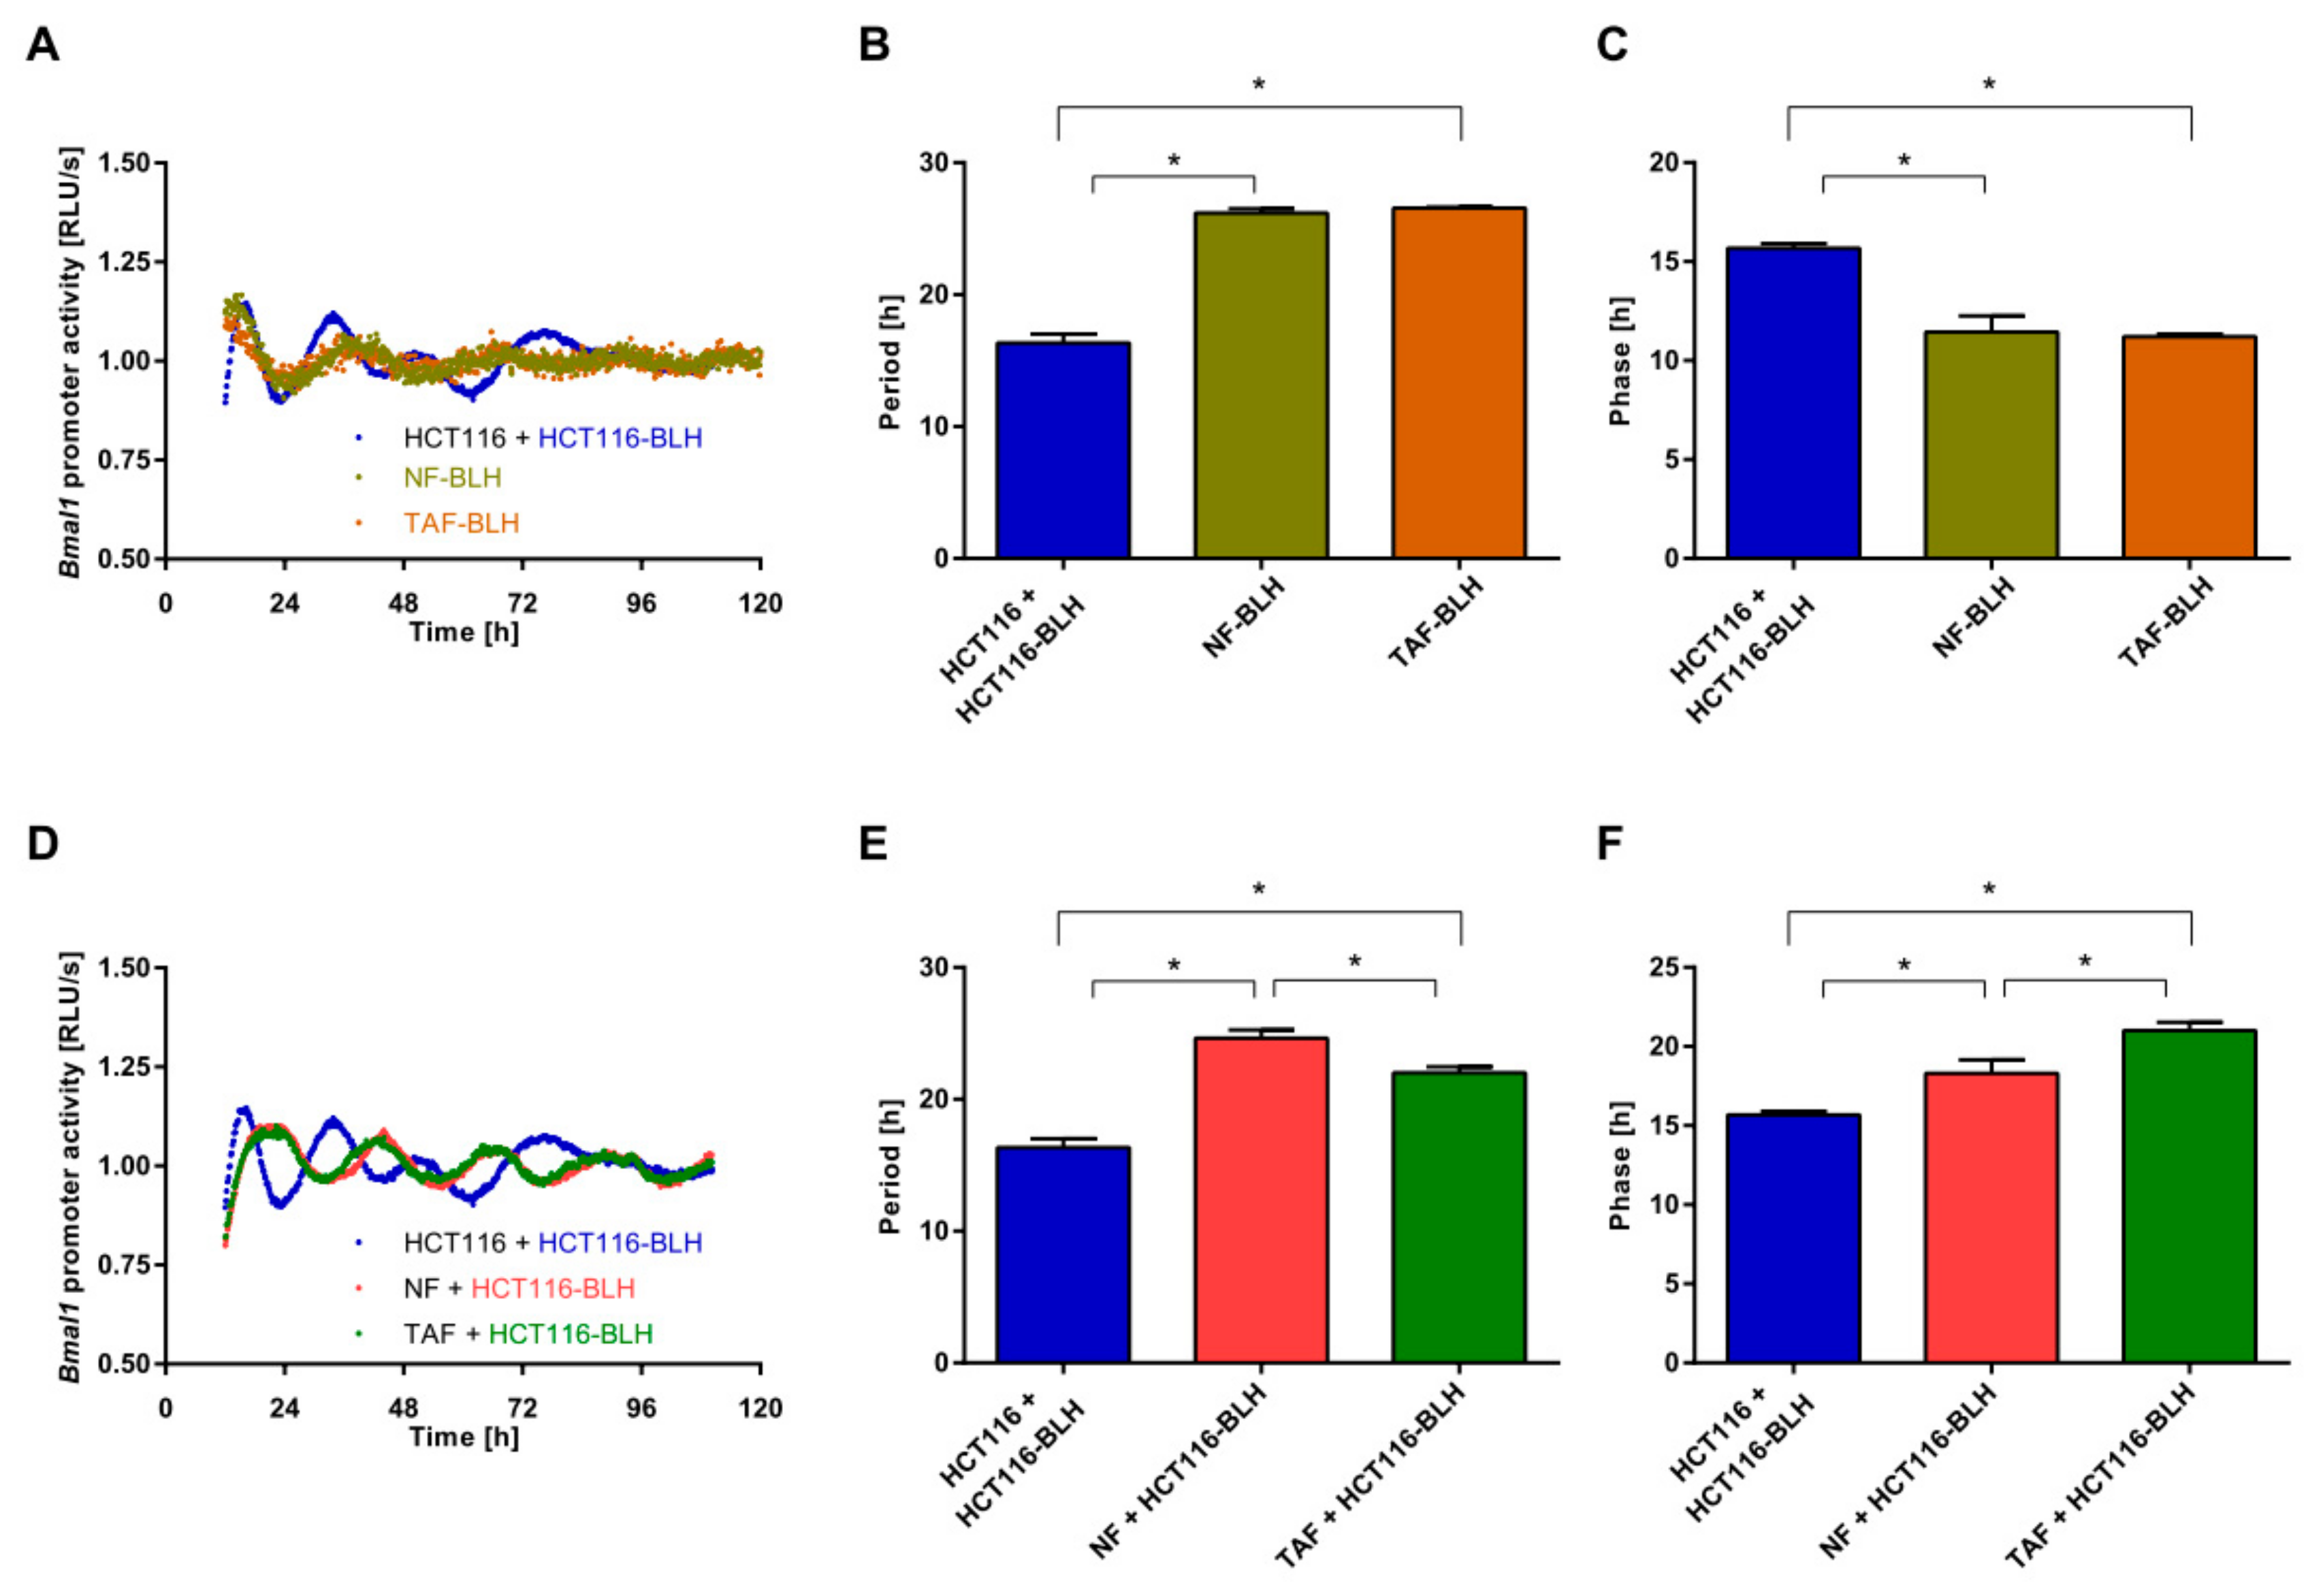
2.2. Co-Culture with Primary Fibroblasts Induces Circadian Changes in HCT116 Cells
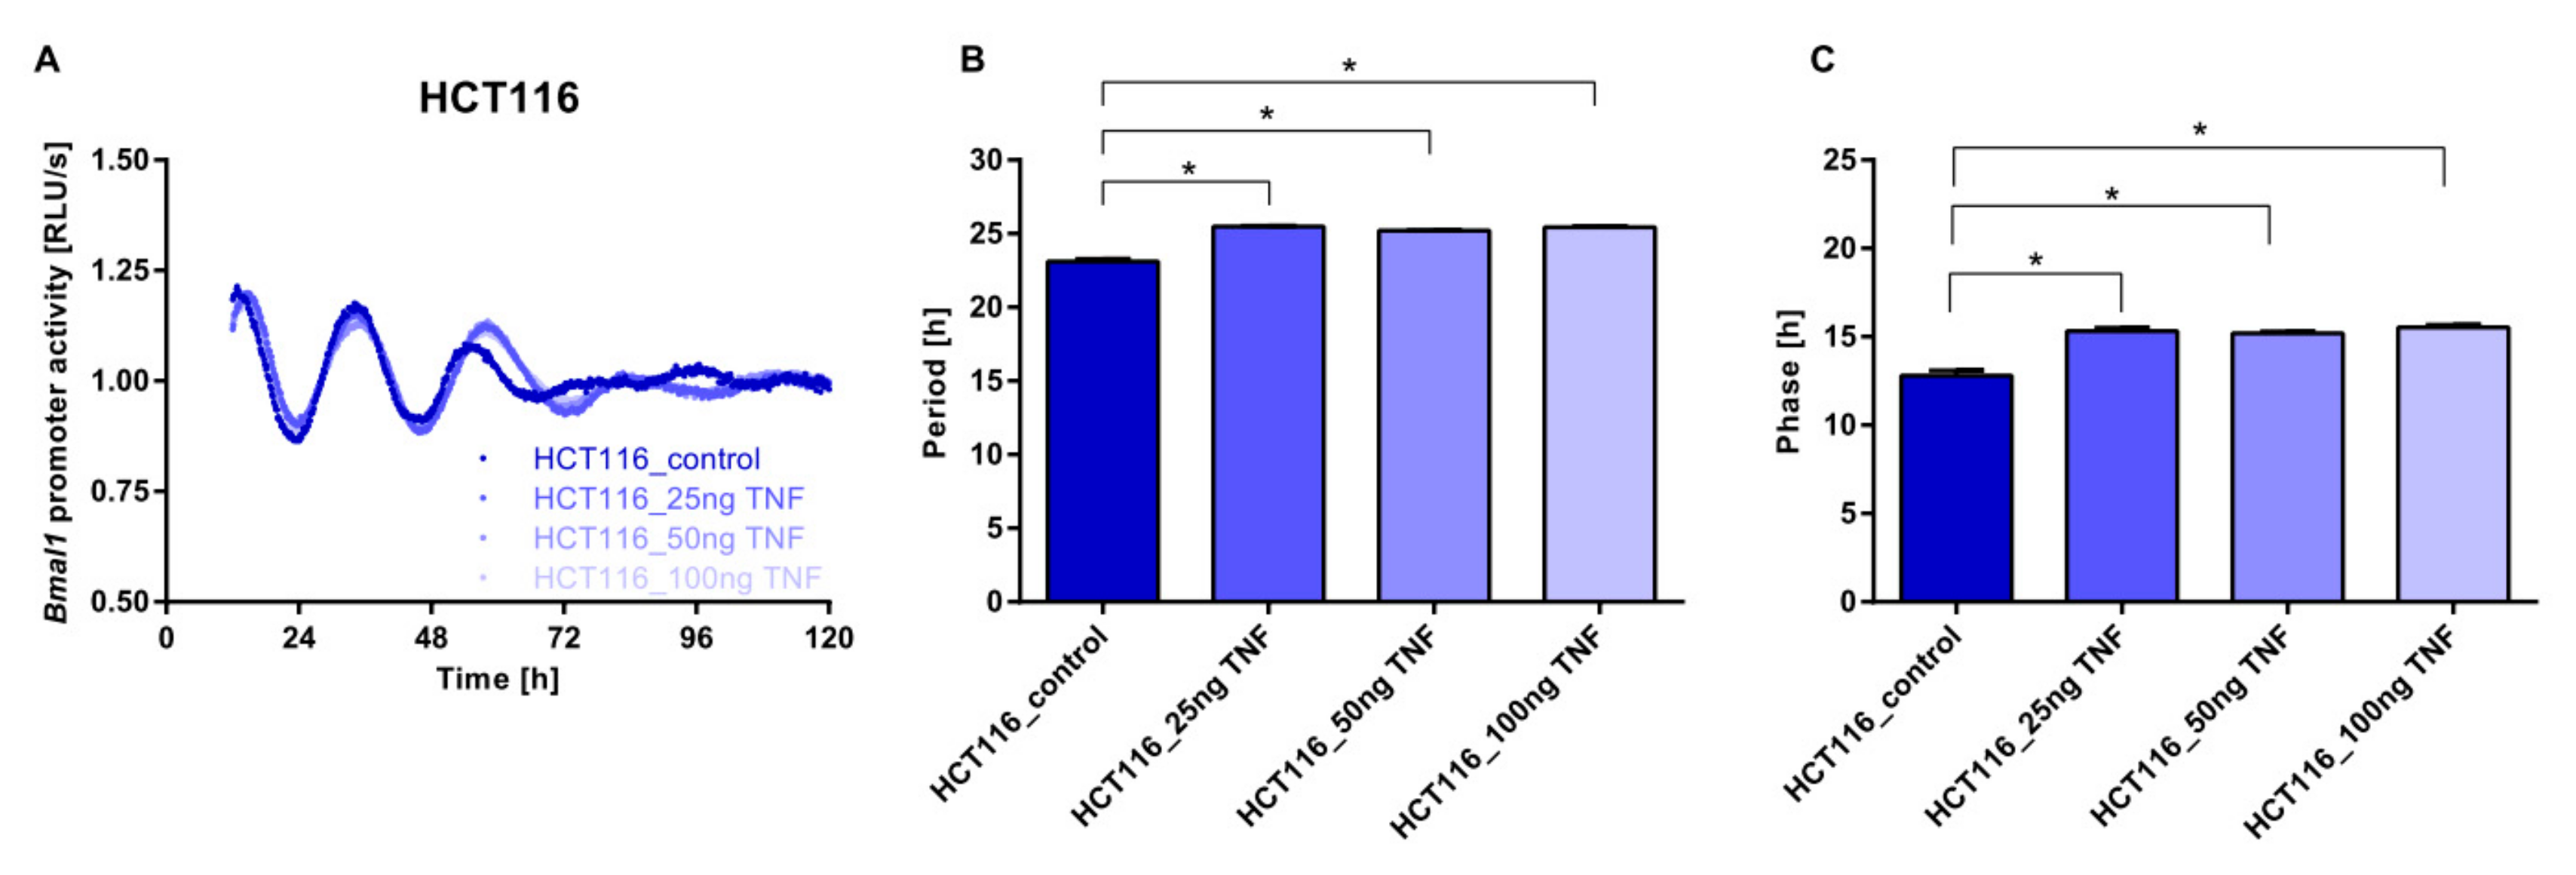
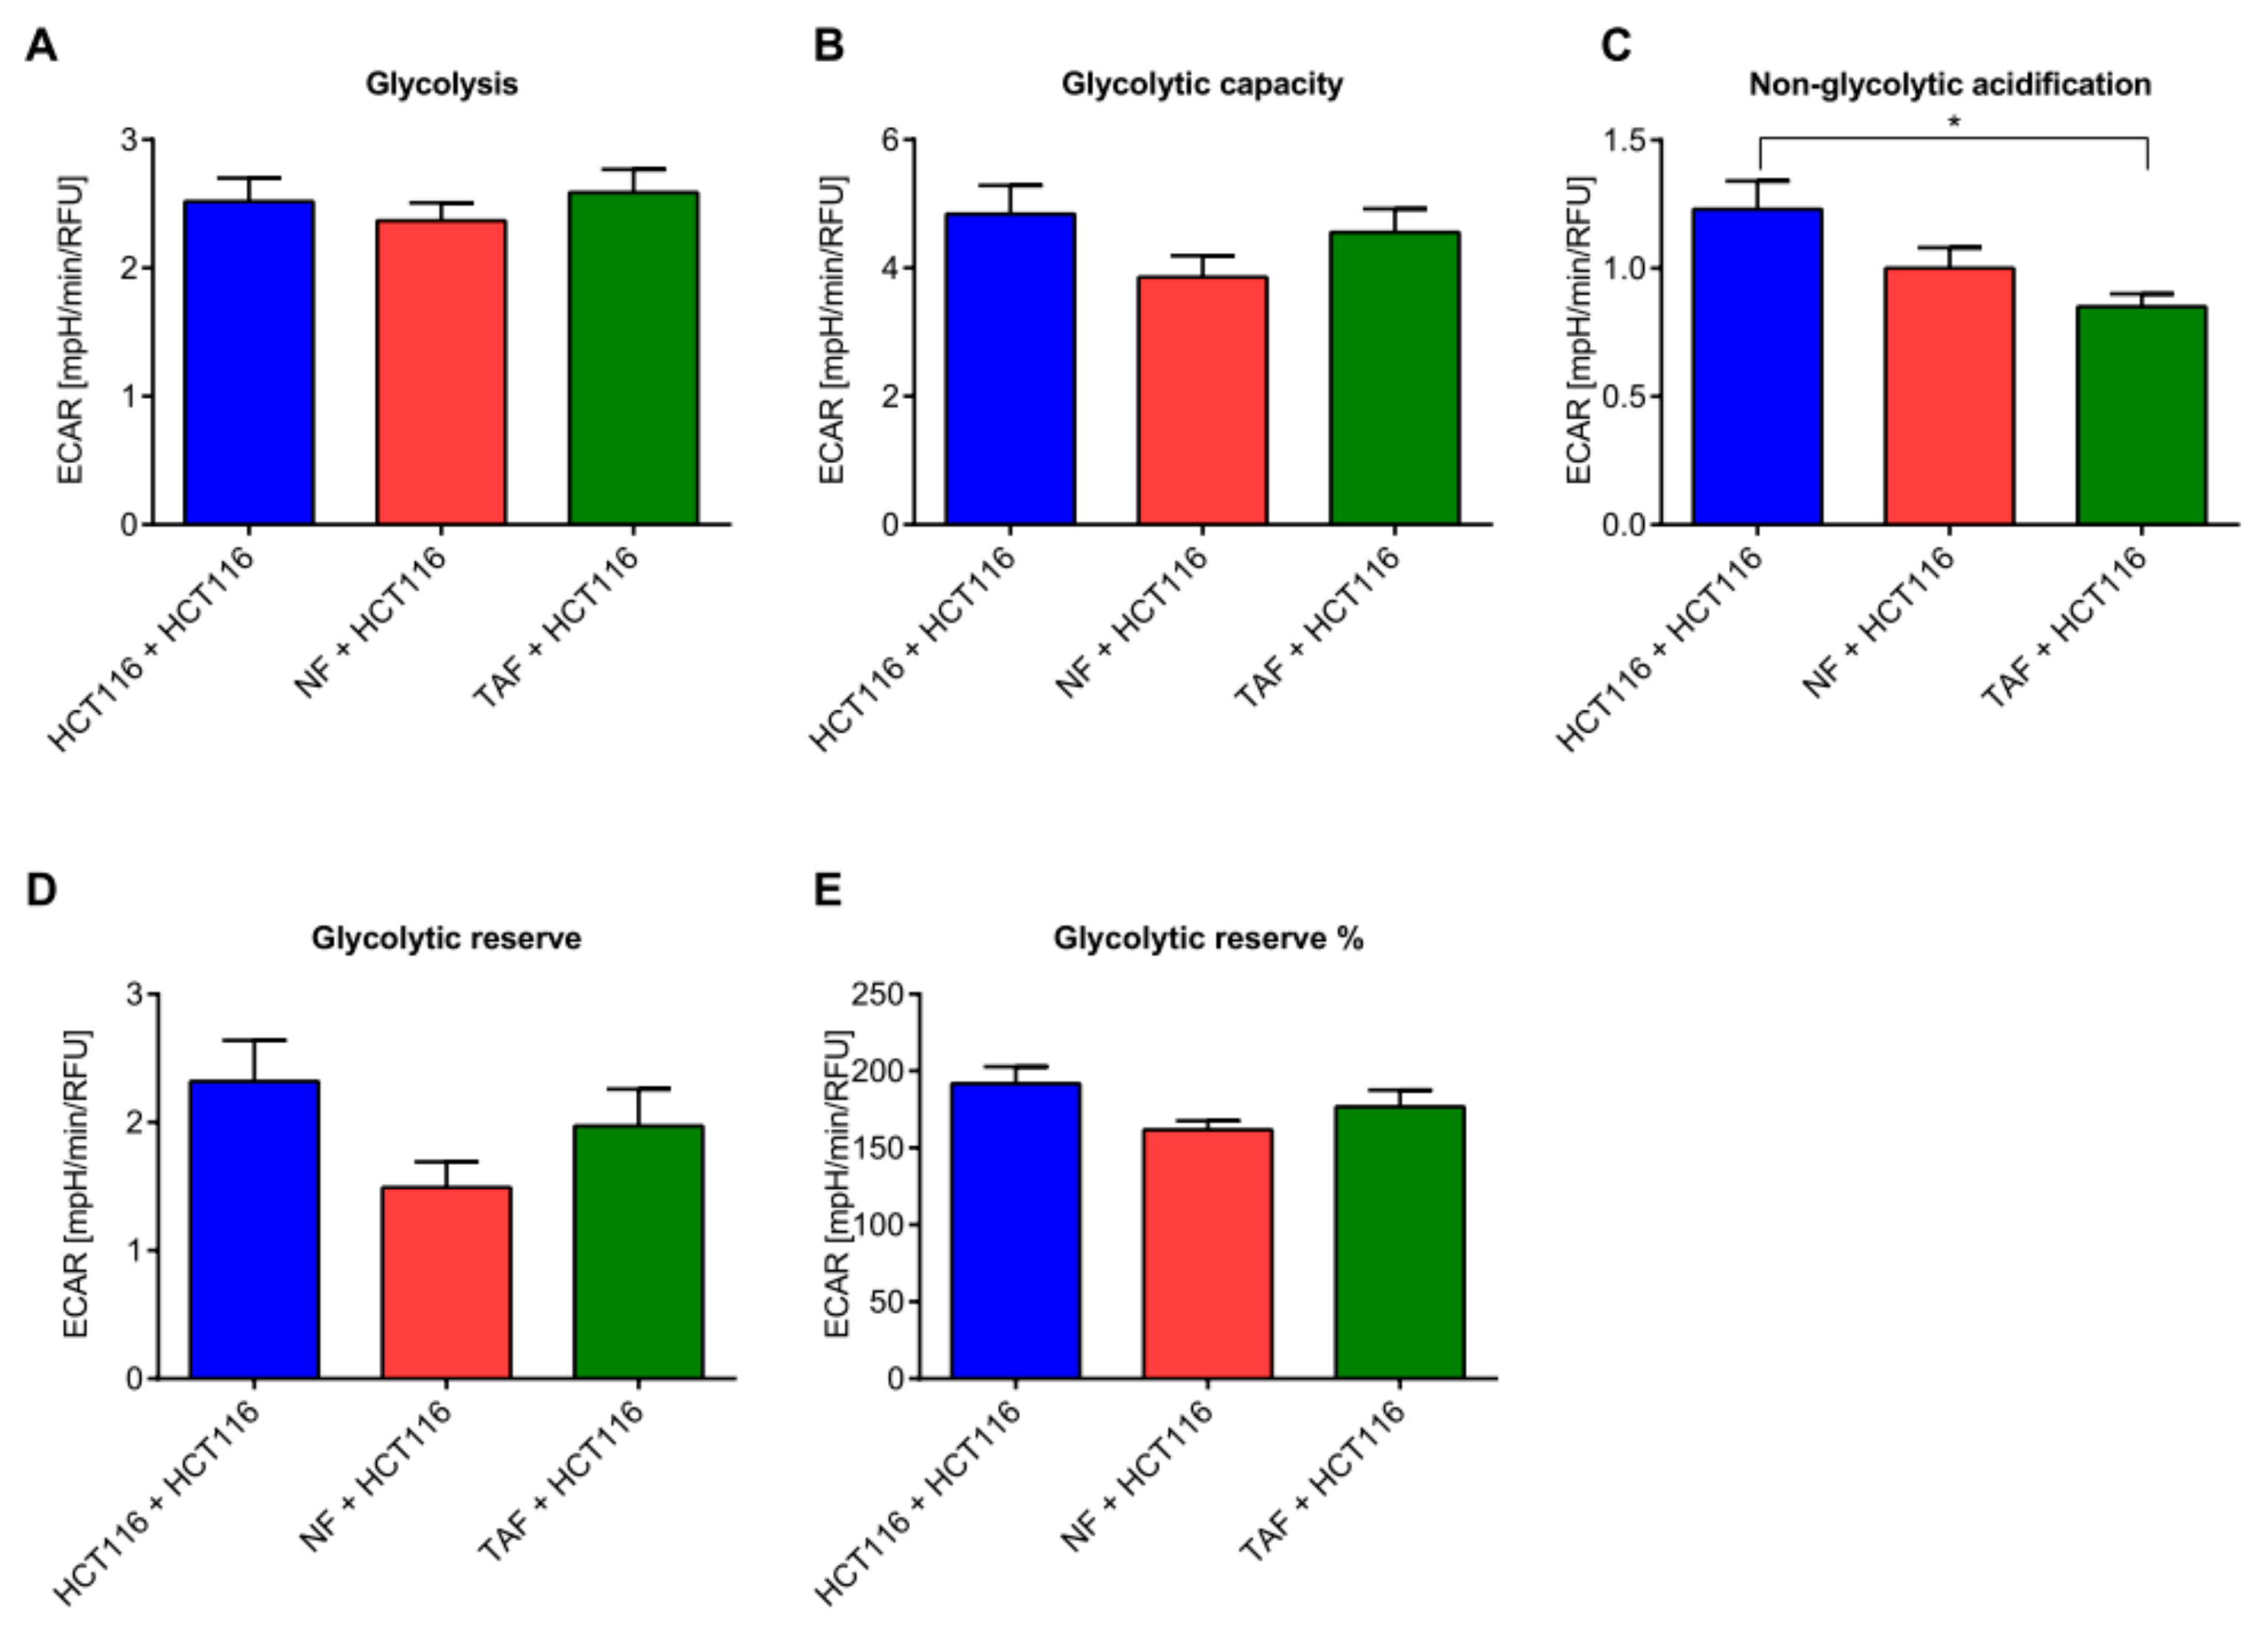
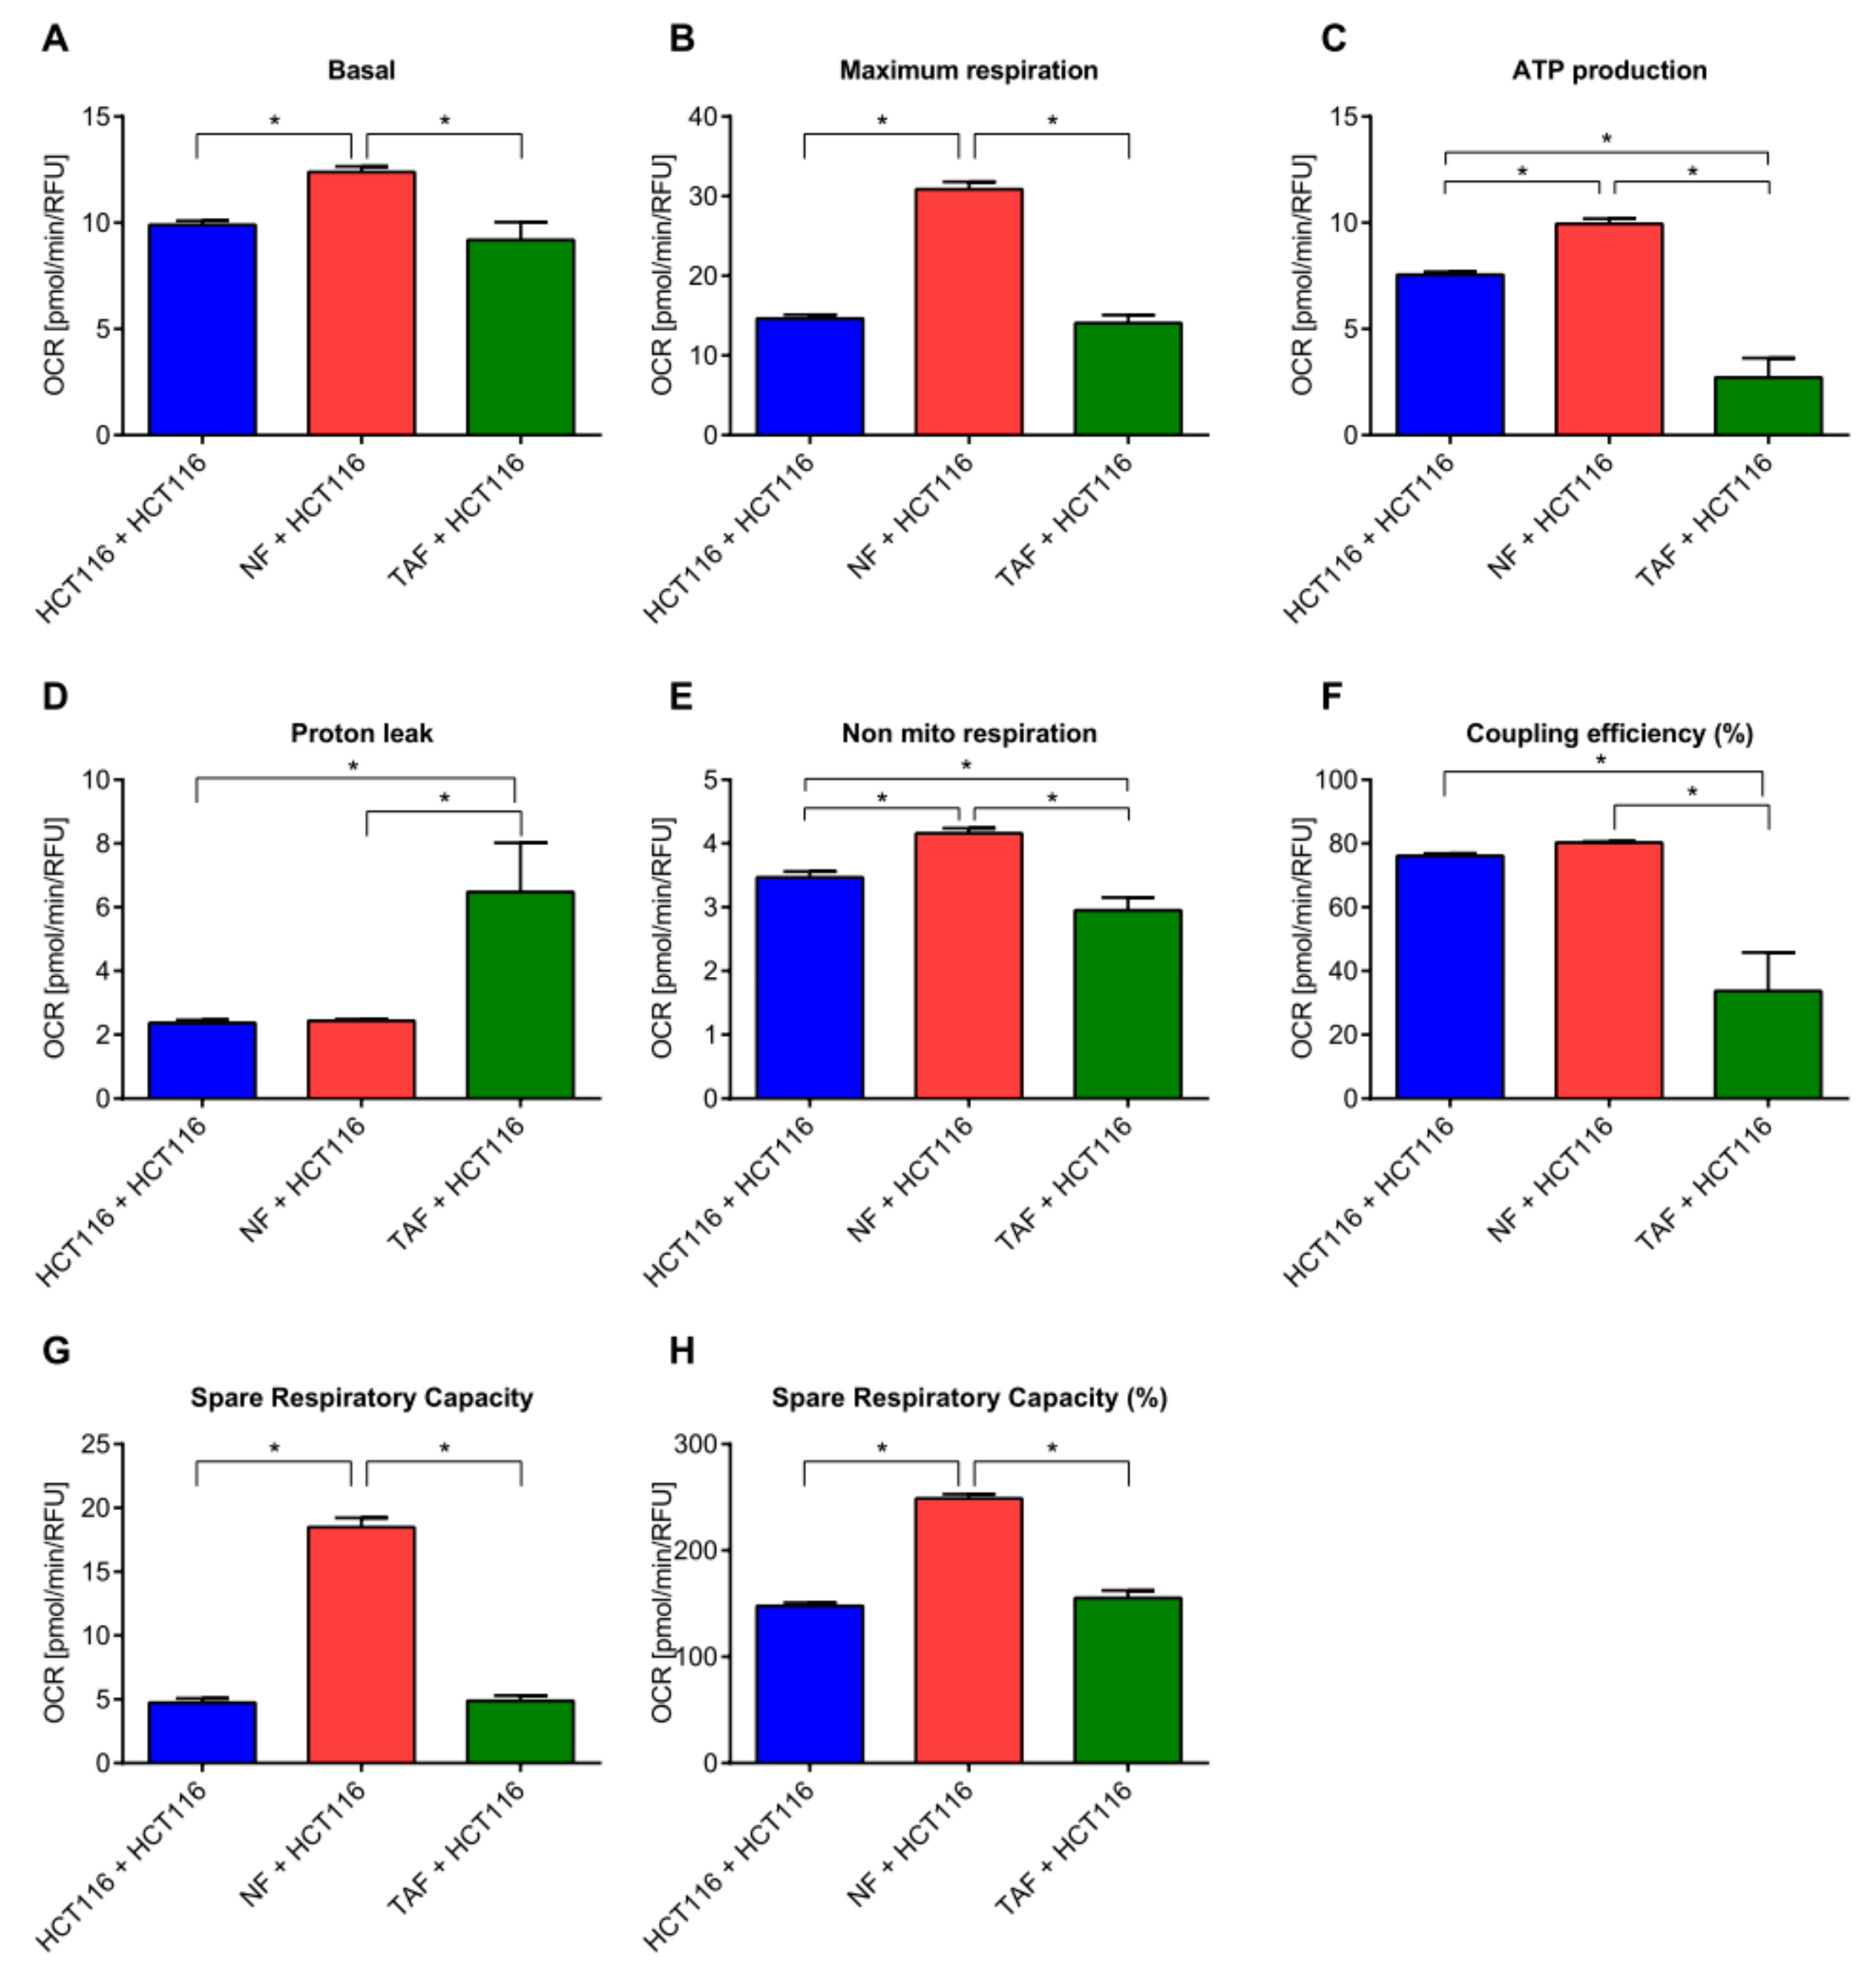
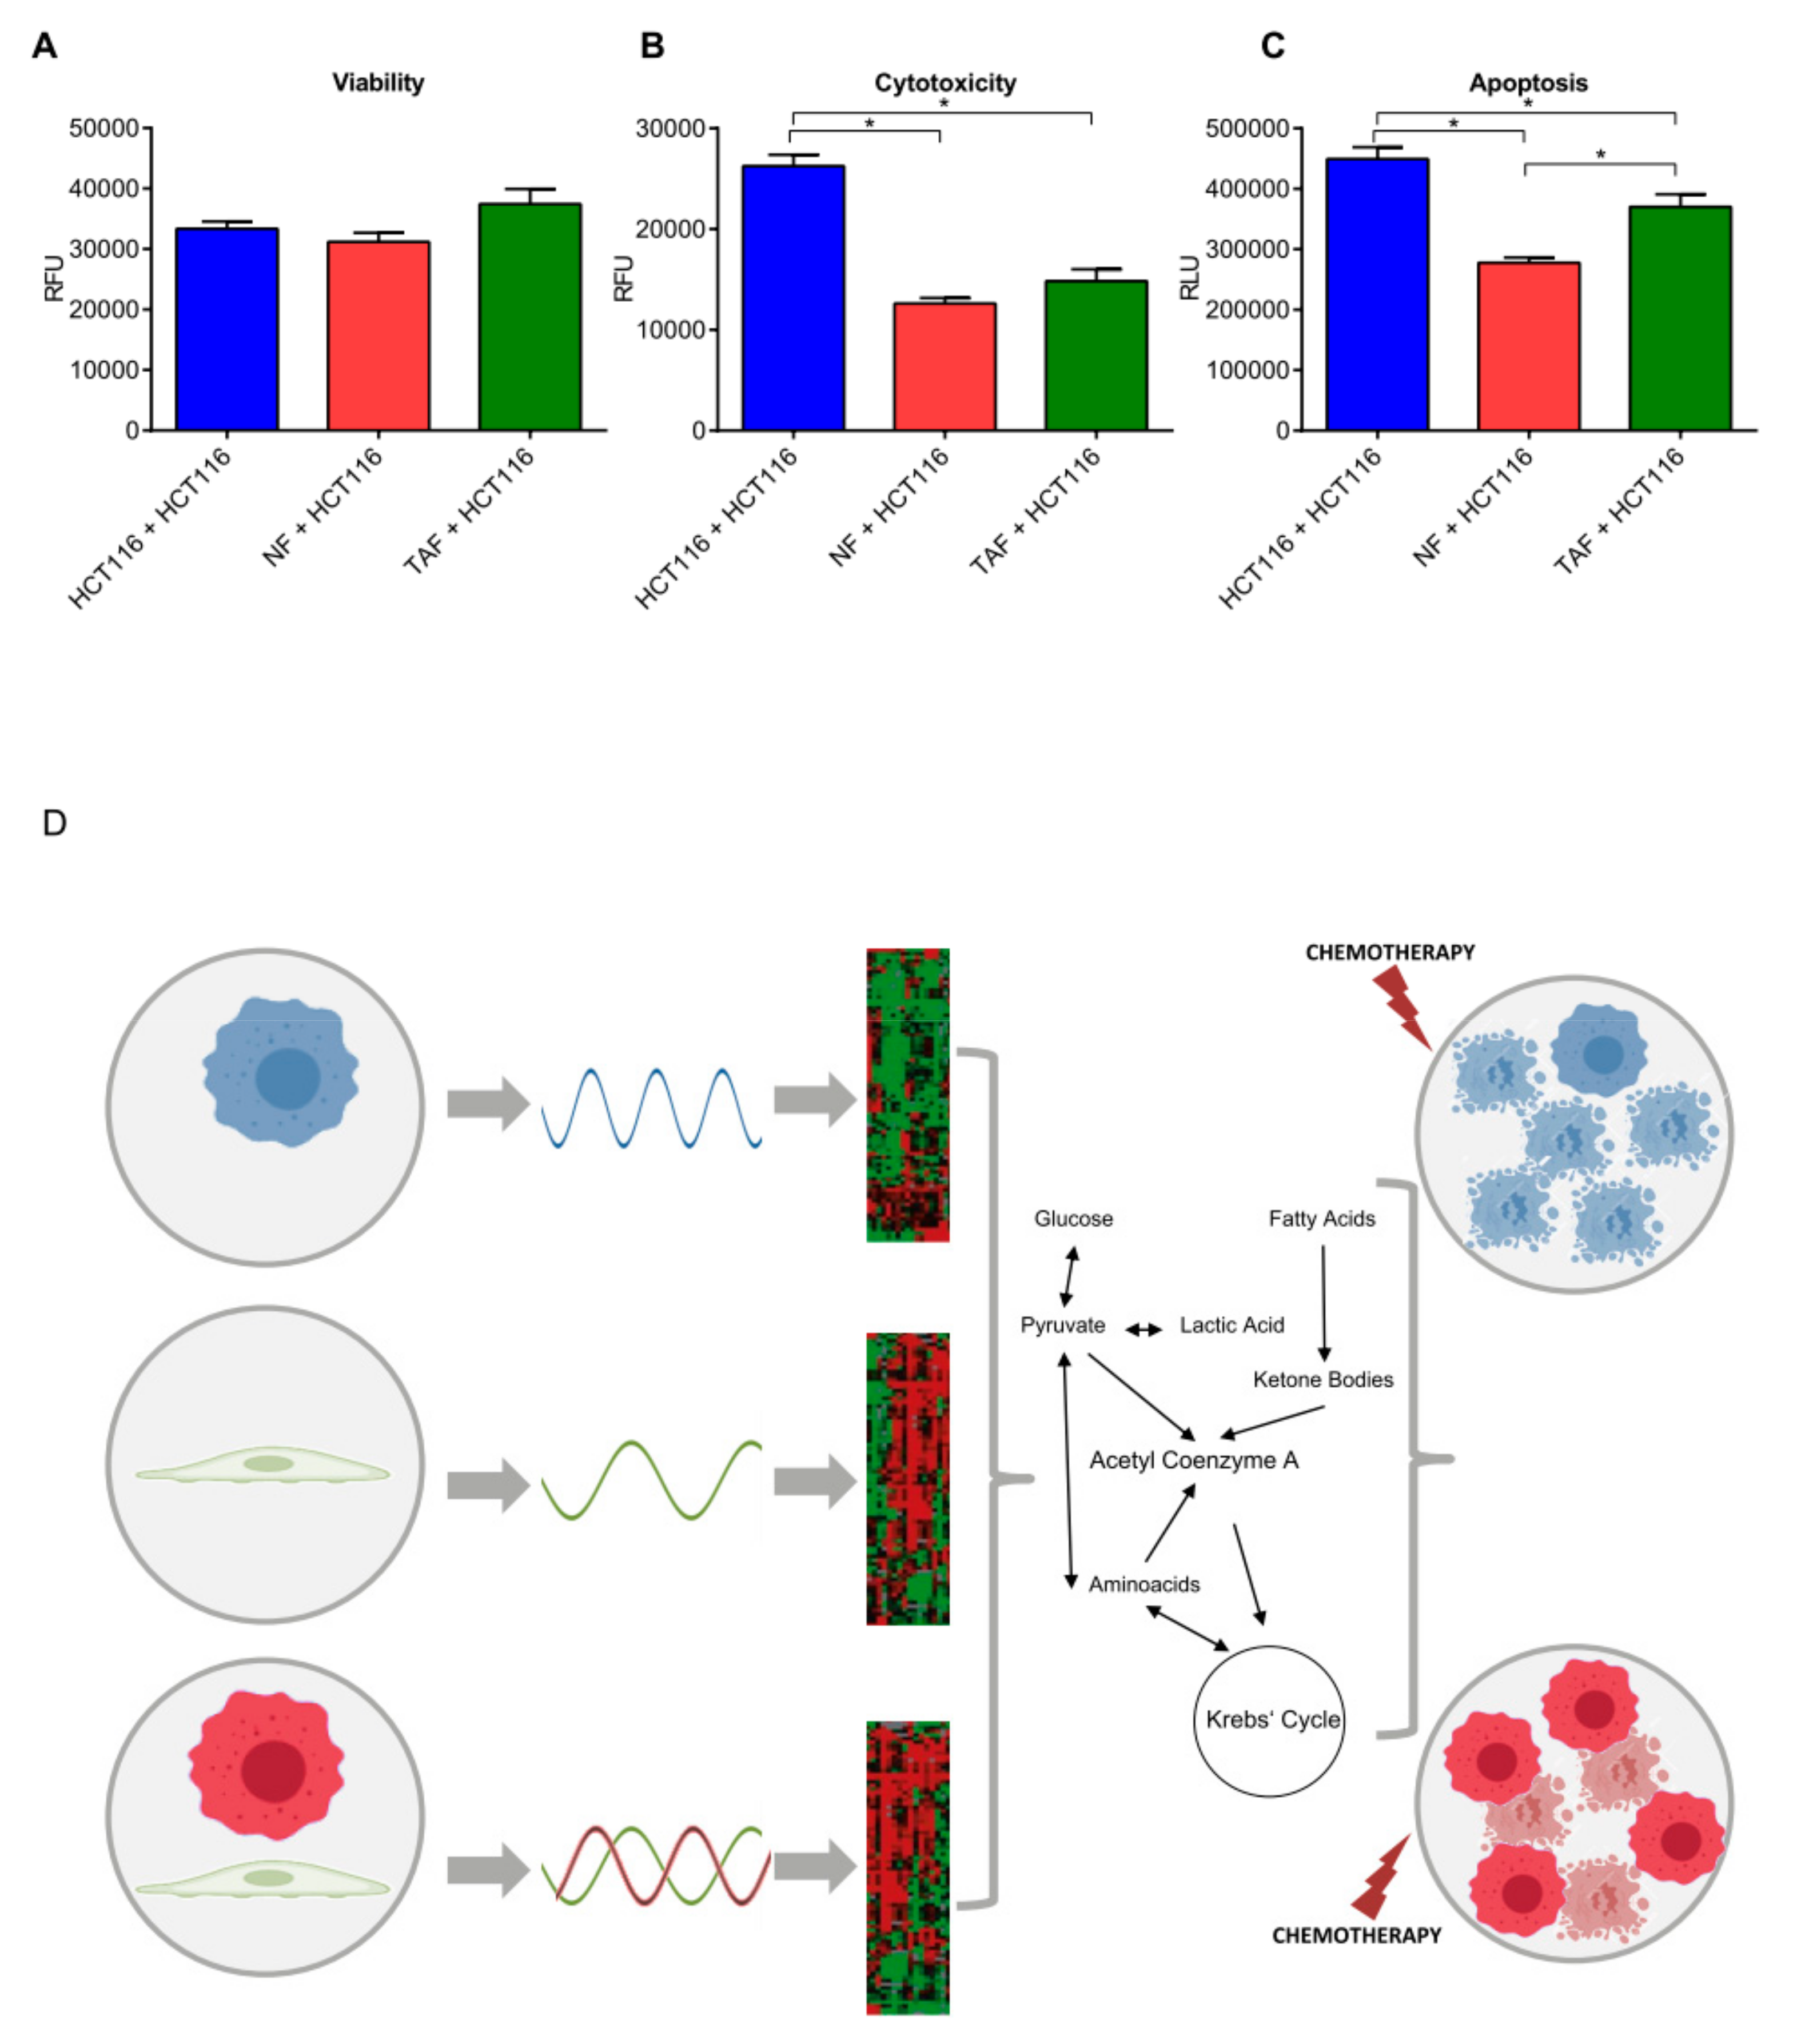
2.3. Circadian Changes Induced by Primary Fibroblasts Impact Metabolism, Proliferation, Viability, Cytotoxicity, and Apoptosis in HCT116 Cells
3. Discussion
Cell-to-Cell Communication Impacts on the Circadian Phenotype
4. Materials and Methods
4.1. Cell Culture
4.2. Lentivirus Production
4.3. Transduction with Lentiviral Vectors
4.4. Cell Culture for Bioluminescence Measurements
4.5. Co-Culture, Synchronization, and Bioluminescence Measurements of Circadian Rhythms
4.6. RNA Extraction and First-Strand cDNA Synthesis
4.7. Quantitative Real-Time Reverse Transcription PCR Assay
4.8. Western Blotting
4.9. Measurements of Cellular Response to TNF-α Challenge
4.10. Glycolytic Function
4.11. Mitochondrial Function
4.12. Measurement of Cell Viability, Cytotoxicity, and Apoptosis
4.13. Statistical Analysis
5. Conclusions
Supplementary Materials
Author Contributions
Funding
Acknowledgments
Conflicts of Interest
References
- Torre, L.A.; Bray, F.; Siegel, R.L.; Ferlay, J.; Lortet-Tieulent, J.; Jemal, A. Global cancer statistics, 2012. CA Cancer J. Clin. 2015, 65, 87–108. [Google Scholar] [CrossRef] [PubMed]
- Sasieni, P.D.; Shelton, J.; Ormiston-Smith, N.; Thomson, C.S.; Silcocks, P.B. What is the lifetime risk of developing cancer?: The effect of adjusting for multiple primaries. Br. J. Cancer 2011, 105, 460–465. [Google Scholar] [CrossRef] [PubMed]
- Rozen, P.; Liphshitz, I.; Barchana, M. The changing epidemiology of colorectal cancer and its relevance for adapting screening guidelines and methods. Eur. J. Cancer Prev. 2011, 20, 46–53. [Google Scholar] [CrossRef] [PubMed]
- Kalimuthu, S.N.; Chelliah, A.; Chetty, R. From traditional serrated adenoma to tubulovillous adenoma and beyond. World J. Gastrointest. Oncol 2016, 8, 805–809. [Google Scholar] [CrossRef] [PubMed]
- Kobayashi, H.; Enomoto, A.; Woods, S.L.; Burt, A.D.; Takahashi, M.; Worthley, D.L. Cancer-associated fibroblasts in gastrointestinal cancer. Nat. Rev. Gastroenterol. Hepatol. 2019, 16, 282–295. [Google Scholar] [CrossRef] [PubMed]
- Jeong, S.Y.; Lee, J.H.; Shin, Y.; Chung, S.; Kuh, H.J. Co-Culture of Tumor Spheroids and Fibroblasts in a Collagen Matrix-Incorporated Microfluidic Chip Mimics Reciprocal Activation in Solid Tumor Microenvironment. PLoS ONE 2016, 11, e0159013. [Google Scholar] [CrossRef]
- Khawar, I.A.; Kim, J.H.; Kuh, H.J. Improving drug delivery to solid tumors: Priming the tumor microenvironment. J. Control. Release 2015, 201, 78–89. [Google Scholar] [CrossRef]
- Zeng, Z.L.; Luo, H.Y.; Yang, J.; Wu, W.J.; Chen, D.L.; Huang, P.; Xu, R.H. Overexpression of the circadian clock gene Bmal1 increases sensitivity to oxaliplatin in colorectal cancer. Clin. Cancer Res. 2014, 20, 1042–1052. [Google Scholar] [CrossRef]
- Wilson, T.R.; Fridlyand, J.; Yan, Y.; Penuel, E.; Burton, L.; Chan, E.; Peng, J.; Lin, E.; Wang, Y.; Sosman, J.; et al. Widespread potential for growth-factor-driven resistance to anticancer kinase inhibitors. Nature 2012, 487, 505–509. [Google Scholar] [CrossRef]
- Straussman, R.; Morikawa, T.; Shee, K.; Barzily-Rokni, M.; Qian, Z.R.; Du, J.; Davis, A.; Mongare, M.M.; Gould, J.; Frederick, D.T.; et al. Tumour micro-environment elicits innate resistance to RAF inhibitors through HGF secretion. Nature 2012, 487, 500–504. [Google Scholar] [CrossRef]
- Berdiel-Acer, M.; Berenguer, A.; Sanz-Pamplona, R.; Cuadras, D.; Sanjuan, X.; Paules, M.J.; Santos, C.; Salazar, R.; Moreno, V.; Capella, G.; et al. A 5-gene classifier from the carcinoma-associated fibroblast transcriptomic profile and clinical outcome in colorectal cancer. Oncotarget 2014, 5, 6437–6452. [Google Scholar] [CrossRef] [PubMed]
- Albrecht, U. Timing to perfection: The biology of central and peripheral circadian clocks. Neuron 2012, 74, 246–260. [Google Scholar] [CrossRef] [PubMed]
- Lowrey, P.L.; Takahashi, J.S. Genetics of circadian rhythms in Mammalian model organisms. Adv. Genet. 2011, 74, 175–230. [Google Scholar] [PubMed]
- Dibner, C.; Schibler, U.; Albrecht, U. The mammalian circadian timing system: Organization and coordination of central and peripheral clocks. Annu. Rev. Physiol. 2010, 72, 517–549. [Google Scholar] [CrossRef] [PubMed]
- Fuhr, L.; Abreu, M.; Pett, P.; Relogio, A. Circadian systems biology: When time matters. Comput. Struct. Biotechnol. J. 2015, 13, 417–426. [Google Scholar] [CrossRef] [PubMed]
- Mazzoccoli, G.; Pazienza, V.; Panza, A.; Valvano, M.R.; Benegiamo, G.; Vinciguerra, M.; Andriulli, A.; Piepoli, A. ARNTL2 and SERPINE1: Potential biomarkers for tumor aggressiveness in colorectal cancer. J. Cancer Res. Clin. Oncol. 2012, 138, 501–511. [Google Scholar] [CrossRef]
- El-Athman, R.; Genov, N.N.; Mazuch, J.; Zhang, K.; Yu, Y.; Fuhr, L.; Abreu, M.; Li, Y.; Wallach, T.; Kramer, A.; et al. The Ink4a/Arf locus operates as a regulator of the circadian clock modulating RAS activity. PLoS Biol. 2017, 15, e2002940. [Google Scholar] [CrossRef]
- Mazzoccoli, G.; Vinciguerra, M.; Papa, G.; Piepoli, A. Circadian clock circuitry in colorectal cancer. World J. Gastroenterol. 2014, 20, 4197–4207. [Google Scholar] [CrossRef]
- Mazzoccoli, G.; Piepoli, A.; Carella, M.; Panza, A.; Pazienza, V.; Benegiamo, G.; Palumbo, O.; Ranieri, E. Altered expression of the clock gene machinery in kidney cancer patients. Biomed. Pharmacother. 2012, 66, 175–179. [Google Scholar] [CrossRef]
- Fuhr, L.; El-Athman, R.; Scrima, R.; Cela, O.; Carbone, A.; Knoop, H.; Li, Y.; Hoffmann, K.; Laukkanen, M.O.; Corcione, F.; et al. The Circadian Clock Regulates Metabolic Phenotype Rewiring Via HKDC1 and Modulates Tumor Progression and Drug Response in Colorectal Cancer. EBioMedicine 2018, 33, 105–121. [Google Scholar] [CrossRef]
- Liu, B.; Xu, K.; Jiang, Y.; Li, X. Aberrant expression of Per1, Per2 and Per3 and their prognostic relevance in non-small cell lung cancer. Int. J. Clin. Exp. Pathol. 2014, 7, 7863–7871. [Google Scholar] [PubMed]
- Chen, S.T.; Choo, K.B.; Hou, M.F.; Yeh, K.T.; Kuo, S.J.; Chang, J.G. Deregulated expression of the PER1, PER2 and PER3 genes in breast cancers. Carcinogenesis 2005, 26, 1241–1246. [Google Scholar] [CrossRef] [PubMed]
- Destici, E.; Oklejewicz, M.; Saito, S.; van der Horst, G.T. Mammalian cryptochromes impinge on cell cycle progression in a circadian clock-independent manner. Cell Cycle 2011, 10, 3788–3797. [Google Scholar] [CrossRef] [PubMed]
- Gorbacheva, V.Y.; Kondratov, R.V.; Zhang, R.; Cherukuri, S.; Gudkov, A.V.; Takahashi, J.S.; Antoch, M.P. Circadian sensitivity to the chemotherapeutic agent cyclophosphamide depends on the functional status of the CLOCK/BMAL1 transactivation complex. Proc. Natl. Acad. Sci. USA 2005, 102, 3407–3412. [Google Scholar] [CrossRef] [PubMed]
- Wang, Y.; Qian, R.; Sun, N.; Lu, C.; Chen, Z.; Hua, L. Circadian gene hClock enhances proliferation and inhibits apoptosis of human colorectal carcinoma cells in vitro and in vivo. Mol. Med. Rep. 2015, 11, 4204–4210. [Google Scholar] [CrossRef] [PubMed]
- Grechez-Cassiau, A.; Rayet, B.; Guillaumond, F.; Teboul, M.; Delaunay, F. The circadian clock component BMAL1 is a critical regulator of p21WAF1/CIP1 expression and hepatocyte proliferation. J. Biol. Chem. 2008, 283, 4535–4542. [Google Scholar] [CrossRef]
- Mullenders, J.; Fabius, A.W.; Madiredjo, M.; Bernards, R.; Beijersbergen, R.L. A large scale shRNA barcode screen identifies the circadian clock component ARNTL as putative regulator of the p53 tumor suppressor pathway. PLoS ONE 2009, 4, e4798. [Google Scholar] [CrossRef] [PubMed]
- Matsuo, T.; Yamaguchi, S.; Mitsui, S.; Emi, A.; Shimoda, F.; Okamura, H. Control mechanism of the circadian clock for timing of cell division in vivo. Science 2003, 302, 255–259. [Google Scholar] [CrossRef] [PubMed]
- Gauger, M.A.; Sancar, A. Cryptochrome, circadian cycle, cell cycle checkpoints, and cancer. Cancer Res. 2005, 65, 6828–6834. [Google Scholar] [CrossRef]
- Mazzoccoli, G.; Colangelo, T.; Panza, A.; Rubino, R.; De Cata, A.; Tiberio, C.; Valvano, M.R.; Pazienza, V.; Merla, G.; Augello, B.; et al. Deregulated expression of cryptochrome genes in human colorectal cancer. Mol. Cancer 2016, 15, 6. [Google Scholar] [CrossRef]
- Mazza, T.; Mazzoccoli, G.; Fusilli, C.; Capocefalo, D.; Panza, A.; Biagini, T.; Castellana, S.; Gentile, A.; De Cata, A.; Palumbo, O.; et al. Multifaceted enrichment analysis of RNA-RNA crosstalk reveals cooperating micro-societies in human colorectal cancer. Nucleic Acids Res. 2016, 44, 4025–4036. [Google Scholar] [CrossRef] [PubMed]
- Colangelo, T.; Polcaro, G.; Muccillo, L.; D’Agostino, G.; Rosato, V.; Ziccardi, P.; Lupo, A.; Mazzoccoli, G.; Sabatino, L.; Colantuoni, V. Friend or foe? The tumour microenvironment dilemma in colorectal cancer. Biochim. Biophys. Acta Rev. Cancer 2017, 1867, 1–18. [Google Scholar] [CrossRef] [PubMed]
- Colangelo, T.; Polcaro, G.; Ziccardi, P.; Muccillo, L.; Galgani, M.; Pucci, B.; Milone, M.R.; Budillon, A.; Santopaolo, M.; Mazzoccoli, G.; et al. The miR-27a-calreticulin axis affects drug-induced immunogenic cell death in human colorectal cancer cells. Cell Death Dis. 2016, 7, e2108. [Google Scholar] [CrossRef] [PubMed]
- Mazzoccoli, G.; Colangelo, T.; Panza, A.; Rubino, R.; Tiberio, C.; Palumbo, O.; Carella, M.; Trombetta, D.; Gentile, A.; Tavano, F.; et al. Analysis of clock gene-miRNA correlation networks reveals candidate drivers in colorectal cancer. Oncotarget 2016, 7, 45444–45461. [Google Scholar] [CrossRef] [PubMed]
- Panza, A.; Votino, C.; Gentile, A.; Valvano, M.R.; Colangelo, T.; Pancione, M.; Micale, L.; Merla, G.; Andriulli, A.; Sabatino, L.; et al. Peroxisome proliferator-activated receptor gamma-mediated induction of microRNA-145 opposes tumor phenotype in colorectal cancer. Biochim. Biophys. Acta 2014, 1843, 1225–1236. [Google Scholar] [CrossRef] [PubMed]
- Pazienza, V.; Piepoli, A.; Panza, A.; Valvano, M.R.; Benegiamo, G.; Vinciguerra, M.; Andriulli, A.; Mazzoccoli, G. SIRT1 and the clock gene machinery in colorectal cancer. Cancer Investig. 2012, 30, 98–105. [Google Scholar] [CrossRef]
- Mazzoccoli, G.; Panza, A.; Valvano, M.R.; Palumbo, O.; Carella, M.; Pazienza, V.; Biscaglia, G.; Tavano, F.; Di Sebastiano, P.; Andriulli, A.; et al. Clock gene expression levels and relationship with clinical and pathological features in colorectal cancer patients. Chronobiol Int. 2011, 28, 841–851. [Google Scholar] [CrossRef] [PubMed]
- Relogio, A.; Thomas, P.; Medina-Perez, P.; Reischl, S.; Bervoets, S.; Gloc, E.; Riemer, P.; Mang-Fatehi, S.; Maier, B.; Schafer, R.; et al. Ras-mediated deregulation of the circadian clock in cancer. PLoS Genet. 2014, 10, e1004338. [Google Scholar] [CrossRef]
- Cermakian, N.; Lange, T.; Golombek, D.; Sarkar, D.; Nakao, A.; Shibata, S.; Mazzoccoli, G. Crosstalk between the circadian clock circuitry and the immune system. Chronobiol. Int. 2013, 30, 870–888. [Google Scholar] [CrossRef]
- Abreu, M.; Basti, A.; Genov, N.; Mazzoccoli, G.; Relogio, A. The reciprocal interplay between TNFalpha and the circadian clock impacts on cell proliferation and migration in Hodgkin lymphoma cells. Sci. Rep. 2018, 8, 11474. [Google Scholar] [CrossRef]
- Xing, F.; Saidou, J.; Watabe, K. Cancer associated fibroblasts (CAFs) in tumor microenvironment. Front. Biosci. (Landmark Ed.) 2010, 15, 166–179. [Google Scholar] [CrossRef] [PubMed]
- Kalluri, R. The biology and function of fibroblasts in cancer. Nat. Rev. Cancer 2016, 16, 582–598. [Google Scholar] [CrossRef] [PubMed]
- Cammarota, F.; Laukkanen, M.O. Mesenchymal Stem/Stromal Cells in Stromal Evolution and Cancer Progression. Stem Cells Int. 2016, 2016, 4824573. [Google Scholar] [CrossRef] [PubMed]
- Matsunaga, N.; Ogino, T.; Hara, Y.; Tanaka, T.; Koyanagi, S.; Ohdo, S. Optimized Dosing Schedule Based on Circadian Dynamics of Mouse Breast Cancer Stem Cells Improves the Antitumor Effects of Aldehyde Dehydrogenase Inhibitor. Cancer Res. 2018, 78, 3698–3708. [Google Scholar] [PubMed]
- Parascandolo, A.; Rappa, F.; Cappello, F.; Kim, J.; Cantu, D.A.; Chen, H.; Mazzoccoli, G.; Hematti, P.; Castellone, M.D.; Salvatore, M.; et al. Extracellular Superoxide Dismutase Expression in Papillary Thyroid Cancer Mesenchymal Stem/Stromal Cells Modulates Cancer Cell Growth and Migration. Sci. Rep. 2017, 7, 41416. [Google Scholar] [CrossRef] [PubMed]
- Castellone, M.D.; Laatikainen, L.E.; Laurila, J.P.; Langella, A.; Hematti, P.; Soricelli, A.; Salvatore, M.; Laukkanen, M.O. Brief report: Mesenchymal stromal cell atrophy in coculture increases aggressiveness of transformed cells. Stem Cells 2013, 31, 1218–1223. [Google Scholar] [CrossRef] [PubMed]
- Sporl, F.; Schellenberg, K.; Blatt, T.; Wenck, H.; Wittern, K.P.; Schrader, A.; Kramer, A. A circadian clock in HaCaT keratinocytes. J. Investig. Dermatol. 2011, 131, 338–348. [Google Scholar] [CrossRef]
- Dama, E.; Melocchi, V.; Dezi, F.; Pirroni, S.; Carletti, R.M.; Brambilla, D.; Bertalot, G.; Casiraghi, M.; Maisonneuve, P.; Barberis, M.; et al. An Aggressive Subtype of Stage I Lung Adenocarcinoma with Molecular and Prognostic Characteristics Typical of Advanced Lung Cancers. Clin. Cancer Res. 2017, 23, 62–72. [Google Scholar] [CrossRef]
- Lück, S.; Thurley, K.; Thaben, P.F.; Westermark, P.O. Rhythmic degradation explains and unifies circadian transcriptome and proteome data. Cell Rep. 2014, 9, 741–751. [Google Scholar] [CrossRef]


© 2019 by the authors. Licensee MDPI, Basel, Switzerland. This article is an open access article distributed under the terms and conditions of the Creative Commons Attribution (CC BY) license (http://creativecommons.org/licenses/by/4.0/).
Share and Cite
Fuhr, L.; Abreu, M.; Carbone, A.; El-Athman, R.; Bianchi, F.; Laukkanen, M.O.; Mazzoccoli, G.; Relógio, A. The Interplay between Colon Cancer Cells and Tumour-Associated Stromal Cells Impacts the Biological Clock and Enhances Malignant Phenotypes. Cancers 2019, 11, 988. https://doi.org/10.3390/cancers11070988
Fuhr L, Abreu M, Carbone A, El-Athman R, Bianchi F, Laukkanen MO, Mazzoccoli G, Relógio A. The Interplay between Colon Cancer Cells and Tumour-Associated Stromal Cells Impacts the Biological Clock and Enhances Malignant Phenotypes. Cancers. 2019; 11(7):988. https://doi.org/10.3390/cancers11070988
Chicago/Turabian StyleFuhr, Luise, Mónica Abreu, Annalucia Carbone, Rukeia El-Athman, Fabrizio Bianchi, Mikko O. Laukkanen, Gianluigi Mazzoccoli, and Angela Relógio. 2019. "The Interplay between Colon Cancer Cells and Tumour-Associated Stromal Cells Impacts the Biological Clock and Enhances Malignant Phenotypes" Cancers 11, no. 7: 988. https://doi.org/10.3390/cancers11070988
APA StyleFuhr, L., Abreu, M., Carbone, A., El-Athman, R., Bianchi, F., Laukkanen, M. O., Mazzoccoli, G., & Relógio, A. (2019). The Interplay between Colon Cancer Cells and Tumour-Associated Stromal Cells Impacts the Biological Clock and Enhances Malignant Phenotypes. Cancers, 11(7), 988. https://doi.org/10.3390/cancers11070988