Automated Definition of Skeletal Disease Burden in Metastatic Prostate Carcinoma: A 3D Analysis of SPECT/CT Images


 and
and
Abstract
1. Introduction
2. Results
2.1. Volumetric Assessment and Comparison between Systems
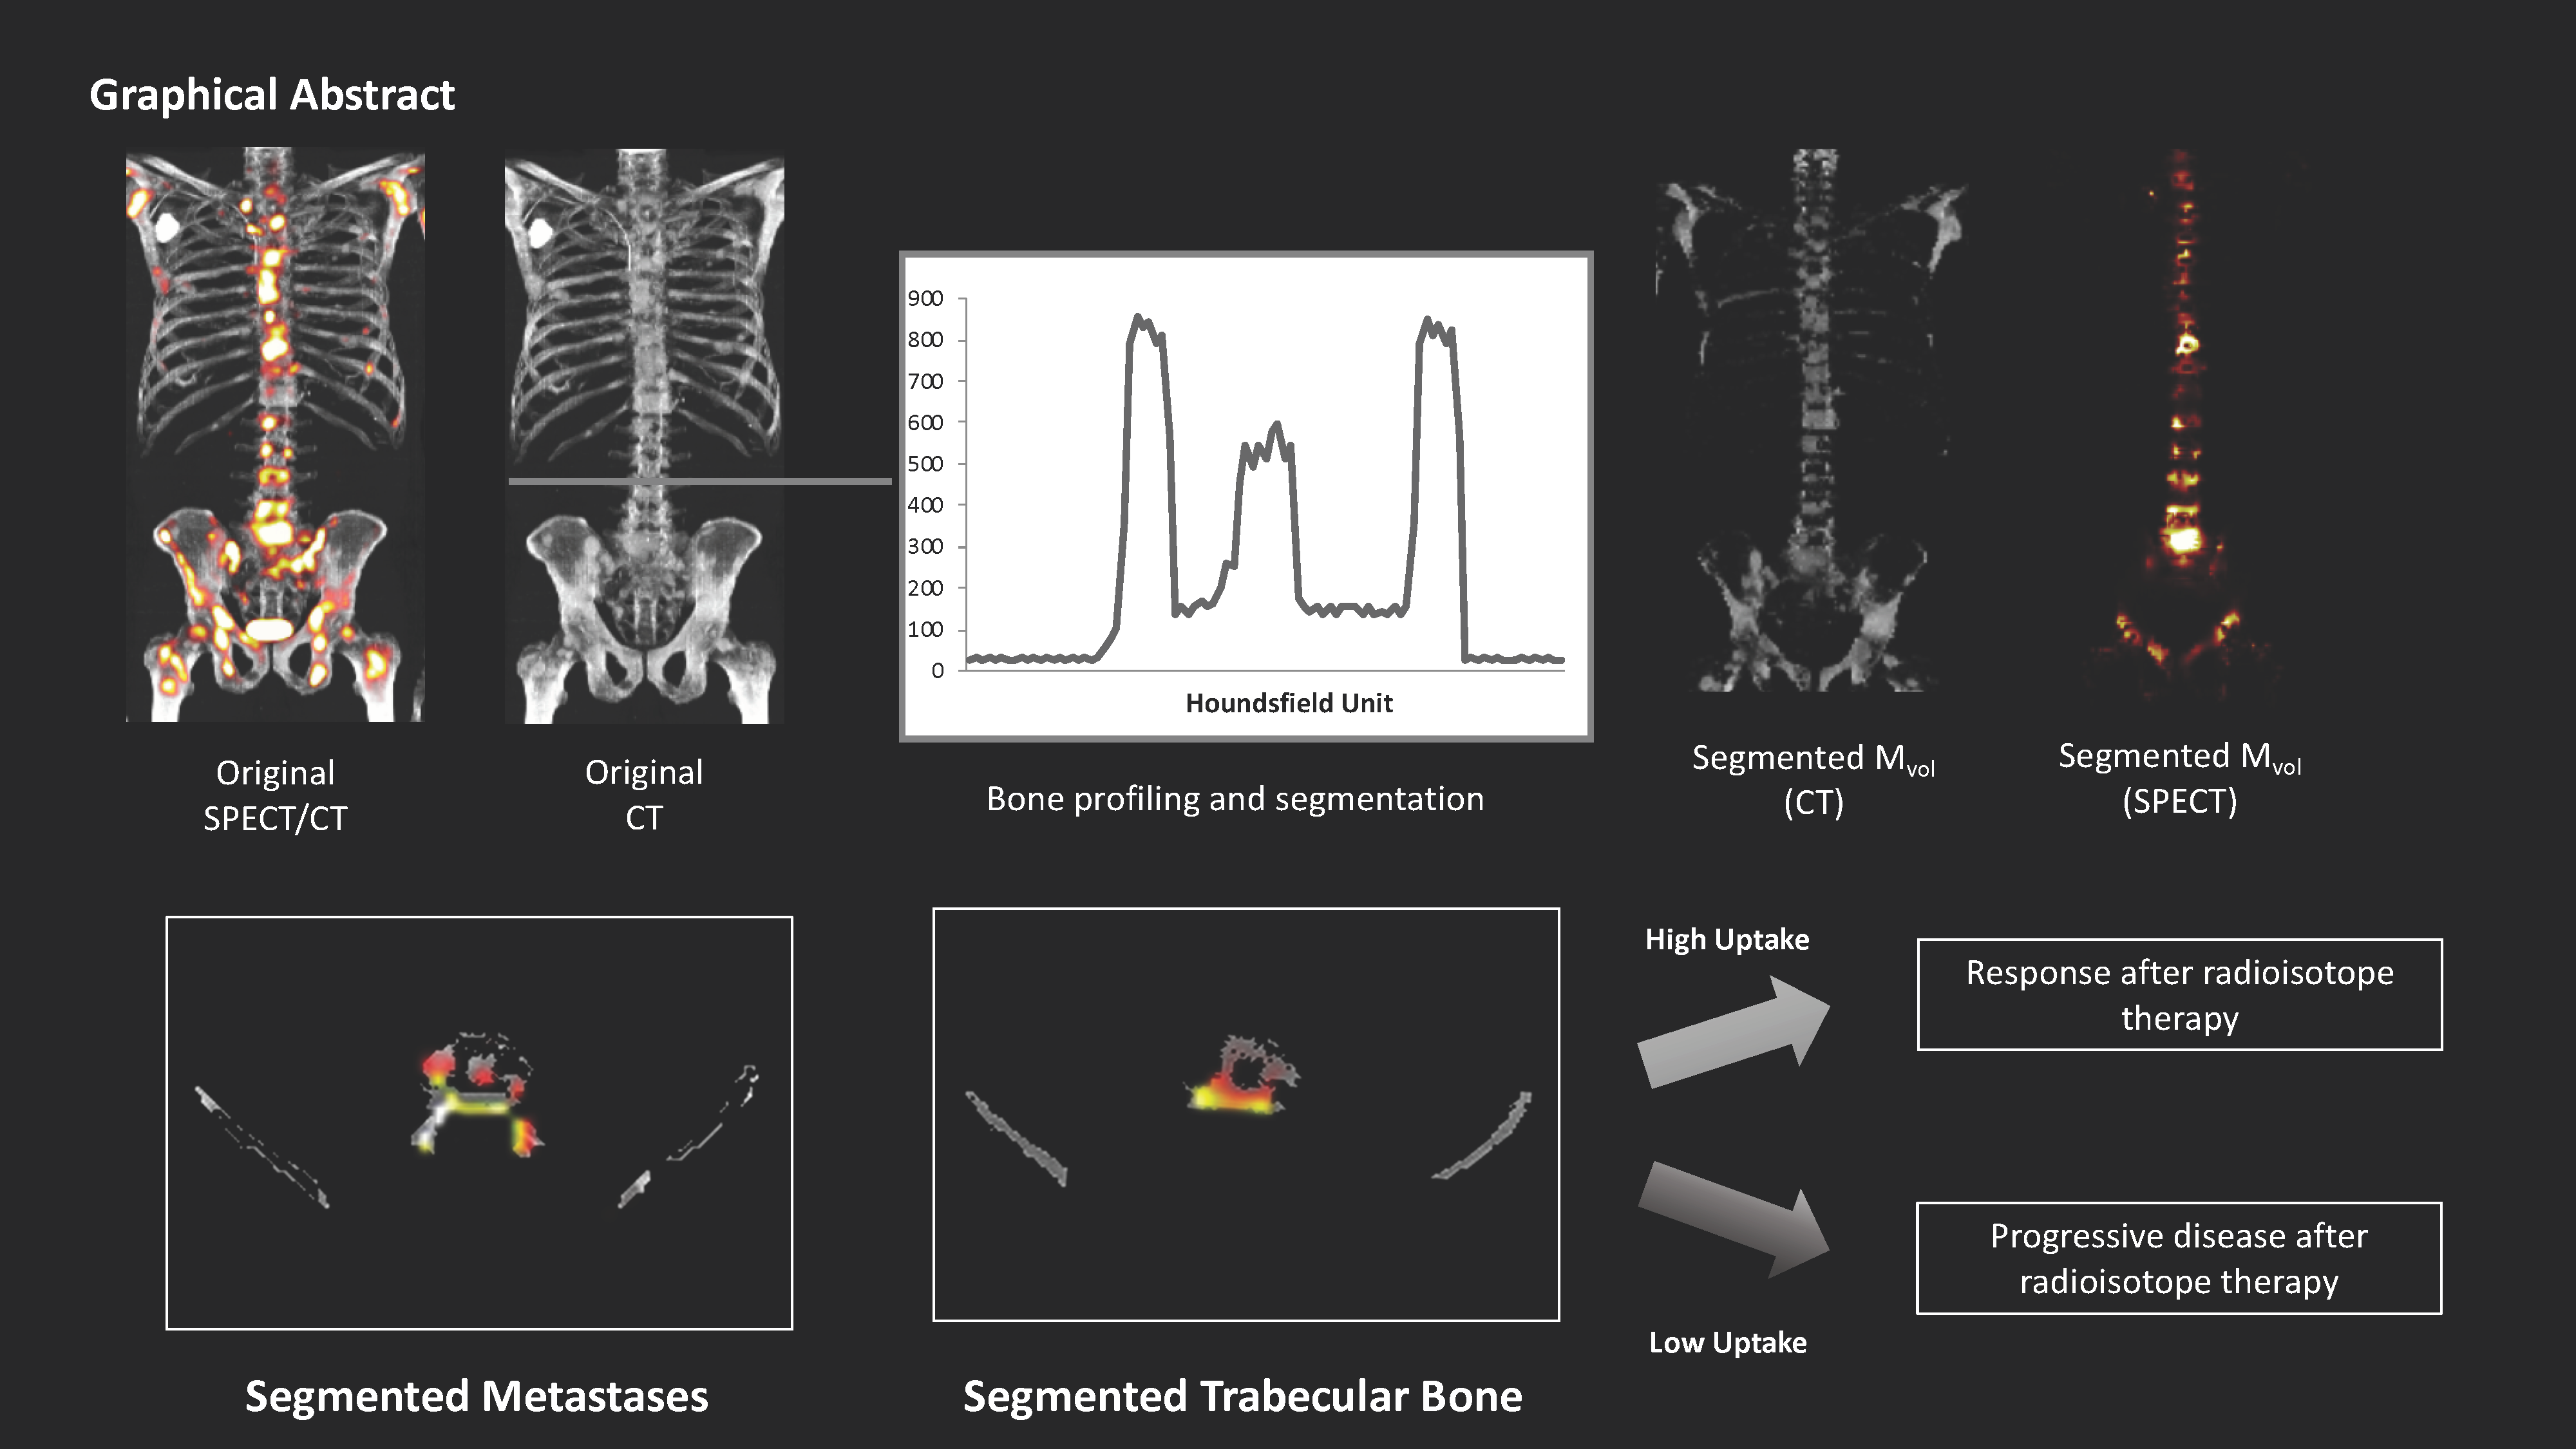
2.2. Volume Characteristics
2.3. Tumor Volume, Number of Lesions, and PSA Level
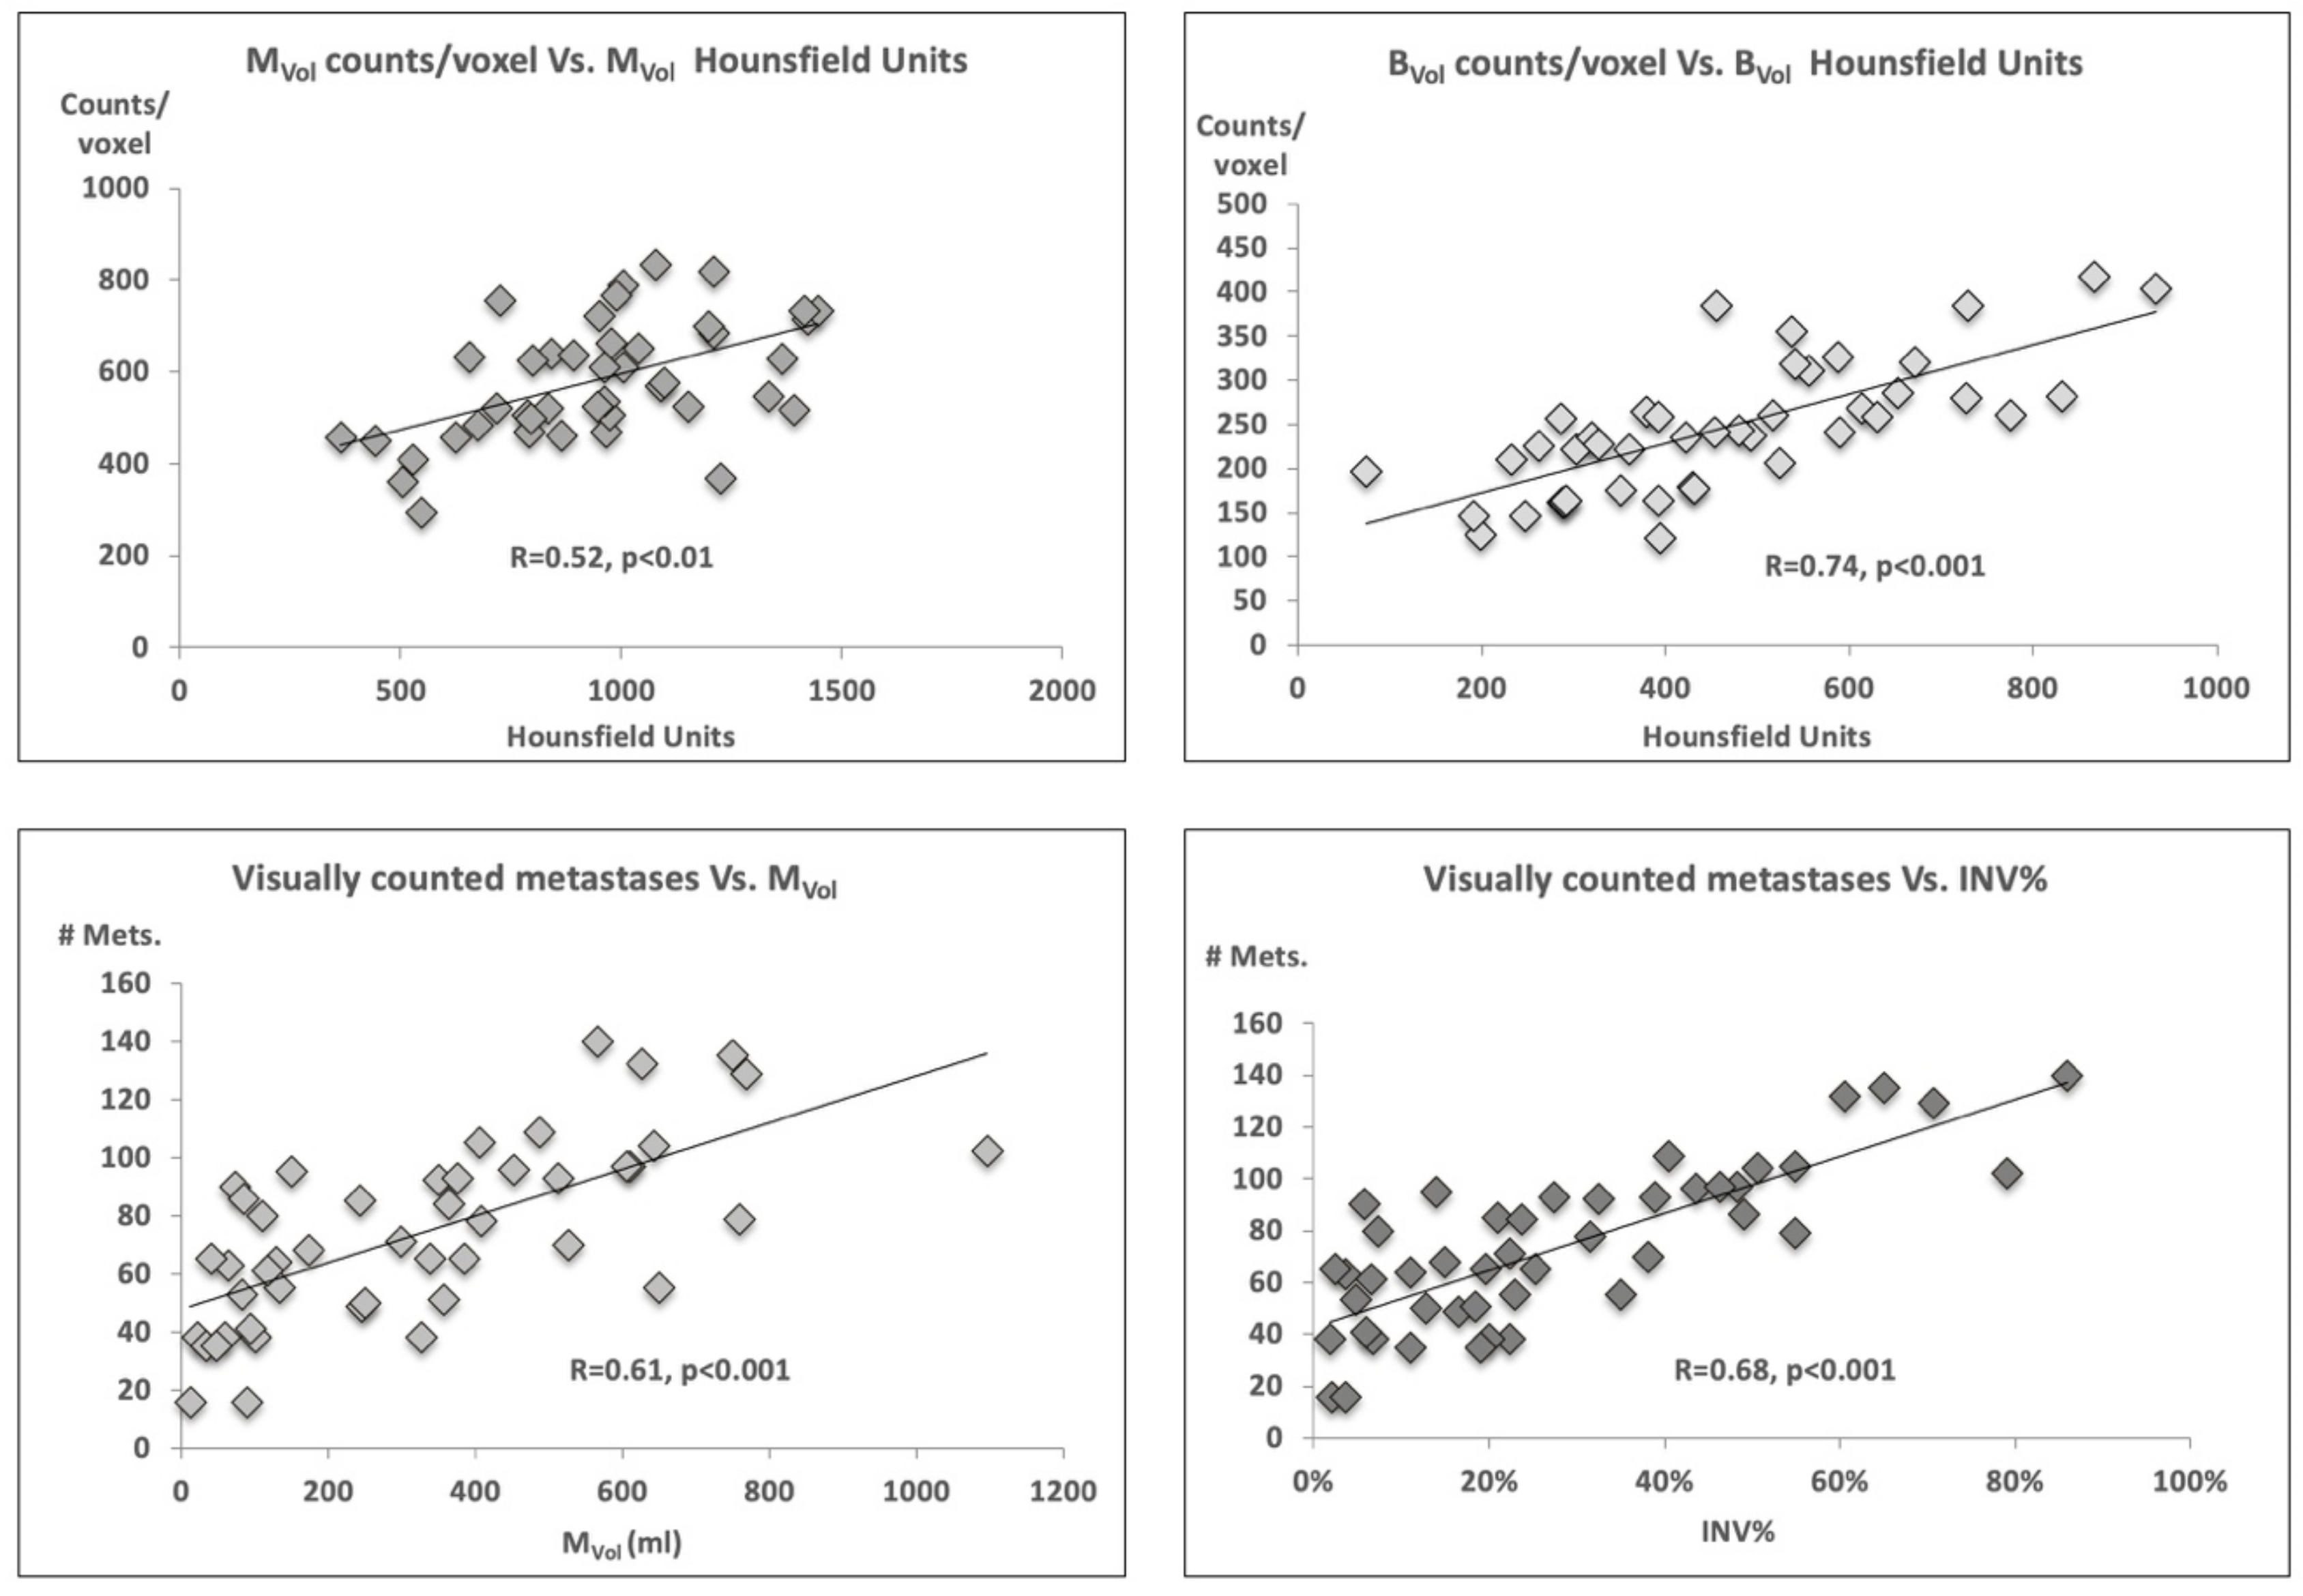
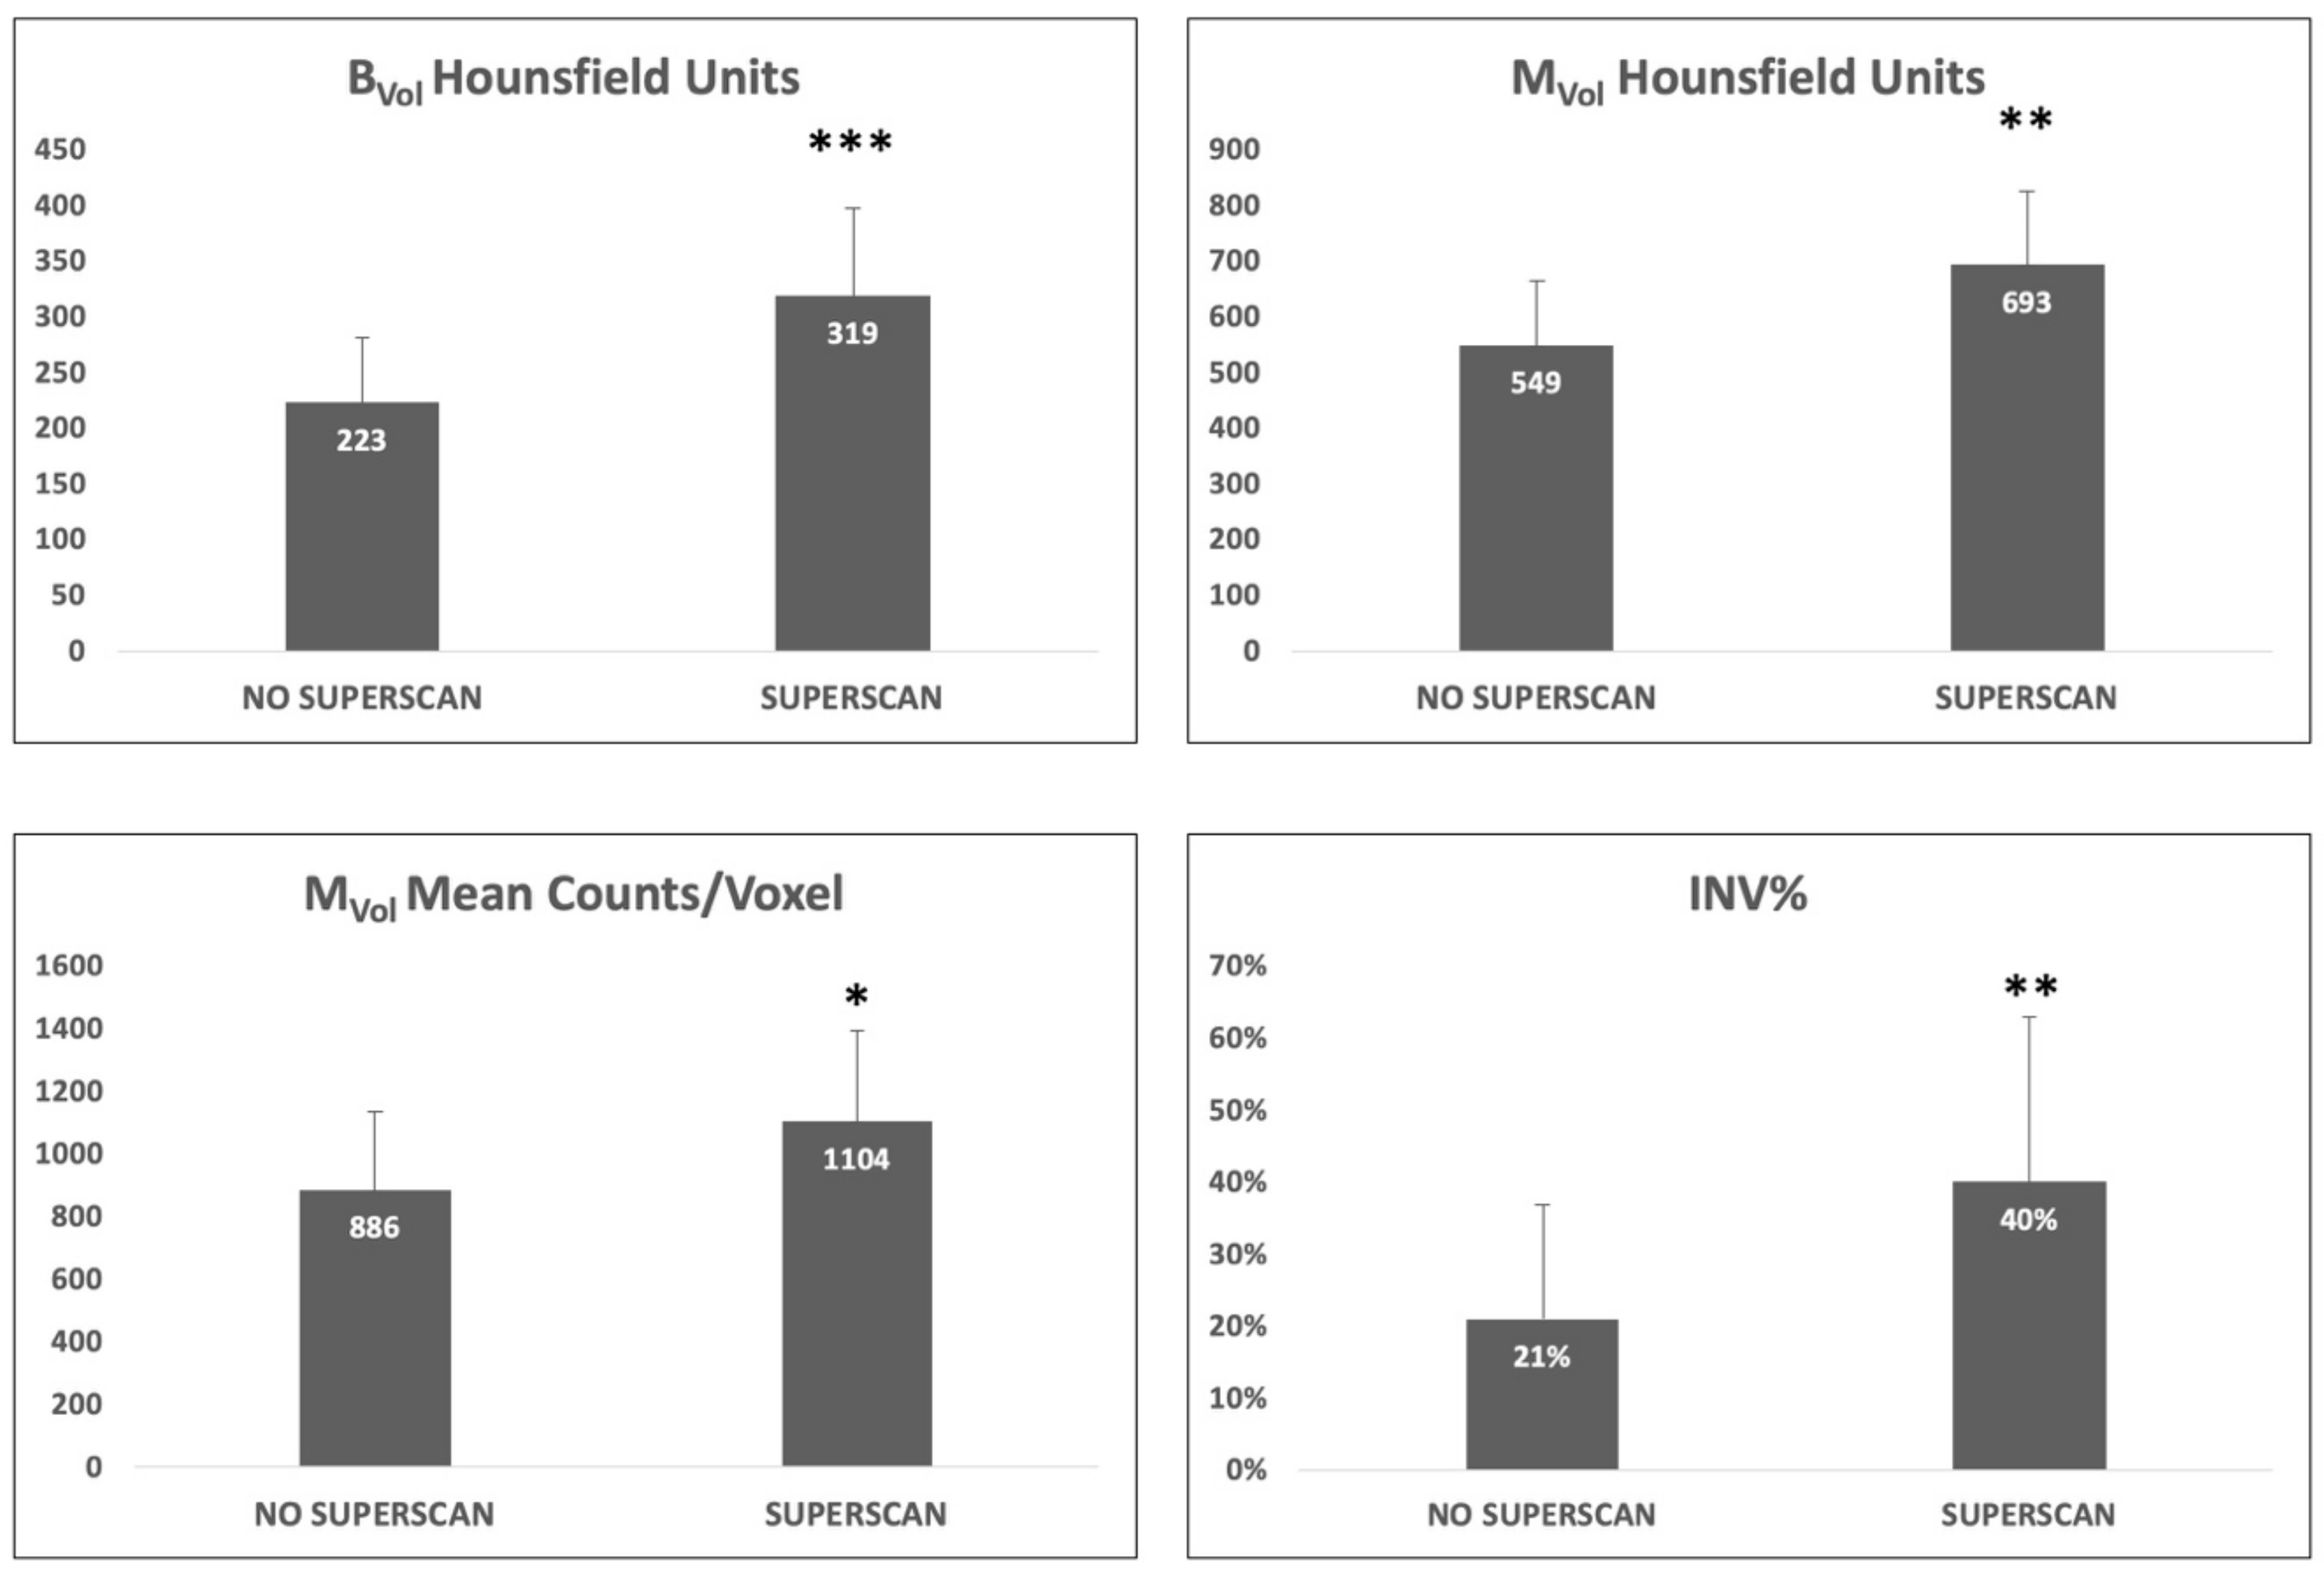
2.4. Impact of Superscan Status
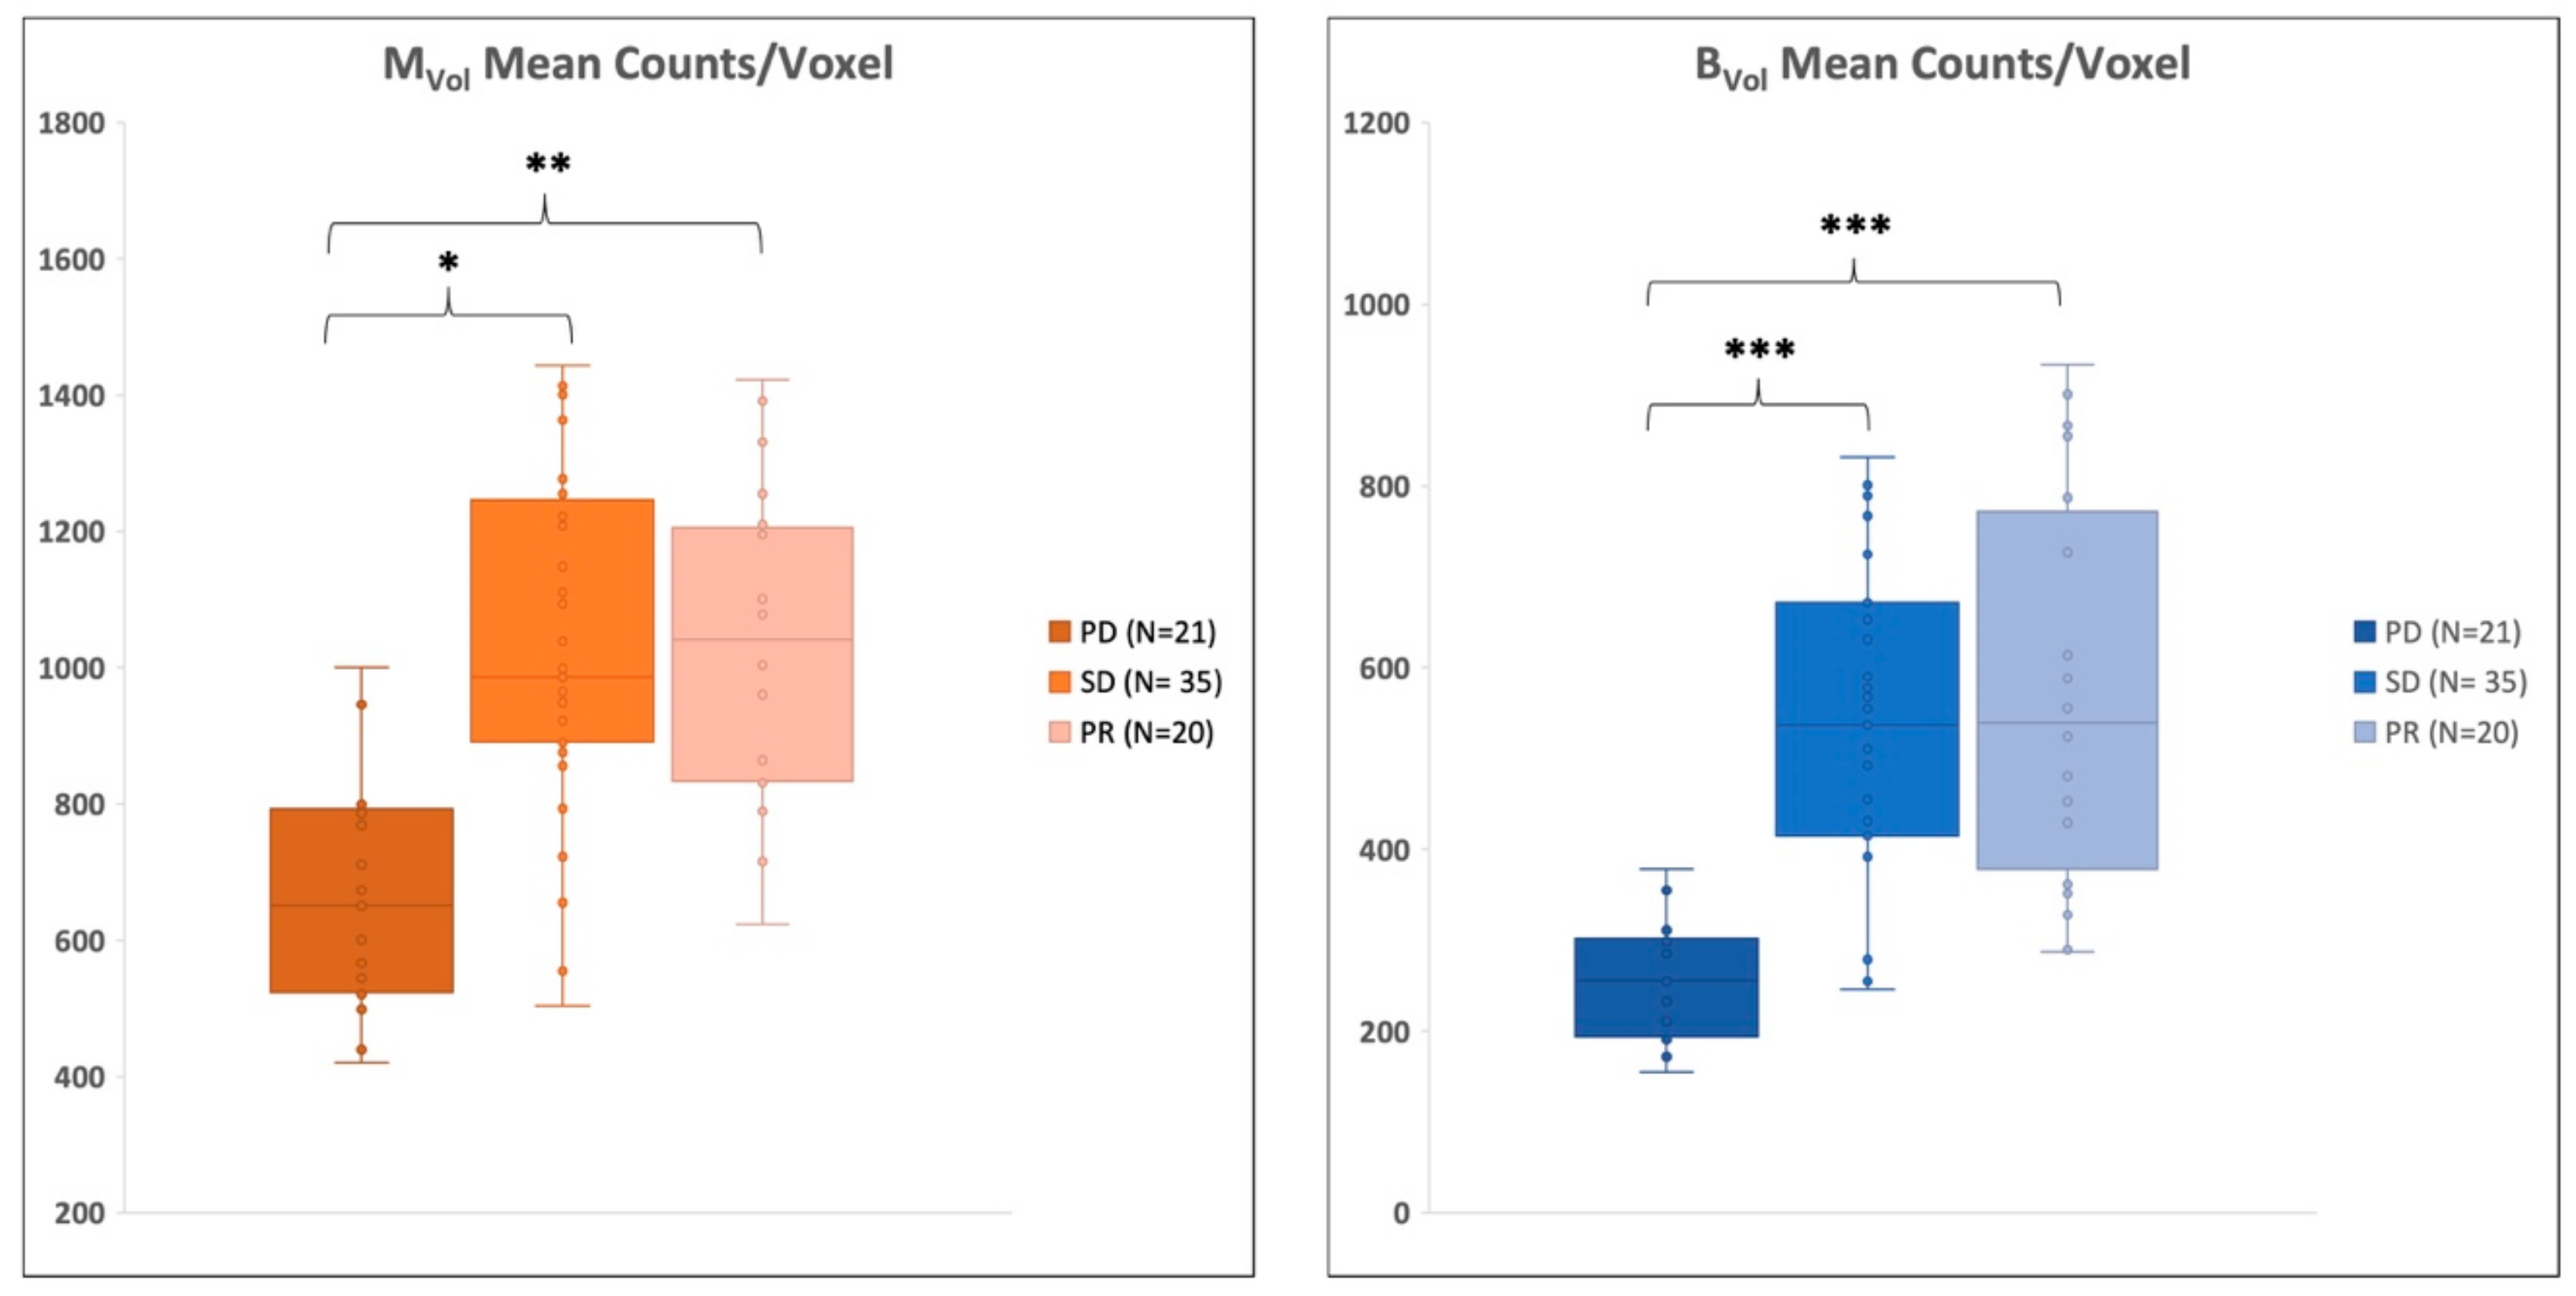
2.5. Therapy Response Assessment
3. Discussion
4. Materials and Methods
4.1. Patient Population
4.2. Patients’ Follow Up
4.3. Scan Protocol
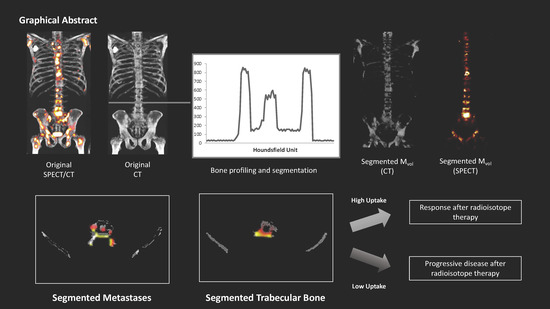
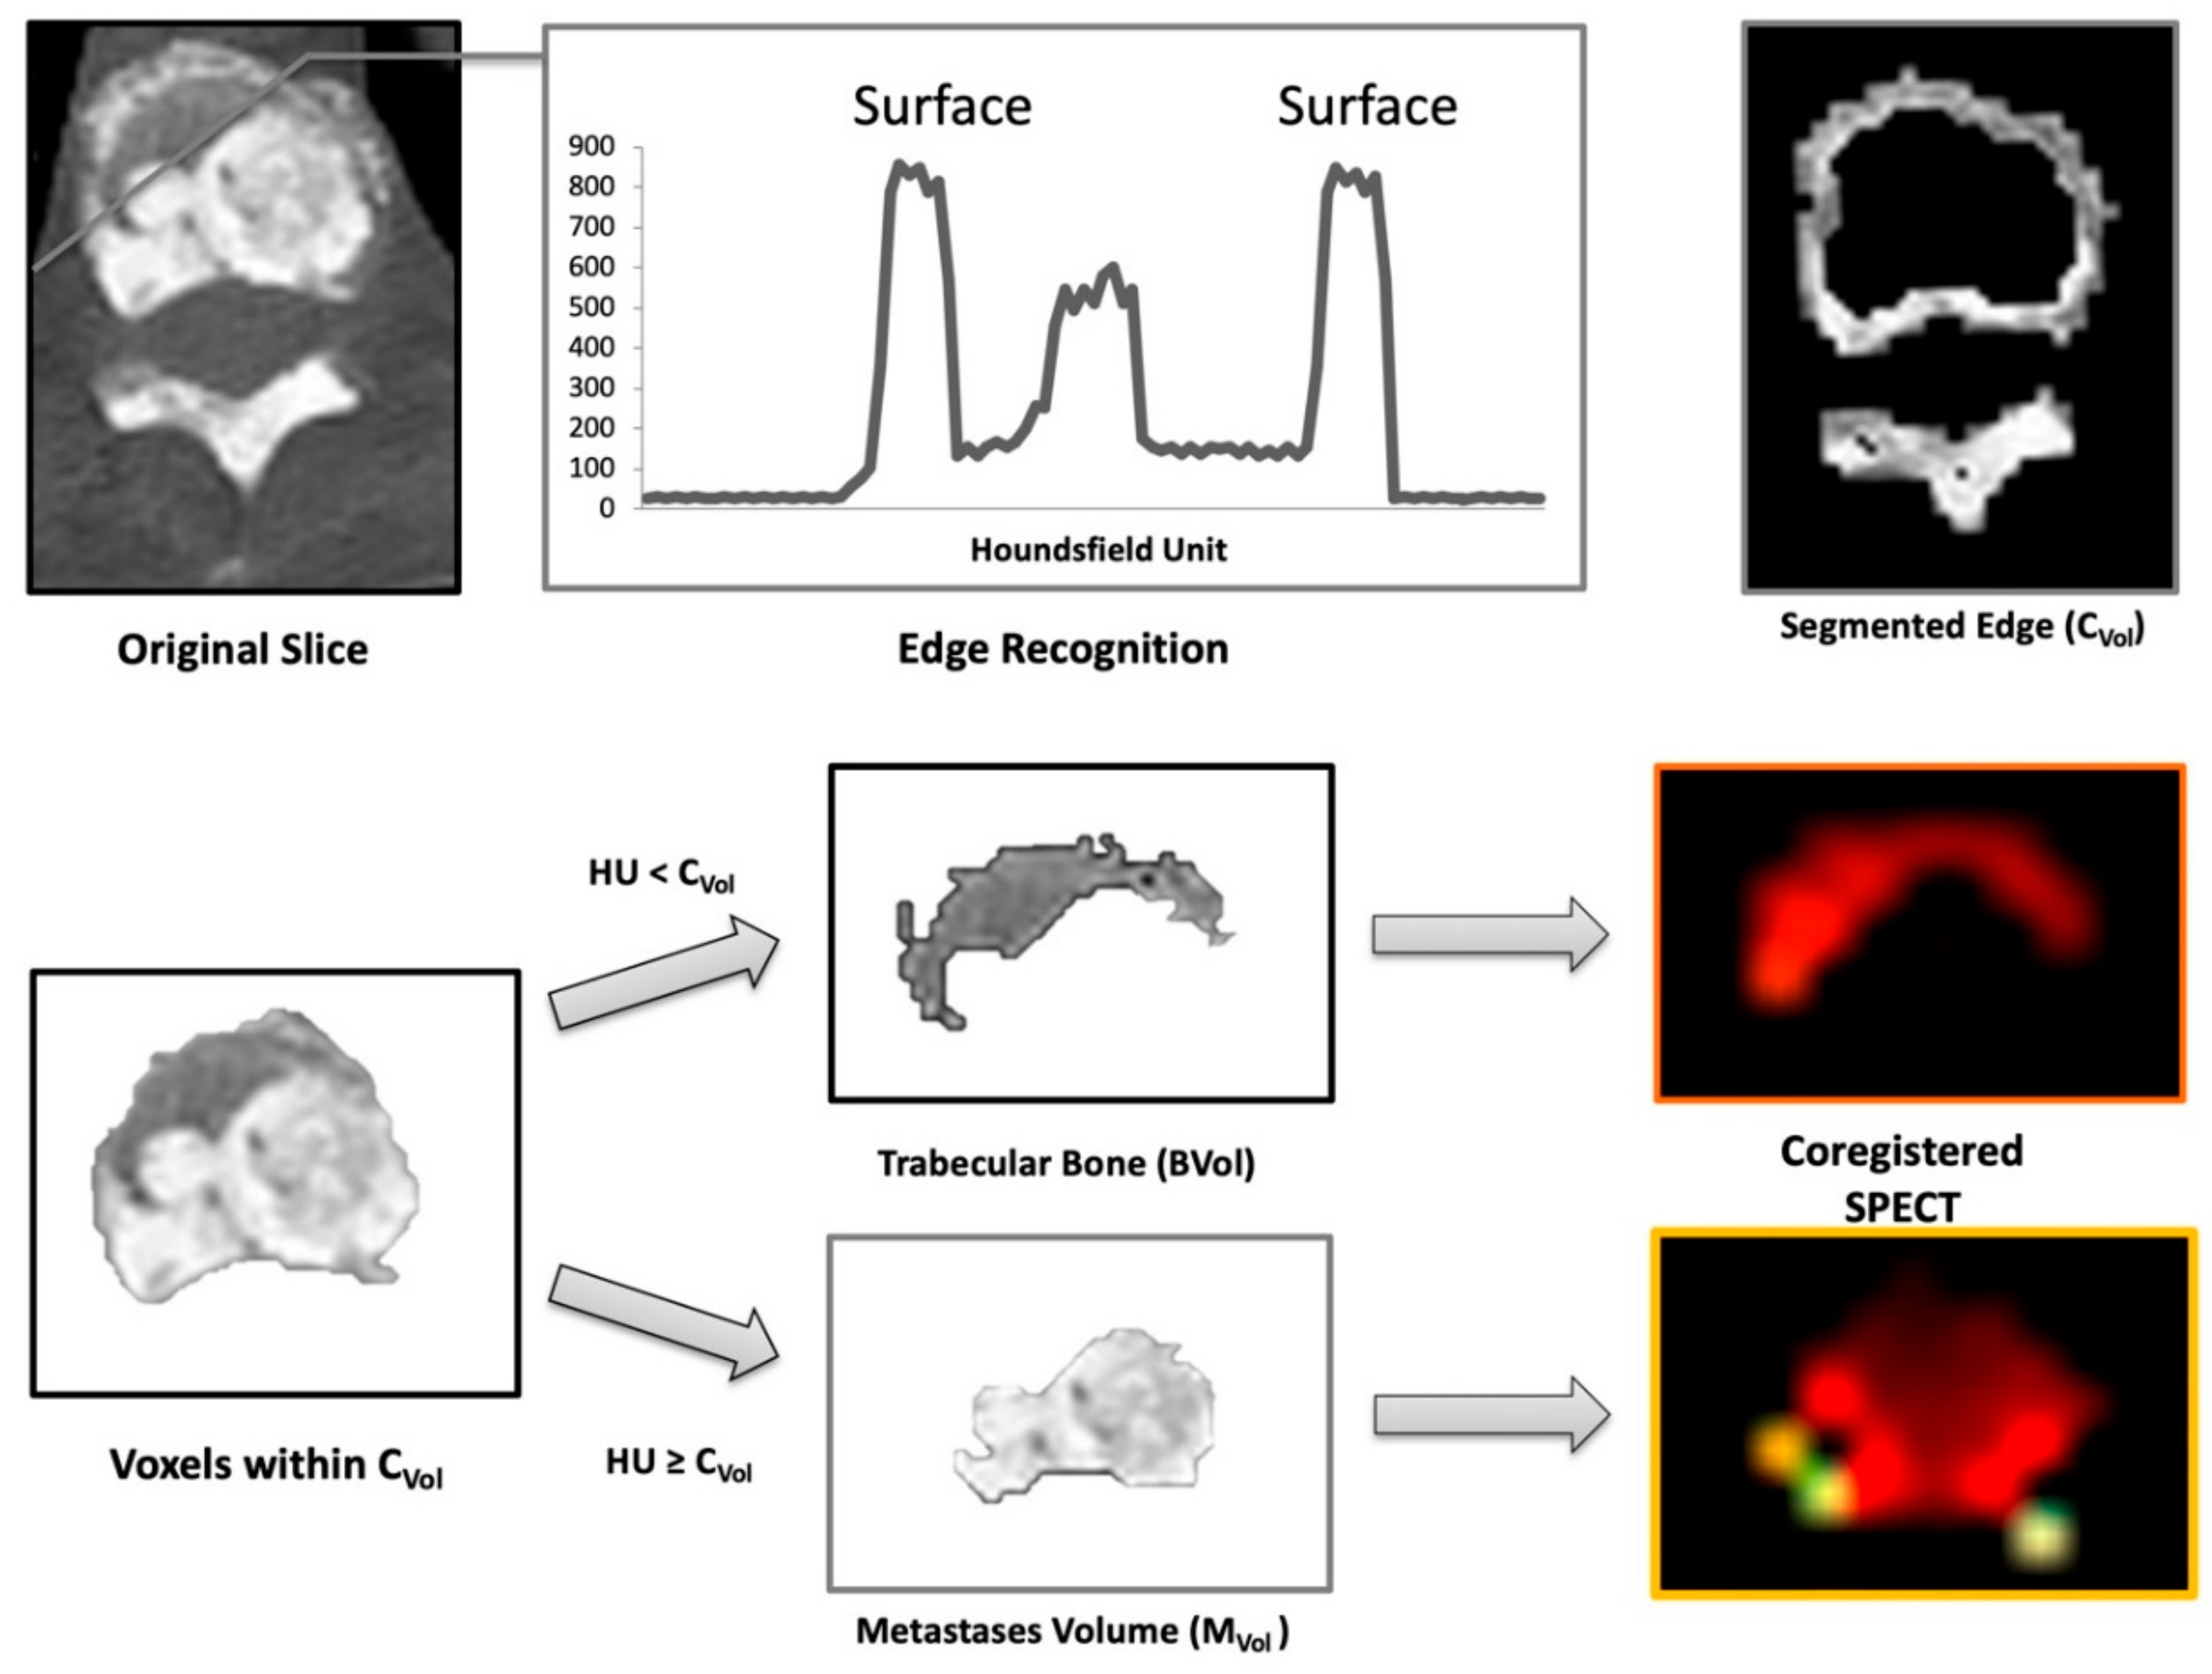
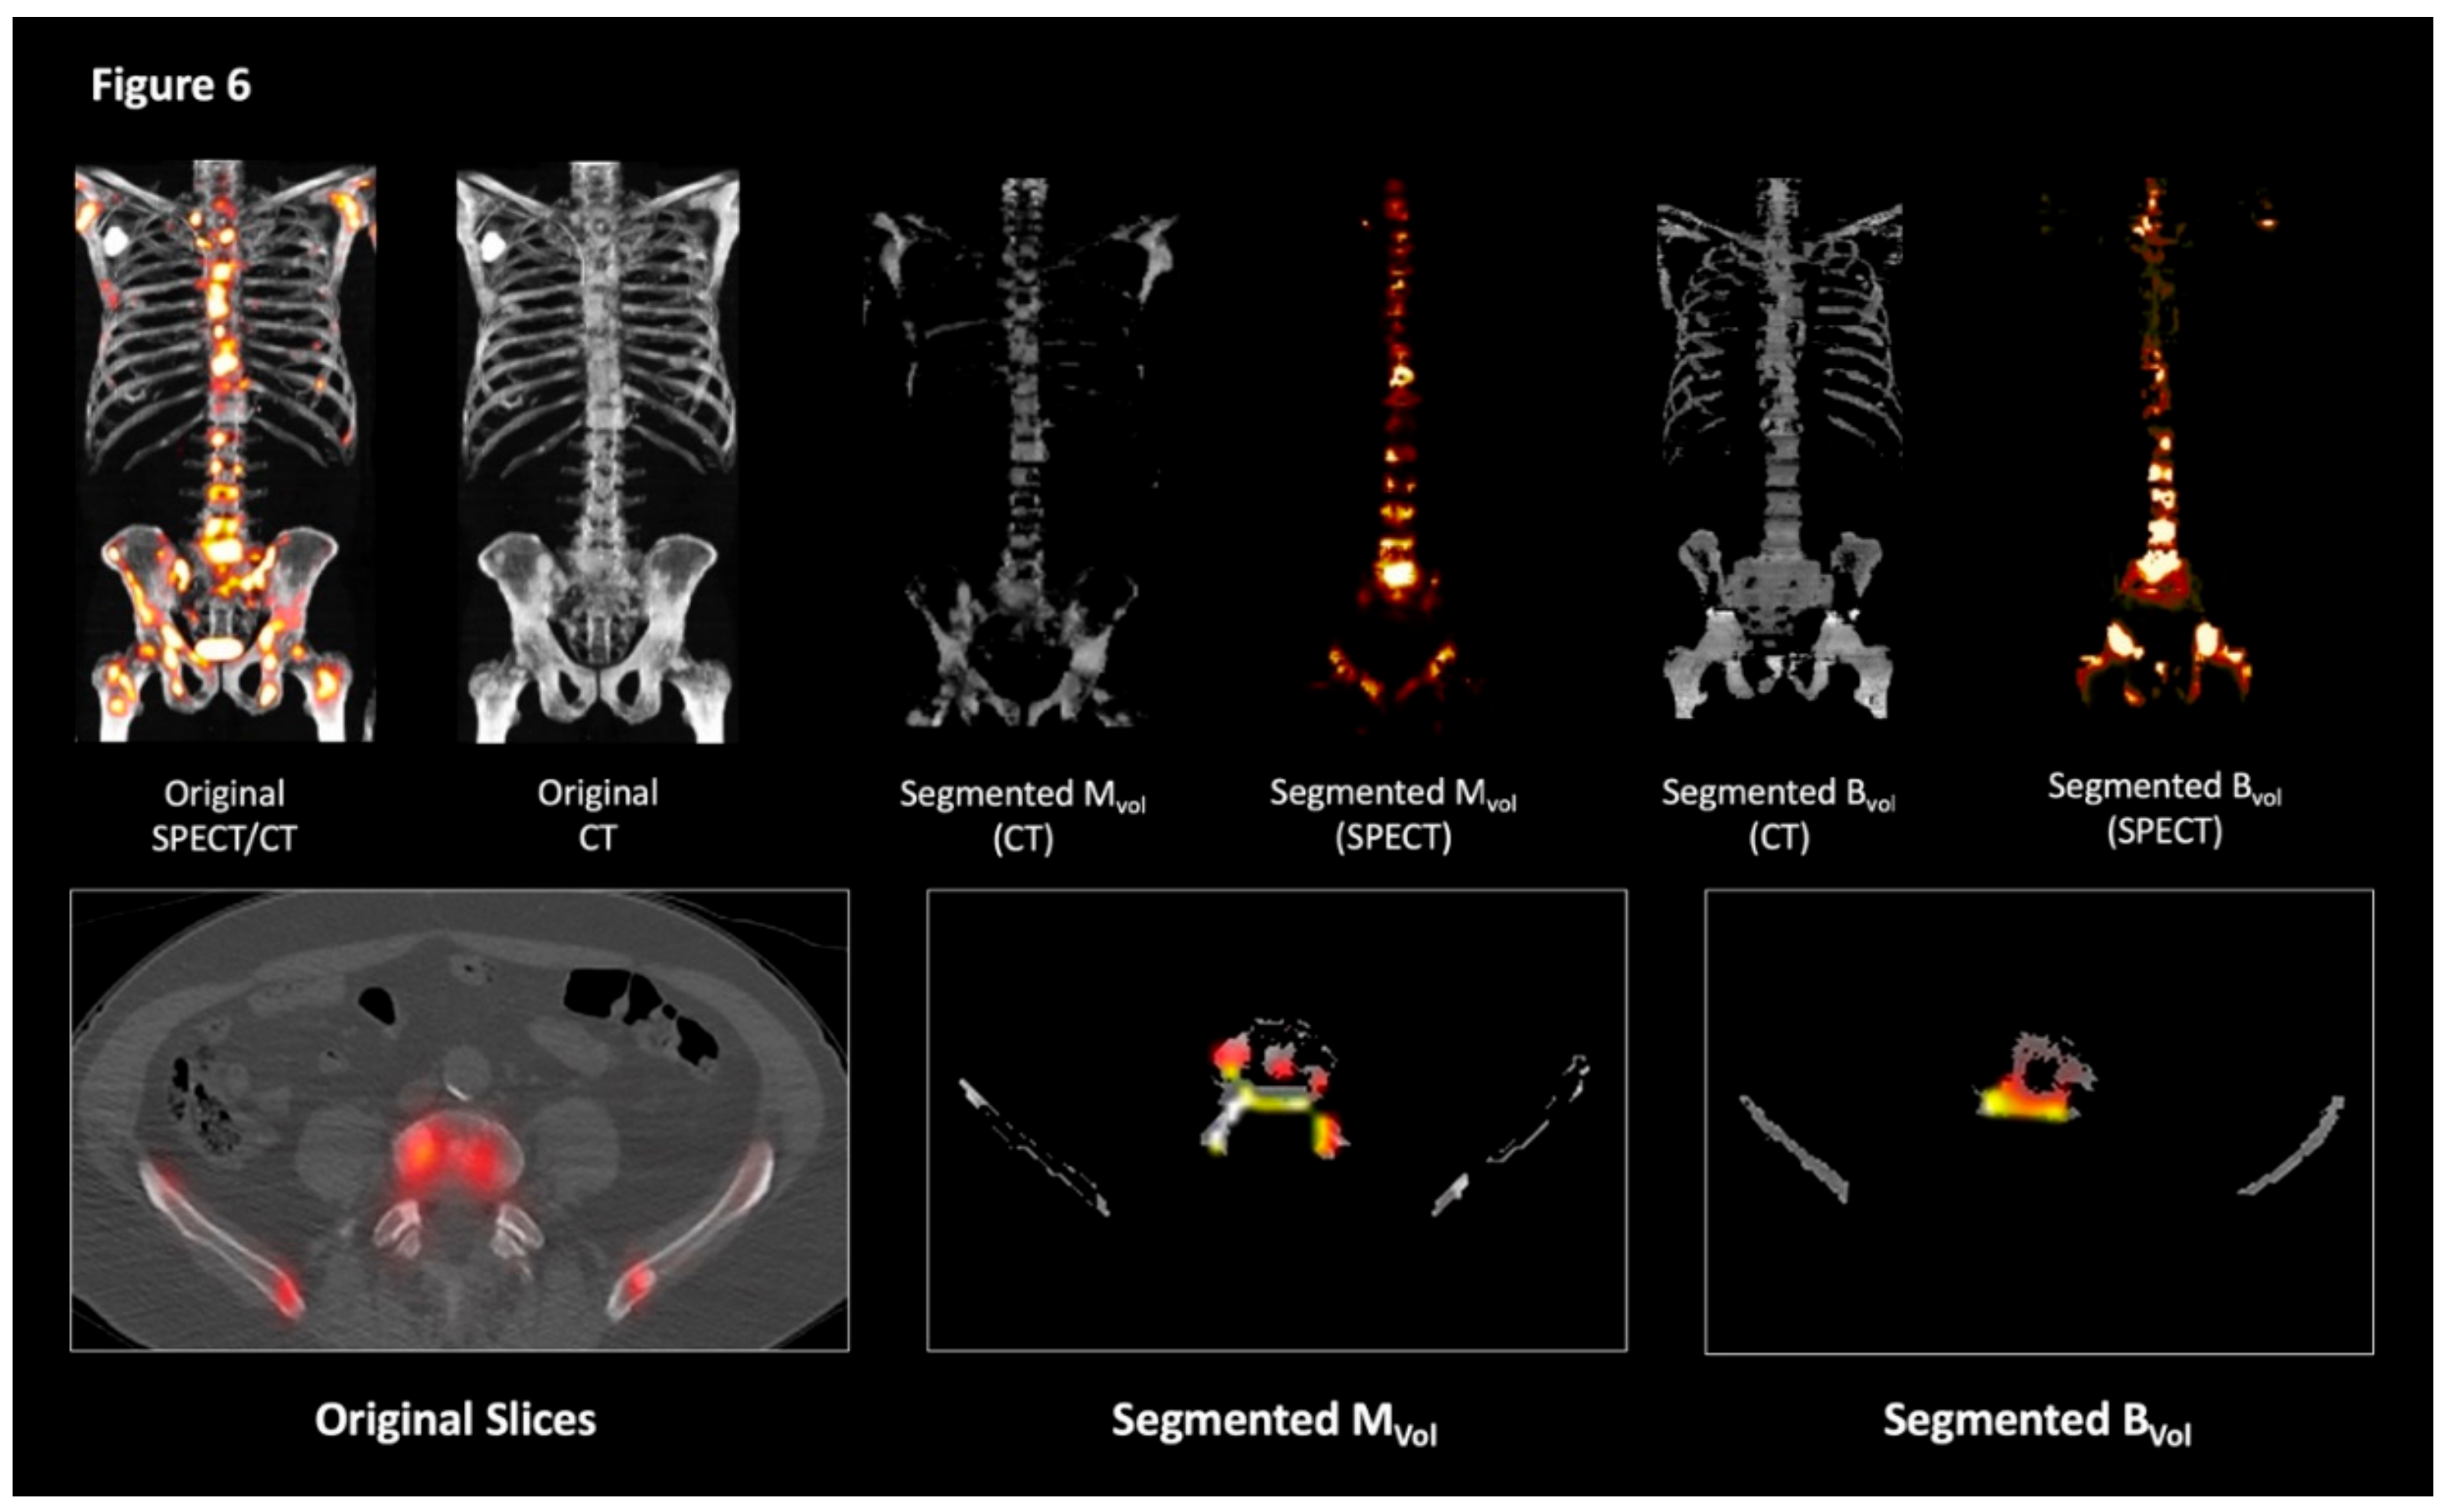
4.4. Image Analysis
- -
- Cortical Volume (CVol): the bone surface
- -
- Trabecular Volume (BVol): the normal trabecular bone
- -
- Metastases Volume (MVol): osteoblastic metastases (tumor burden)
- -
- Skeletal Volume (SVol): entire skeletal volume (sum of CVol, BVol, and MVol)
- -
- %INV: percent of invasion (MVol/ BVol ratio)
4.5. Validation of the Computational Technique and Comparison with Controls
4.6. Statistical Analysis
5. Conclusions
Author Contributions
Funding
Conflicts of Interest
References
- Seruga, B.; Ocana, A.; Tannock, I.F. Drug resistance in metastatic castration-resistant prostate cancer. Nat. Rev. Clin. Oncol. 2011, 8, 12–23. [Google Scholar] [CrossRef] [PubMed]
- Cookson, M.S.; Roth, B.J.; Dahm, P.; Engstrom, C.; Freedland, S.J.; Hussain, M.; Lin, D.W.; Lowrance, W.T.; Murad, M.H.; Oh, W.K.; et al. Castration-resistant prostate cancer: AUA Guideline. J. Urol. 2013, 190, 429–438. [Google Scholar] [CrossRef] [PubMed]
- Bubendorf, L.; Schopfer, A.; Wagner, U.; Sauter, G.; Moch, H.; Willi, N.; Gasser, T.C.; Mihatsch, M.J. Metastatic patterns of prostate cancer: An autopsy study of 1589 patients. Hum. Pathol. 2000, 31, 578–583. [Google Scholar] [CrossRef] [PubMed]
- Huang, X.; Chau, C.H.; Figg, W.D. Challenges to improved therapeutics for metastatic castrate resistant prostate cancer: From recent successes and failures. J. Hematol. Oncol. 2012, 5, 35. [Google Scholar] [CrossRef] [PubMed]
- Benjamin, R. Neurologic complications of prostate cancer. Am. Fam. Physician 2002, 65, 1834–1840. [Google Scholar] [PubMed]
- Fiz, F.; Sahbai, S.; Campi, C.; Weissinger, M.; Dittmann, H.; Marini, C.; Piana, M.; Sambuceti, G.; la Fougere, C. Tumor Burden and Intraosseous Metabolic Activity as Predictors of Bone Marrow Failure during Radioisotope Therapy in Metastasized Prostate Cancer Patients. Biomed. Res. Int. 2017, 2017, 3905216. [Google Scholar] [CrossRef] [PubMed]
- Kantoff, P.W.; Higano, C.S.; Shore, N.D.; Berger, E.R.; Small, E.J.; Penson, D.F.; Redfern, C.H.; Ferrari, A.C.; Dreicer, R.; Sims, R.B.; et al. Sipuleucel-T immunotherapy for castration-resistant prostate cancer. N. Engl. J. Med. 2010, 363, 411–422. [Google Scholar] [CrossRef] [PubMed]
- Kwon, E.D.; Drake, C.G.; Scher, H.I.; Fizazi, K.; Bossi, A.; van den Eertwegh, A.J.; Krainer, M.; Houede, N.; Santos, R.; Mahammedi, H.; et al. Ipilimumab versus placebo after radiotherapy in patients with metastatic castration-resistant prostate cancer that had progressed after docetaxel chemotherapy (CA184-043): A multicentre, randomised, double-blind, phase 3 trial. Lancet Oncol. 2014, 15, 700–712. [Google Scholar] [CrossRef]
- Pezaro, C.J.; Omlin, A.G.; Altavilla, A.; Lorente, D.; Ferraldeschi, R.; Bianchini, D.; Dearnaley, D.; Parker, C.; de Bono, J.S.; Attard, G. Activity of cabazitaxel in castration-resistant prostate cancer progressing after docetaxel and next-generation endocrine agents. Eur. Urol. 2014, 66, 459–465. [Google Scholar] [CrossRef] [PubMed]
- Hoskin, P.; Sartor, O.; O’Sullivan, J.M.; Johannessen, D.C.; Helle, S.I.; Logue, J.; Bottomley, D.; Nilsson, S.; Vogelzang, N.J.; Fang, F.; et al. Efficacy and safety of radium-223 dichloride in patients with castration-resistant prostate cancer and symptomatic bone metastases, with or without previous docetaxel use: A prespecified subgroup analysis from the randomised, double-blind, phase 3 ALSYMPCA trial. Lancet Oncol. 2014, 15, 1397–1406. [Google Scholar] [CrossRef]
- Kratochwil, C.; Giesel, F.L.; Stefanova, M.; Benesova, M.; Bronzel, M.; Afshar-Oromieh, A.; Mier, W.; Eder, M.; Kopka, K.; Haberkorn, U. PSMA-Targeted Radionuclide Therapy of Metastatic Castration-Resistant Prostate Cancer with 177Lu-Labeled PSMA-617. J. Nucl. Med. 2016, 57, 1170–1176. [Google Scholar] [CrossRef] [PubMed]
- Kratochwil, C.; Bruchertseifer, F.; Giesel, F.L.; Weis, M.; Verburg, F.A.; Mottaghy, F.; Kopka, K.; Apostolidis, C.; Haberkorn, U.; Morgenstern, A. 225Ac-PSMA-617 for PSMA-Targeted alpha-Radiation Therapy of Metastatic Castration-Resistant Prostate Cancer. J. Nucl. Med. 2016, 57, 1941–1944. [Google Scholar] [CrossRef] [PubMed]
- Sartor, A.O.; Fitzpatrick, J.M. Urologists and oncologists: Adapting to a new treatment paradigm in castration-resistant prostate cancer (CRPC). BJU Int. 2012, 110, 328–335. [Google Scholar] [CrossRef] [PubMed]
- Sartor, O. State-of-the-Art Management for the Patient with Castration-Resistant Prostate Cancer in 2012. Am. Soc. Clin. Oncol. Educ. Book 2012, 289–291. [Google Scholar] [CrossRef]
- Chung, P.H.; Gayed, B.A.; Thoreson, G.R.; Raj, G.V. Emerging drugs for prostate cancer. Expert Opin. Emerg. Drugs 2013, 18, 533–550. [Google Scholar] [CrossRef]
- Yu, E.Y.; Gulati, R.; Telesca, D.; Jiang, P.; Tam, S.; Russell, K.J.; Nelson, P.S.; Etzioni, R.D.; Higano, C.S. Duration of first off-treatment interval is prognostic for time to castration resistance and death in men with biochemical relapse of prostate cancer treated on a prospective trial of intermittent androgen deprivation. J. Clin. Oncol. 2010, 28, 2668–2673. [Google Scholar] [CrossRef]
- Bahl, A.K.; Bertelli, G.; Lewis, P.D.; Jenkins, P.; Aziz, A.; Davies, P.J.; Persad, R.; Smith, C.G.; Hurley, K.; Mason, M.D. Correlation of elevated alkaline phosphatase (ALP) and survival in metastatic castration-resistant prostate cancer (CRPC) treated with docetaxel chemotherapy: Results of SWSW Uro-oncology Group study from three U.K. centers. J. Clin. Oncol. 2011, 29, 206. [Google Scholar] [CrossRef]
- Piper, C.; van Erps, T.; Pfister, D.J.; Epplen, R.; Porres, D.; Heidenreich, A. Frequency and prognostic significance of the PSA flare-up phenomenon in men with castration-resistant prostate cancer (CRPC) who undergo docetaxel-based chemotherapy. J. Clin. Oncol. 2012, 30, 92. [Google Scholar] [CrossRef]
- Schroder, F.H.; Tombal, B.; Miller, K.; Boccon-Gibod, L.; Shore, N.D.; Crawford, E.D.; Moul, J.; Olesen, T.K.; Persson, B.E. Changes in alkaline phosphatase levels in patients with prostate cancer receiving degarelix or leuprolide: Results from a 12-month, comparative, phase III study. BJU Int. 2010, 106, 182–187. [Google Scholar] [CrossRef]
- Qin, J.; Liu, X.; Laffin, B.; Chen, X.; Choy, G.; Jeter, C.R.; Calhoun-Davis, T.; Li, H.; Palapattu, G.S.; Pang, S.; et al. The PSA(-/lo) prostate cancer cell population harbors self-renewing long-term tumor-propagating cells that resist castration. Cell Stem Cell 2012, 10, 556–569. [Google Scholar] [CrossRef]
- Pollen, J.J.; Witztum, K.F.; Ashburn, W.L. The flare phenomenon on radionuclide bone scan in metastatic prostate cancer. AJR Am. J. Roentgenol. 1984, 142, 773–776. [Google Scholar] [CrossRef] [PubMed]
- Fiz, F.; Dittman, H.; Campi, C.; Morbelli, S.; Marini, C.; Brignone, M.; Bauckneht, M.; Piva, R.; Massone, A.M.; Piana, M.; et al. Assessment of Skeletal Tumor Load in Metastasized Castration-Resistant Prostate Cancer Patients: A Review of Available Methods and an Overview on Future Perspectives. Bioengineering 2018, 5, 58. [Google Scholar] [CrossRef] [PubMed]
- Carrasquillo, J.A.; O’Donoghue, J.A.; Pandit-Taskar, N.; Humm, J.L.; Rathkopf, D.E.; Slovin, S.F.; Williamson, M.J.; Lacuna, K.; Aksnes, A.K.; Larson, S.M.; et al. Phase I pharmacokinetic and biodistribution study with escalating doses of (2)(2)(3)Ra-dichloride in men with castration-resistant metastatic prostate cancer. Eur. J. Nucl. Med. Mol. Imaging 2013, 40, 1384–1393. [Google Scholar] [CrossRef] [PubMed]
- Pacilio, M.; Ventroni, G.; De Vincentis, G.; Cassano, B.; Pellegrini, R.; Di Castro, E.; Frantellizzi, V.; Follacchio, G.A.; Garkavaya, T.; Lorenzon, L.; et al. Dosimetry of bone metastases in targeted radionuclide therapy with alpha-emitting (223)Ra-dichloride. Eur. J. Nucl. Med. Mol. Imaging 2016, 43, 21–33. [Google Scholar] [CrossRef] [PubMed]
- Fosbol, M.O.; Petersen, P.M.; Kjaer, A.; Mortensen, J. (223)Ra Therapy of Advanced Metastatic Castration-Resistant Prostate Cancer: Quantitative Assessment of Skeletal Tumor Burden for Prognostication of Clinical Outcome and Hematologic Toxicity. J. Nucl. Med. 2018, 59, 596–602. [Google Scholar] [CrossRef] [PubMed]
- Petersen, L.J.; Mortensen, J.C.; Bertelsen, H.; Zacho, H.D. Computer-assisted interpretation of planar whole-body bone scintigraphy in patients with newly diagnosed prostate cancer. Nucl. Med. Commun. 2015, 36, 679–685. [Google Scholar] [CrossRef]
- Ryan, C.J.; Shah, S.; Efstathiou, E.; Smith, M.R.; Taplin, M.E.; Bubley, G.J.; Logothetis, C.J.; Kheoh, T.; Kilian, C.; Haqq, C.M.; et al. Phase II study of abiraterone acetate in chemotherapy-naive metastatic castration-resistant prostate cancer displaying bone flare discordant with serologic response. Clin. Cancer Res. 2011, 17, 4854–4861. [Google Scholar] [CrossRef] [PubMed]
- Rohren, E.M.; Etchebehere, E.C.; Araujo, J.C.; Hobbs, B.P.; Swanston, N.M.; Everding, M.; Moody, T.; Macapinlac, H.A. Determination of Skeletal Tumor Burden on 18F-Fluoride PET/CT. J. Nucl. Med. 2015, 56, 1507–1512. [Google Scholar] [CrossRef]
- Bieth, M.; Kronke, M.; Tauber, R.; Dahlbender, M.; Retz, M.; Nekolla, S.G.; Menze, B.; Maurer, T.; Eiber, M.; Schwaiger, M. Exploring New Multimodal Quantitative Imaging Indices for the Assessment of Osseous Tumor Burden in Prostate Cancer Using 68Ga-PSMA PET/CT. J. Nucl. Med. 2017, 58, 1632–1637. [Google Scholar] [CrossRef]
- Horger, M.; Bares, R. The role of single-photon emission computed tomography/computed tomography in benign and malignant bone disease. Semin. Nucl. Med. 2006, 36, 286–294. [Google Scholar] [CrossRef]
- Nakajima, K.; Edenbrandt, L.; Mizokami, A. Bone scan index: A new biomarker of bone metastasis in patients with prostate cancer. Int. J. Urol. 2017, 24, 668–673. [Google Scholar] [CrossRef] [PubMed]
- Dadhania, S.; Alonzi, R.; Douglas, S.; Gogbashian, A.; Hughes, R.; Dalili, D.; Vasdev, N.; Adshead, J.; Lane, T.; Westbury, C.; et al. Single-centre Experience of Use of Radium 223 with Clinical Outcomes Based on Number of Cycles and Bone Marrow Toxicity. Anticancer Res. 2018, 38, 5423–5427. [Google Scholar] [CrossRef] [PubMed]
- Sambuceti, G.; Brignone, M.; Marini, C.; Massollo, M.; Fiz, F.; Morbelli, S.; Buschiazzo, A.; Campi, C.; Piva, R.; Massone, A.M.; et al. Estimating the whole bone-marrow asset in humans by a computational approach to integrated PET/CT imaging. Eur. J. Nucl. Med. Mol. Imaging 2012, 39, 1326–1338. [Google Scholar] [CrossRef] [PubMed]
- Fiz, F.; Marini, C.; Piva, R.; Miglino, M.; Massollo, M.; Bongioanni, F.; Morbelli, S.; Bottoni, G.; Campi, C.; Bacigalupo, A.; et al. Adult advanced chronic lymphocytic leukemia: Computational analysis of whole-body CT documents a bone structure alteration. Radiology 2014, 271, 805–813. [Google Scholar] [CrossRef] [PubMed]
- Fiz, F.; Marini, C.; Campi, C.; Massone, A.M.; Podesta, M.; Bottoni, G.; Piva, R.; Bongioanni, F.; Bacigalupo, A.; Piana, M.; et al. Allogeneic cell transplant expands bone marrow distribution by colonizing previously abandoned areas: An FDG PET/CT analysis. Blood 2015, 125, 4095–4102. [Google Scholar] [CrossRef] [PubMed]
- Constable, A.R.; Cranage, R.W. Recognition of the superscan in prostatic bone scintigraphy. Br. J. Radiol. 1981, 54, 122–125. [Google Scholar] [CrossRef] [PubMed]


| Parameter | All Patients | Superscan | Non-Superscan | p-Value |
|---|---|---|---|---|
| Mean MVol (mL) | 357 ± 257 | 527 ± 304 | 245 ± 187 | <0.001 |
| Number of counted lesions | 74 ± 30 | 106 ± 22 | 61 ± 23 | <0.001 |
| INV% | 27 ± 20% | 40 ± 23% | 21 ± 16% | <0.01 |
| PSA (ng/mL) | 539 ± 754 | 1235 ± 959 | 257 ± 407 | <0.001 |
| BVol mean counts/voxel | 466 ± 198 | 565 ± 243 | 428 ± 164 | NS |
| MVol mean counts/voxel | 947 ± 277 | 1104 ± 291 | 886 ± 251 | <0.05 |
| BVol mean HU | 251 ± 78 | 319 ± 78 | 223 ± 59 | <0.01 |
| MVol mean HU | 590 ± 136 | 693 ± 132 | 549 ± 115 | <0.001 |
| Parameter | PD | SD | PR | PD vs. PR | PD vs. SD | PR vs. SD |
|---|---|---|---|---|---|---|
| Mean MVol (mL) | 245 ± 312 | 342 ± 203 | 373 ± 254 | NS | NS | NS |
| Number of counted lesions | 56 ± 25 | 80 ± 33 | 79 ± 26 | NS | NS | NS |
| MVol/BVol | 19 ± 8% | 29 ± 17% | 31 ± 23 | NS | NS | NS |
| PSA (ng/mL) | 353 ± 540 | 446 ± 539 | 746 ± 1004 | NS | NS | NS |
| BVol mean counts/voxel | 275 ± 60 | 528 ± 162 | 515 ± 188 | <0.001 | <0.001 | NS |
| MVol mean counts/voxel | 715 ± 190 | 1058 ± 255 | 975 ± 219 | <0.05 | <0.01 | NS |
| BVol mean HU | 232 ± 81 | 253 ± 68 | 264 ± 82 | NS | NS | NS |
| MVol mean HU | 545 ± 157 | 605 ± 120 | 610 ± 127 | NS | NS | NS |
© 2019 by the authors. Licensee MDPI, Basel, Switzerland. This article is an open access article distributed under the terms and conditions of the Creative Commons Attribution (CC BY) license (http://creativecommons.org/licenses/by/4.0/).
Share and Cite
Fiz, F.; Dittmann, H.; Campi, C.; Weissinger, M.; Sahbai, S.; Reimold, M.; Stenzl, A.; Piana, M.; Sambuceti, G.; la Fougère, C. Automated Definition of Skeletal Disease Burden in Metastatic Prostate Carcinoma: A 3D Analysis of SPECT/CT Images. Cancers 2019, 11, 869. https://doi.org/10.3390/cancers11060869
Fiz F, Dittmann H, Campi C, Weissinger M, Sahbai S, Reimold M, Stenzl A, Piana M, Sambuceti G, la Fougère C. Automated Definition of Skeletal Disease Burden in Metastatic Prostate Carcinoma: A 3D Analysis of SPECT/CT Images. Cancers. 2019; 11(6):869. https://doi.org/10.3390/cancers11060869
Chicago/Turabian StyleFiz, Francesco, Helmut Dittmann, Cristina Campi, Matthias Weissinger, Samine Sahbai, Matthias Reimold, Arnulf Stenzl, Michele Piana, Gianmario Sambuceti, and Christian la Fougère. 2019. "Automated Definition of Skeletal Disease Burden in Metastatic Prostate Carcinoma: A 3D Analysis of SPECT/CT Images" Cancers 11, no. 6: 869. https://doi.org/10.3390/cancers11060869
APA StyleFiz, F., Dittmann, H., Campi, C., Weissinger, M., Sahbai, S., Reimold, M., Stenzl, A., Piana, M., Sambuceti, G., & la Fougère, C. (2019). Automated Definition of Skeletal Disease Burden in Metastatic Prostate Carcinoma: A 3D Analysis of SPECT/CT Images. Cancers, 11(6), 869. https://doi.org/10.3390/cancers11060869