Pushing the Limits of Electrical Detection of Ultralow Flows in Nanofluidic Channels

Abstract
:
1. Introduction

2. Device Fabrication
3. Experimental
4. Results and Discussion
 exhibit diffusion noise
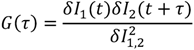
  from which a normalized cross-correlation function
  is evaluated:
 peaks at the time
  , which is—in a first approximation—identical to the time of flight of Fc(MeOH)2 molecules from the center of the first transducer to the center of the second one located 102 μm downstream. In Figure 3, cross-correlation functions are shown as a function of the syringe pump flow rate and compared to analytical functions for one-dimensional drift and diffusion in the same device geometry [4].
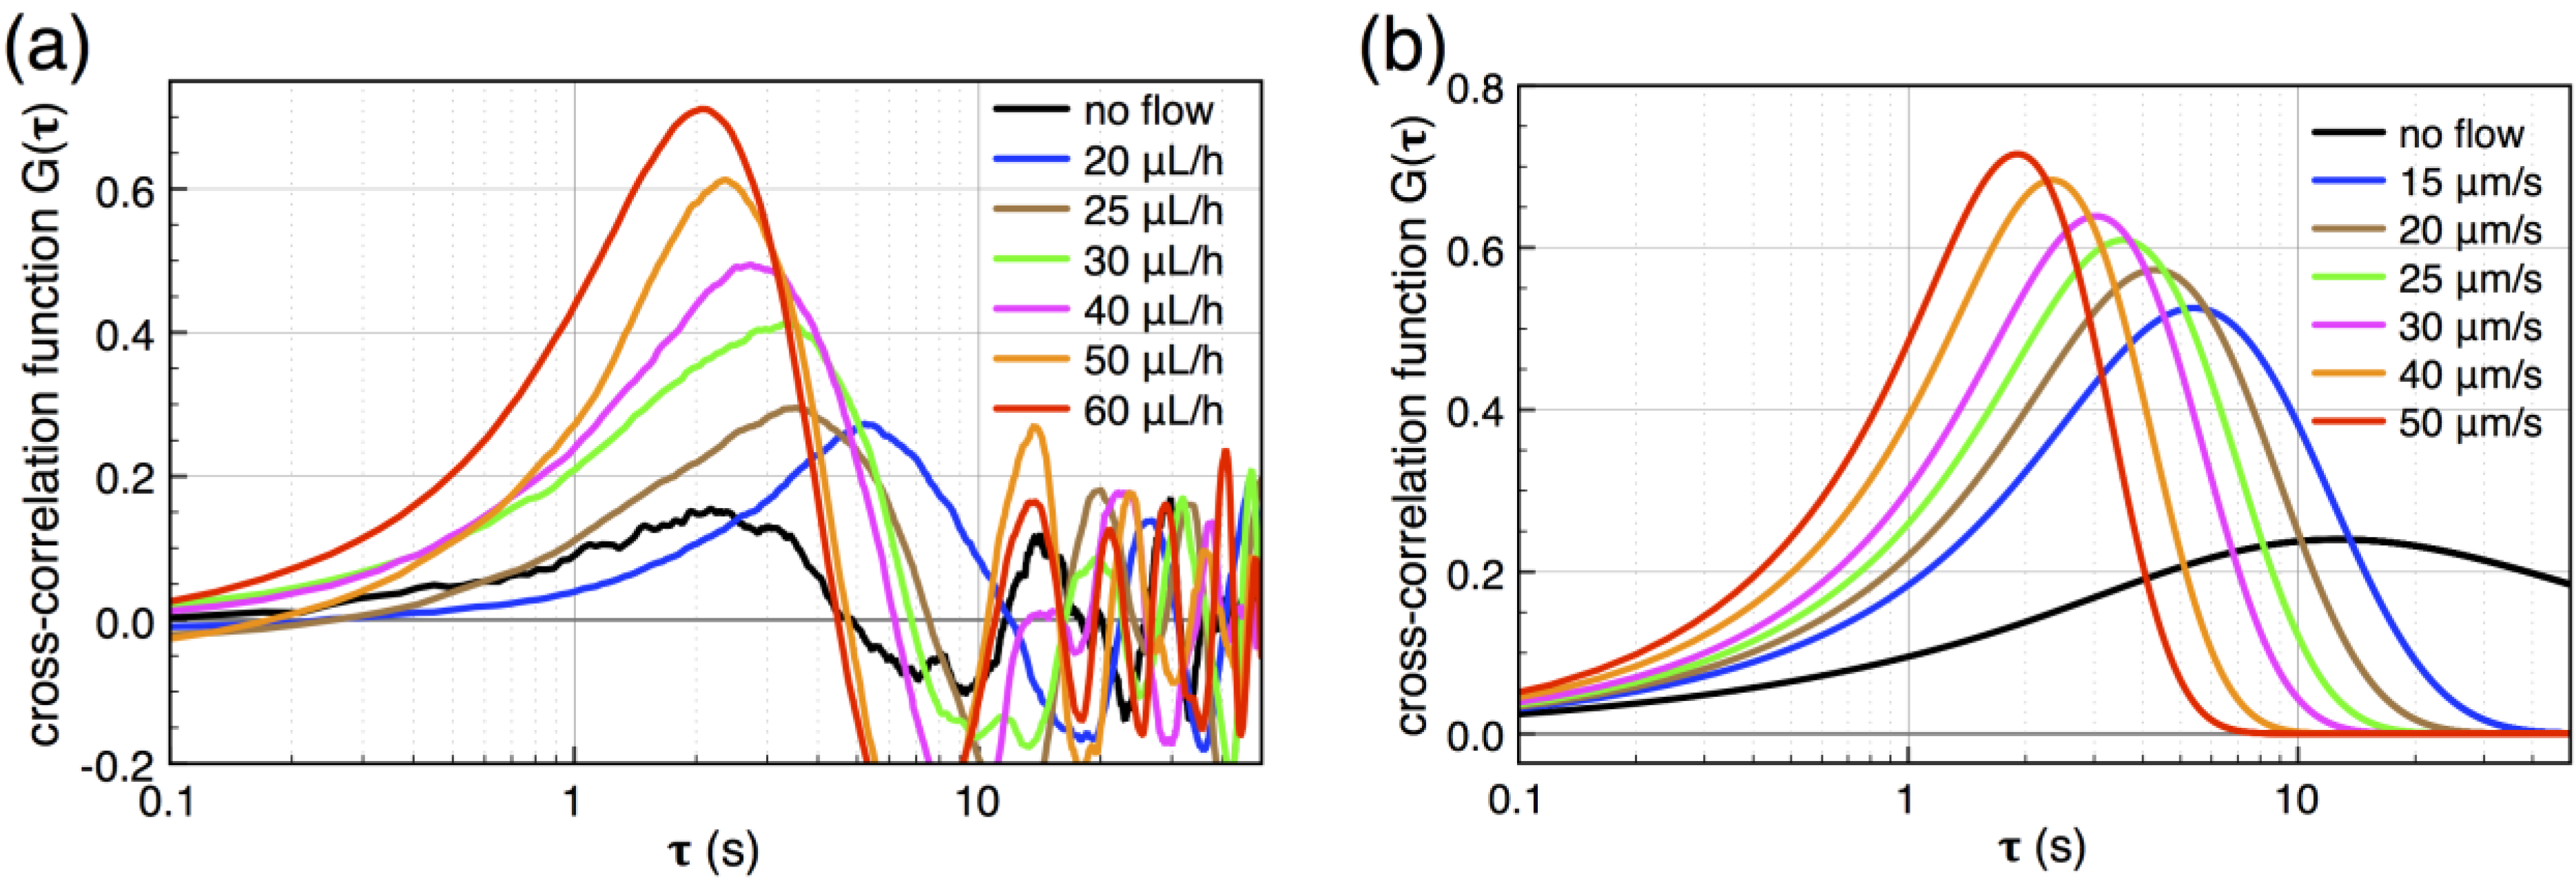
 of the transducers with the channel cross section and dividing by . It is shown in Figure 4 as a function of pump flow (orange diamonds).
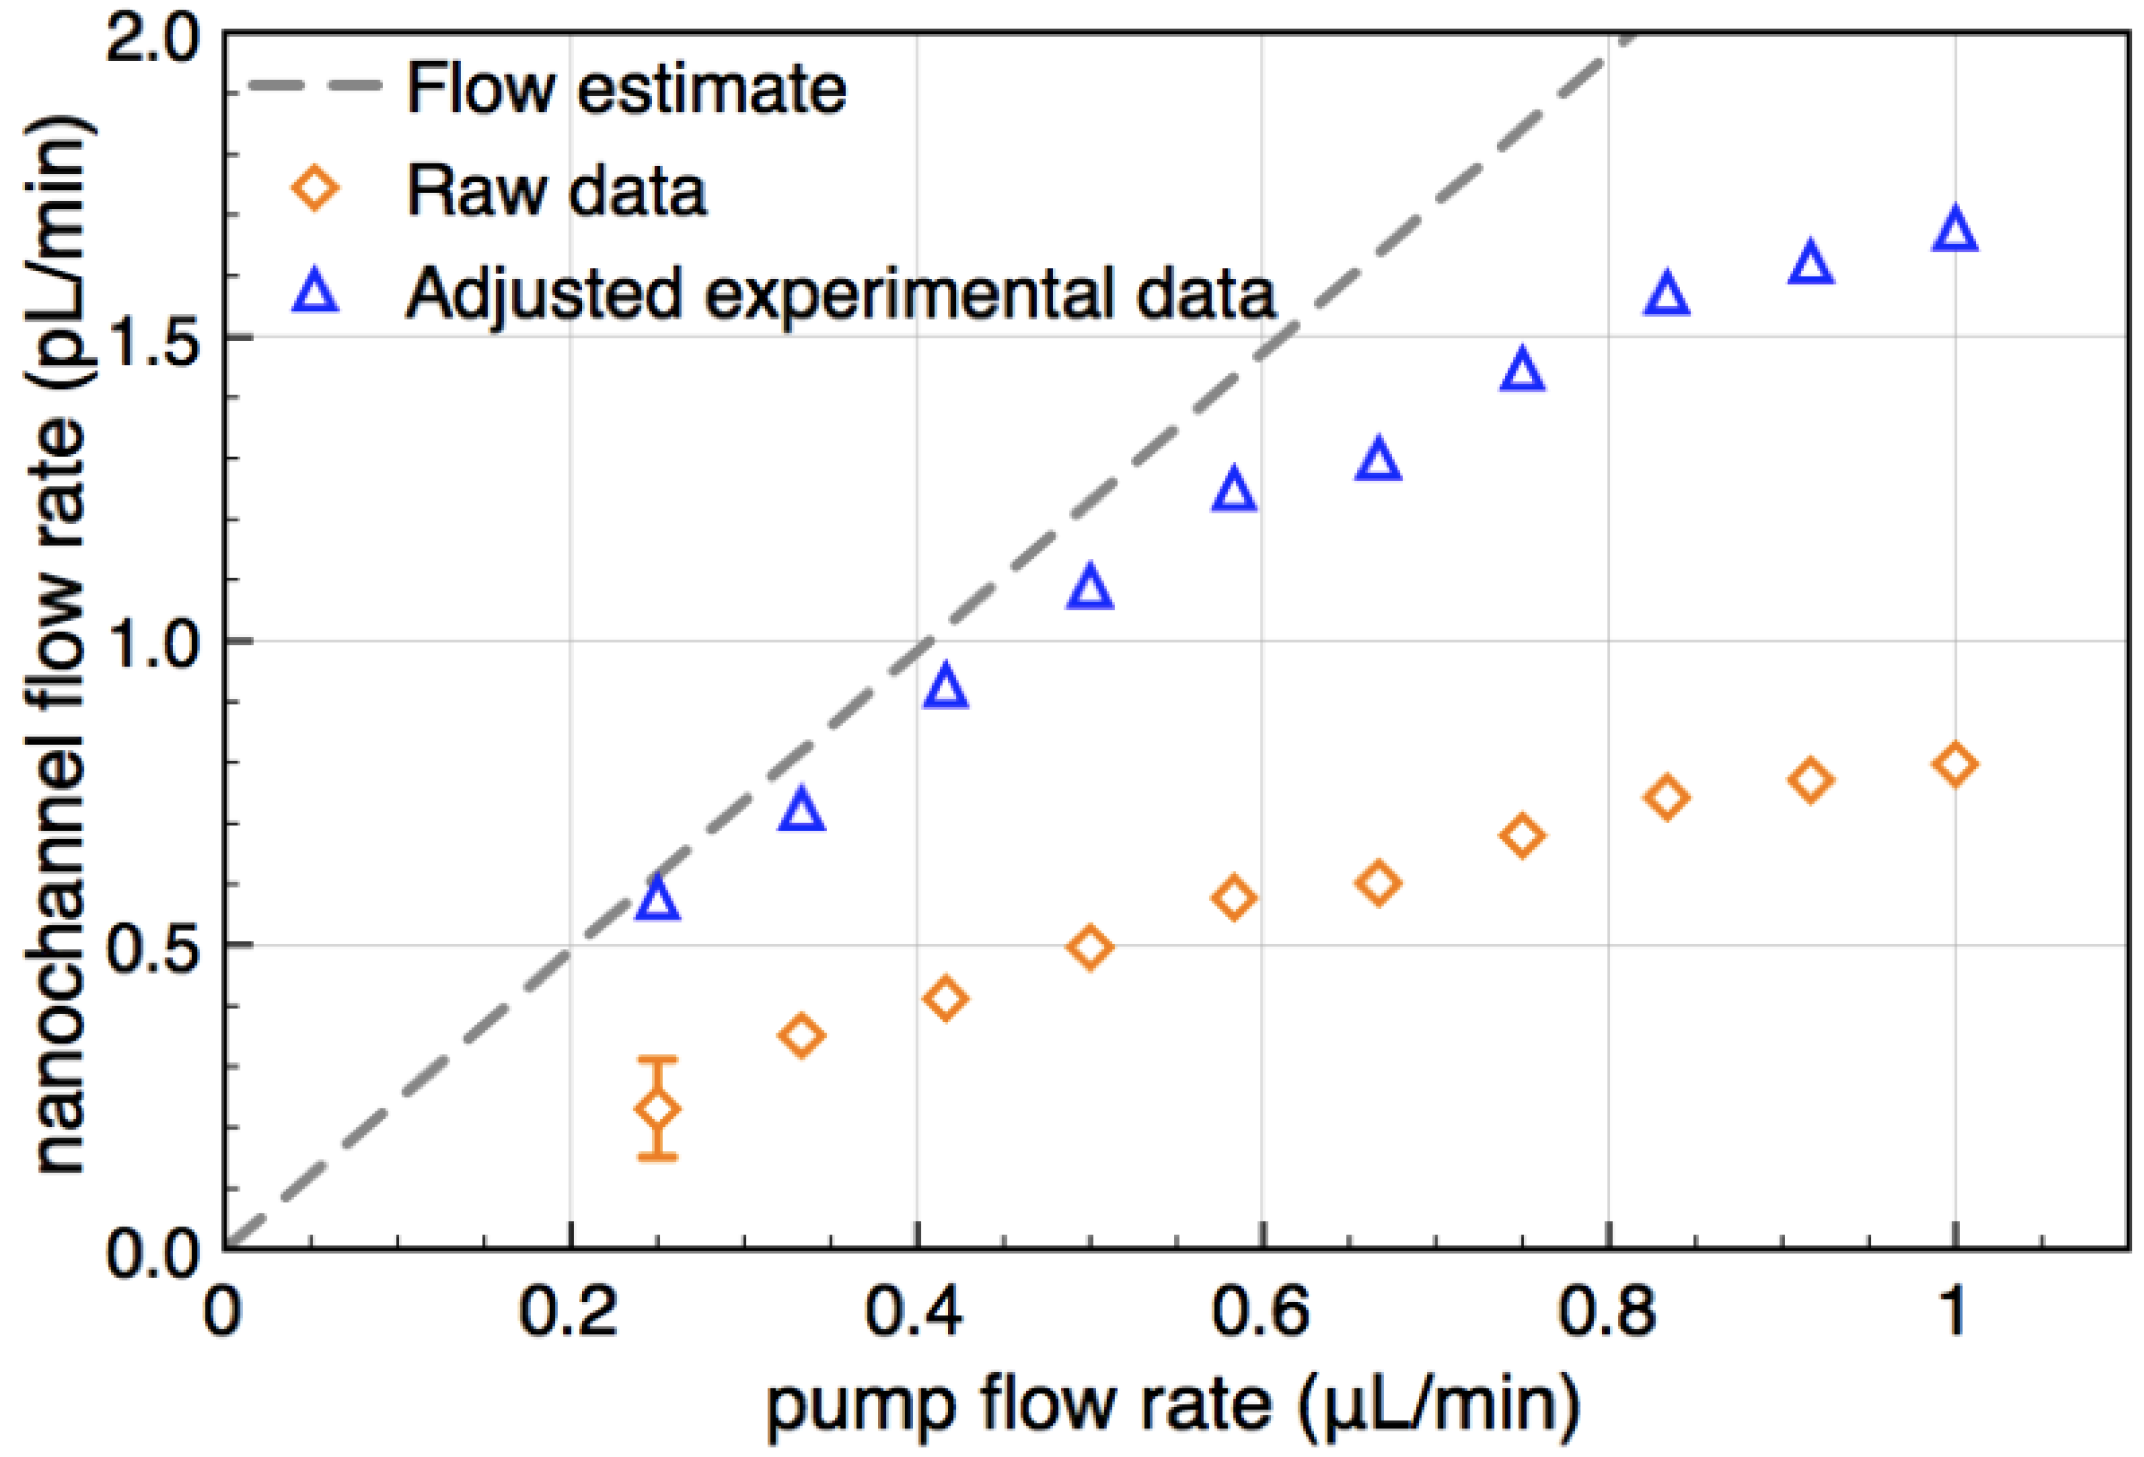
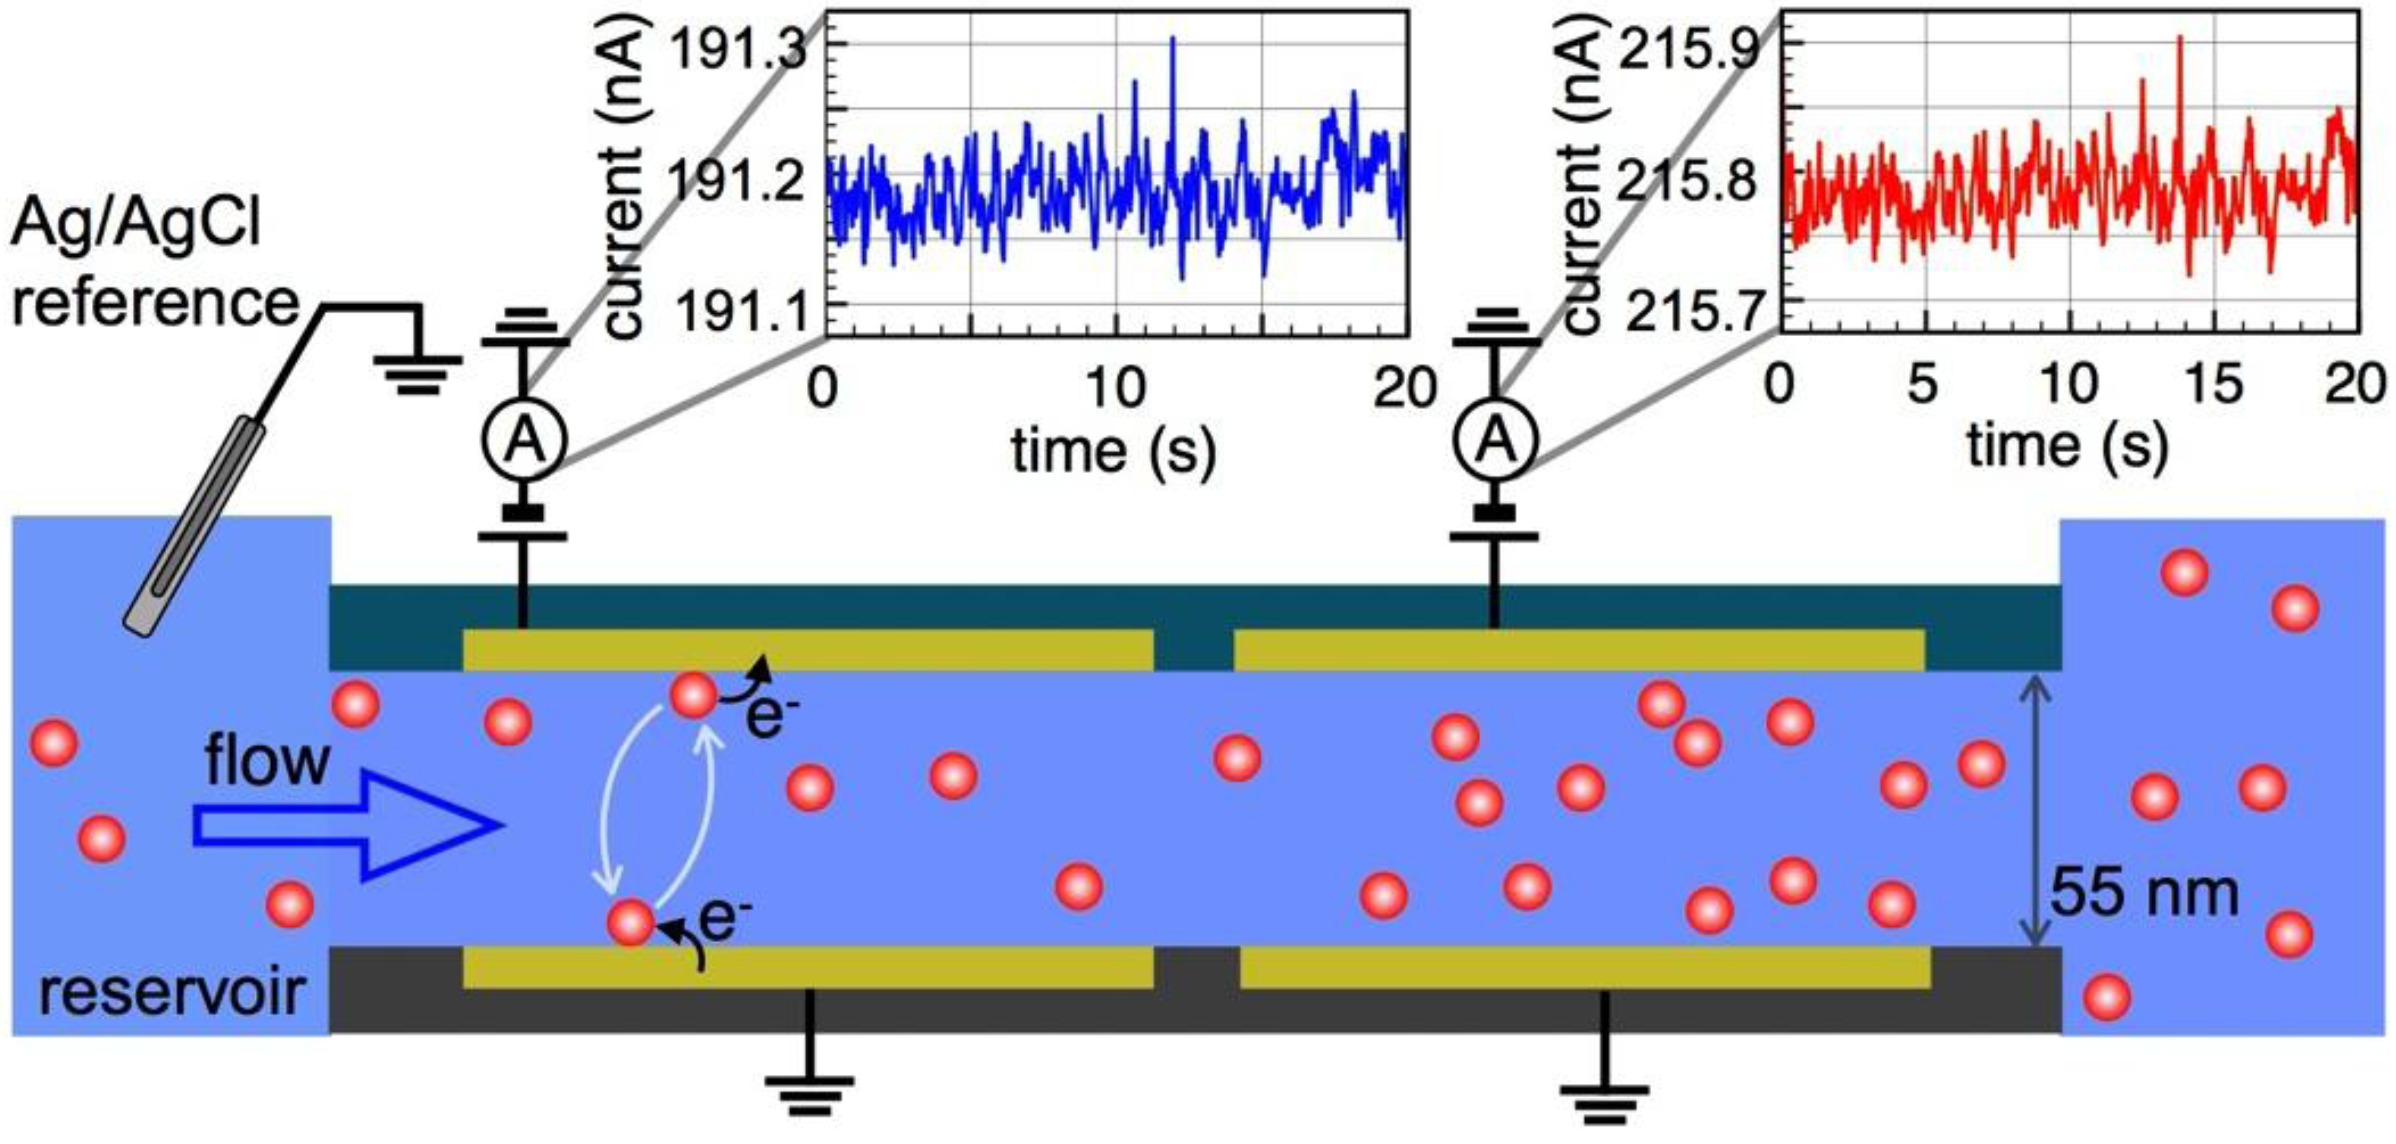
 by stochastic chronoamperometry [8]. Its magnitude exhibits considerable scatter but amounts approximately to = 0.5, i.e., the molecules are slowed down to 50% of the mean liquid flow velocity. away from the actual times of flight for slow flow rates. That is, molecules travel faster into the subsequent detector by diffusion than by advection, so that becomes smaller than the time of flight. This shift is determined from the known analytical cross-correlation function (see below, [4]) and is shown in Figure 5a for the molecular diffusion coefficient D = 6.7 × 10⁻¹⁰ m2/s (green curve) and an adjusted effective Deff = 0.5 D, which takes into account the reduction of diffusive transport by the dynamic adsorption. In Figure 5b, this effect is exemplified by analytical cross-correlation functions with a constant time of flight of 4 s and flow rates ranging from 250 μm/s to 10 μm/s (and corresponding electrode lengths of 40 μm to 1000 μm with no gap in between.)
  from the time of flight as a function of flow velocity. The blue curve is corrected for an effectively slower diffusion of the molecules due to dynamic adsorption. Experimental flow rates range from 15 μm/s to 50 μm/s. (b) Cross-correlation functions for a constant time of flight of 4 s but with different molecular velocities v (and corresponding different electrode lengths L or flight paths, respectively).
from the time of flight as a function of flow velocity. The blue curve is corrected for an effectively slower diffusion of the molecules due to dynamic adsorption. Experimental flow rates range from 15 μm/s to 50 μm/s. (b) Cross-correlation functions for a constant time of flight of 4 s but with different molecular velocities v (and corresponding different electrode lengths L or flight paths, respectively).
from the time of flight as a function of flow velocity. The blue curve is corrected for an effectively slower diffusion of the molecules due to dynamic adsorption. Experimental flow rates range from 15 μm/s to 50 μm/s. (b) Cross-correlation functions for a constant time of flight of 4 s but with different molecular velocities v (and corresponding different electrode lengths L or flight paths, respectively).
4.1. Detection Sensitivity
 for a pronounced cross-correlation peak to appear [4,10]; at lower flow rates, the signal becomes essentially indistinguishable from that for purely diffusive mass transport.
 is the duration of a current–time trace and
  is approximately the decay time of the correlations, i.e., the time of flight
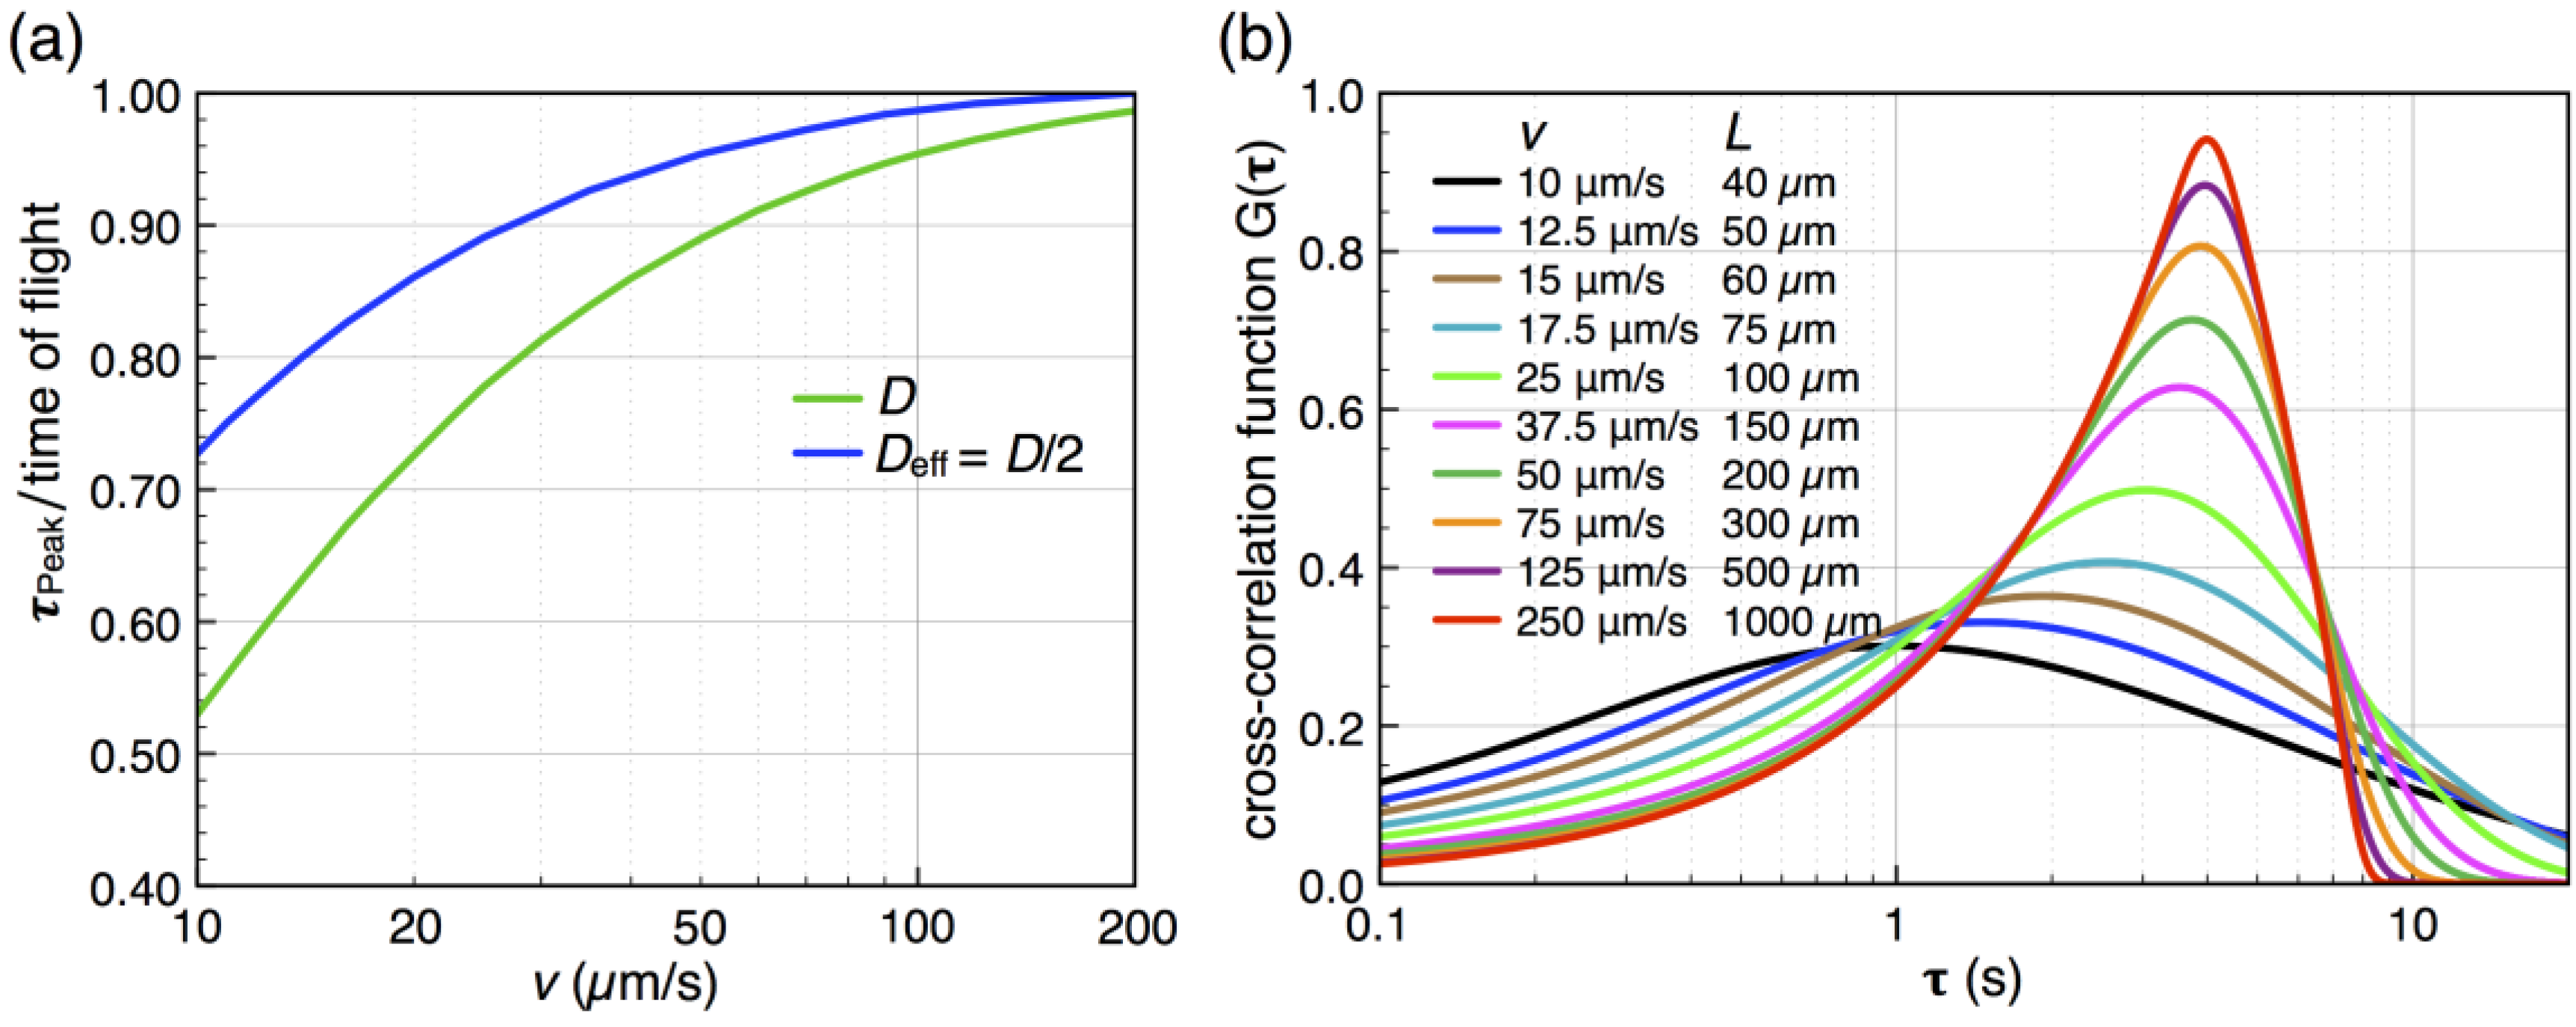
  This expression for the SNR is valid for the limits
  , where
  is the sampling interval. For the slowest flow reported here, the diffusive noise is not limiting since it still corresponds to SNR
  = 5.
= 5. .
. - The nanochannel has a height of 55 nm instead of 130 nm. For the same average flow velocity, the flow rate is simply reduced by the smaller channel cross-section.
- The length of each electrode is increased from 50 μm to 100 μm. As shown below (Figure 6), this increases the signal strength because the correlation in a longer plug of fluid takes more time to decay. However, a longer electrode also has the undesirable effect of decreasing the SNR according to Equation (2),
![Micromachines 04 00138 i022]() (
( ![Micromachines 04 00138 i015]() 𝑣/𝐿)1/2. For our measurement parameters (T > 100 s, v > 10 μm/s, L = 100 μm, SNR > 10), this is however not limiting.
𝑣/𝐿)1/2. For our measurement parameters (T > 100 s, v > 10 μm/s, L = 100 μm, SNR > 10), this is however not limiting. - Since our method relies on the detection of purely stochastic noise, sensitivity is increased by sampling traces with longer durations T. Our previous instrumentation (Keithley 6430 sub-femtoamp source meters) limited the current-time traces to a length of 25 s (at a fast
![Micromachines 04 00138 i019]() = 100 s−1 acquisition rate). The instrumentation used here allowed extending the measurement period to up to 600 s at the same sampling interval. Therefore the traces are considerably longer than the decay time
= 100 s−1 acquisition rate). The instrumentation used here allowed extending the measurement period to up to 600 s at the same sampling interval. Therefore the traces are considerably longer than the decay time ![Micromachines 04 00138 i023]() and the SNR is improved.
and the SNR is improved.


 . However, for our current setup, the sensitivity is ultimately limited by instrumental drift of the measured current of about 0.5% or 1 nA peak-to-peak, most likely caused by temperature drift. This external noise occurs on time scales of up to several 10’s of mHz and can be reduced by high-pass filtering (4th order Butterworth filter) with a f = 100 mHz cutoff frequency. The drift essentially prohibits detection of slower flow rates with corresponding times of flight longer than about 10 s. For longer times, the diffusion noise is lost in the instrumental drift, which occurs at the same time scales but exhibits a larger amplitude.
 4.2. Geometric Design Rules

 , and the downstream electrode is located at
  Compared to expressing G as a function of one electrode length and a gap length in between the electrodes [4], the expression shown here more generally allows for asymmetric electrodes as well as ‘negative’ gap lengths, i.e., overlapping electrodes. In Figure 6, the impact of different electrode lengths on the shape of the cross-correlation function is shown for a mean flow velocity of v = 100 μm/s, D = 5 × 10⁻¹⁰ m2/s and no gap between the electrodes
  . With increasing sensor length
  the magnitude of the peak in the correlation function increases, which is favorable. The position of the peak however simultaneously shifts to longer times. Therefore, increasing the detector length beyond several hundreds of μm will not deliver a more sensitive flow detection, since long times of flight are obscured by instrumental drift. Furthermore, the pressure necessary to drive a given flow increases linearly with the channel length and can then exceed 1 bar for a typical channel cross-section, which is often impractically high..
.
the magnitude of the peak in the correlation function increases, which is favorable. The position of the peak however simultaneously shifts to longer times. Therefore, increasing the detector length beyond several hundreds of μm will not deliver a more sensitive flow detection, since long times of flight are obscured by instrumental drift. Furthermore, the pressure necessary to drive a given flow increases linearly with the channel length and can then exceed 1 bar for a typical channel cross-section, which is often impractically high..
.
 0 μm (red curve). For longer flight paths, the influence of diffusion during a longer flight becomes more dominant and the peaks are shallower (orange curves).
  100 μm. Green curve: Autocorrelation, which corresponds to L2 = 0; blue curves: intermediate auto-cross-correlation for a gap length L2 - L1 = −75 μm, −50 μm, −25 μm; red, orange, purple curves: cross-correlation with L2 - L1 = 0 μm…1000 μm.
100 μm. Green curve: Autocorrelation, which corresponds to L2 = 0; blue curves: intermediate auto-cross-correlation for a gap length L2 - L1 = −75 μm, −50 μm, −25 μm; red, orange, purple curves: cross-correlation with L2 - L1 = 0 μm…1000 μm.
100 μm. Green curve: Autocorrelation, which corresponds to L2 = 0; blue curves: intermediate auto-cross-correlation for a gap length L2 - L1 = −75 μm, −50 μm, −25 μm; red, orange, purple curves: cross-correlation with L2 - L1 = 0 μm…1000 μm.
 <
<  , purple curve in Figure 7), the cross-correlation functions exhibit a Gaussian shape, and Equation (3) reduces to

 for electrodes of equal length, a standard deviation of
  and a mean or time of flight of
  Such a long flight path between two detectors may allow the “chromatographical” discrimination of two different redox active species if they move at different velocities due to a difference in adsorption.
5. Conclusion and Outlook
, and adsorption. Thus, while detection in the sub-picoliter-per-minute range is possible, we do not claim a precision measurement in this regime. Acknowledgments
References
- Kuo, J.T.W.; Yu, L.; Meng, E. Micromachined thermal flow sensors–A review. Micromachines 2012, 3, 550–573. [Google Scholar] [CrossRef]
- Silvestri, S.; Schena, E. Micromachined flow sensors in biomedical applications. Micromachines 2012, 3, 225–243. [Google Scholar] [CrossRef]
- Westin, K.J.A.; Choi, C.-H.; Breuer, K.S. A novel system for measuring liquid flow rates with nanoliter per minute resolution. Exp. Fluids 2003, 34, 635–642. [Google Scholar] [CrossRef]
- Mathwig, K.; Mampallil, D.; Kang, S.; Lemay, S.G. Electrical cross-correlation spectroscopy: Measuring picoliter-per-minute flows in nanochannels. Phys. Rev. Lett. 2012, 109. [Google Scholar] [CrossRef]
- Zevenbergen, M.A.G.; Wolfrum, B.L.; Goluch, E.D.; Singh, P.S.; Lemay, S.G. Fast electron transfer kinetics probed in nanofluidic channels. J. Am. Chem. Soc. 2009, 131, 11471–11477. [Google Scholar]
- Kang, S.; Mathwig, K.; Lemay, S.G. Response time of nanofluidic electrochemical sensors. Lab Chip 2012, 12, 1262–1267. [Google Scholar] [CrossRef]
- Liang, H.; Nam, W.J.; Fonash, S.J. A Novell Parallel Flow Control (PFC) System for Syringe Driven Nanofluidics. In Proceedings of the NSTI Nanotechnology Conference and Trade Show, Boston, MA, USA, 1–5 June 2008; Volume 3, pp. 281–283.
- Singh, P.S.; Chan, H.-S.M.; Kang, S.; Lemay, S.G. Stochastic amperometric fluctuations as a prove for dynamic adsorption in nanofluidic electrochemical systems. J. Am. Chem. Soc. 2011, 133, 18289–18295. [Google Scholar]
- Gervais, T.; Eli-Ali, J.; Günther, A.; Jensen, K.F. Flow-induced deformation of shallow microfluidic channels. Lab Chip 2006, 6, 500–507. [Google Scholar] [CrossRef]
- Singh, P.S.; Kätelhön, E.; Mathwig, K.; Wolfrum, B.; Lemay, S.G. Stochasticity in single-molecule nanoelectrochemistry: Origins, consequences, and solutions. ACS Nano 2012, 6, 9662–9671. [Google Scholar] [CrossRef]
- Koppel, D.E. Statistical accuracy in fluorescence correlation spectroscopy. Phys. Rev. A 1974, 10, 1938–1945. [Google Scholar] [CrossRef]
- Kask, P.; Günther, R.; Axhausen, P. Statistical accuracy in fluorescence fluctuation experiments. Eur. Biophys. J. 1997, 25, 163–169. [Google Scholar] [CrossRef]
- Zevenbergen, M.A.G.; Singh, P.S.; Goluch, E.D.; Wolfrum, B.L.; Lemay, S.G. Electrochemical correlation spectroscopy in nanofluidic cavities. Anal. Chem. 2009, 81, 8203–8212. [Google Scholar] [CrossRef]
- Mathwig, K.; Mampallil, D.; Kang, S.; Lemay, S.G. Detection of Sub-Picoliter-per-Minute Flows by Electrochemical Autocorrelation Spectroscopy. In Proceedings of the 16th International Conference on Miniaturized Systems for Chemistry and Life Sciences (MicroTAS), Okinawa, Japan, 28 October–1 November 2012; pp. 28–30.
- Bazant, M.Z.; Squires, T.M. Induced-charge electrokinetic phenomena. Curr. Opin. Colloid Interface Sci. 2010, 15, 203–213. [Google Scholar] [CrossRef]
- Magde, D.; Webb, W.W.; Elson, E.L. Fluorescence correlation spectroscopy. III. Uniform translation and laminar flow. Biopolymers 1978, 17, 361–376. [Google Scholar] [CrossRef]
© 2013 by the authors; licensee MDPI, Basel, Switzerland. This article is an open access article distributed under the terms and conditions of the Creative Commons Attribution license (http://creativecommons.org/licenses/by/3.0/).
Share and Cite
Mathwig, K.; Lemay, S.G. Pushing the Limits of Electrical Detection of Ultralow Flows in Nanofluidic Channels. Micromachines 2013, 4, 138-148. https://doi.org/10.3390/mi4020138
Mathwig K, Lemay SG. Pushing the Limits of Electrical Detection of Ultralow Flows in Nanofluidic Channels. Micromachines. 2013; 4(2):138-148. https://doi.org/10.3390/mi4020138
Chicago/Turabian StyleMathwig, Klaus, and Serge G. Lemay. 2013. "Pushing the Limits of Electrical Detection of Ultralow Flows in Nanofluidic Channels" Micromachines 4, no. 2: 138-148. https://doi.org/10.3390/mi4020138
APA StyleMathwig, K., & Lemay, S. G. (2013). Pushing the Limits of Electrical Detection of Ultralow Flows in Nanofluidic Channels. Micromachines, 4(2), 138-148. https://doi.org/10.3390/mi4020138