Article

Compact Mass Flow Meter Based on a Micro Coriolis Flow Sensor

1
Bronkhorst High-Tech BV, 7261 AK Ruurlo, The Netherlands
2
Lionix BV, 7522 NH Enschede, The Netherlands
3
Micronit BV, 7521 PV Enschede, The Netherlands
4
Transducers Science and Technology, University of Twente, 7522 NH Enschede, The Netherlands
*
Author to whom correspondence should be addressed.
Micromachines 2013, 4(1), 22-33; https://doi.org/10.3390/mi4010022
Submission received: 17 December 2012 / Revised: 5 February 2013 / Accepted: 8 February 2013 / Published: 1 March 2013

Abstract

:
In this paper we demonstrate a compact ready-to-use micro Coriolis mass flow meter. The full scale flow is 1 g/h (for water at a pressure drop < 1 bar). It has a zero stability of 2 mg/h and an accuracy of 0.5% reading for both liquids and gases. The temperature drift between 10 and 50 °C is below 1 mg/h/°C. The meter is robust, has standard fluidic connections and can be read out by means of a PC or laptop via USB. Its performance was tested for several common gases (hydrogen, helium, nitrogen, argon and air) and liquids (water and isopropanol). As in all Coriolis mass flow meters, the meter is also able to measure the actual density of the medium flowing through the tube. The sensitivity of the measured density is ~1 Hz.m3/kg.

1. Introduction

Microfluidic systems have gained a lot of interest in the last decade in a wide area of applications [1]. Examples of such can be found in the analytical field, (bio)-chemistry, medical and in industry. These fields require in-line measurement and control of mass transport. Several methods of flow measurement have been developed over the years. Examples are thermal or acoustic measurement methods. More information on several different methods of flow measurements related to microfluidic devices can be found in a review article written by Nguyen [2]. Since mixtures of varying composition are often found, a real mass flow sensor is required. Haneveld et al. presented such a mass flow sensor based on the measurement of the Coriolis Effect [3]. An interesting aspect of this mass flow sensor is the thin wall with respect to the inner diameter (ID) of the tube (~1 µm wall thickness vs. ~38 µm ID).
However, to be useful in the field, the sensor should be packaged and have a simple and robust (electric and fluidic) connection to the outside world.

1.1. Novelty

Here we demonstrate packaging of a micro Coriolis mass flow sensor into a stainless steel housing (Figure 1). Several experiments were performed to characterize the behavior of the meter. The meter is ready-to-use by integrating interface electronics and standard fluidic connections. The electrical connection is a standard Bronkhorst High-Tech connection that can be connected to a PC or laptop via USB. The fluidic connections in the current design are 1/16” Swagelok connectors.
Figure 1. Micro Coriolis mass flow sensor integrated into a robust housing using a custom-made chip holder. 1/16” stainless steel tubes are connected to the chip: (a) First design; (b) Realization.
Micromachines 04 00022 g001

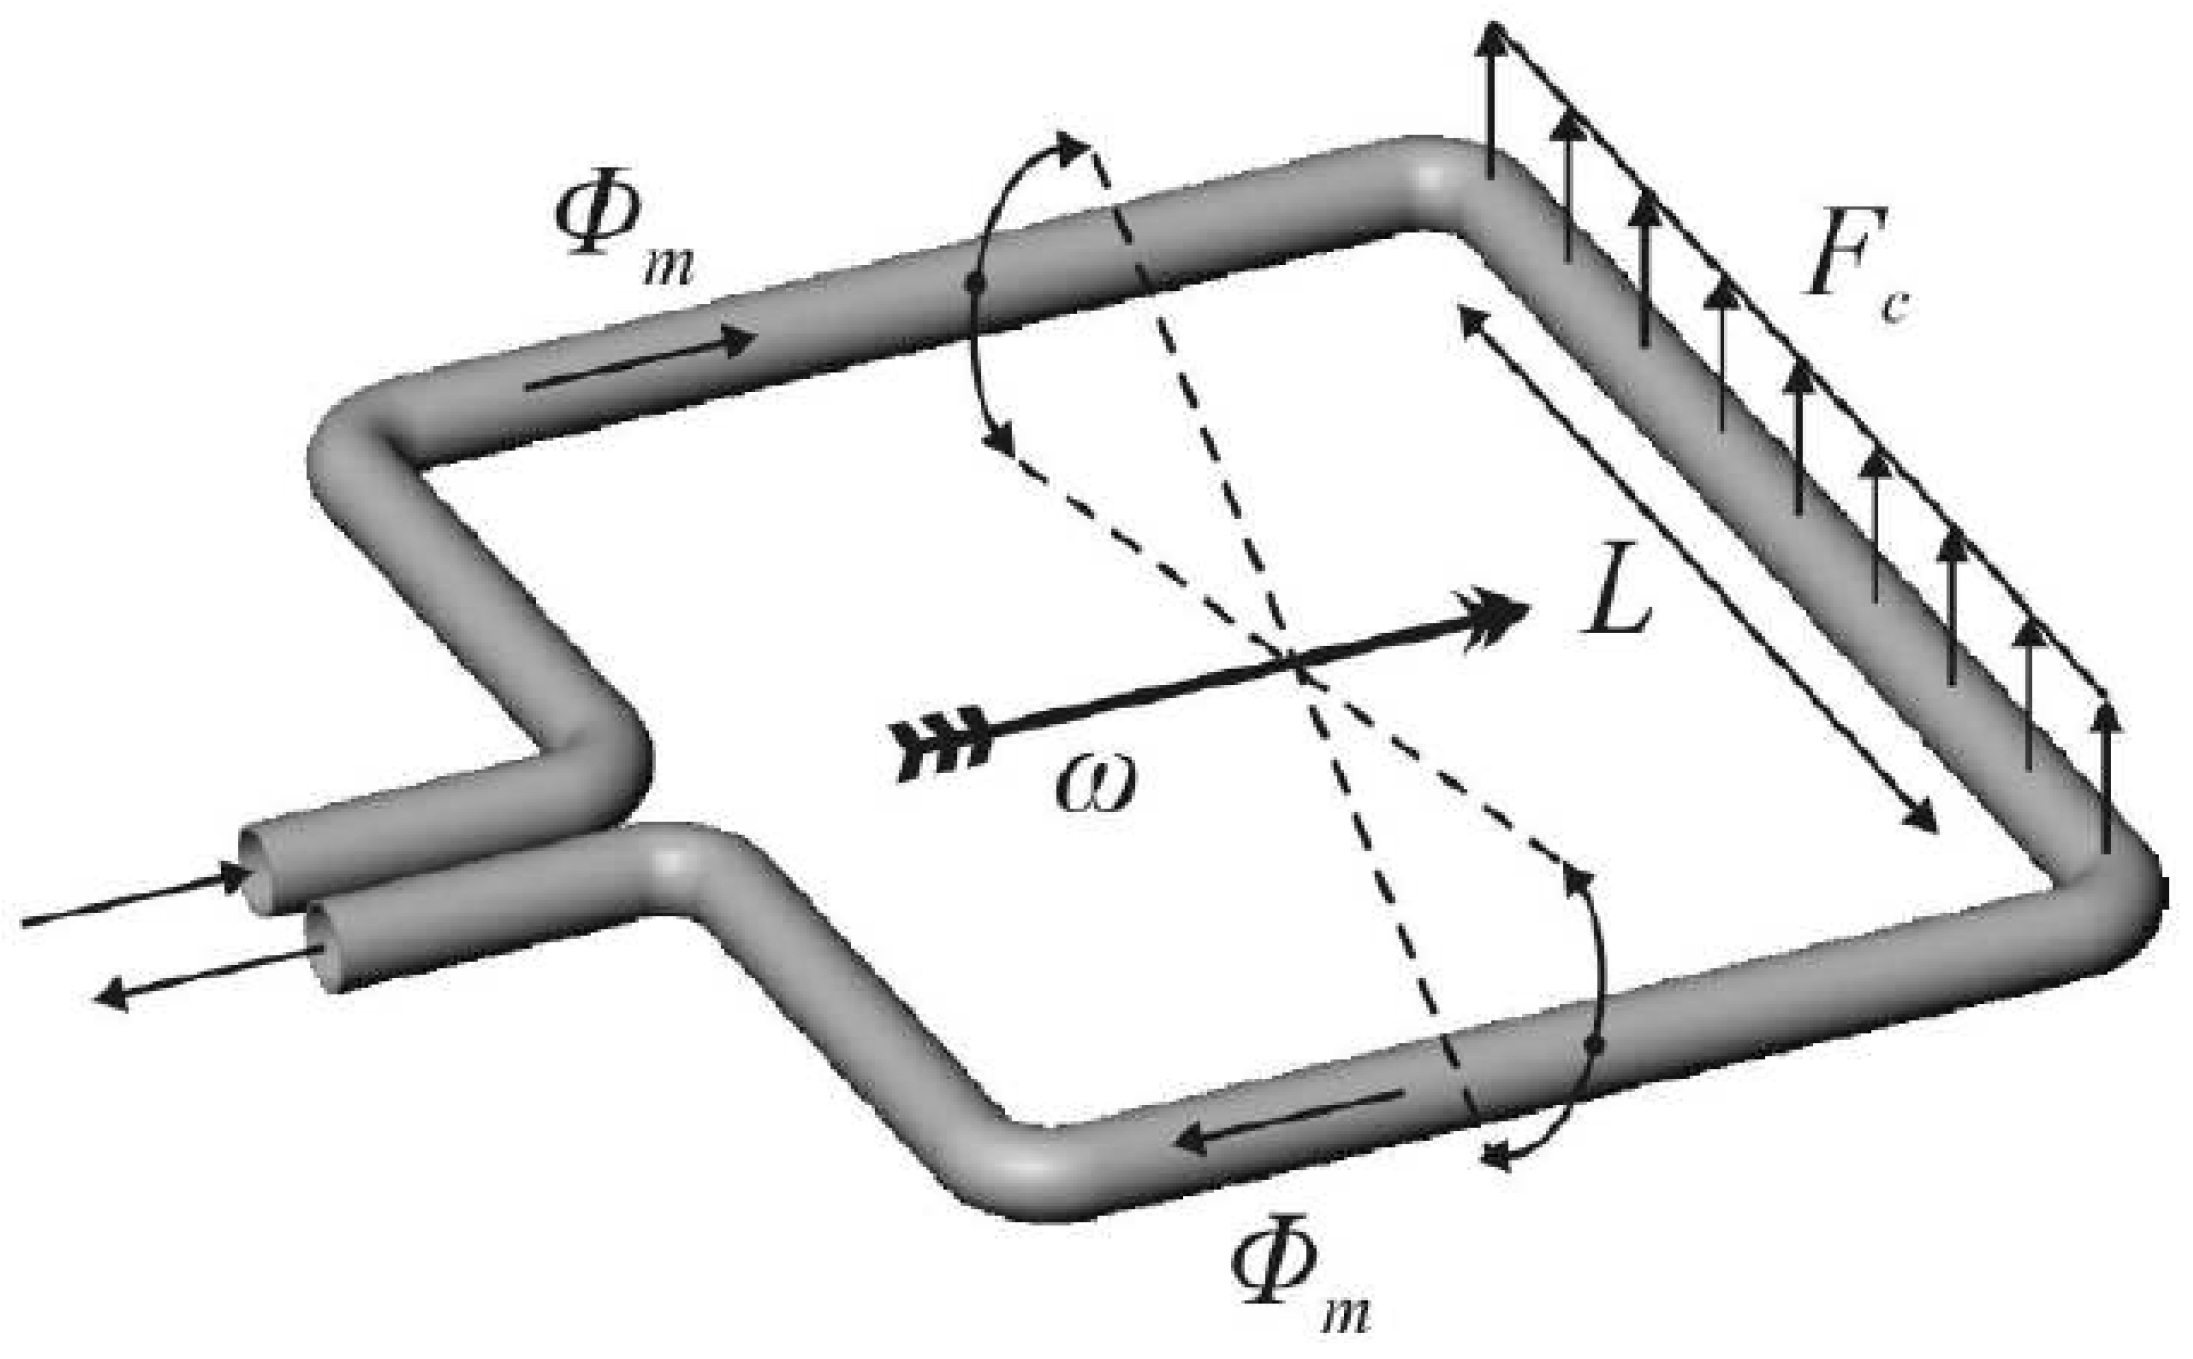
1.2. Sensor Structure and Operating Principle

The functioning of the Coriolis mass flow meter is described in Figure 2. By Lorentz actuation, the tube is brought into resonance. The movement is an alternating rotational displacement of 1 to 10 µm around the x-axis (torsion mode). A flow running through the section of the tube that is indicated by L causes an alternating force in the z-direction around the y-axis (swing mode). This force is called Coriolis force and causes a displacement of the tube roughly between 1 and 100 nm.
Figure 2. Rectangular shaped Coriolis flow sensor. The tube is brought into resonance by Lorentz actuation at an angular velocity, ω, the displacement at the corners of the tube is between 1 and 10 µm; Fc indicates the Coriolis force as a result of mass flow Φm through the part of the tube indicated by L; this force causes a displacement of roughly between 1 and 100 nm.
Micromachines 04 00022 g002

2. Experimental Section

In this section the experimental details are presented. In the first subsection the microfluidic chip and packaging details are given. In the second subsection the details of the experimental setups are presented.

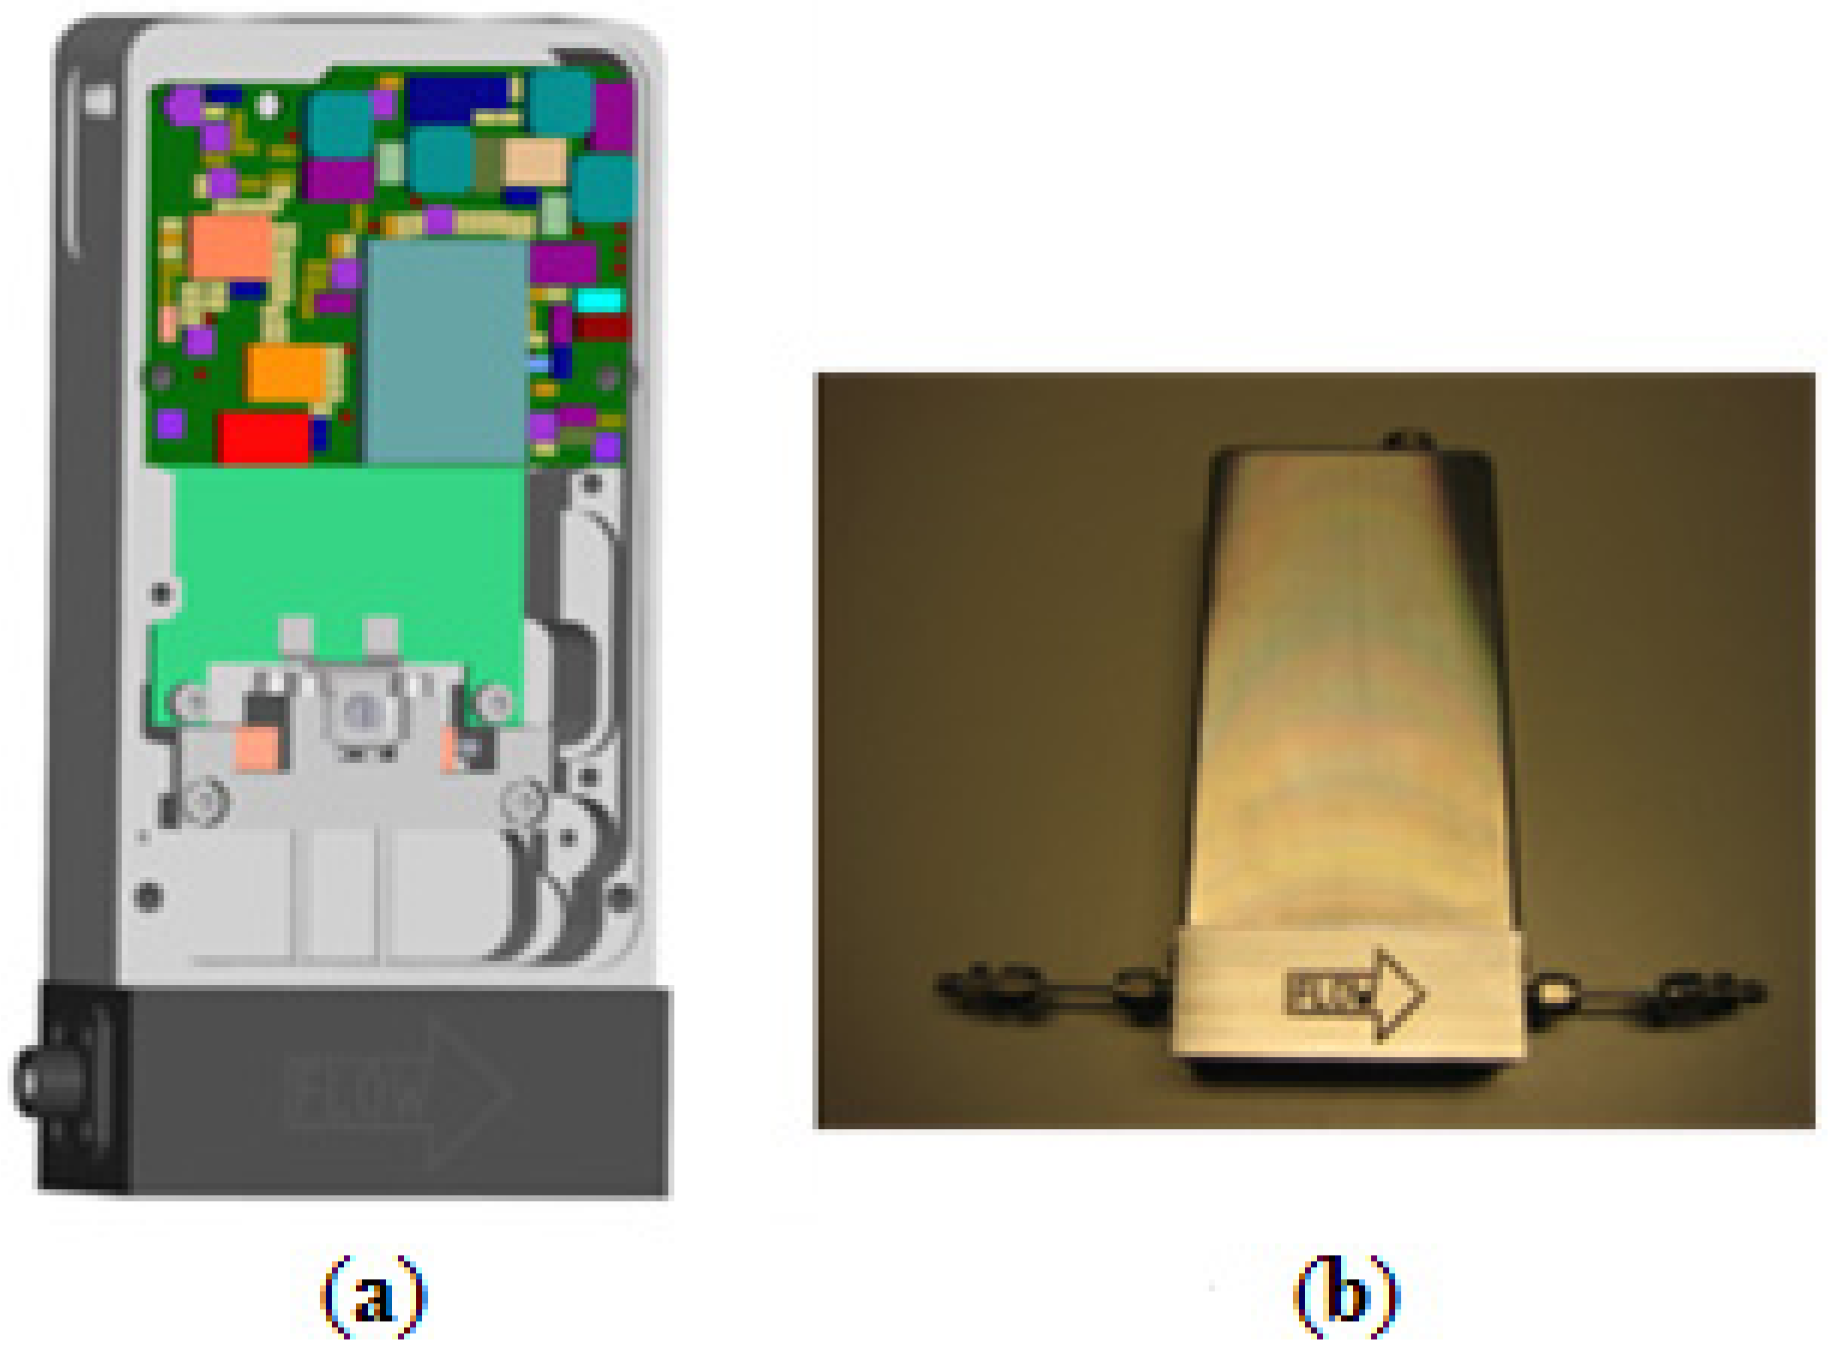
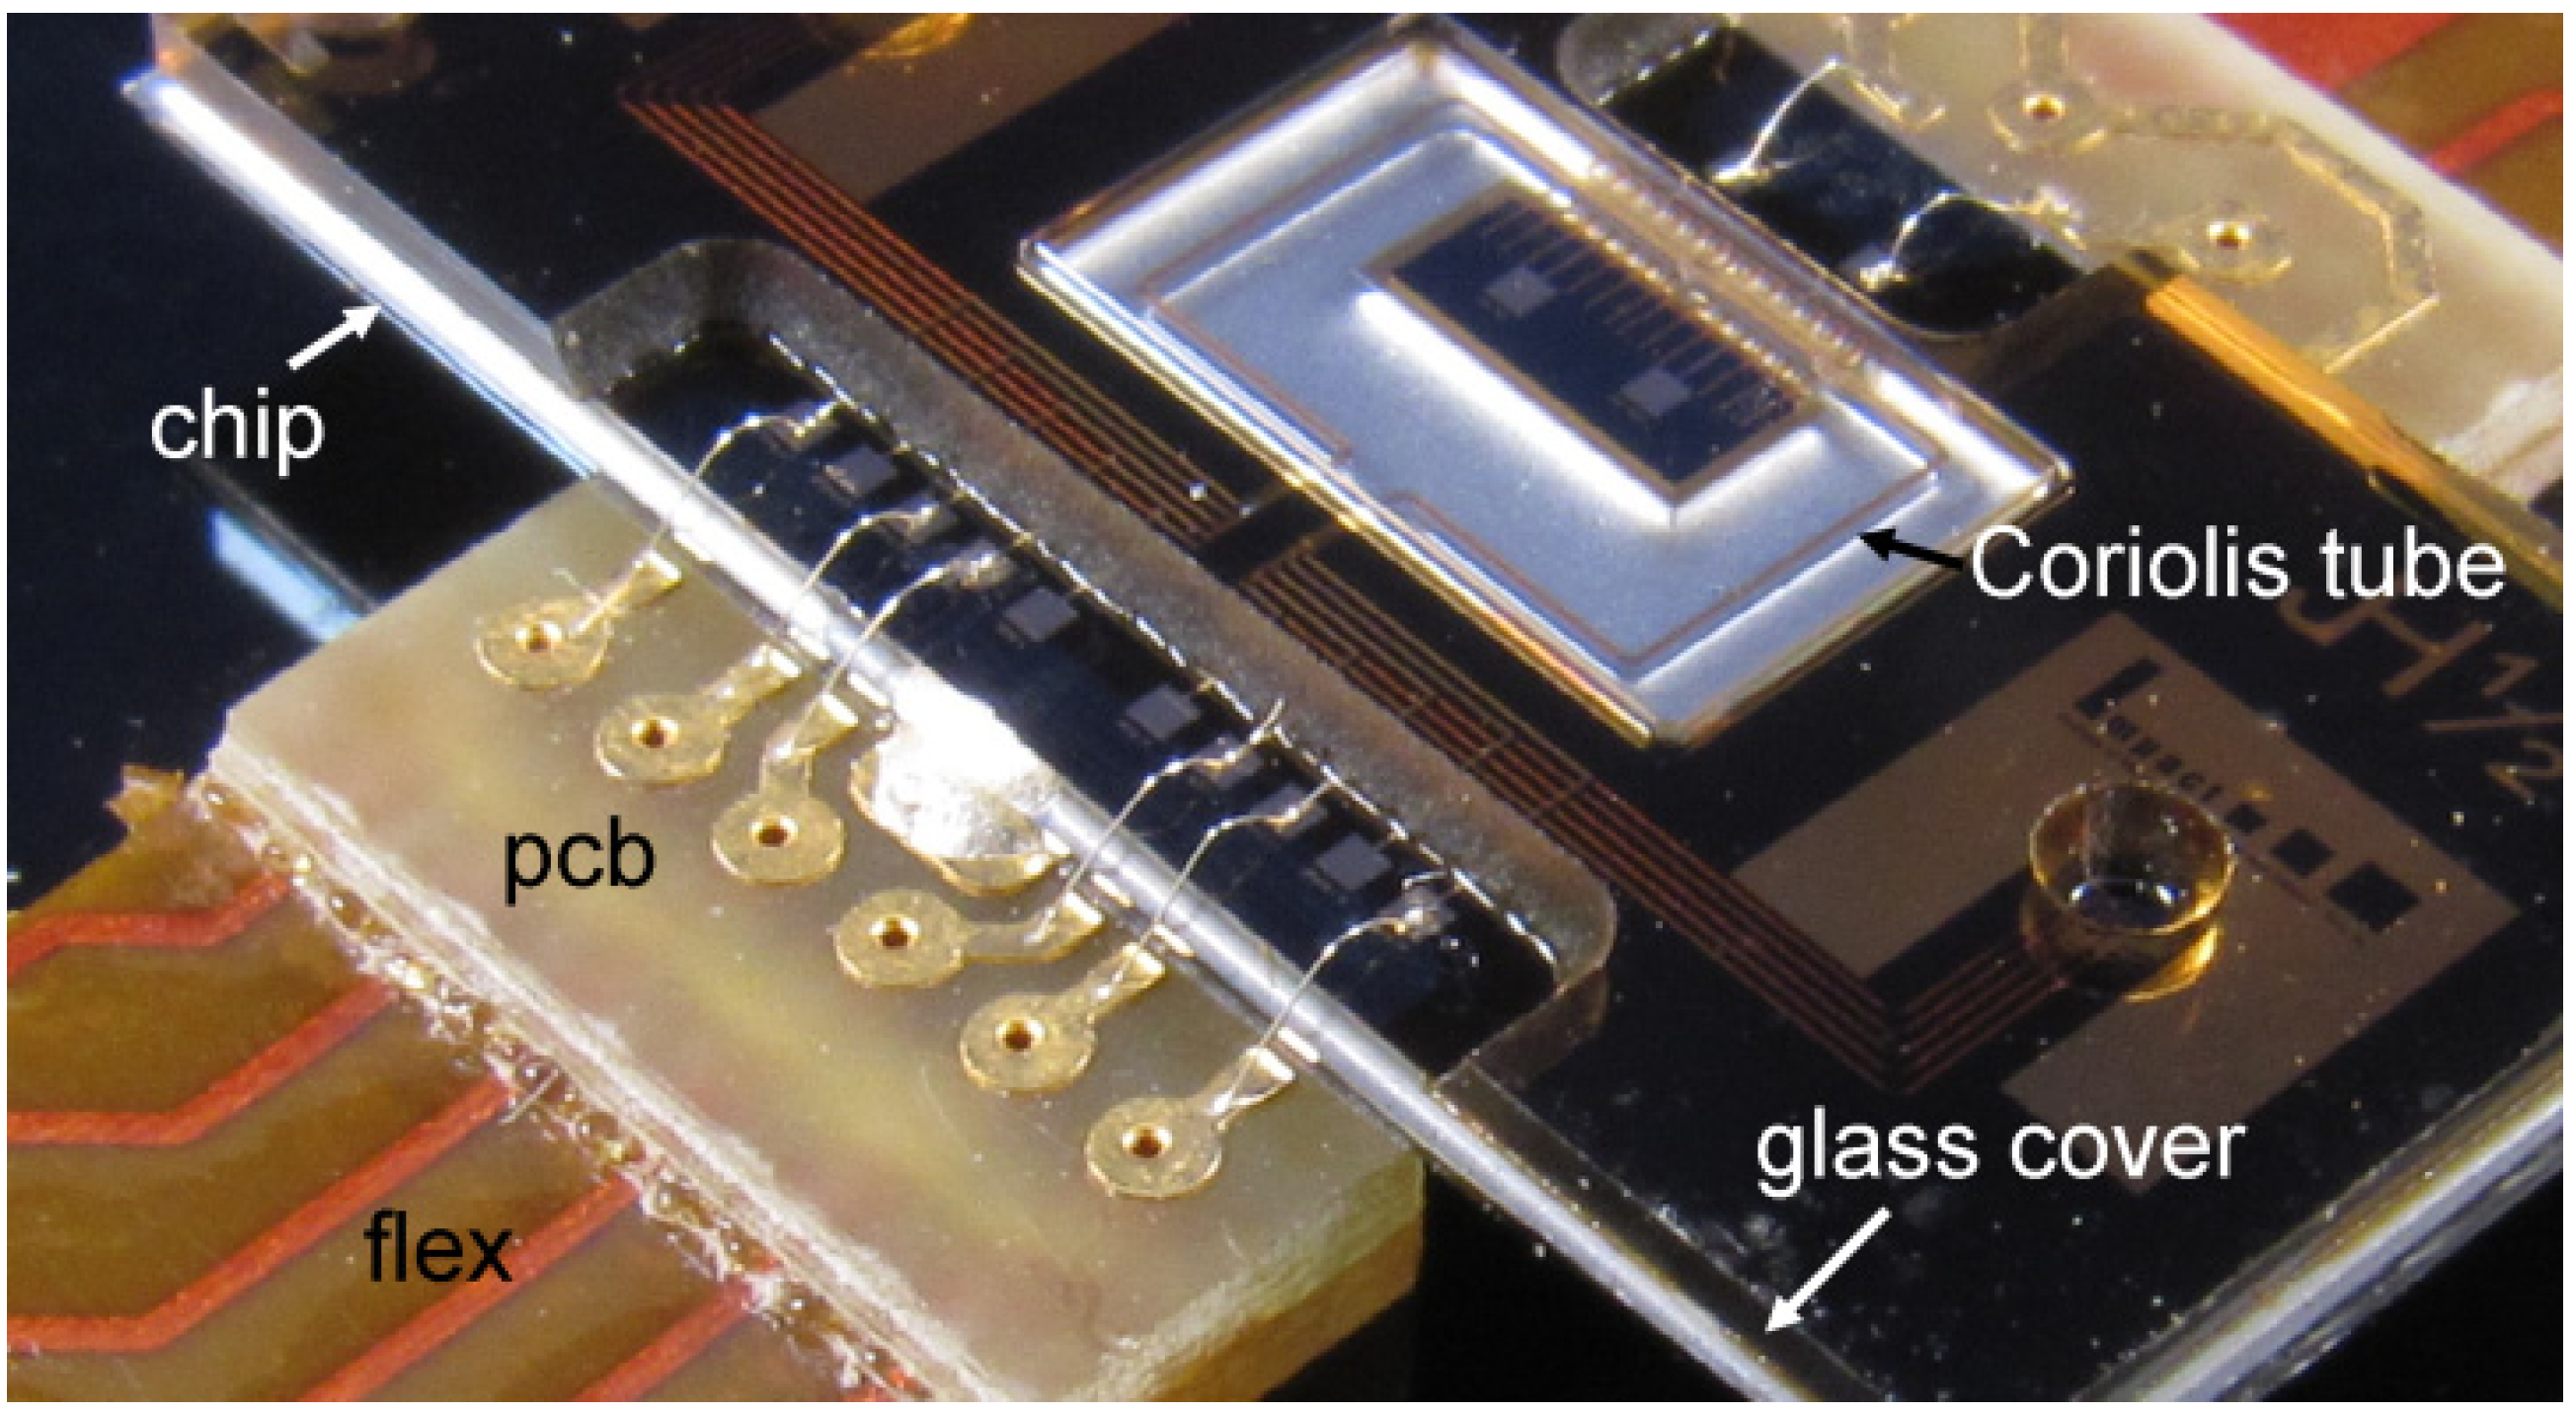
2.1 Microfluidic Chip, Packaging and Interfacing Details

2.1.1. Chip and Packaging

The chip is fabricated using surface micromachining techniques. Details can be found in [4]. To protect the relatively fragile Coriolis tube a glass cover is glued on top of the chip. The combination is then glued to a printed circuit board (PCB) after which wirebonds are made to connect the chip electrically. In Figure 3 a photograph of the chip and PCB can be found.
Figure 3. Micro Coriolis chip glued to a printed circuit board (PCB). Electrical connections to the PCB are made with wirebonds.
Micromachines 04 00022 g003

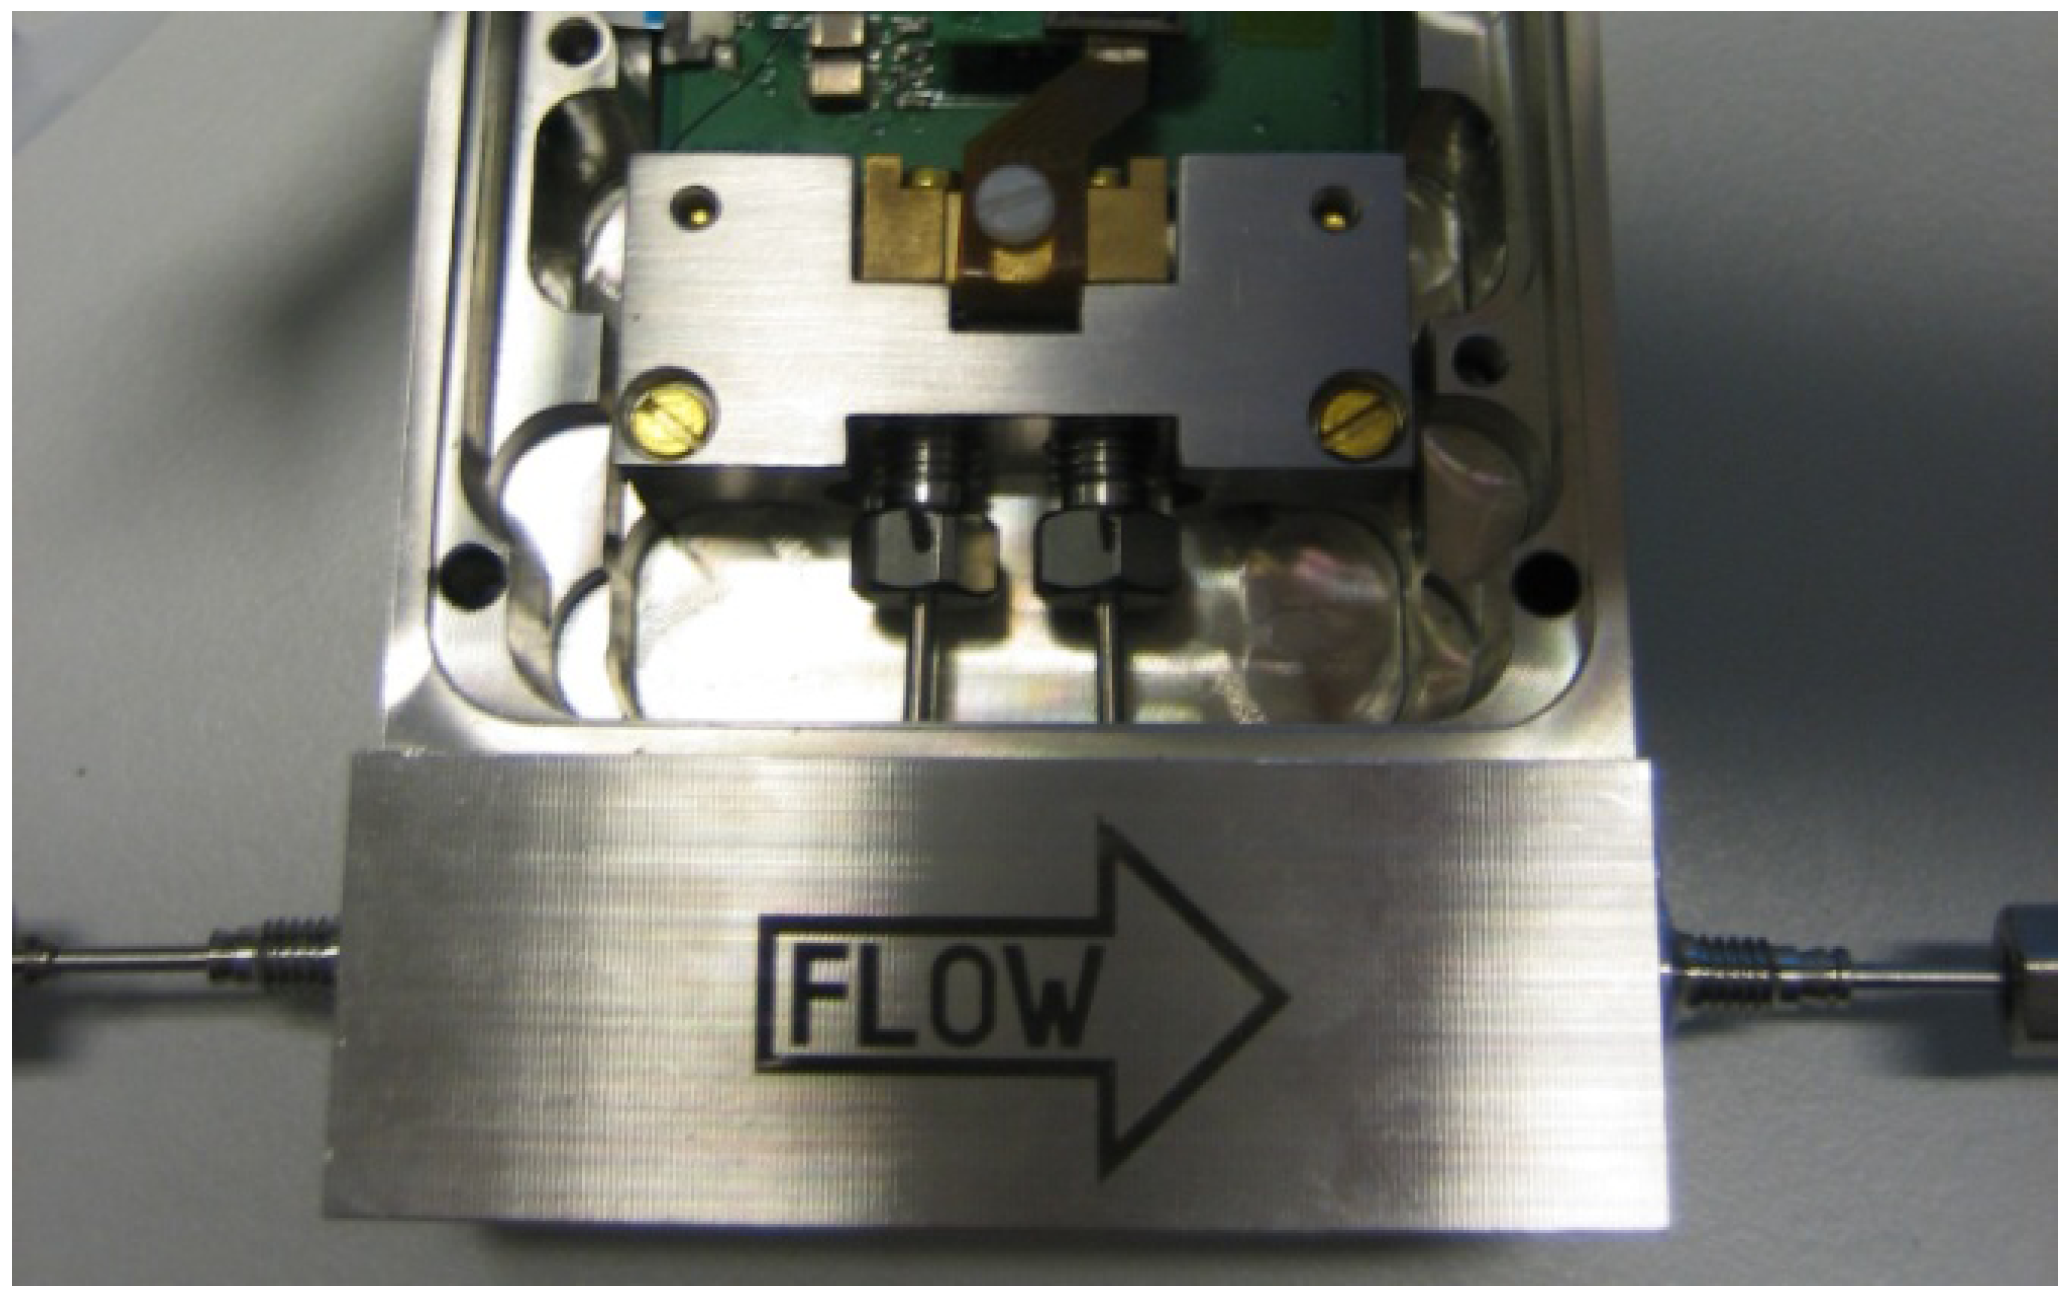
2.1.2. Chip holder and Fluidic Connections

To robustly interface the sensor chip to the rest of a system, we placed the chip into a stainless steel chip holder (Figure 4). This holder forms a steady base to connect the chip fluidically using stainless steel nuts and Tefzel ferrules that connect two 1/16” stainless steel tubes with the chip.
Figure 4. Micro Coriolis mass flow sensor integrated into a robust housing using a custom-made chip holder. 1/16” stainless steel tubes are connected to the chip via a Tefzel ferrule. In the top part the interface, electronics are partly visible.
Micromachines 04 00022 g004

2.1.3. Electronics

It is apparent that the displacement by the Coriolis force is extremely small. This places strong demands on the detection part which is done using electrostatic comb structures [4]. Here displacement of the tube causes a change in capacitance that is transformed into a voltage change. This is detected by a digital signal processor (DSP) via several analog to digital (ADCs) and digital to analog converters (DACs). The chip and the ADCs and DACs are interfaced via a charge amplifier. Details of the detection part can be found in [4].

2.2. Experimental Setups

2.2.1. Pressure and Leak Tests

Several tests were performed. A pressure test was done at the Bronkhorst High-Tech production facility. We did this by pressurizing the meter with compressed nitrogen, after which we closed the system and monitored pressure decay. Also we did a helium leak test. For this we pressurized the meter with helium at a pressure of 20 bar. Then we measured the leak rate with a helium detector. The results of this experiment are given in Section 3.1.

2.2.2. Temperature Coefficient

The influence of ambient temperature on the zero stability was tested by placing the meter inside a climate chamber (Vötsch VC4018). The relative humidity was kept constant at 20%. A temperature sweep was made between 10 and 50 °C in steps of 5 °C. Between steps the temperature was kept constant for two hours. Results of this experiment are given in Section 3.2.

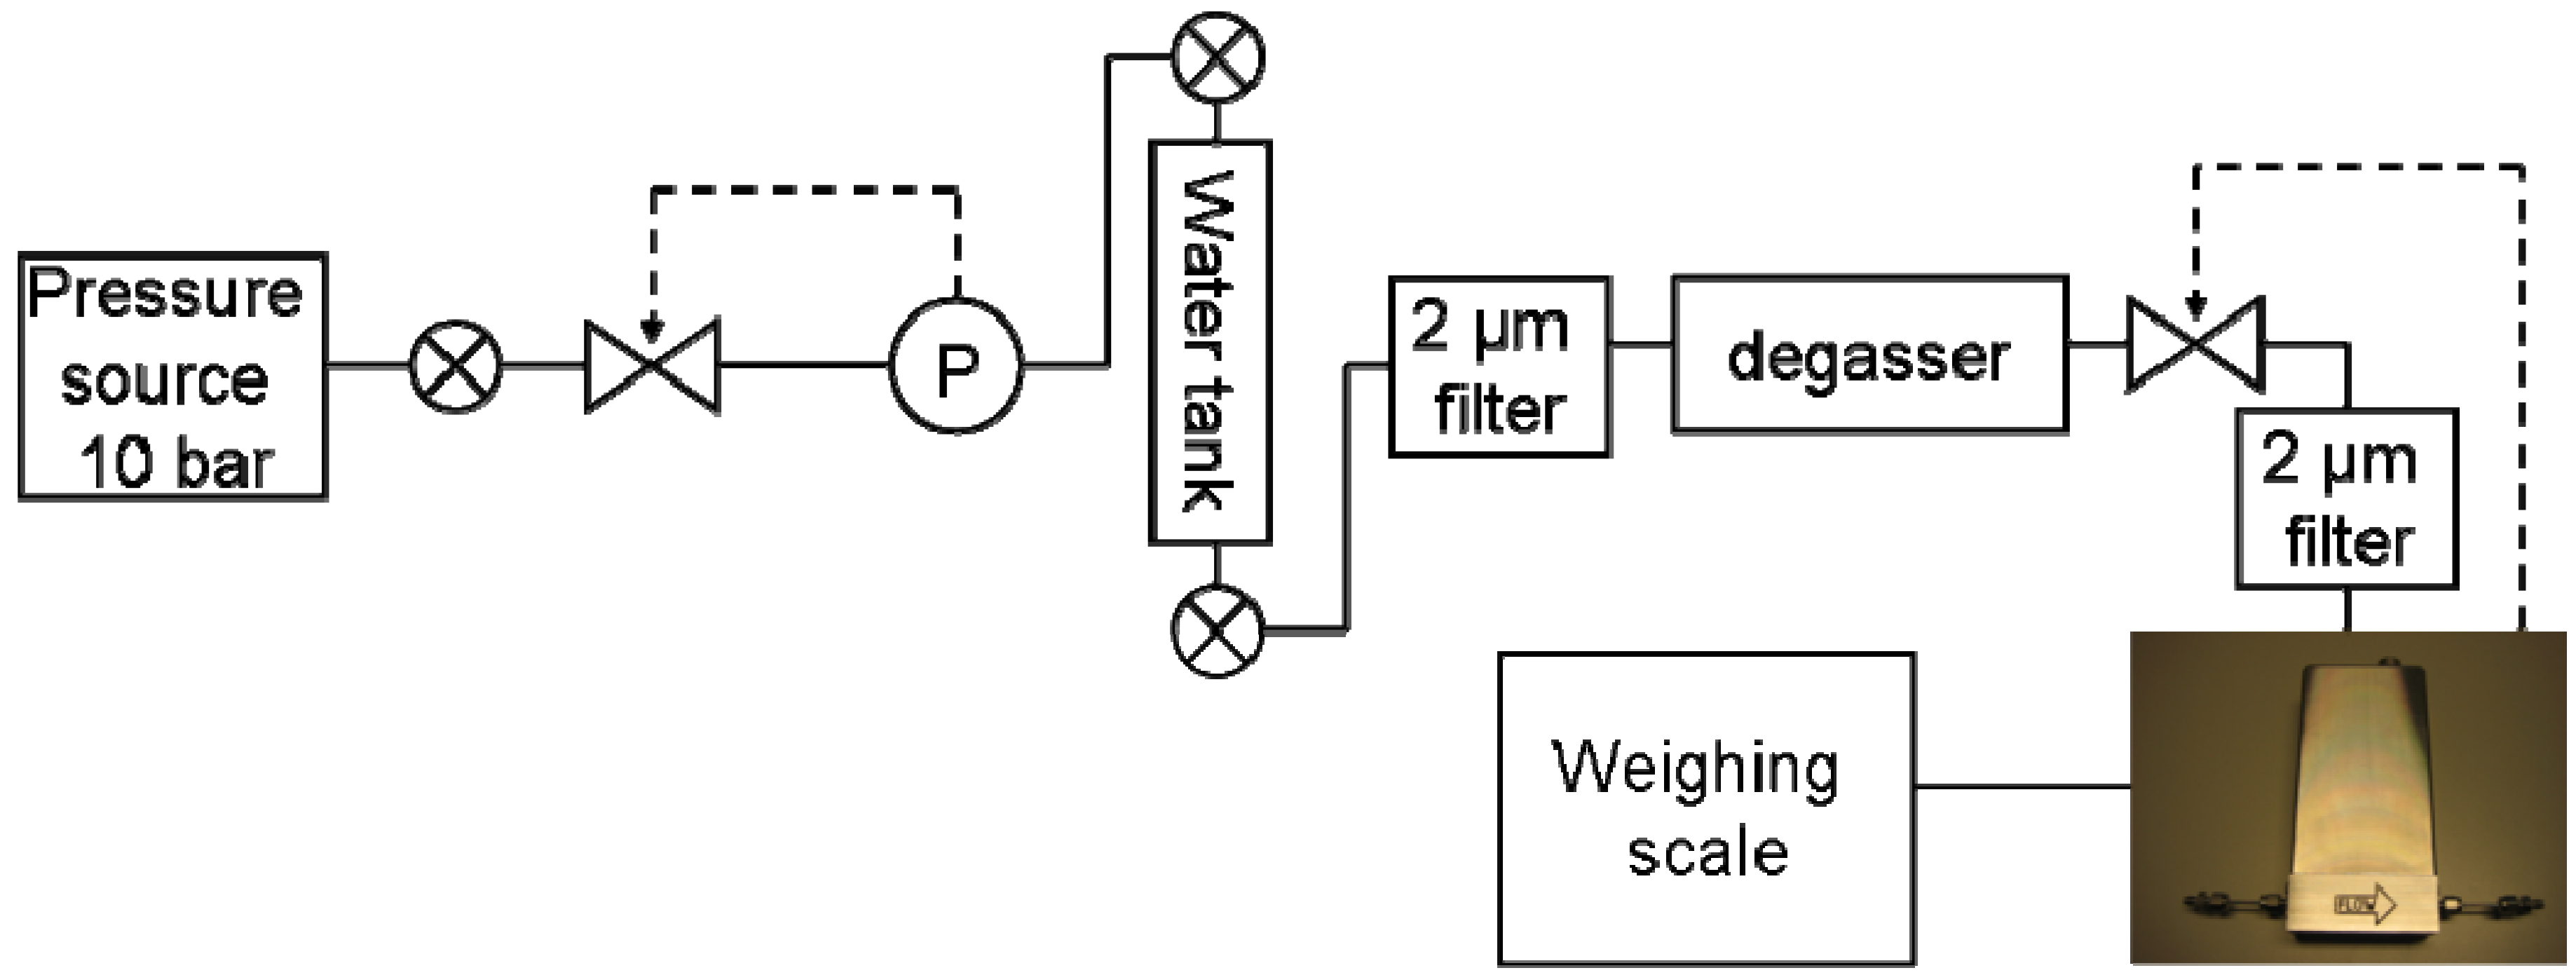
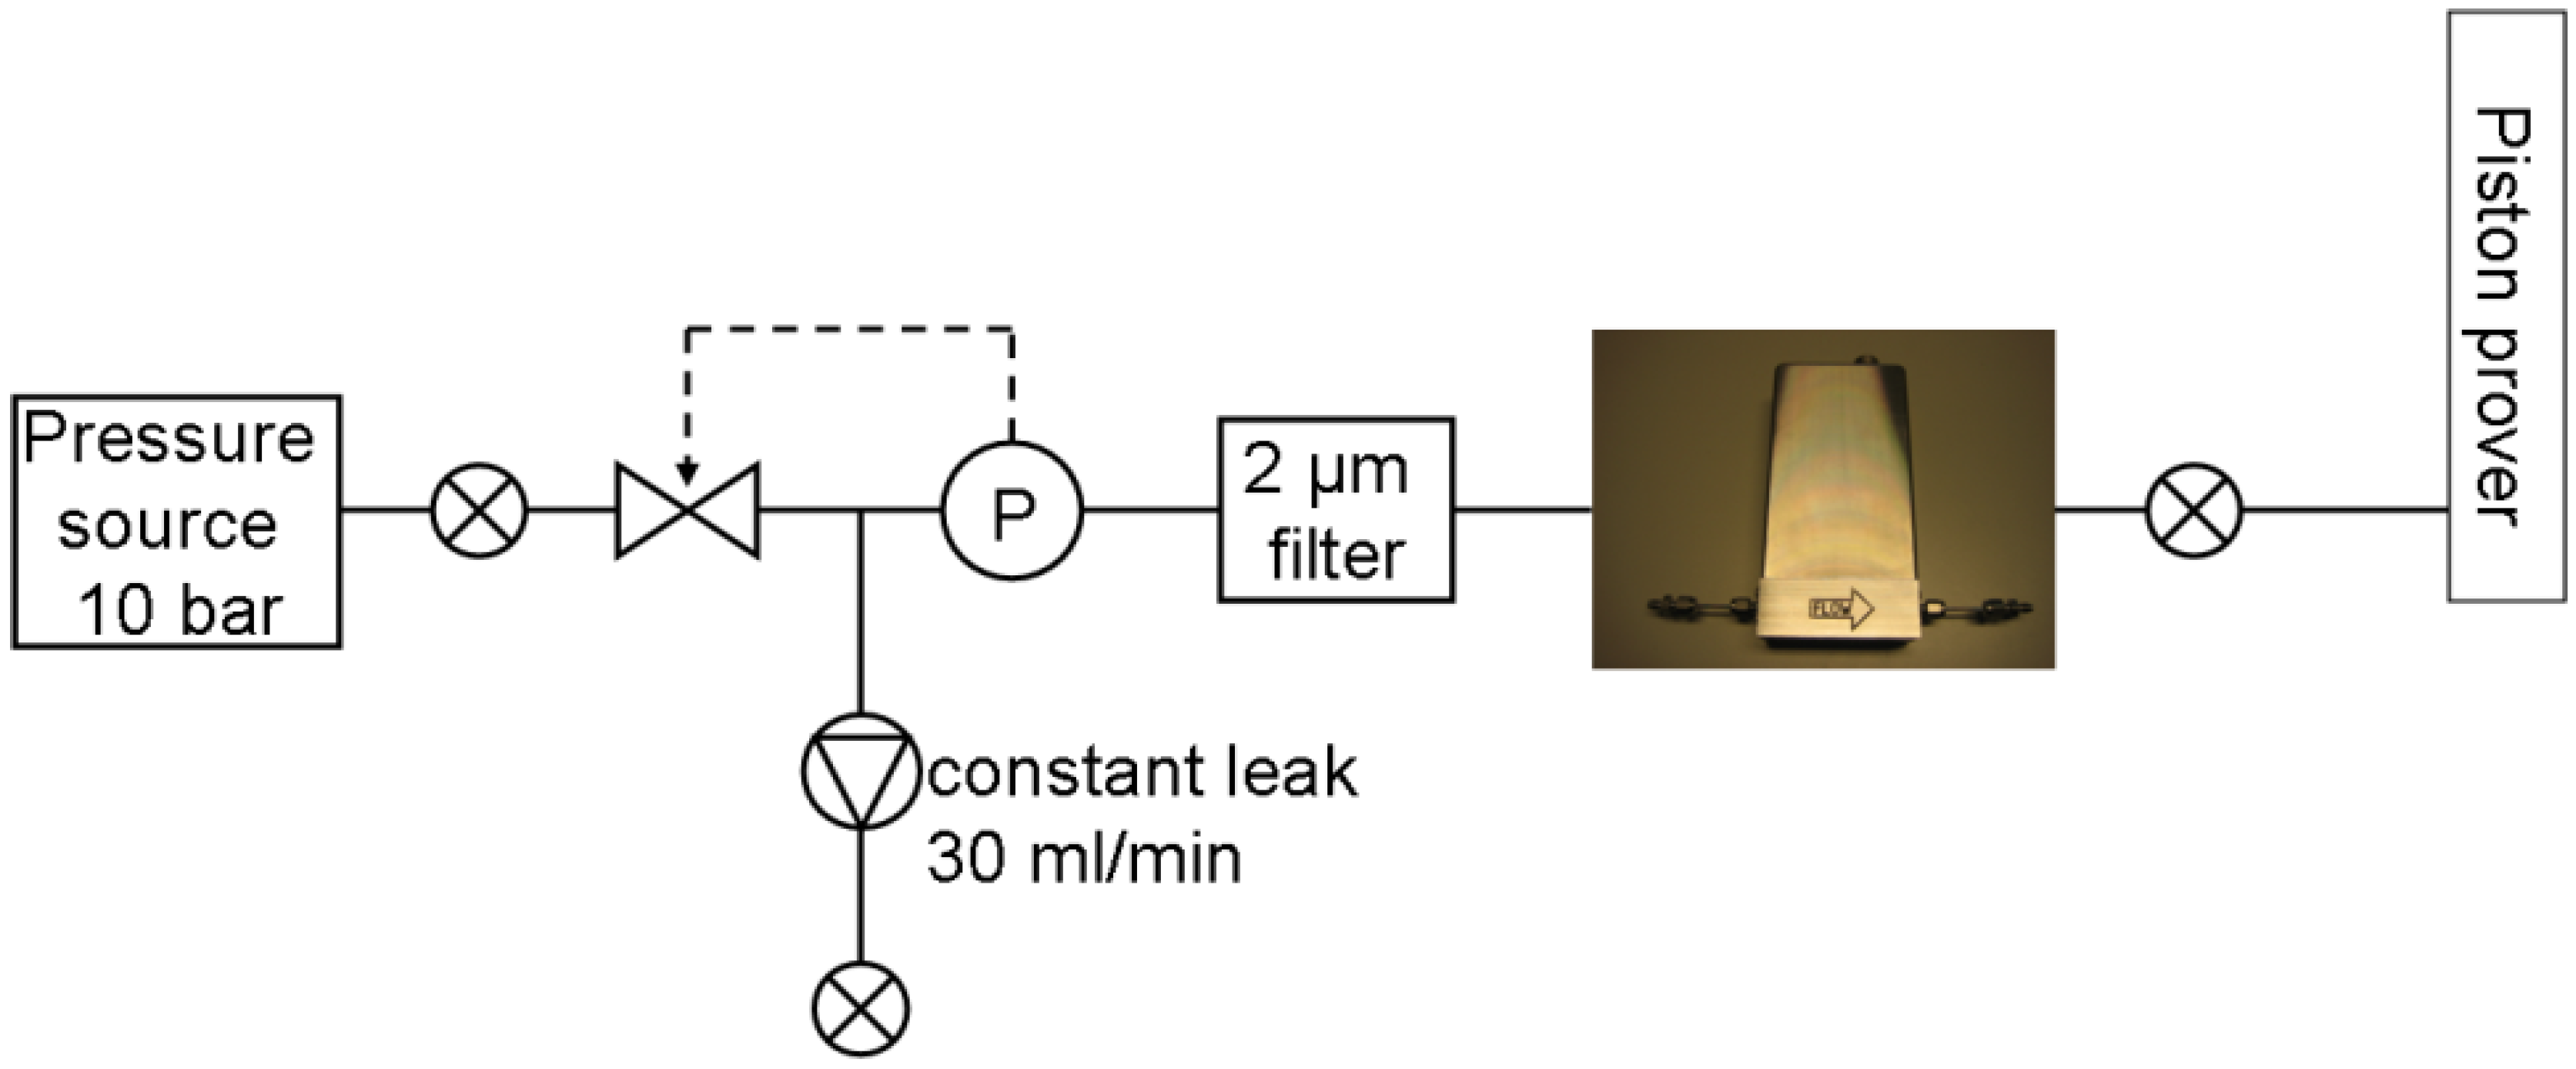
2.2.3. Mass Flow of Liquids

We tested the Coriolis mass flow meter for two different liquids (water, isopropanol (IPA)) in a temperature controlled environment. In this room the temperature was kept between 20 and 25 °C.
Figure 5. Schematic overview of the setup used for the water mass flow measurements. A water tank is pressurized by helium. The helium pressure is controlled using pressure meter P. The water is filtered directly after the tank and again between the valve and the Coriolis mass flow meter. A degasser removes air from the water. As a reference, an AX205 weighing scale was used.
Micromachines 04 00022 g005
In Figure 5 a schematic overview of the setup is given. The mass flow measurements were done by comparing the read-out value of the meter with a weighing scale (Mettler Toledo AX205). A pressure difference across the meter was generated by pressurizing a 300 mL water tank with helium. After this tank a 2 µm peek filter unit (Upchurch Scientific A-355 with an A-700 filter frit) was placed. To prevent interference by air bubbles, the water was degassed in-line by a Systec mini vacuum degasser. The Coriolis mass flow meter was used to control the mass flow rate by driving a normally closed valve (Bronkhorst top-mount valve) that was placed in front of the Coriolis mass flow meter. Between the valve and the meter again a 2 µm filter was placed. This second filter prevents particles that possibly originate from the metal valve, to enter the Coriolis mass flow meter. Via a piece of peek tubing, the water was passed towards a 200 mL glass beaker placed on the weighing scale. The beaker was prefilled with water and topped by a layer of oil to prevent evaporation of water during the measurement. Each point represents a measurement over a period of 4 minutes. We also performed experiments with the mass flow of IPA. Because IPA mixes with oil, we were not able to reliably (uncontrolled evaporation) use the weighing scale for mass flow measurements of IPA. For this purpose we drove mass flow by a syringe pump using calibrated 100 µL syringes. For every step we metered at least 10 µL. The results of these measurements are given in Section 3.3.

2.2.4. Mass Flow of Gases

We tested the Coriolis mass flow meter for several common gases (H2, He, N2, Ar and air) in a temperature controlled environment. Again the temperature was kept between 20 and 25 °C. Here we give the experimental details of these tests. In Figure 6 a schematic overview of the setup is given.
Figure 6. Schematic overview of the setup used for the air mass flow measurements. Air was pressurized at 10 bara. Pressure meter P controls the pressure before the Coriolis mass flow meter. A constant leak of 30 mL/min is necessary for the valve to operate reliably. The filter is placed in front of the Coriolis mass flow meter to prevent clogging. A piston prover is used as a reference.
Micromachines 04 00022 g006
As a reference we used a piston prover (0.1 ln/min). A well-defined pressure difference across the Coriolis mass flow meter was generated by a pressure controller (Bronkhorst EL-press). The maximum pressure we could apply across the Coriolis mass flow meter was 8 bara. As a consequence we could not reach the nominal flow rate of 1g/h. For the valve to operate reliably we generated a constant leak of 30 mln/min with a thermal flow controller (Bronkhorst EL-flow with a nominal flow rate of 50 mln/min). This was necessary to maintain a stable pressure, since the volume flow through the micro Coriolis meter is extremely small. Between the pressure controller and the Coriolis mass flow meter we placed 2 µm filter (Upchurch Scientific A-355 with a A-700 filter frit) to prevent clogging. The meter was directly connected to the piston prover. For each measurement point we did at least three runs. In these runs we let the piston prover pass between the same two detection points. The result for the mass flow measurement of air and hydrogen is presented in Section 3.4.

2.2.5. Density of Gases

We measured the resonance frequency of the tube in the torsion mode for different gases inside the tube at atmospheric pressure. This experiment was performed with the setup given in Figure 6. We did this by flushing the device with the gas of interest for at least half an hour. After this we closed the valves behind the pressure source and behind the meter and waited until the pressure reached atmospheric pressure again. Then we closed the valve after the constant leak and started the density measurement. Each measurement was repeated at least 3 times. In Section 3.5 the result of this measurement is given.

3. Results and Discussion

3.1. Pressure Tests and Leak Tests

The pressure test showed that the Coriolis mass flow meter could withstand a maximum pressure of 40 bar. Details of this measurement can be found in Section 2.2.1. This 40 bar was the minimum value we found after measuring 4 different meters.
We also did a leak test with helium. The helium leak rate at 20 bar is < 1.10−8 mbar·l/s.

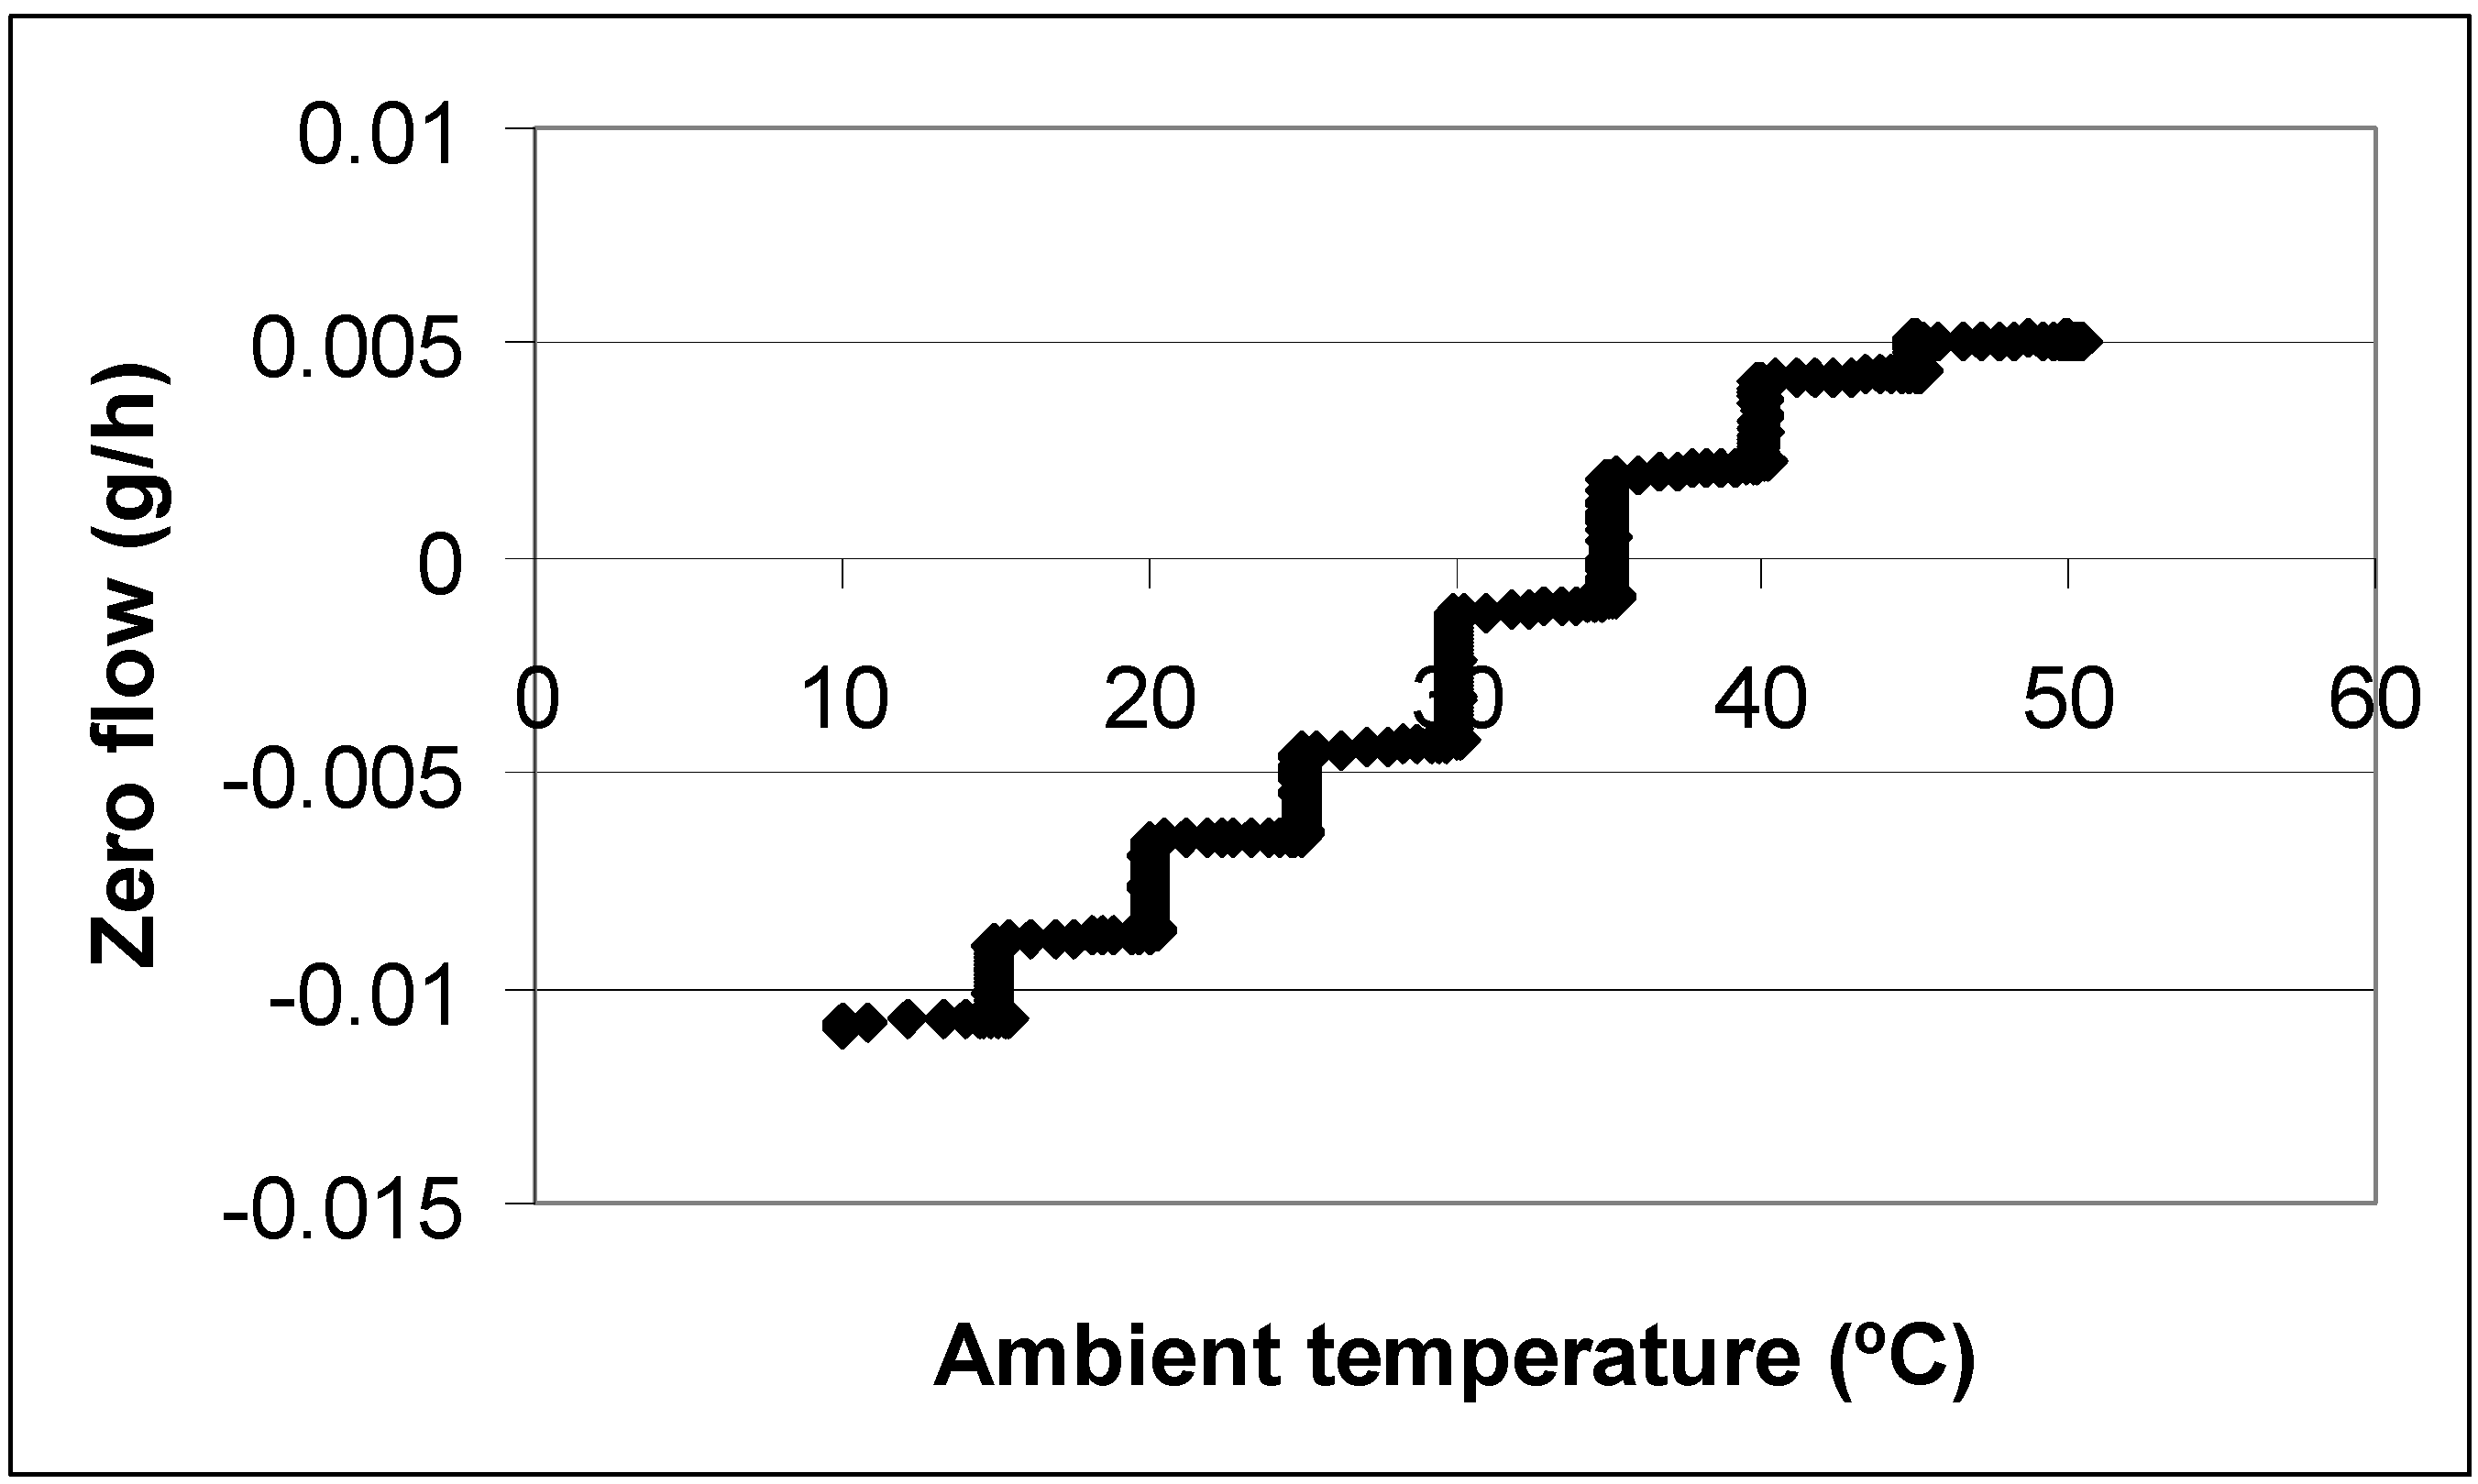
3.2. Temperature Coefficient

Temperature behavior of the meter was tested inside a climate chamber. Details of this test can be found in Section 2.2.2. The results of this experiment are given in Figure 7. This shows a temperature drift between 10 and 50 °C below 1 mg/h/°C.
Figure 7. Measured temperature coefficient of the Coriolis mass flow meter. The meter was placed inside a climate chamber (Vötsch VC4018). The temperature was swept between 10 and 50 °C in steps of 5 °C every 2 h.
Micromachines 04 00022 g007

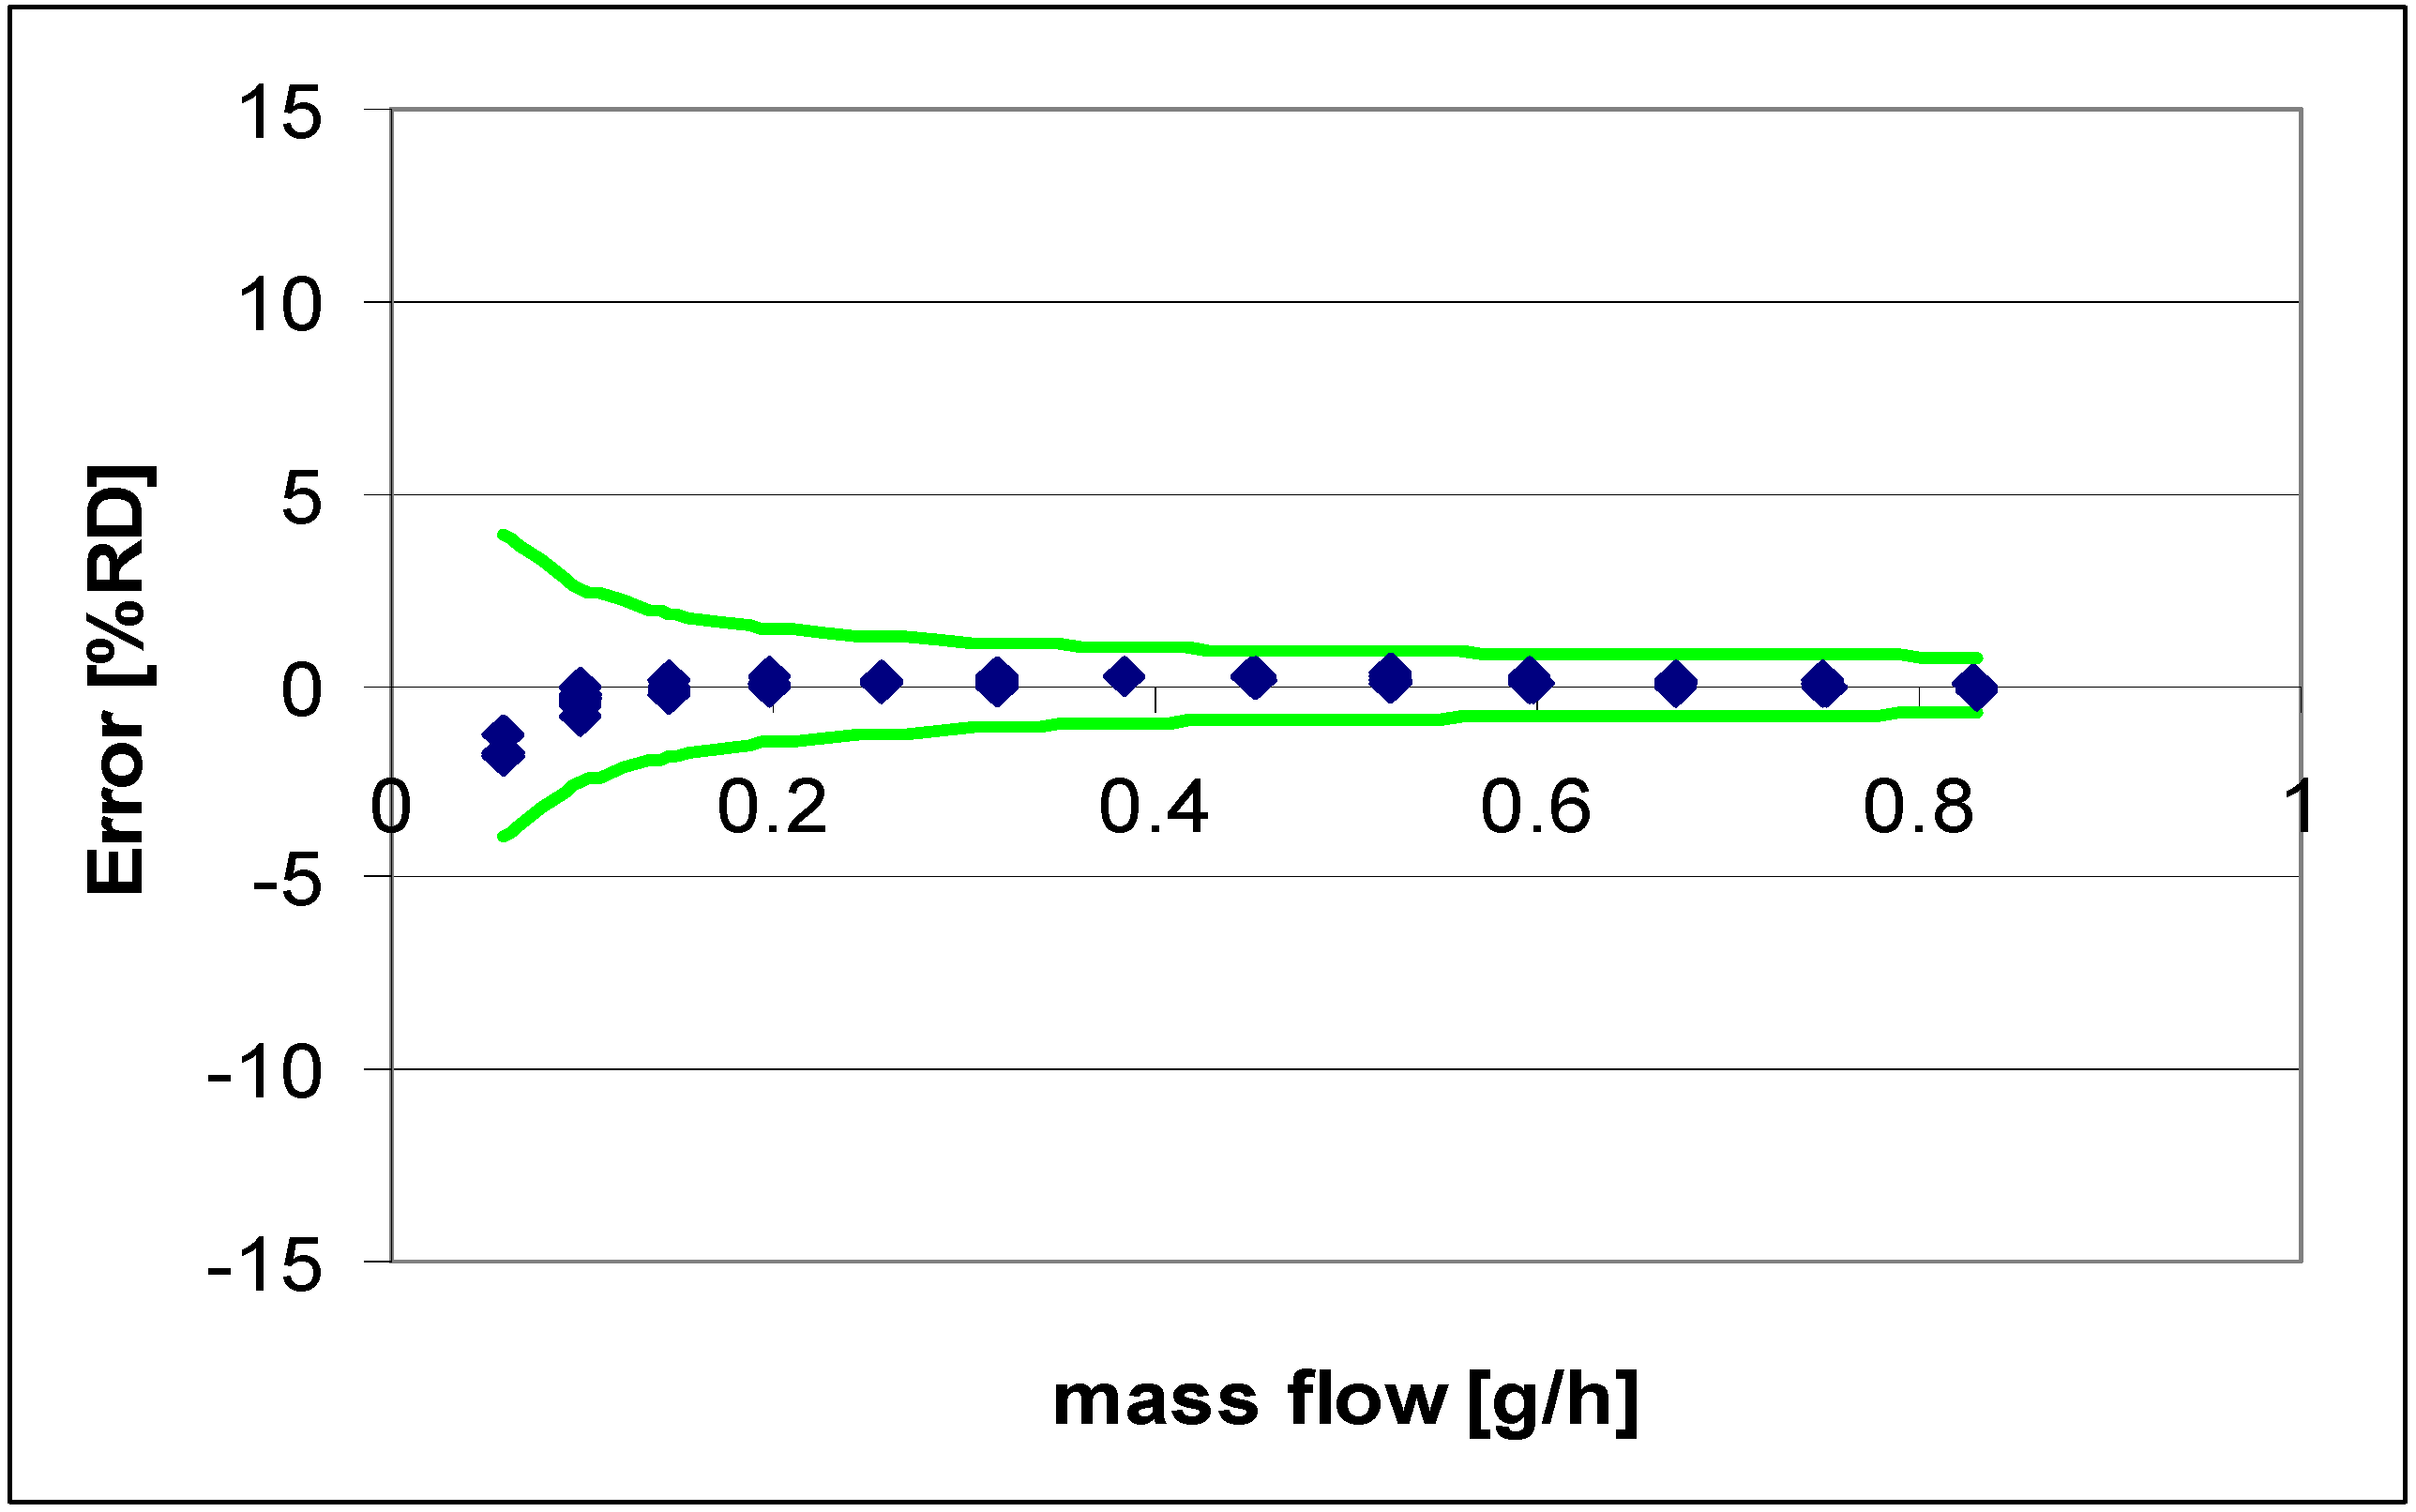
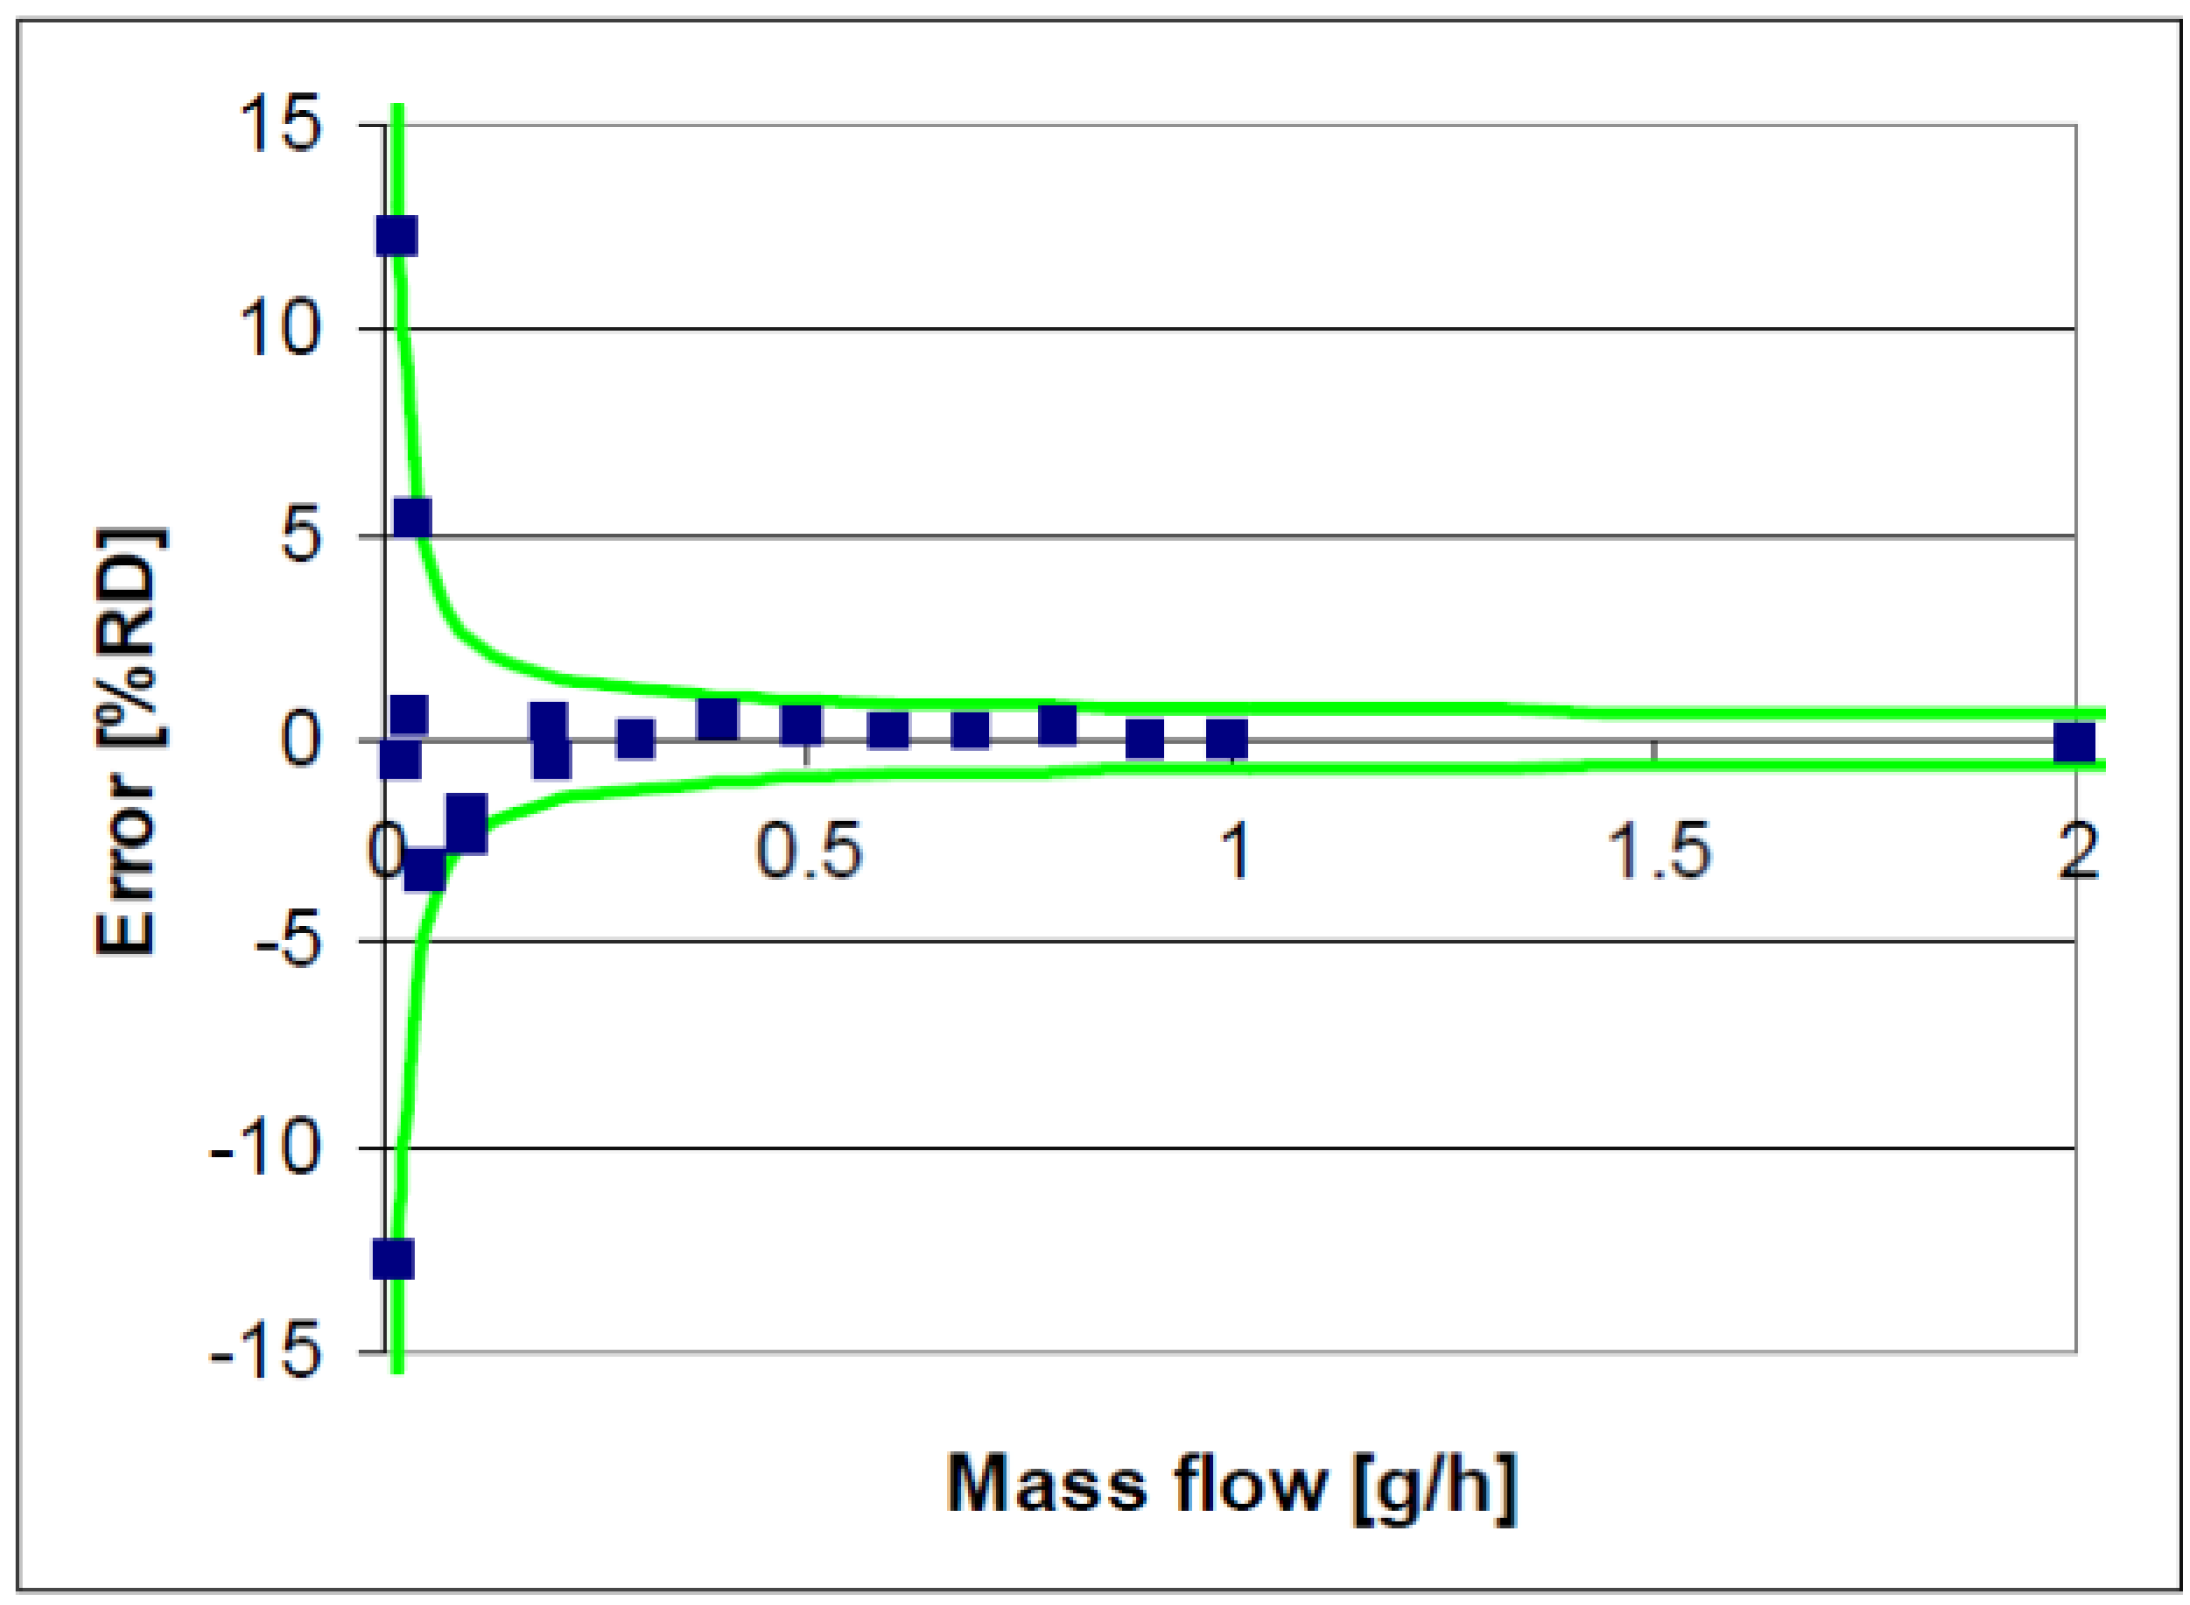
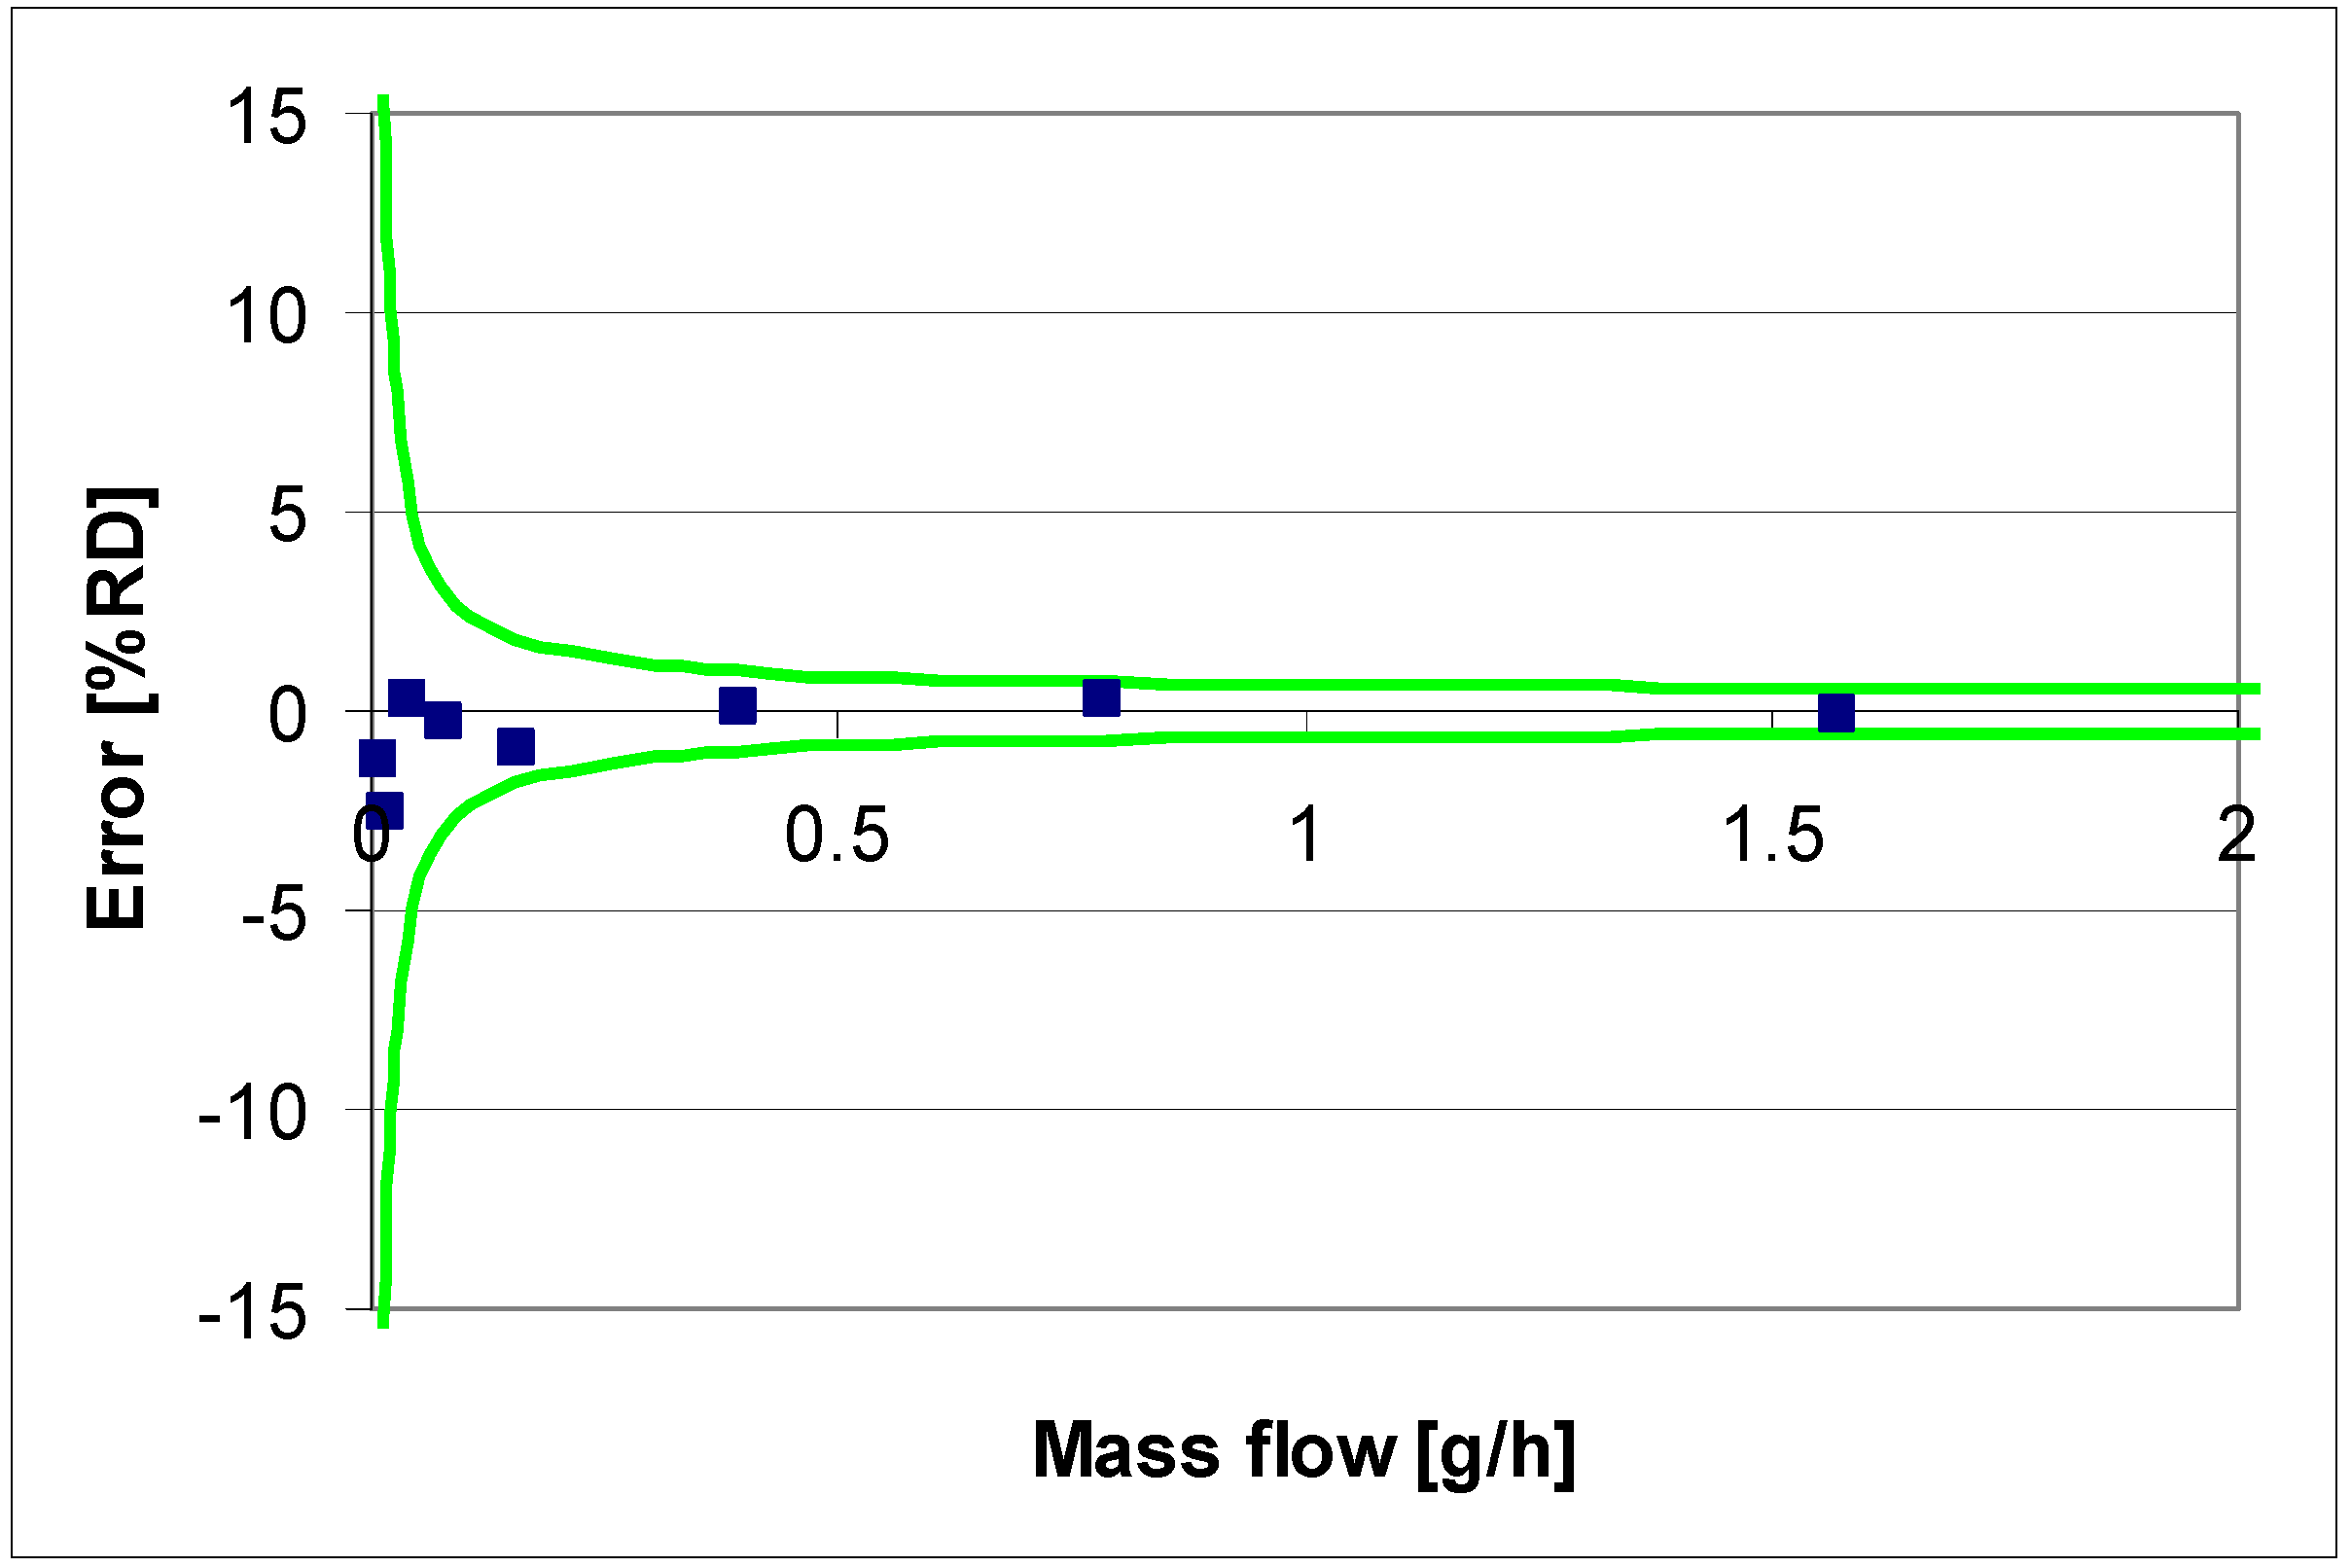
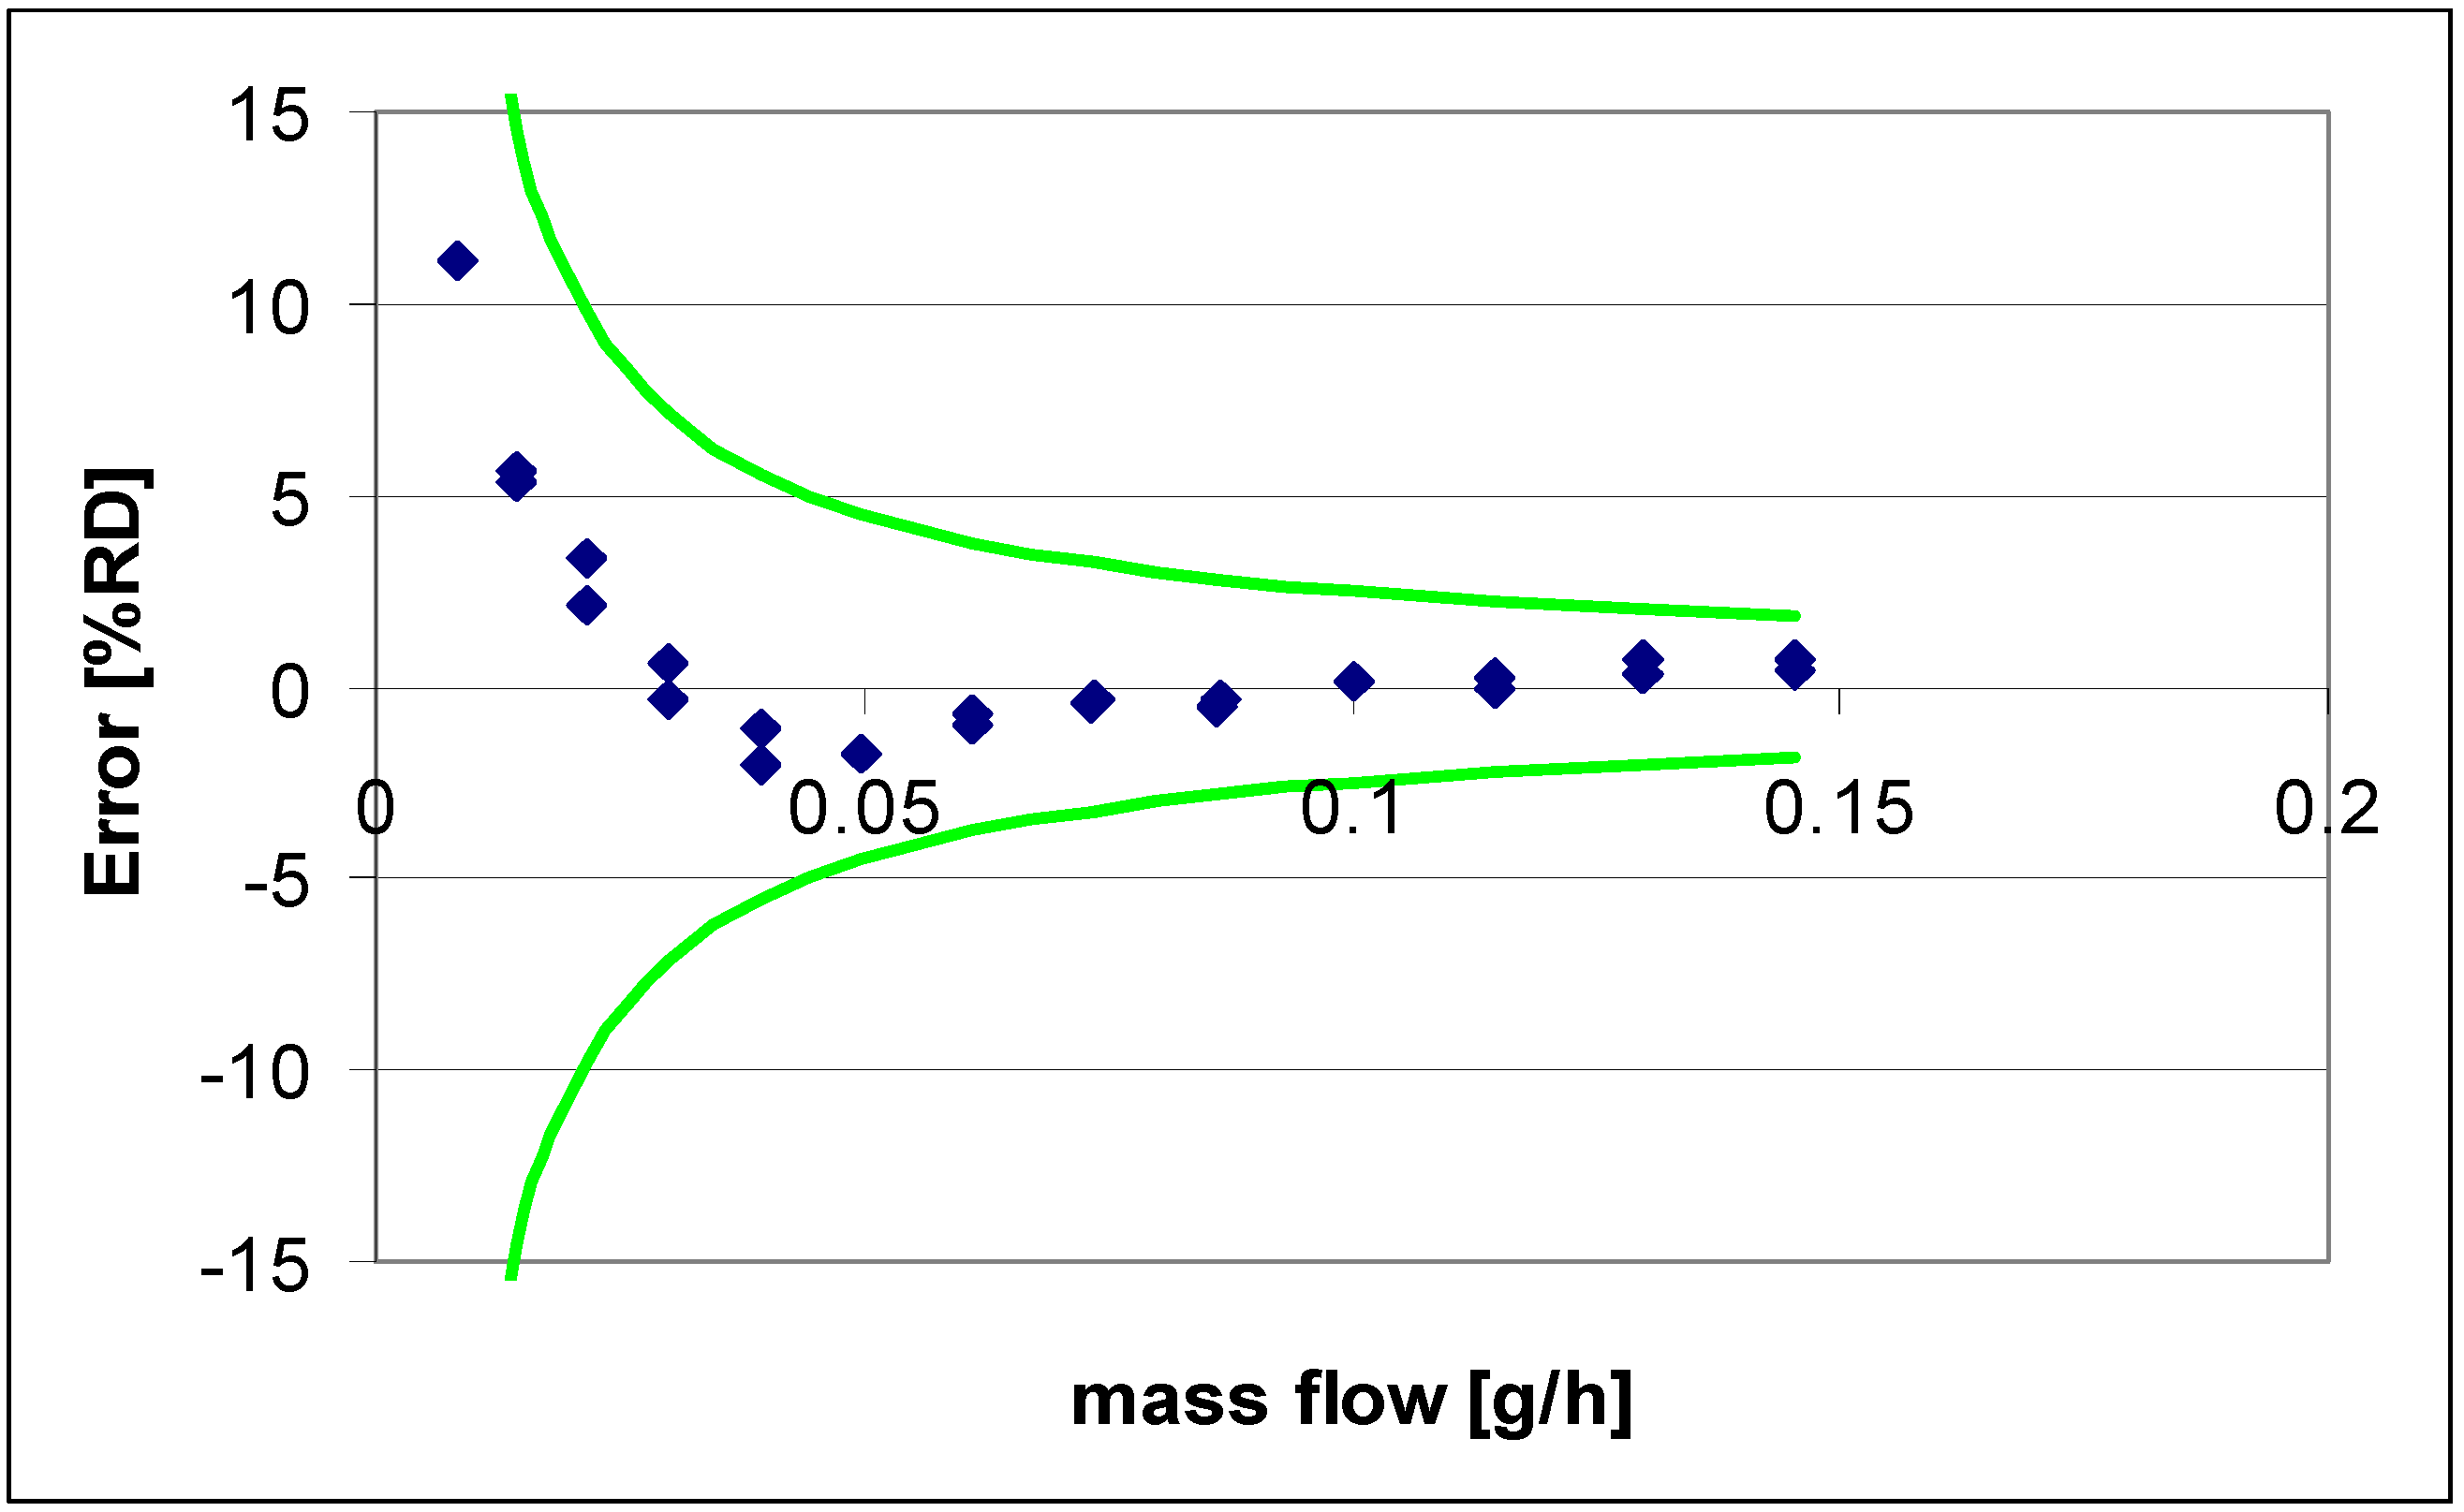
3.3. Mass Flow of Liquids

We tested the Coriolis mass flow meter for two different liquids (water, IPA) in a temperature controlled environment. Details of these tests can be found in Section 2.2.3. The result for the mass flow measurement of water is presented in Figure 8. For water, the meter shows a zero stability of 2 mg/h and an accuracy of 0.5% reading. The maximum flow of 2 g/h is reached at an approximate pressure of 2 bar. Since the accuracy of the balance is 0.1 mg and we measured for 4 min, the error made by this method is approximately 7% at the lowest measured flow rate of 20 mg/h. Here we neglect uncertainty in the time determination of the weighing scale since the sample period (~250 ms) is very low with respect to the total measuring time. Other sources of uncertainty such as buoyancy, stiction, evaporation are for the current discussion also neglected.
Figure 8. Measured water mass flow vs. Mettler Toledo (AX205 weighing scale). The envelope represents a zero stability of 2 mg/h and an accuracy of 0.5% reading. The pressure drop across the Coriolis mass flow meter was approximately 2 bar.
Micromachines 04 00022 g008
We also performed experiments with the mass flow of IPA. Details of the experiment can be found in Section 2.2.3. The results of this measurement are given in Figure 9. The measurement is within an envelope of 0.5% reading and 2 mg/h zero stability. The accuracy for metering 10 µL is approximately 2.4% (calibration check on a weighing scale revealed and accuracy of 0.3% at a metering volume of 80 µL). This in combination with a 5 °C uncertainty in temperature gives an estimated error of 3.1%. The 0.7% error because of temperature originates from the change in density as a function of temperature. This is important since we check the mass flow using the volumetric displacement of the used syringes. This error is lower than the error determined for the measurements with water. This corresponds to the measured mass flow for water and IPA.
Figure 9. Measured isopropanol (IPA) mass flow vs. Syringe (100 µL Hamilton gastight on Harvard PHD ultra). The envelope represents a zero stability of 2 mg/h and an accuracy of 0.5% reading. The pressure drop across the Coriolis mass flow meter was approximately 2 bar.
Micromachines 04 00022 g009

3.4. Mass Flow of Gases

We tested the Coriolis mass flow meter for several common gases (H2, He, N2, Ar and air) in a temperature controlled environment. Since the meter was designed for an approximate 1 bar pressure drop at 1 g/h mass flow of water, the pressure drop for 1 g/h gas mass flow is expected to be higher. Details of the experiment can be found in Section 2.2.4. The result for the mass flow measurement of air is presented in Figure 10. For air the meter shows a zero stability of 2 mg/h and an accuracy of 0.5% reading. A discussion on the results with air will follow at the end of the section after the presentation of the hydrogen measurements.
Figure 10. Measured air mass flow vs. piston prover. The envelope represents a zero stability of 2 mg/h and an accuracy of 0.5% reading. The pressure drop across the Coriolis mass flow meter was approximately 8 bar.
Micromachines 04 00022 g010
We also measured the performance of the meter for the determination of hydrogen mass flow. This gas has a very low density of only 0.090 kg/m3 and will be the most challenging gas to measure. In Figure 11 we present the result of this. For all tested gases the data falls within the predetermined envelope of 0.5% RD and 2 mg/h zero stability. The same zero stability and accuracy were found for nitrogen, helium and argon.
A trend in error as a function of flow is visible in all gas measurements. This can be improved by afterwards adapting the point of zero flow and the sensitivity factor of the device. However, we chose not to do so, since it is unrealistic for application at a customer site, where there is of course no reference in line with the actual measurement. The fact that there is such a clear trend and that measurement points at equal flow are close, indicates that the measurement method introduces an error that is small as compared to the meter. This corresponds with the fact that the piston prover has an accuracy of 0.4% RD and that we compensate for changes in temperature and pressure during the measurement.
Figure 11. Measured hydrogen mass flow vs. piston prover. The envelope represents a zero stability of 2 mg/h and an accuracy of 0.5% reading. The pressure drop across the Coriolis mass flow meter was approximately 8 bar.
Micromachines 04 00022 g011

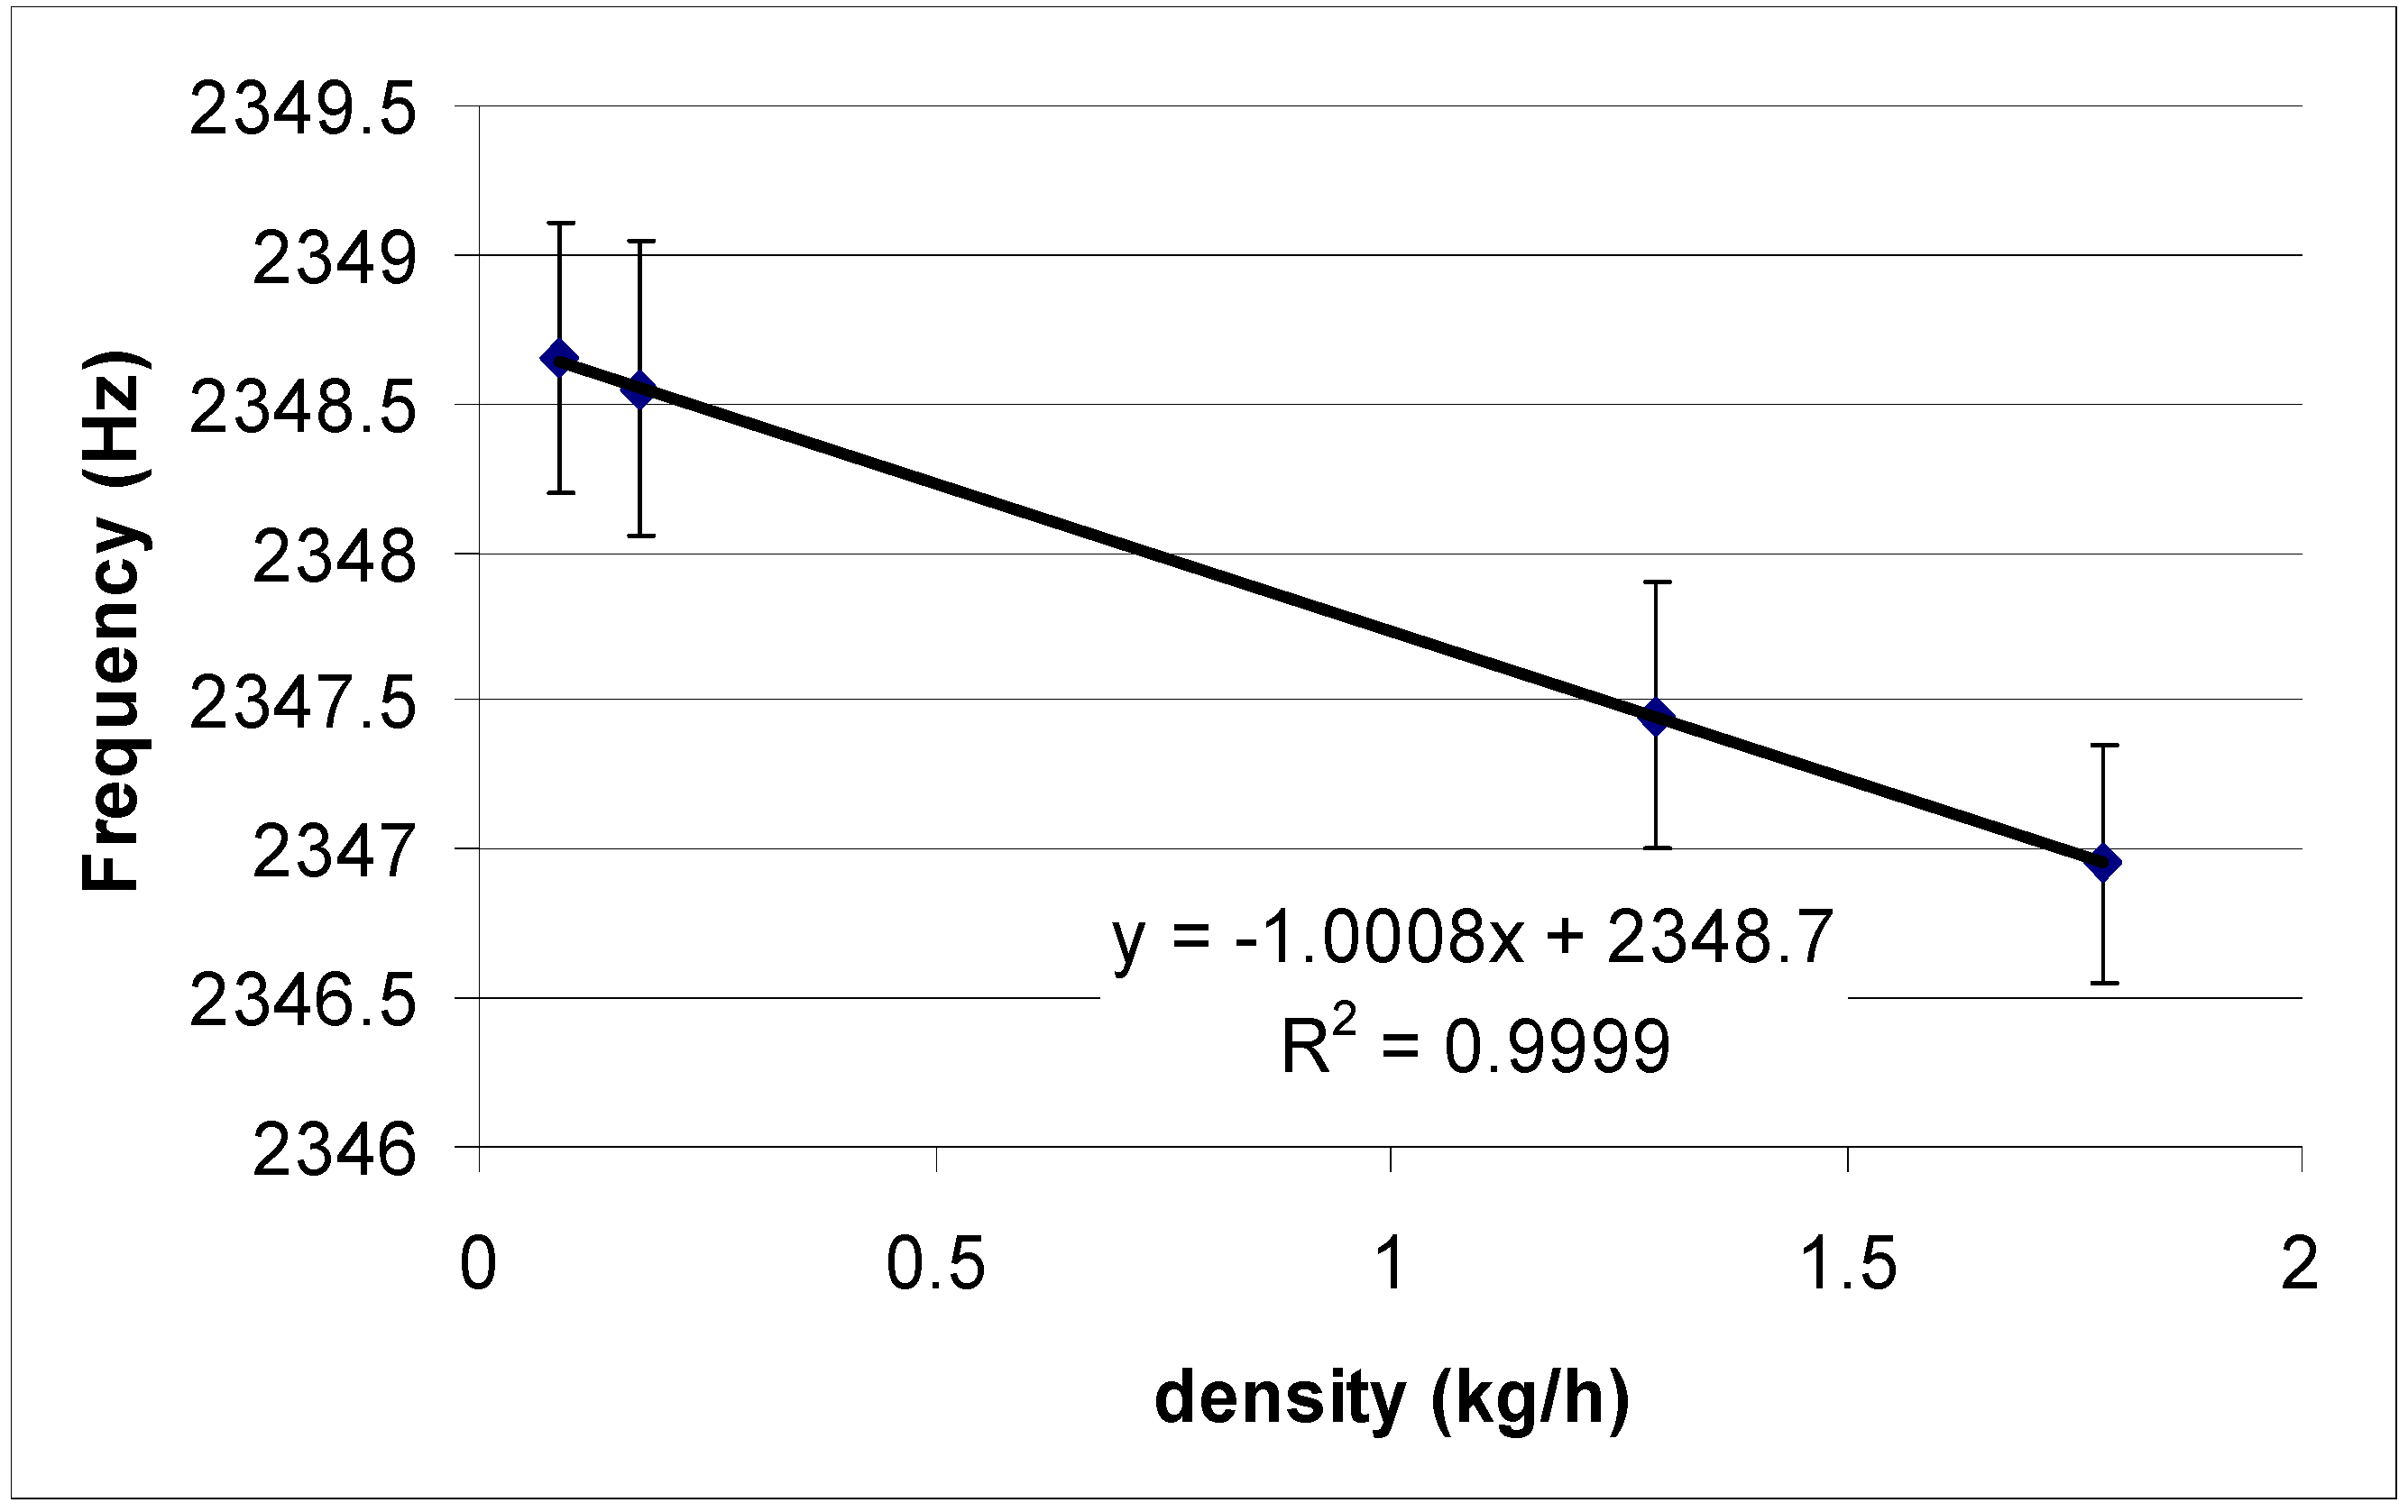
3.5. Density of Gases

The resonance frequency of the tube is dependent on the density of medium that is inside the resonating tube. We measured this frequency for different gases inside the tube at atmospheric pressure. Details of these measurements can be found in Section 2.2.5. In Table 1 the result of this measurement is shown.
Table 1. Measured resonance frequency for different gases. Frequency is the averaged measured resonance frequency and min/max is the minimal and maximal deviation measured in Hz.
Density (kg/m3)Frequency (Hz)Min/Max (Hz)
Argon1.782346.950.4
Air1.292347.450.45
Helium0.1782348.550.5
Hydrogen0.092348.650.45
In this range the resonance frequency can be described by a linear function (Figure 12). Physically one would expect, however, square root dependence. The linear approximation in this range is likely due to the small range and the fact that the mass of the gas at atmospheric pressure is less than 1% of the total mass of the resonating structure. From Table 1 one can deduct a density sensitivity of ~1 Hz.m3/kg. This provides a means to measure the actual density of gases. Performance will be improved by filtering, since data presented here is raw data. This and density measurement of liquids will be a subject of future research. Another topic of future experiments will be the influence of a pressure differential between the medium inside the resonating tube and the outside.
Figure 12. Measured resonance frequency for different gases (Table 1). The error bars represent the minimal and maximal deviation from the average measured in Hz.
Micromachines 04 00022 g012

4. Conclusions

We demonstrated a compact and ready-to-use micro Coriolis mass flow meter in a stainless steel housing. It has a full scale mass flow of 1 g/h and accuracy of 0.5% reading for both liquids and gases. Its zero stability is 2 mg/h. The meter can withstand 40 bar, has a helium leak rate smaller than 1.10−8 mbar·dm3/s and operates well in an ambient temperature range between 10 and 50 °C. Its temperature drift is below 1 mg/h/°C. It measures mass flow of both liquids and gases. The meter was designed to have a 1 bar pressure drop at 1 g/h water mass flow. Since our current gas setup was limited to an 8 bar pressure drop across the Coriolis mass flow meter, the mass flow meter is characterized for air up to ~0.8 g/h. We tested the meter for water, isopropanol, hydrogen, helium, argon, nitrogen and air. In addition to mass flow, the meter is able to measure actual density. The sensitivity for measuring actual density of gases is ~1 Hz.m3/kg at this time.

Acknowledgments

This project was funded by MicroNed and Nanonext. We thank Gijs Ratering for assistance with the water measurements. Rik de Boer and Eddie van Hattum are thanked for assistance with the gas measurements and helpful discussions.

References

  1. Whitesides, G.M. The origins and future of microfluidics. Nature 2006, 442, 368–373. [Google Scholar] [CrossRef]
  2. Nguyen, N.T. Micromachined flow sensors-a review. Flow Meas. Instrum. 1997, 8, 7–16. [Google Scholar] [CrossRef]
  3. Haneveld, J.; Lammerink, T.S.J.; Dijkstra, M.A.; Drogendijk, H.; de Boer, M.J.; Wiegerink, R.J. Highly sensitive micro coriolis mass flow sensor. In Proceedings of the 21st IEEE International Conference on Micro Electro Mechanical Systems, Tucson, AZ, USA, November 2008; pp. 920–923.
  4. Haneveld, J.; Lammerink, T.S.J.; de Boer, M.J.; Sanders, R.G.P.; Mehendale, A.; Lötters, J.C.; Dijkstra, M.; Wiegerink, R.J. Modeling, design, fabrication and characterization of a micro Coriolis mass flow sensor. J. Micromech. Microeng. 2010, 20. [Google Scholar] [CrossRef]

