
Proposal for a Controlled Humidity Environment Test Bench for the Accurate Characterization of Icephobic Properties

 , , and
Abstract
1. Introduction
2. Materials and Methods
2.1. Materials
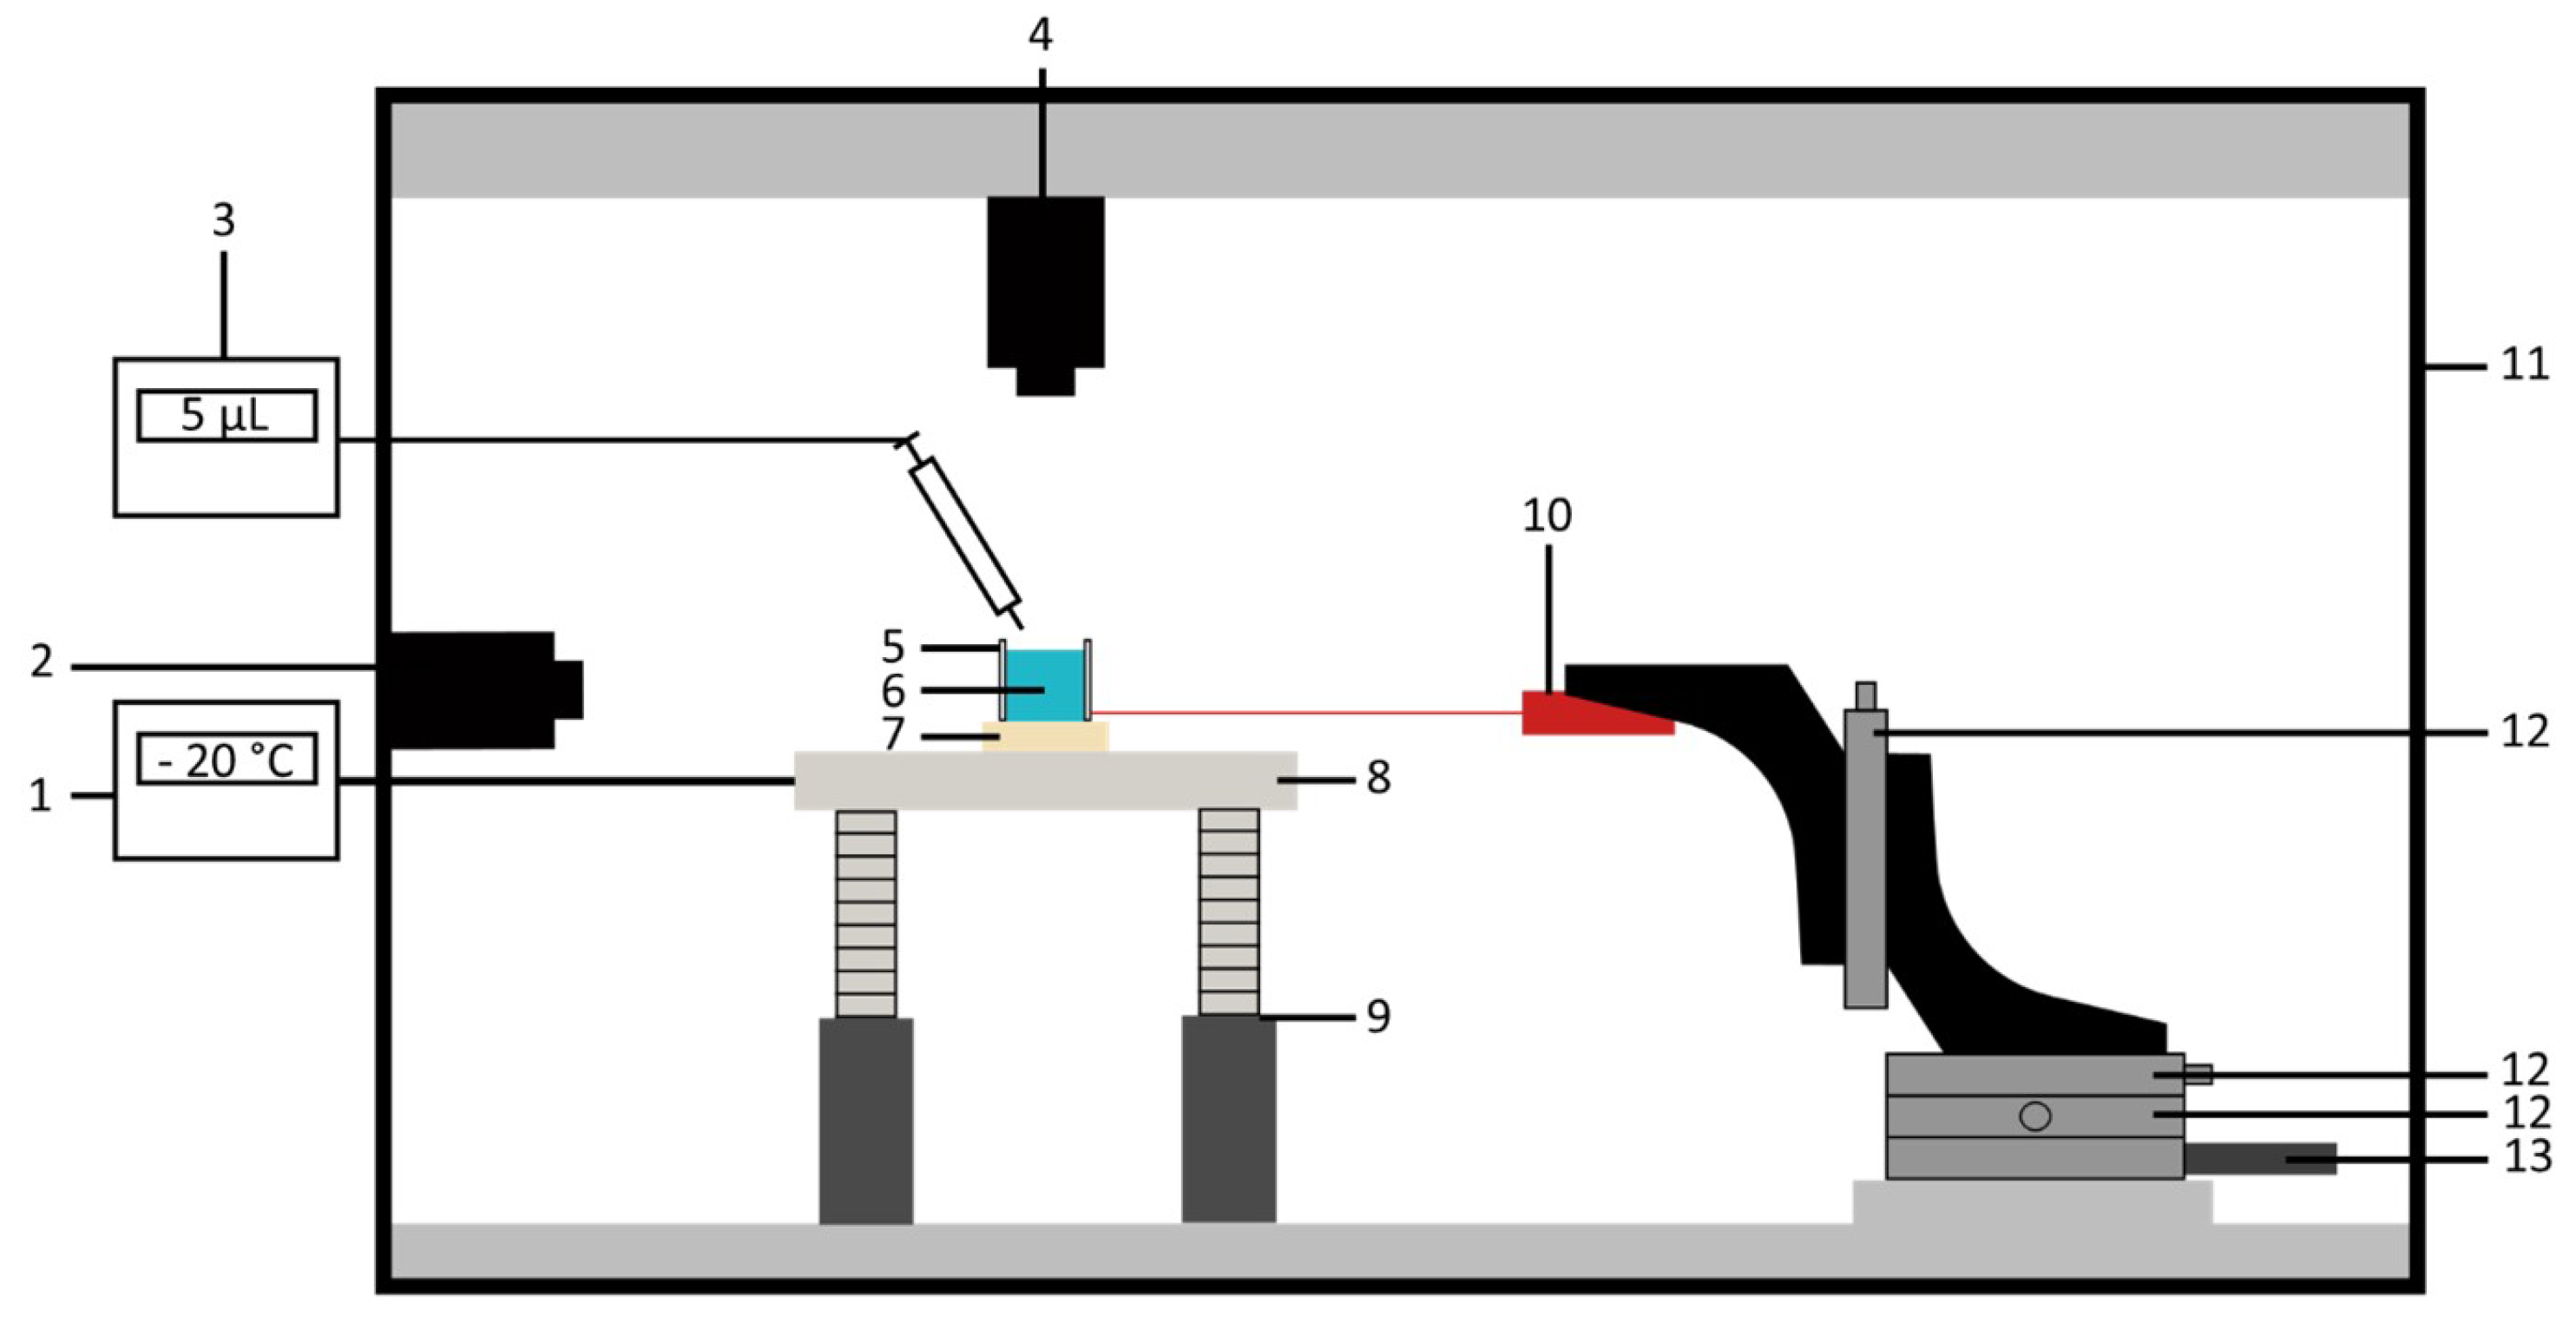
2.2. Test Bench
2.3. Sample Characterization
2.3.1. Topography
2.3.2. Wettability
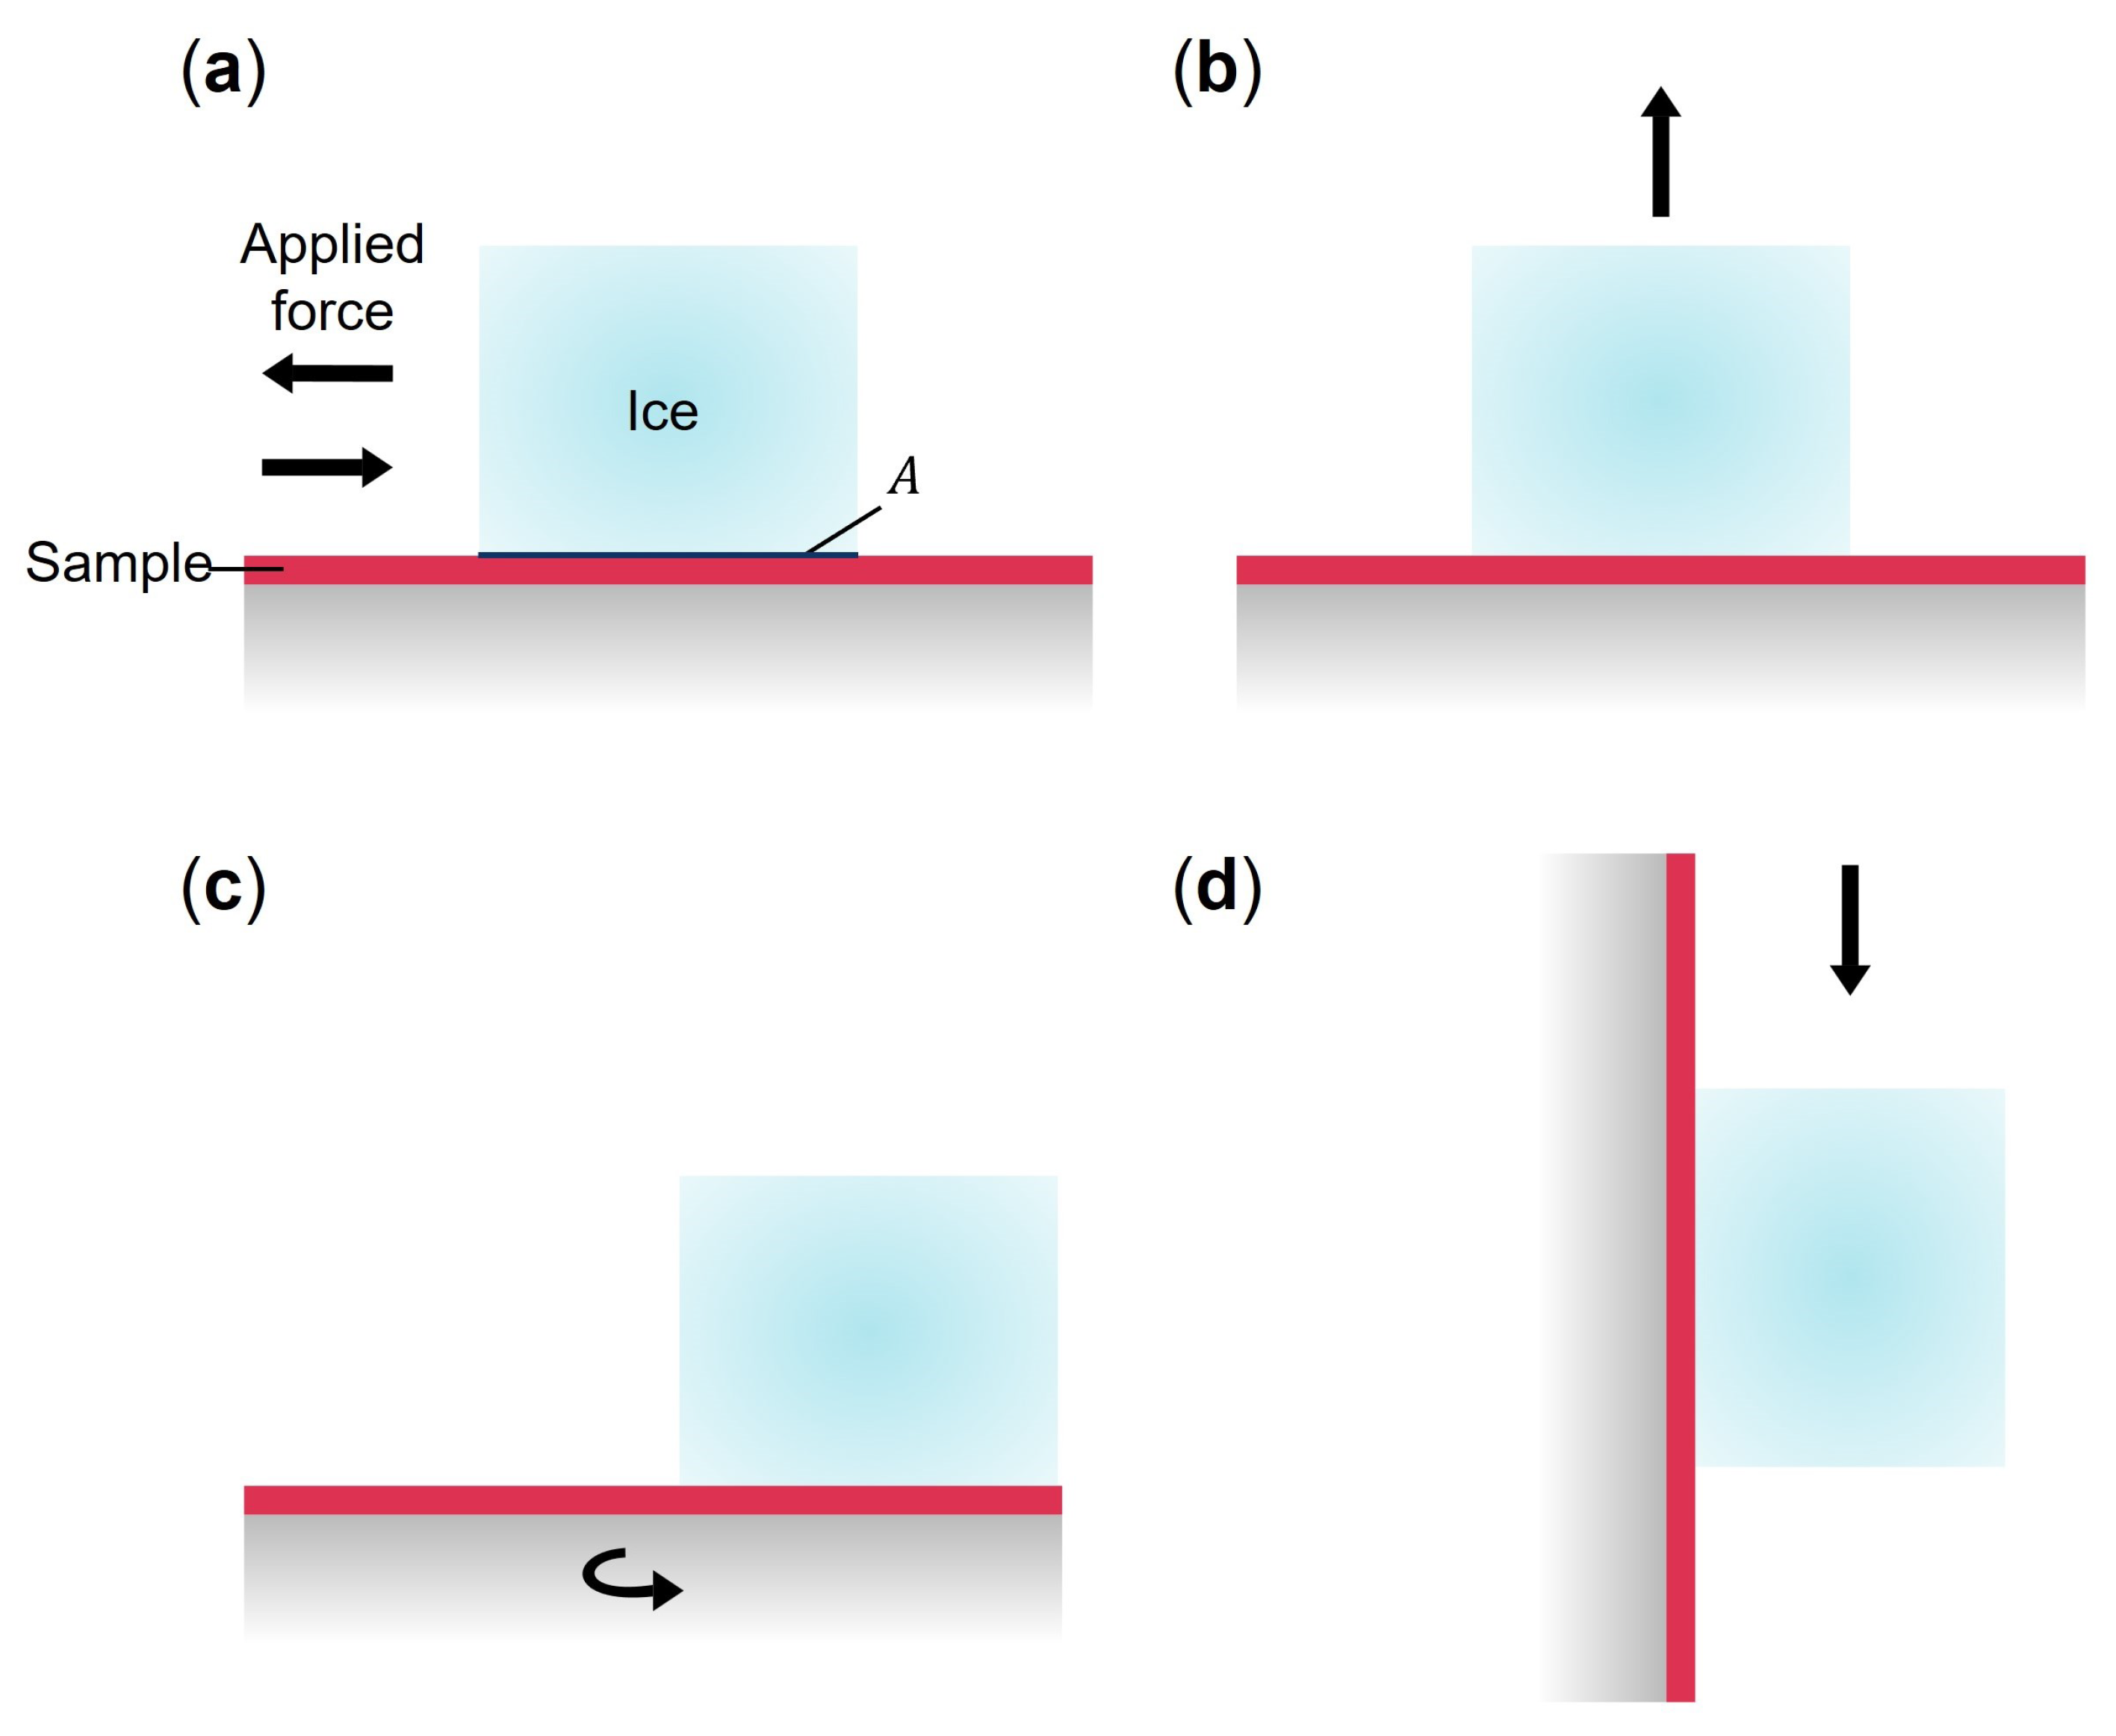
2.3.3. Ice Adhesion
2.3.4. IDT
3. Results and Discussion
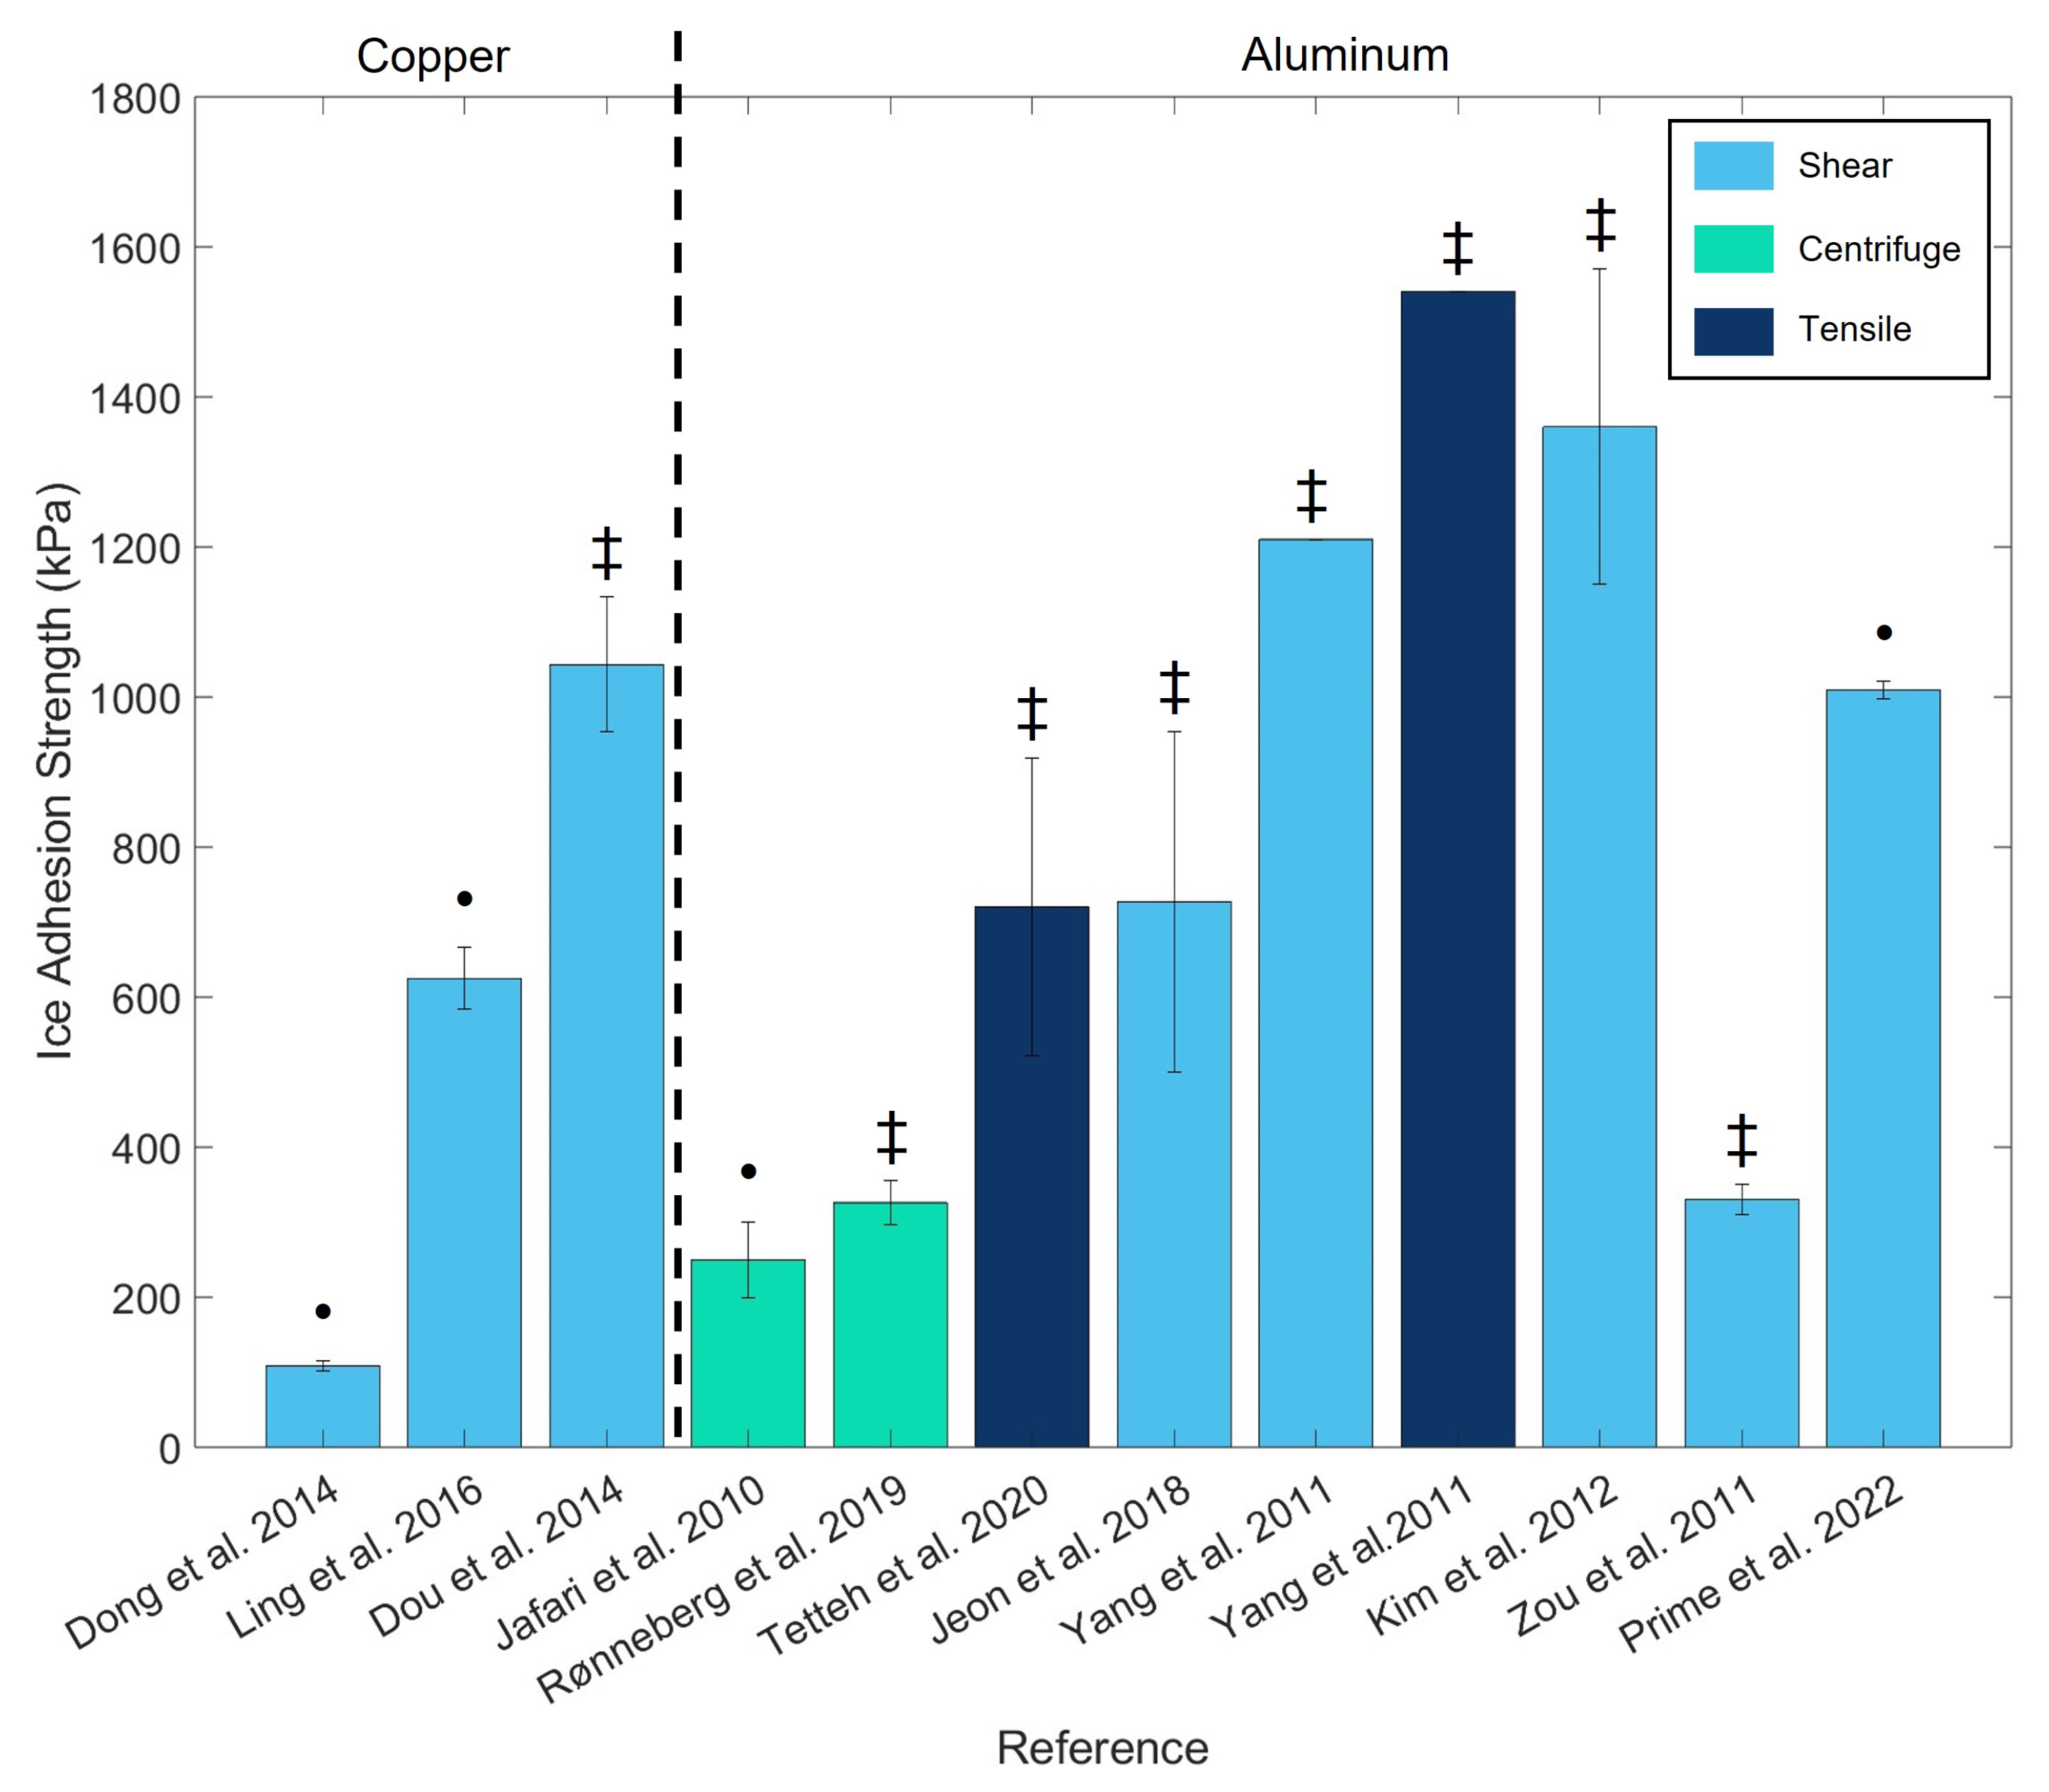
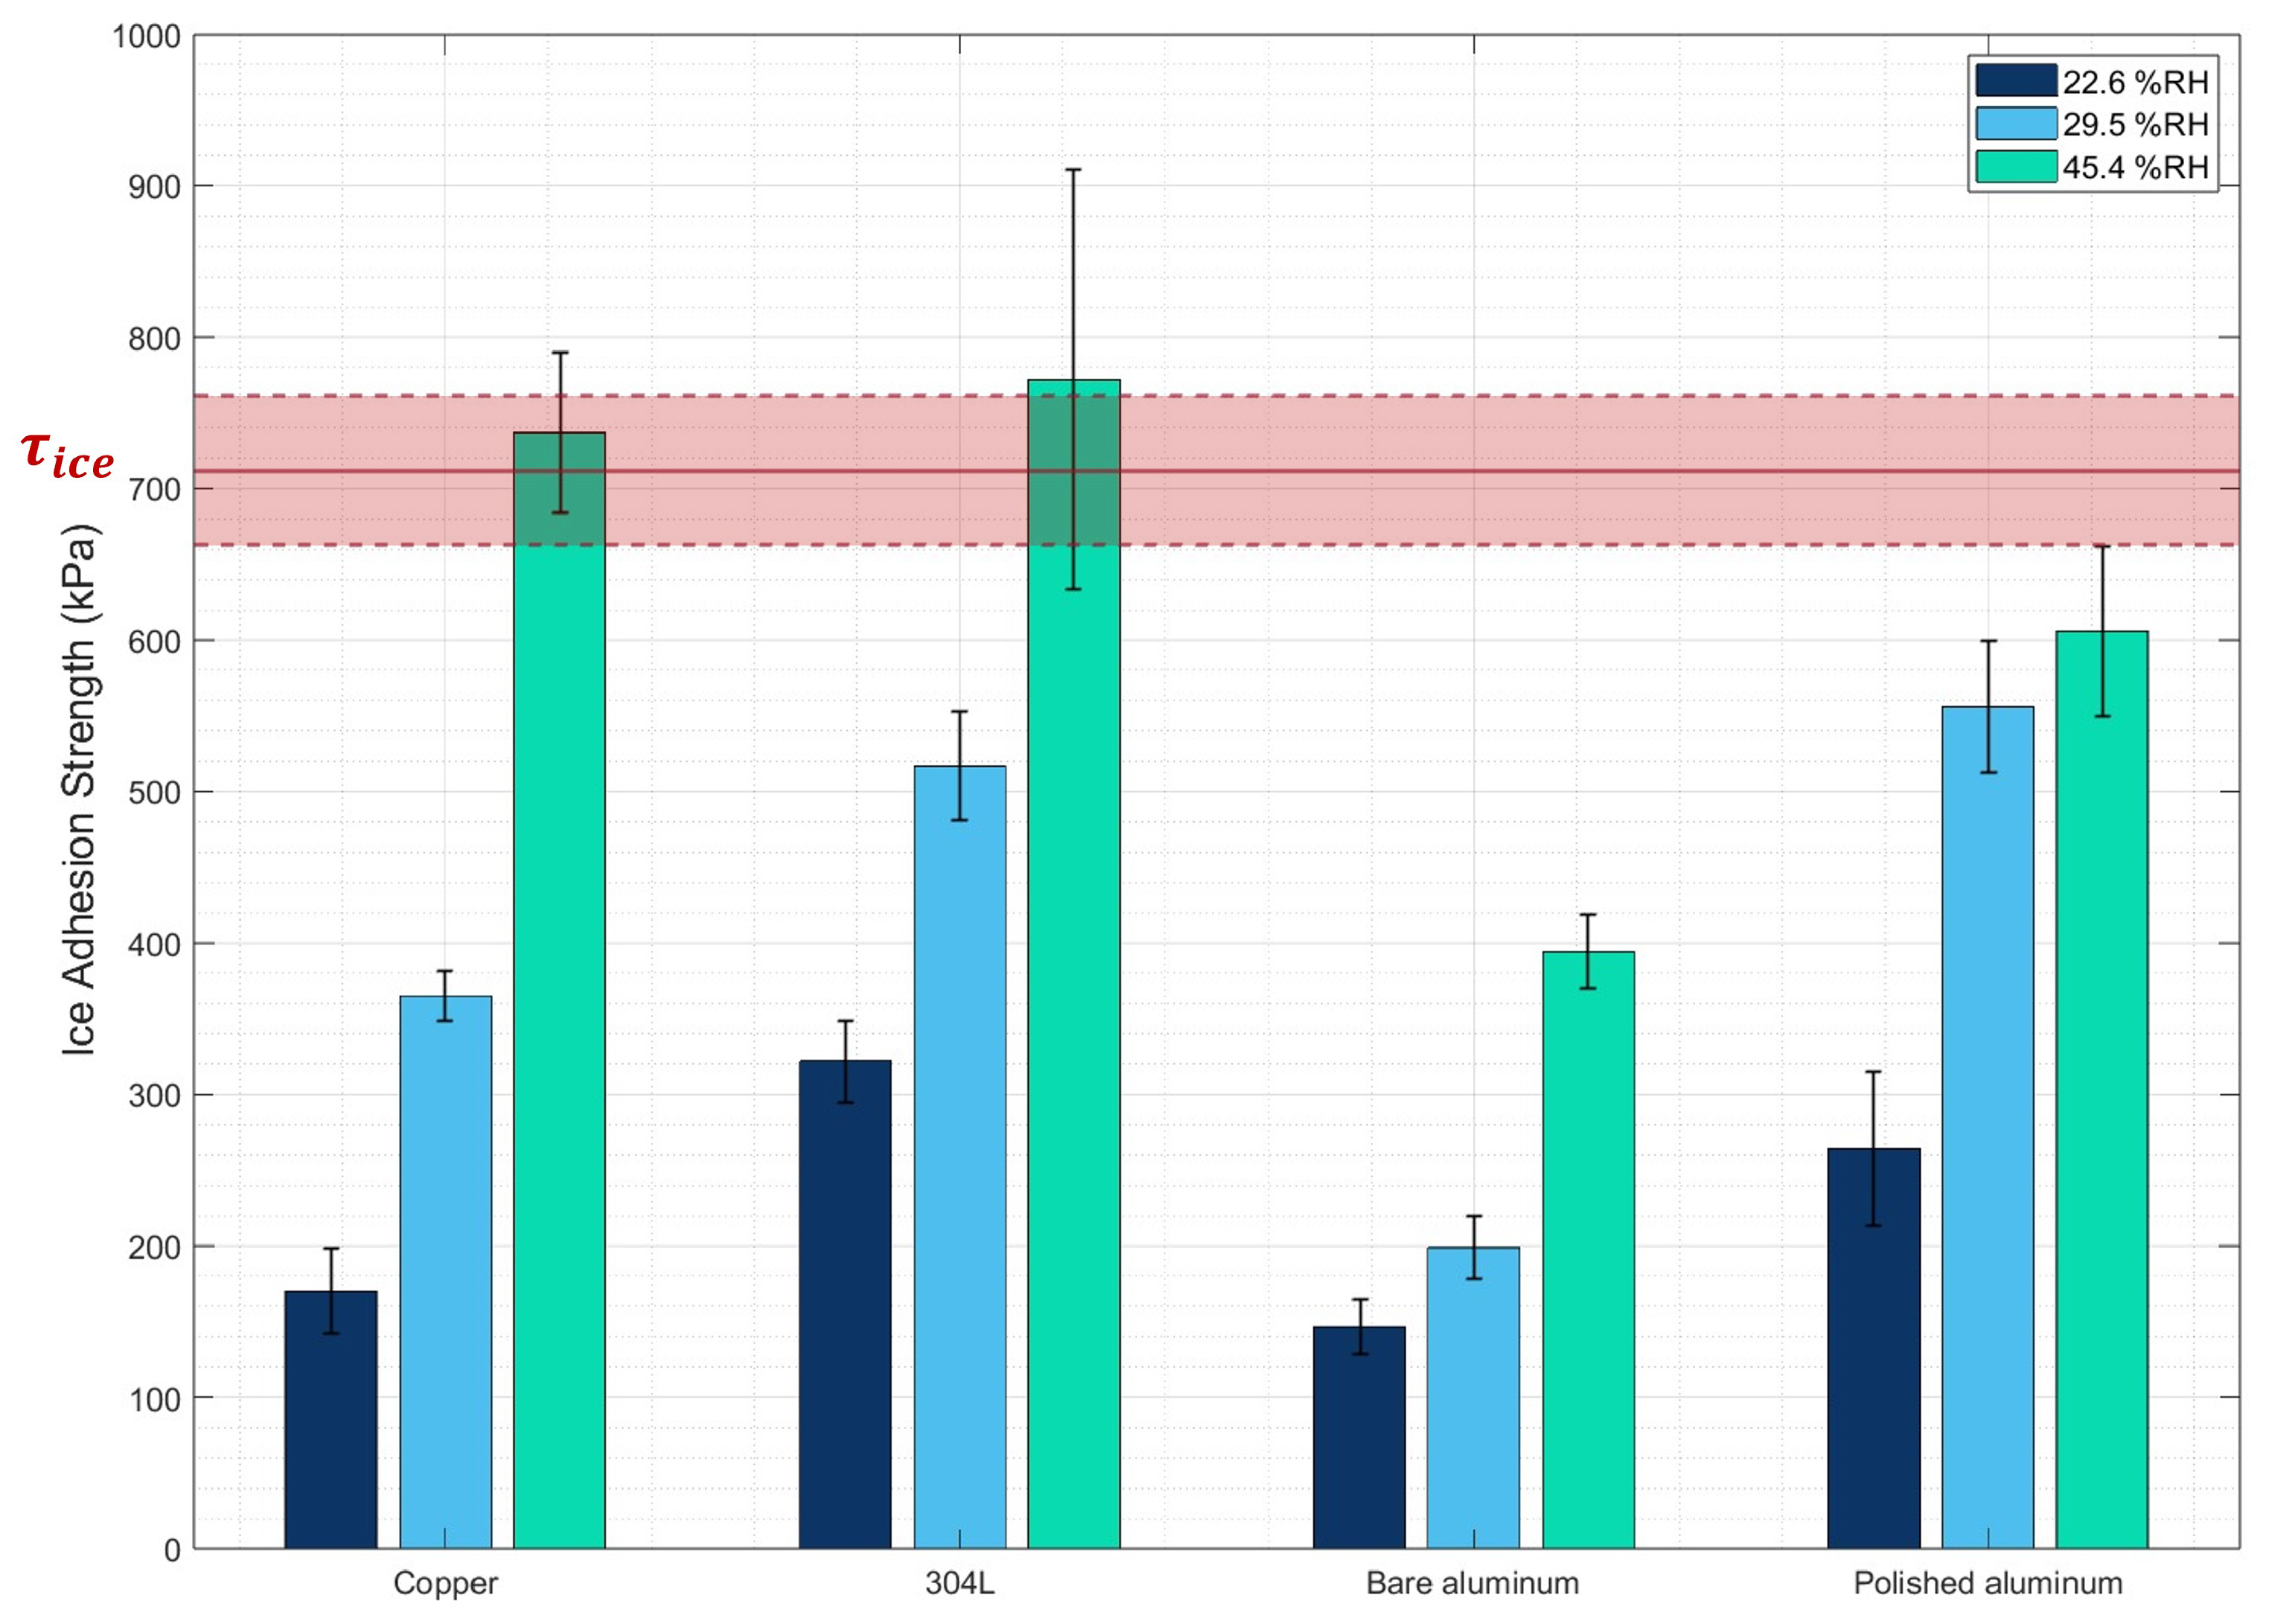
3.1. Ice Adhesion Strength Measurements
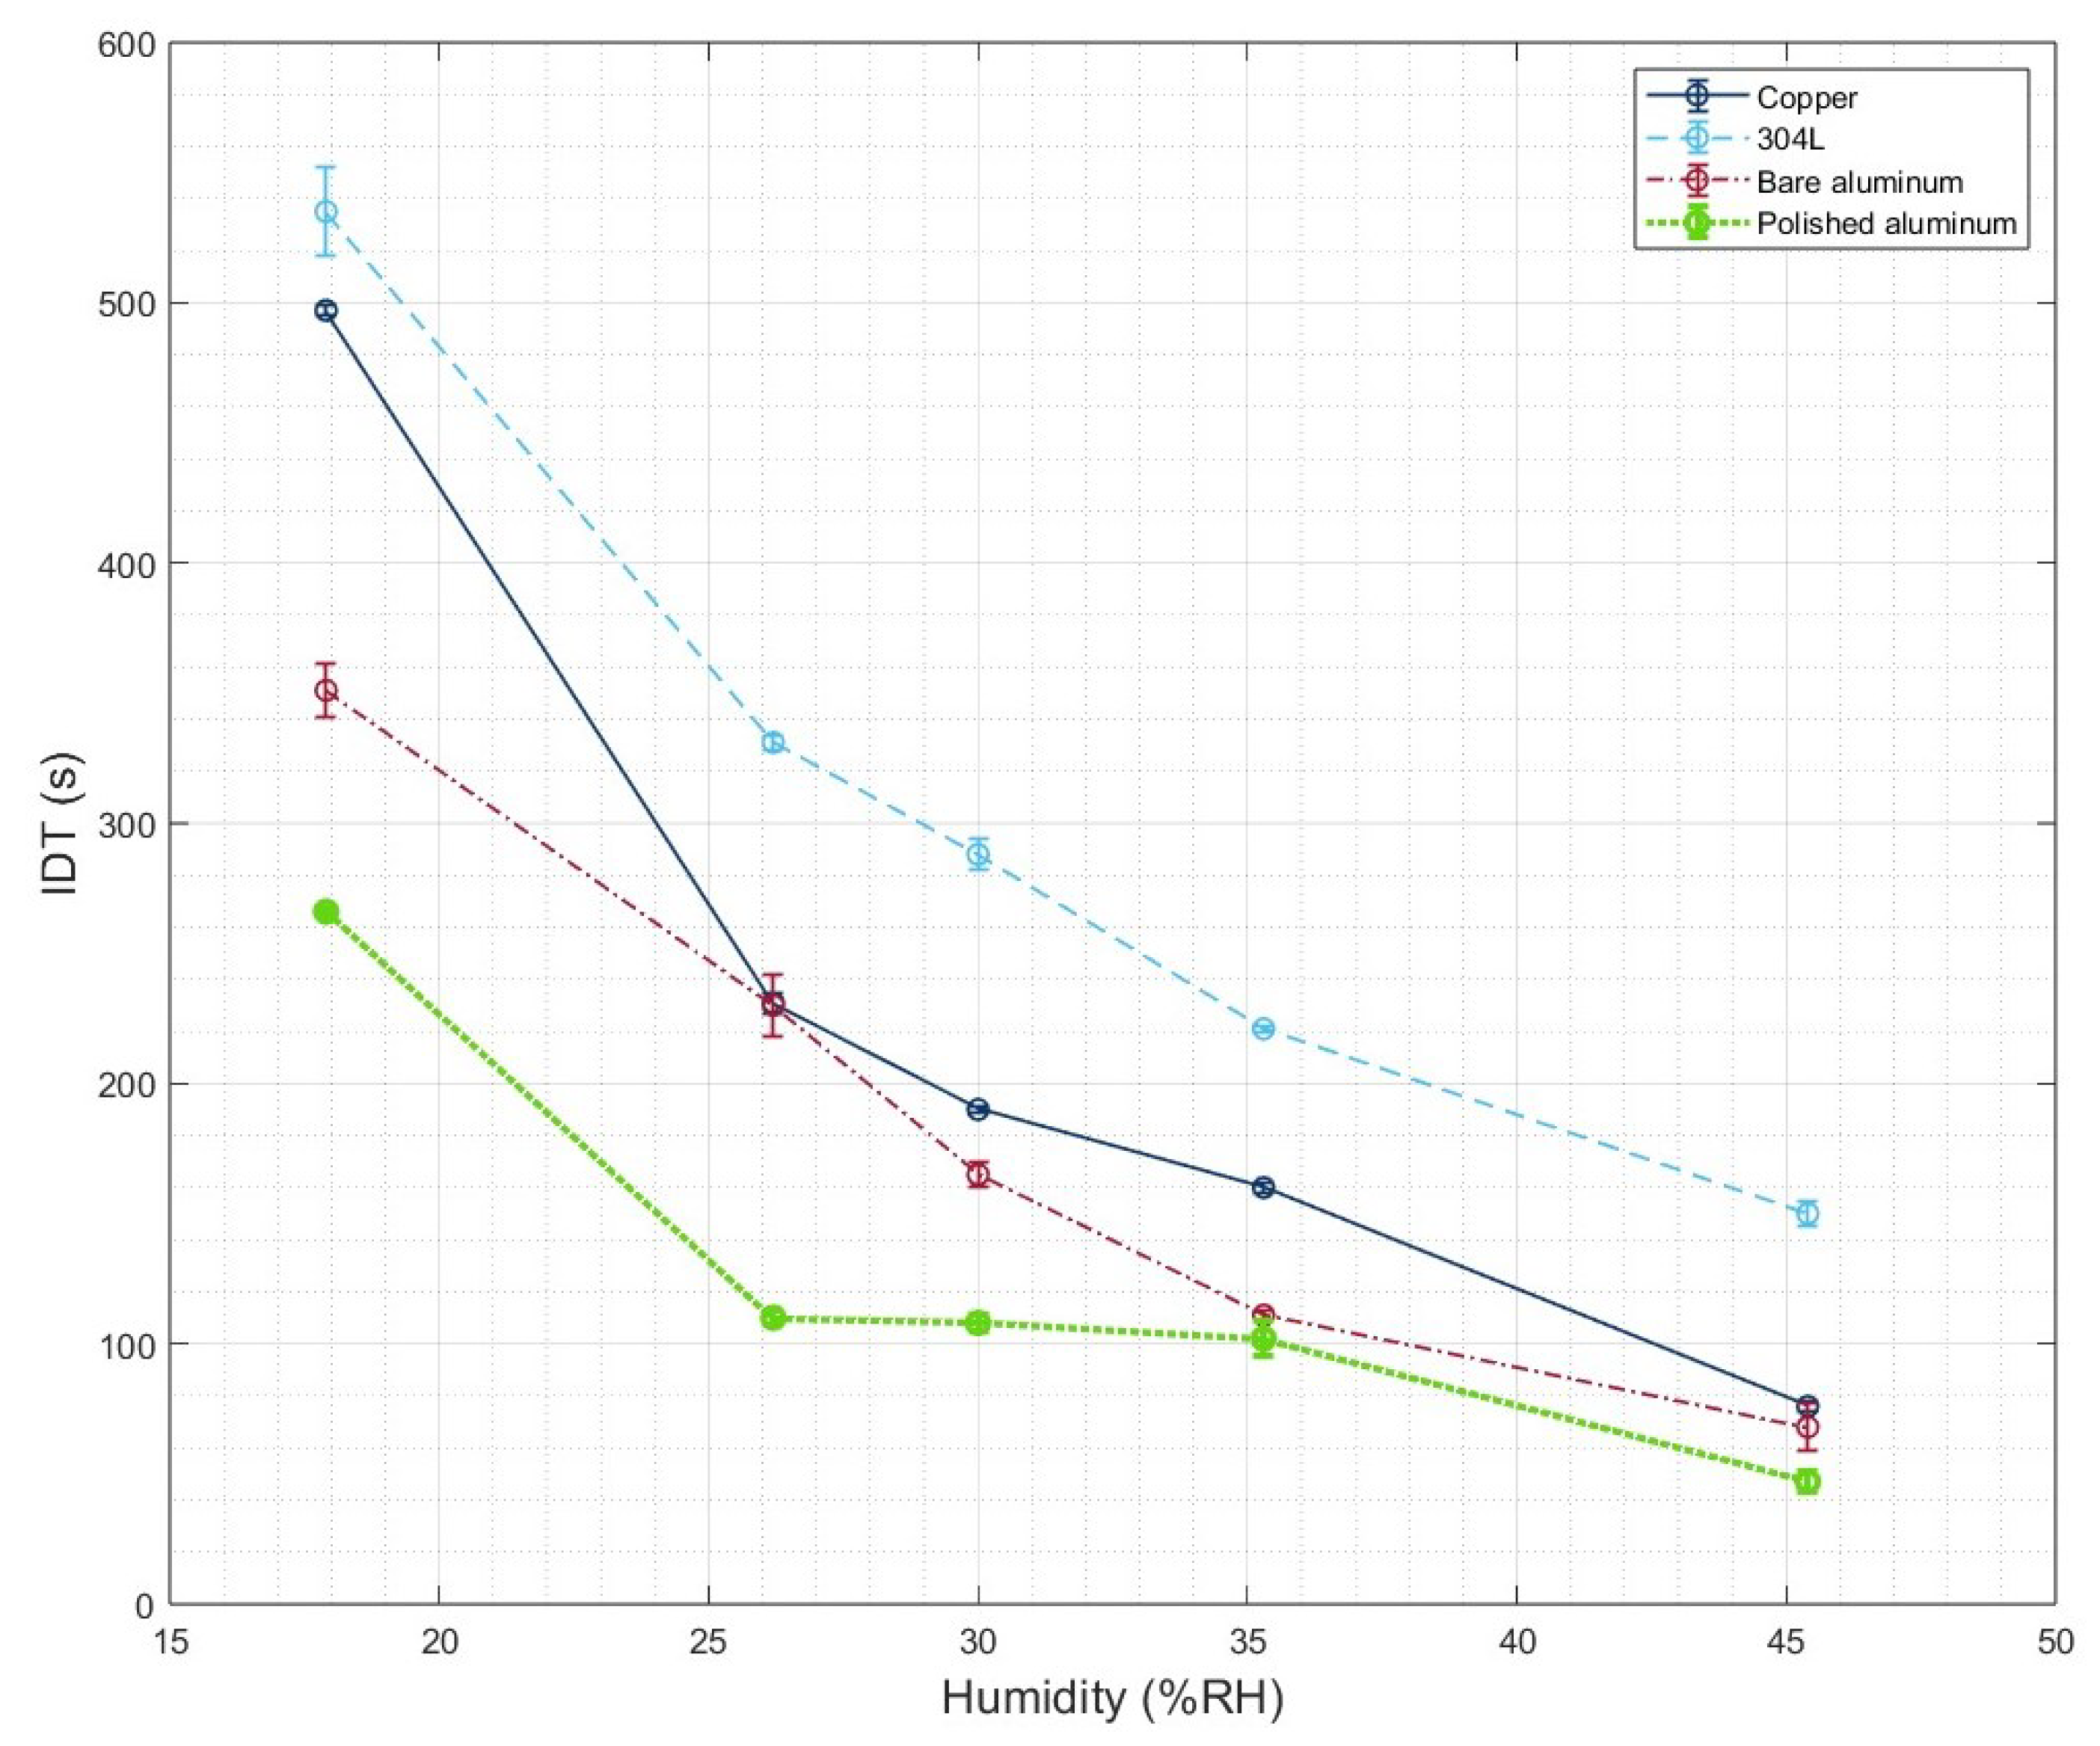
3.2. IDT Measurements
4. Conclusions
Author Contributions
Funding
Institutional Review Board Statement
Data Availability Statement
Acknowledgments
Conflicts of Interest
References
- Liu, H.; Gu, X.; Tang, W. Icing and Anti-Icing of Railway Contact Wires. In Reliability and Safety in Railway; Perpinya, X., Ed.; InTech: London, UK, 2012. [Google Scholar] [CrossRef]
- Green, S.D. A Study of U.S. Inflight Icing Accidents and Incidents, 1978 to 2002. In Proceedings of the 44th AIAA Aerospace Sciences Meeting and Exhibit, Reno, Nevada, 9–12 January 2006 ; American Institute of Aeronautics and Astronautics: Reston, VA, USA, 2006. [Google Scholar] [CrossRef]
- Villeneuve, E.; Ghinet, S.; Volat, C. Experimental Study of a Piezoelectric De-Icing System Implemented to Rotorcraft Blades. Appl. Sci. 2021, 11, 9869. [Google Scholar] [CrossRef]
- Shinkafi, A.; Lawson, C. Enhanced Method of Conceptual Sizing of Aircraft Electro Thermal De icing System. Int. J. Mech. Aerosp. Ind. Mechatron. Manuf. Eng. 2014, 8, 1069–1076. [Google Scholar]
- Liu, Y.; Shao, Y.; Wang, Y.; Wang, J. An abrasion-resistant, photothermal, superhydrophobic anti-icing coating prepared by polysiloxane-modified carbon nanotubes and fluorine-silicone resin. Colloids Surfaces Physicochem. Eng. Asp. 2022, 648, 129335. [Google Scholar] [CrossRef]
- Liu, H.; Li, X.; Lv, L.; Liu, Z.; Chen, J. Fast fabrication of silicone-modified polyurethane/SiO2 composite superhydrophobic coating with excellent anti-icing and self-cleaning behaviour. Mater. Res. Express 2020, 7, 116403. [Google Scholar] [CrossRef]
- Cao, Y.; Lu, Y.; Liu, N.; Li, Y.; Wang, P.; Dai, C.; Wei, Y. Multi-applicable, durable superhydrophobic anti-icing coating through template-method and chemical vapor deposition. Surfaces Interfaces 2022, 32, 102100. [Google Scholar] [CrossRef]
- Basset, S.; Heisbourg, G.; Pascale-Hamri, A.; Benayoun, S.; Valette, S. Effect of Texturing Environment on Wetting of Biomimetic Superhydrophobic Surfaces Designed by Femtosecond Laser Texturing. Nanomaterials 2022, 12, 3099. [Google Scholar] [CrossRef]
- Zhu, S.; Deng, W.; Su, Y. Recent advances in preparation of metallic superhydrophobic surface by chemical etching and its applications. Chin. J. Chem. Eng. 2023, 61, 221–236. [Google Scholar] [CrossRef]
- Burdin, L.; Brulez, A.C.; Mazurczyk, R.; Leclercq, J.L.; Benayoun, S. Texturing injection molds using microelectronics techniques. Surf. Coatings Technol. 2025, 502, 131989. [Google Scholar] [CrossRef]
- Vera, J.; Brulez, A.C.; Contraires, E.; Larochette, M.; Valette, S.; Benayoun, S. Influence of the polypropylene structure on the replication of nanostructures by injection molding. J. Micromech. Microengineer. 2015, 25, 115027. [Google Scholar] [CrossRef]
- Jeon, J.; Jang, H.; Chang, J.; Lee, K.S.; Kim, D.R. Fabrication of micro-patterned aluminum surfaces for low ice adhesion strength. Appl. Surf. Sci. 2018, 440, 643–650. [Google Scholar] [CrossRef]
- Yang, S.; Xia, Q.; Zhu, L.; Xue, J.; Wang, Q.; Chen, Q.M. Research on the icephobic properties of fluoropolymer-based materials. Appl. Surf. Sci. 2011, 257, 4956–4962. [Google Scholar] [CrossRef]
- Kim, P.; Wong, T.S.; Alvarenga, J.; Kreder, M.J.; Adorno-Martinez, W.E.; Aizenberg, J. Liquid-Infused Nanostructured Surfaces with Extreme Anti-Ice and Anti-Frost Performance. ACS Nano 2012, 6, 6569–6577. [Google Scholar] [CrossRef] [PubMed]
- Zou, M.; Beckford, S.; Wei, R.; Ellis, C.; Hatton, G.; Miller, M.A. Effects of surface roughness and energy on ice adhesion strength. Appl. Surf. Sci. 2011, 257, 3786–3792. [Google Scholar] [CrossRef]
- Prime, H.; Lowrey, S.; Blaikie, R.; Sommers, A.; Sun, Z.; Juras, J. Micro-fabricated aluminium surfaces for reduced ice adhesion. Exp. Therm. Fluid Sci. 2022, 136, 110646. [Google Scholar] [CrossRef]
- Tetteh, E.; Loth, E. Reducing Static and Impact Ice Adhesion with a Self-Lubricating Icephobic Coating (SLIC). Coatings 2020, 10, 262. [Google Scholar] [CrossRef]
- Jafari, R.; Menini, R.; Farzaneh, M. Superhydrophobic and icephobic surfaces prepared by RF-sputtered polytetrafluoroethylene coatings. Appl. Surf. Sci. 2010, 257, 1540–1543. [Google Scholar] [CrossRef]
- Rønneberg, S.; Zhuo, Y.; Laforte, C.; He, J.; Zhang, Z. Interlaboratory Study of Ice Adhesion Using Different Techniques. Coatings 2019, 9, 678. [Google Scholar] [CrossRef]
- Wang, C.; Zhang, W.; Siva, A.; Tiea, D.; Wynne, K.J. Laboratory Test for Ice Adhesion Strength Using Commercial Instrumentation. Langmuir 2014, 30, 540–547. [Google Scholar] [CrossRef]
- Rønneberg, S.; He, J.; Zhang, Z. The need for standards in low ice adhesion surface research: A critical review. J. Adhes. Sci. Technol. 2020, 34, 319–347. [Google Scholar] [CrossRef]
- Bleszynski, M.; Clark, E. Current Ice Adhesion Testing Methods and the Need for a Standard: A Concise Review. Standards 2021, 1, 117–133. [Google Scholar] [CrossRef]
- Fu, D.; Zheng, H.; Sheng, W.; Hao, X.; Zhang, X.; Chang, S.; Song, M. An experimental study on the influence of humidity on ice adhesion strength on superhydrophobic surfaces with microstructures. Appl. Therm. Eng. 2024, 244, 122732. [Google Scholar] [CrossRef]
- Momen, G.; Farzaneh, M.; Jafari, R. Wettability behaviour of RTV silicone rubber coated on nanostructured aluminium surface. Appl. Surf. Sci. 2011, 257, 6489–6493. [Google Scholar] [CrossRef]
- Dong, W.; Ding, J.; Zhou, Z.X. Experimental Study on the Ice Freezing Adhesive Characteristics of Metal Surfaces. J. Aircr. 2014, 51, 719–726. [Google Scholar] [CrossRef]
- Ling, E.J.Y.; Uong, V.; Renault-Crispo, J.S.; Kietzig, A.M.; Servio, P. Reducing Ice Adhesion on Nonsmooth Metallic Surfaces: Wettability and Topography Effects. ACS Appl. Mater. Interfaces 2016, 8, 8789–8800. [Google Scholar] [CrossRef] [PubMed]
- Dou, R.; Chen, J.; Zhang, Y.; Wang, X.; Cui, D.; Song, Y.; Jiang, L.; Wang, J. Anti-icing Coating with an Aqueous Lubricating Layer. ACS Appl. Mater. Interfaces 2014, 6, 6998–7003. [Google Scholar] [CrossRef] [PubMed]
- Guo, C.; Zhang, M.; Hu, J. Icing delay of sessile water droplets on superhydrophobic titanium alloy surfaces. Colloids Surfaces Physicochem. Eng. Asp. 2021, 621, 126587. [Google Scholar] [CrossRef]
- Kameya, Y.; Takada, Y. Prolonged water freezing on a superhydrophobic micropillar polydimethylsiloxane film. Results Mater. 2022, 14, 100274. [Google Scholar] [CrossRef]
- Work, A.; Lian, Y. A critical review of the measurement of ice adhesion to solid substrates. Prog. Aerosp. Sci. 2018, 98, 1–26. [Google Scholar] [CrossRef]
- Bengaluru Subramanyam, S.; Kondrashov, V.; Rühe, J.; Varanasi, K.K. Low Ice Adhesion on Nano-Textured Superhydrophobic Surfaces under Supersaturated Conditions. ACS Appl. Mater. Interfaces 2016, 8, 12583–12587. [Google Scholar] [CrossRef]
- Chen, D.; Gelenter, M.D.; Hong, M.; Cohen, R.E.; McKinley, G.H. Icephobic Surfaces Induced by Interfacial Nonfrozen Water. ACS Appl. Mater. Interfaces 2017, 9, 4202–4214. [Google Scholar] [CrossRef]
- Kraj, A.G.; Bibeau, E.L. Measurement method and results of ice adhesion force on the curved surface of a wind turbine blade. Renew. Energy 2010, 35, 741–746. [Google Scholar] [CrossRef]
- Irajizad, P.; Al-Bayati, A.; Eslami, B.; Shafquat, T.; Nazari, M.; Jafari, P.; Kashyap, V.; Masoudi, A.; Araya, D.; Ghasemi, H. Stress-localized durable icephobic surfaces. Mater. Horizons 2019, 6, 758–766. [Google Scholar] [CrossRef]
- Chen, K.; Leng, X.; Zhao, R.; Kang, Y.; Chen, H. Progress in the Copper-Based Diamond Composites for Thermal Conductivity Applications. Crystals 2023, 13, 906. [Google Scholar] [CrossRef]
- Zhang, Y.; Gao, X.; You, D.; Jiang, X.; Ge, W. Investigation of Laser Butt Welding of AISI 304L and Q235 Steels Based on Numerical and Experimental Analyses. Metals 2022, 12, 803. [Google Scholar] [CrossRef]
- Zhang, A.; Li, Y. Thermal Conductivity of Aluminum Alloys—A Review. Materials 2023, 16, 2972. [Google Scholar] [CrossRef]
- Meuler, A.J.; Smith, J.D.; Varanasi, K.K.; Mabry, J.M.; McKinley, G.H.; Cohen, R.E. Relationships between Water Wettability and Ice Adhesion. ACS Appl. Mater. Interfaces 2010, 2, 3100–3110. [Google Scholar] [CrossRef]
- ISO 25178-2:2021; Geometrical Product Specification (GPS) Surface Texture: Areal–Part 2: Terms, Definitions and Surface Texture Parameters. ISO: Geneva, Switzerland.
- Extrand, C.W. Uncertainty in contact angle measurements from the tangent method. J. Adhes. Sci. Technol. 2016, 30, 1597–1601. [Google Scholar] [CrossRef]
- Golovin, K.; Dhyani, A.; Thouless, M.D.; Tuteja, A. Low–interfacial toughness materials for effective large-scale deicing. Science 2019, 364, 371–375. [Google Scholar] [CrossRef]
- Stendardo, L.; Gastaldo, G.; Budinger, M.; Tagliaro, I.; Pommier-Budinger, V.; Antonini, C. Why the adhesion strength is not enough to assess ice adhesion on surfaces. Appl. Surf. Sci. 2024, 672, 160740. [Google Scholar] [CrossRef]
- Castillo, J.E.; Weibel, J.A.; Garimella, S.V. The effect of relative humidity on dropwise condensation dynamics. Int. J. Heat Mass Transf. 2015, 80, 759–766. [Google Scholar] [CrossRef]


| Reference | Ice Formation | Type of Water | A (mm2) | Volume of Water | Velocity | Temperature (°C) | Ice Adhesion |
|---|---|---|---|---|---|---|---|
| [12] | On the test bench, until the liquid is completely frozen | DI water | 79 | 2 mL | 30 mm/min | −15 | |
| [13] | In a freezer at −10 °C, during 24 h | Water | Mold full filled | 0.5 mm/min | −10 | ||
| [14] | On the test bench at −20 °C, until the liquid is completely frozen | Fresh DI water | 24 | 150 µmL | 0.5 mm/s | −10 | |
| [15] | On the test bench, until the liquid is completely frozen | Ultra-pure water | 4 µmL droplet | 1 mm/s | −10 | ||
| [16] | In a freezer at −25 °C, during 3–3.5 h | DI water | 36 | 0.33 mm/s | −10 |
| Sample | Thickness (mm) | Width (mm) | Length (mm) | Thermal Conductivity (W·m−1·K−1) |
|---|---|---|---|---|
| Copper | 0.92 ± 0.01 | 21.69 ± 0.01 | 32.26 ± 0.01 | 400 [35] |
| 304L | 0.93 ± 0.02 | 21.87 ± 0.03 | 32.25 ± 0.03 | 17 [36] |
| Bare aluminum | 0.98 ± 0.01 | 22.11 ± 0.04 | 32.22 ± 0.01 | 237 [37] |
| Polished aluminum | 1.59 ± 0.02 | 24.03 ± 0.02 | 32.30 ± 0.03 | 237 [37] |
| Sample | Sa (nm) | Static CA (°) |
|---|---|---|
| Copper | 29.2 ± 1.2 | 102 ± 3 |
| 304L | 7.1 ± 0.3 | 65 ± 4 |
| Bare aluminum | 362.3 ± 6.3 | 96 ± 4 |
| Polished aluminum | 26.1 ± 2.8 | 89 ± 3 |
Disclaimer/Publisher’s Note: The statements, opinions and data contained in all publications are solely those of the individual author(s) and contributor(s) and not of MDPI and/or the editor(s). MDPI and/or the editor(s) disclaim responsibility for any injury to people or property resulting from any ideas, methods, instructions or products referred to in the content. |
© 2025 by the authors. Licensee MDPI, Basel, Switzerland. This article is an open access article distributed under the terms and conditions of the Creative Commons Attribution (CC BY) license (https://creativecommons.org/licenses/by/4.0/).
Share and Cite
Burdin, L.; Brulez, A.-C.; Mazurczyk, R.; Leclercq, J.-L.; Benayoun, S. Proposal for a Controlled Humidity Environment Test Bench for the Accurate Characterization of Icephobic Properties. Micromachines 2025, 16, 756. https://doi.org/10.3390/mi16070756
Burdin L, Brulez A-C, Mazurczyk R, Leclercq J-L, Benayoun S. Proposal for a Controlled Humidity Environment Test Bench for the Accurate Characterization of Icephobic Properties. Micromachines. 2025; 16(7):756. https://doi.org/10.3390/mi16070756
Chicago/Turabian StyleBurdin, Louise, Anne-Catherine Brulez, Radoslaw Mazurczyk, Jean-Louis Leclercq, and Stéphane Benayoun. 2025. "Proposal for a Controlled Humidity Environment Test Bench for the Accurate Characterization of Icephobic Properties" Micromachines 16, no. 7: 756. https://doi.org/10.3390/mi16070756
APA StyleBurdin, L., Brulez, A.-C., Mazurczyk, R., Leclercq, J.-L., & Benayoun, S. (2025). Proposal for a Controlled Humidity Environment Test Bench for the Accurate Characterization of Icephobic Properties. Micromachines, 16(7), 756. https://doi.org/10.3390/mi16070756