

Influence of Process Energy on the Formation of Imperfections in Body-Centered Cubic Cells with Struts in the Vertical Orientation Produced by Laser Powder Bed Fusion from the Magnesium Alloy WE43

Abstract
1. Introduction
2. Materials and Methods
2.1. Laser Powder Bed Fusion
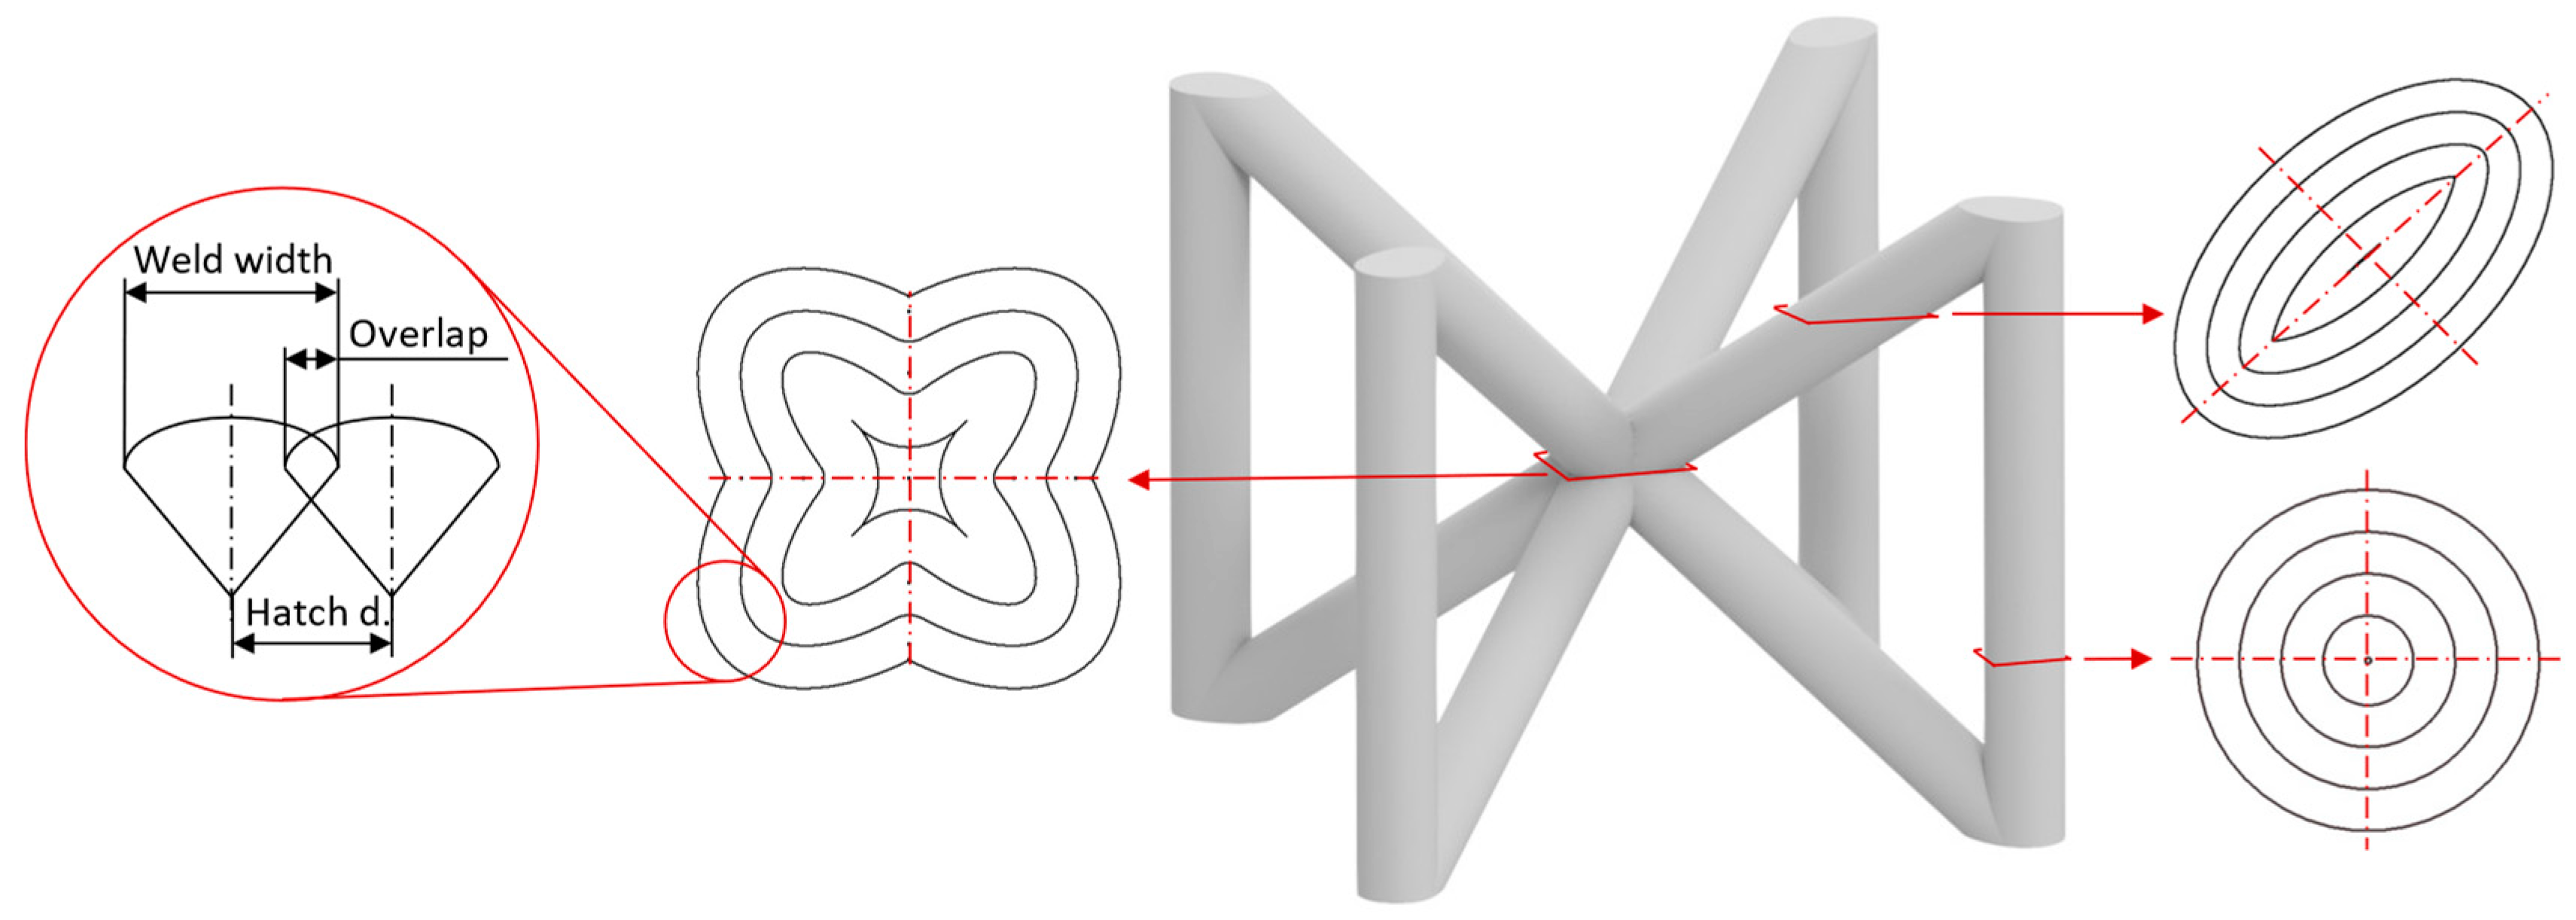
2.2. Contour Scanning Strategy
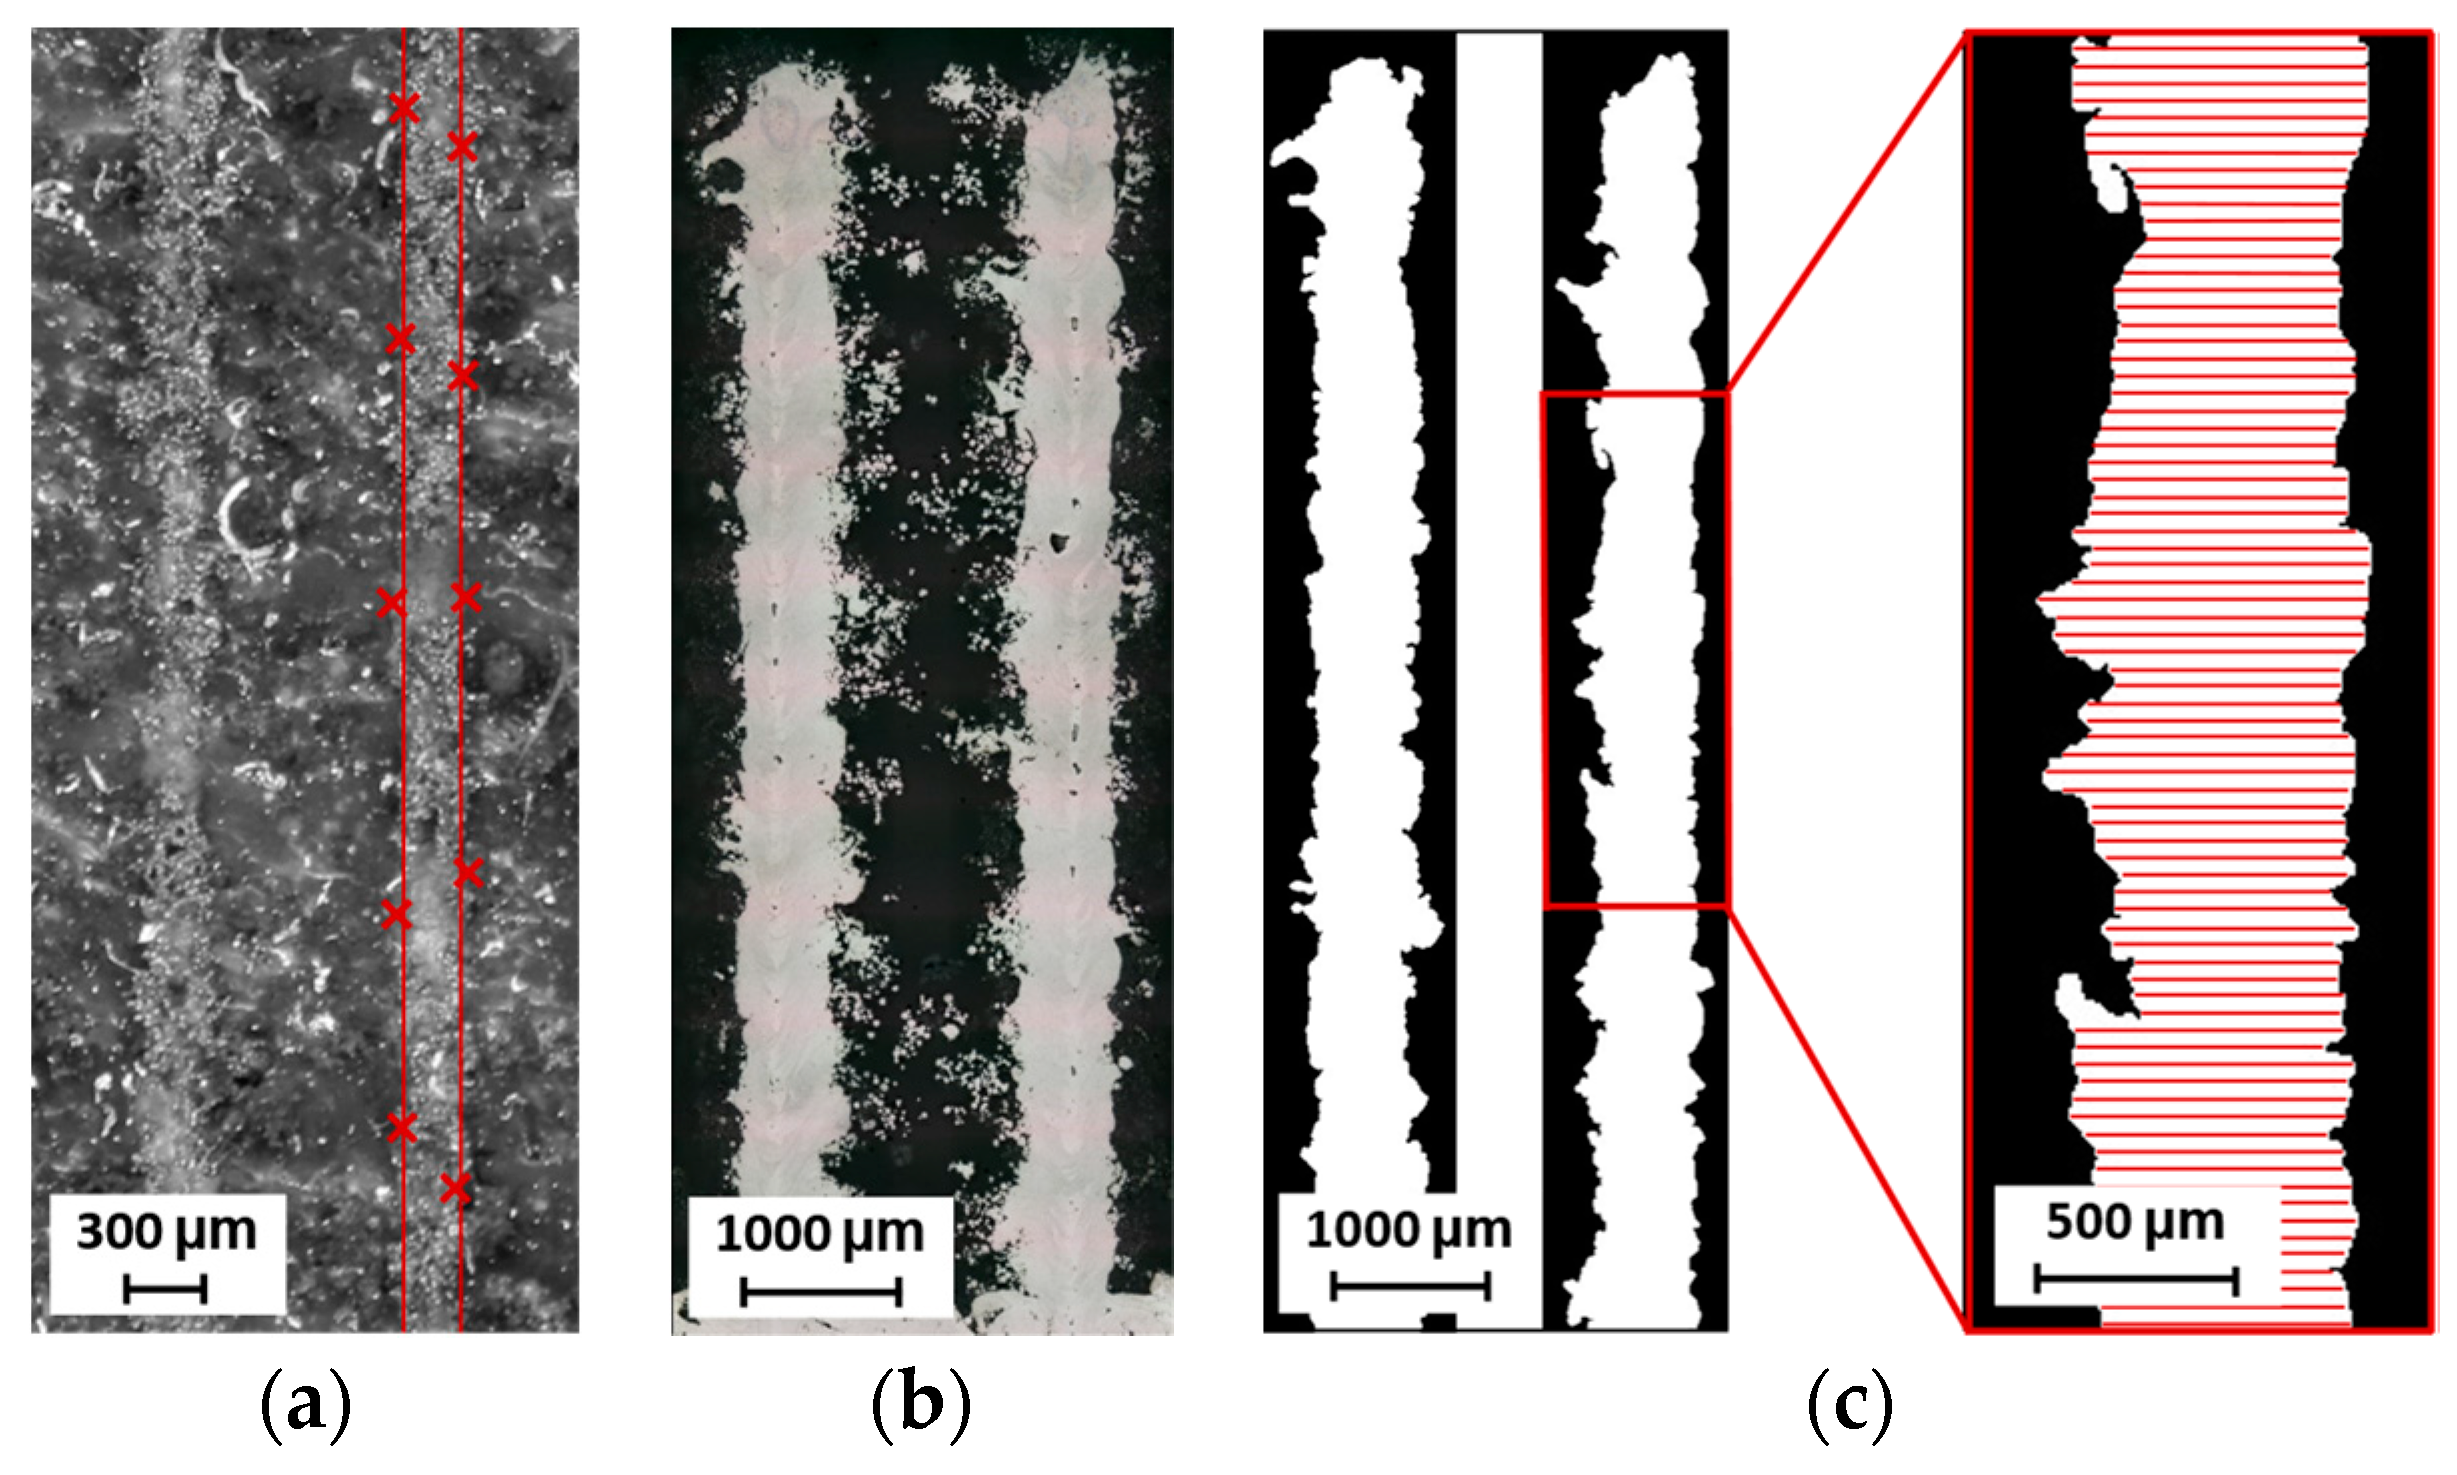
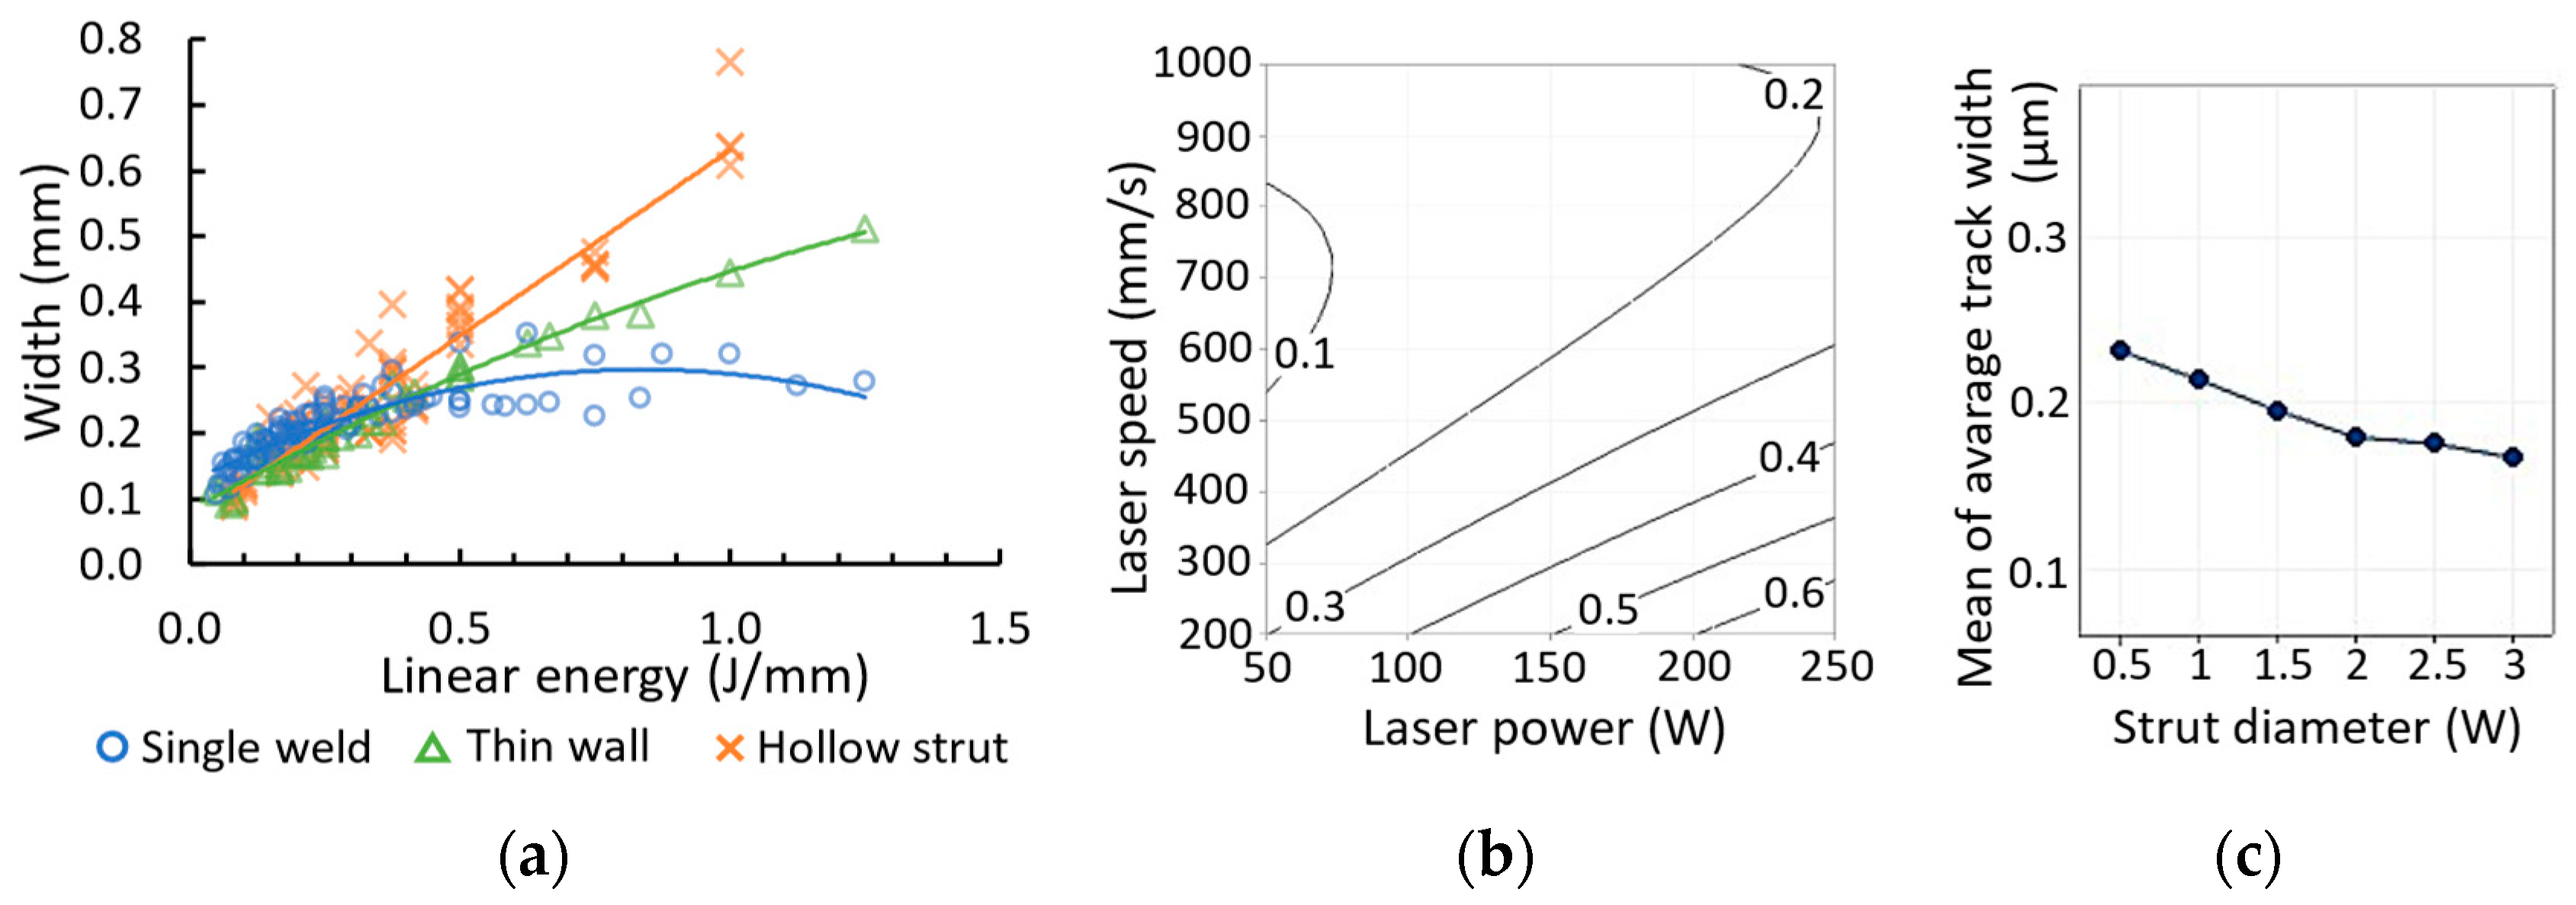
2.3. Weld Width
2.3.1. Single-Weld Samples
2.3.2. Thin Wall Samples
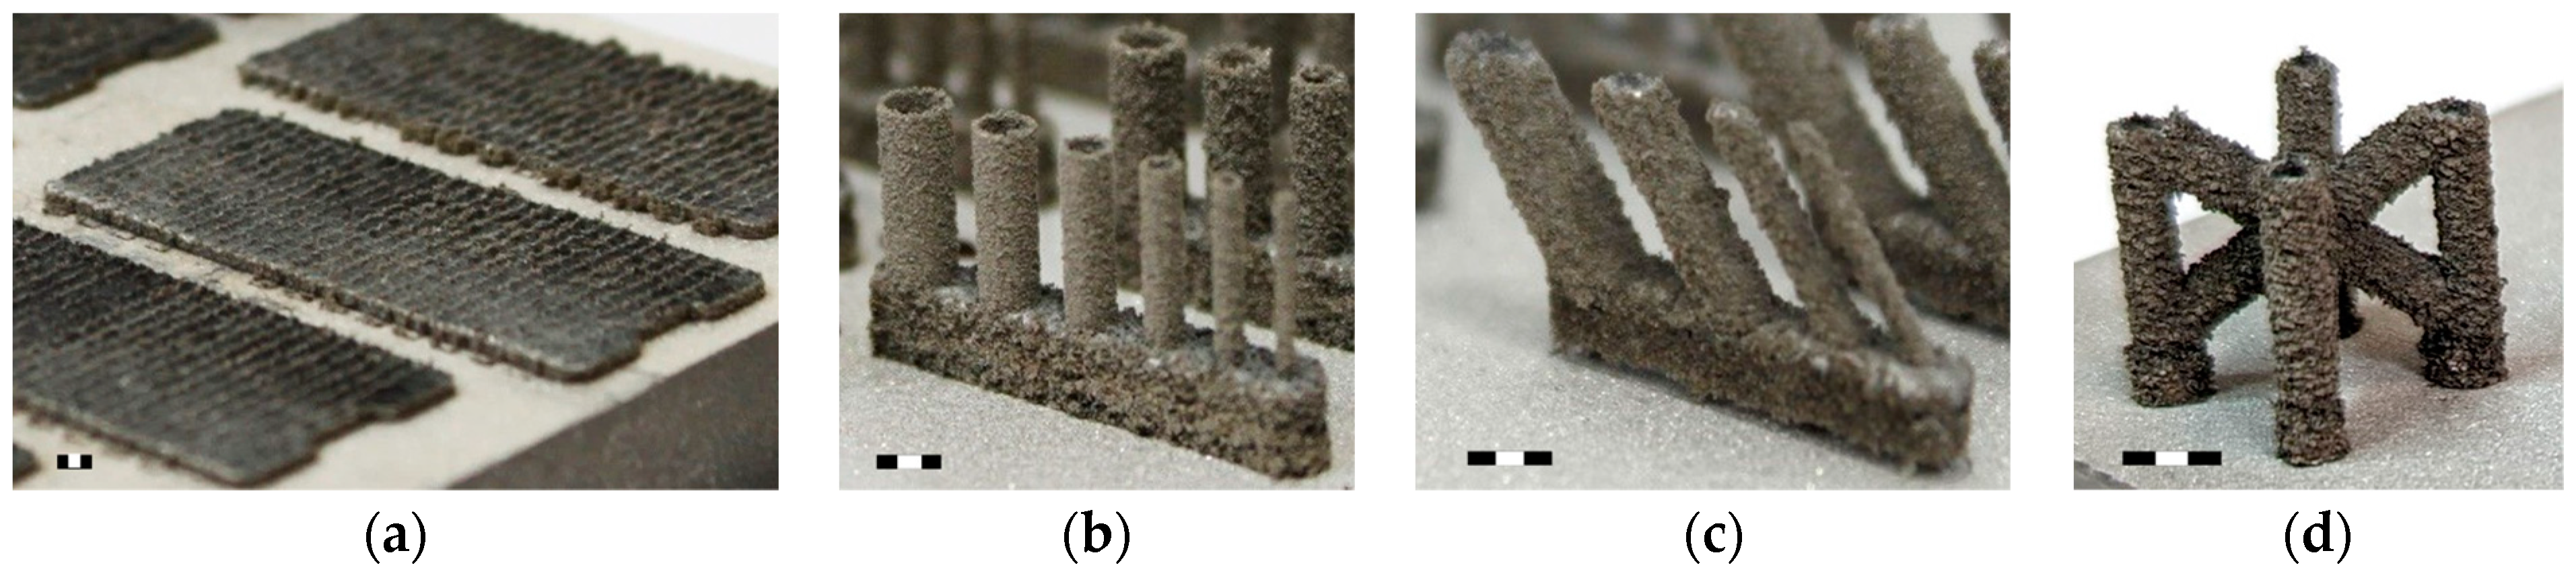
2.3.3. Hollow Strut Samples
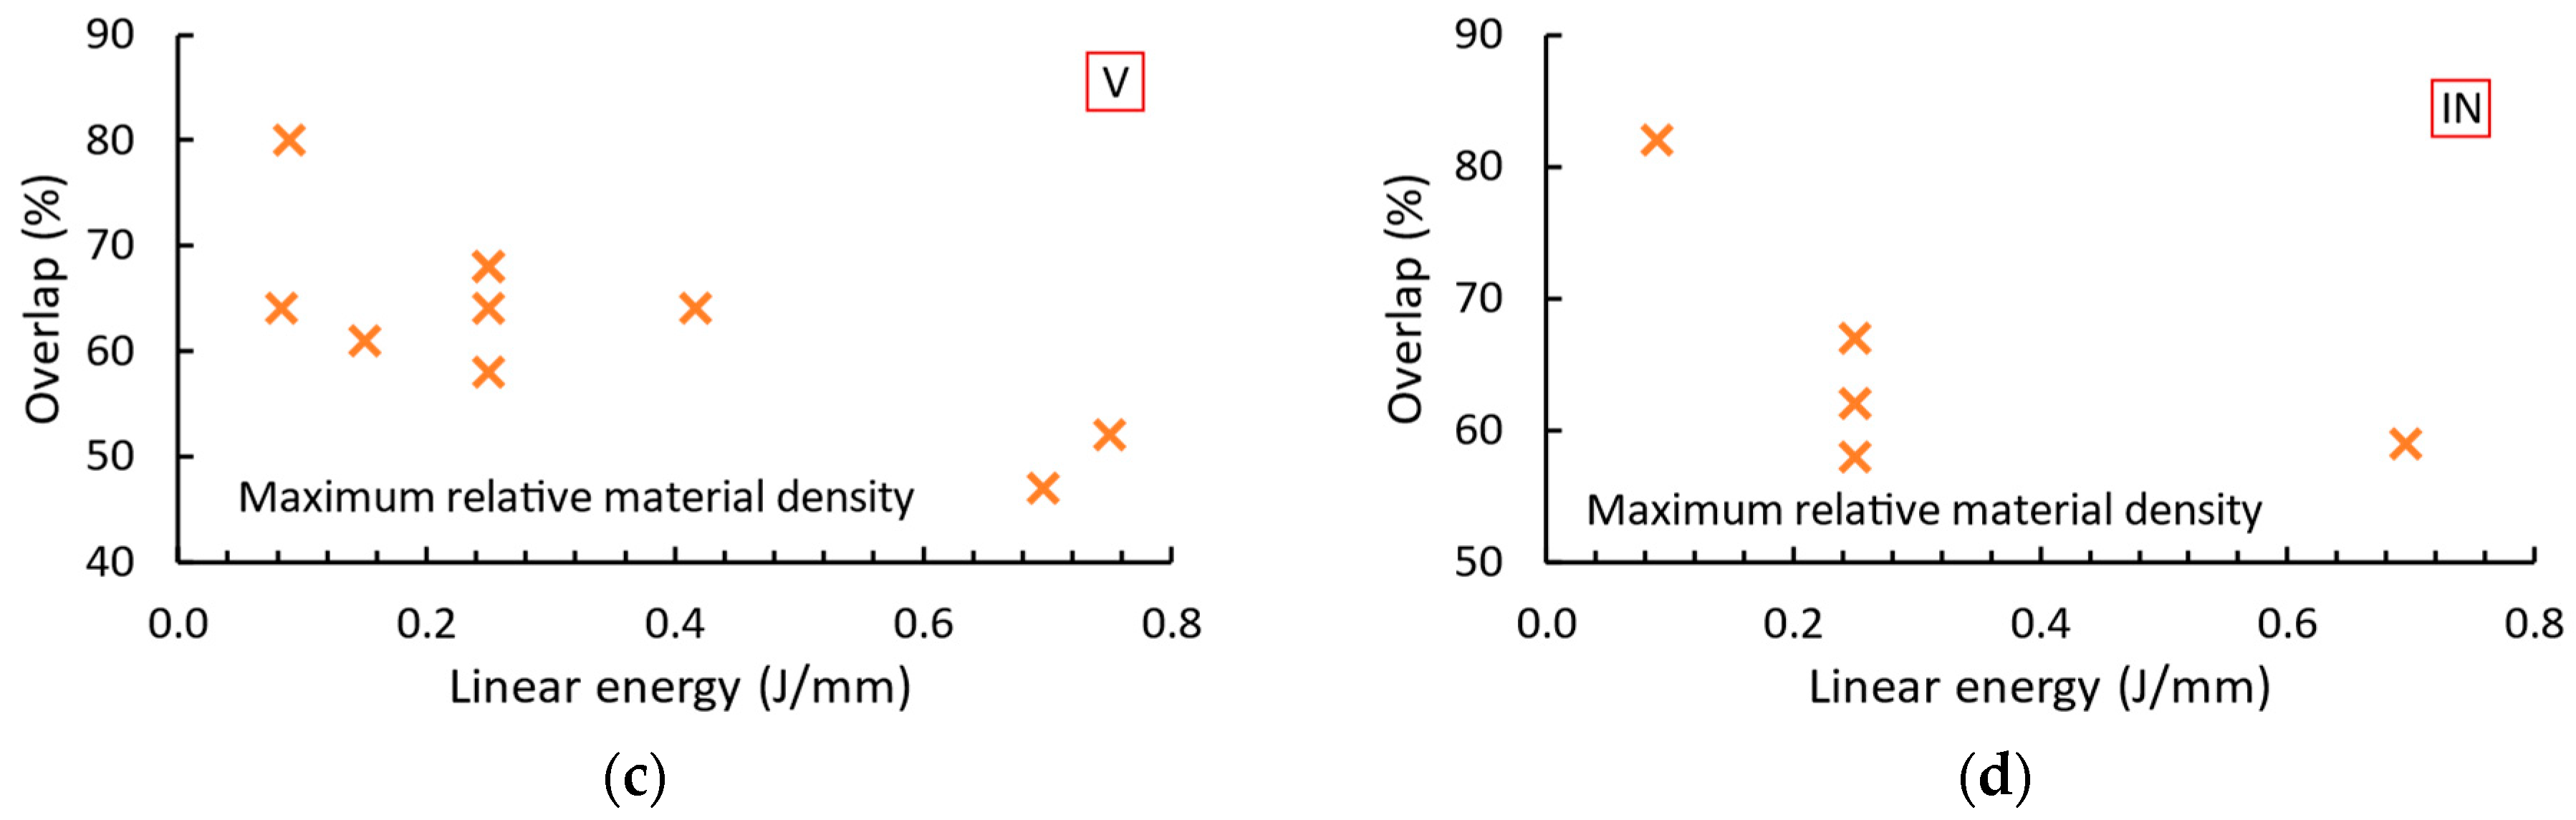
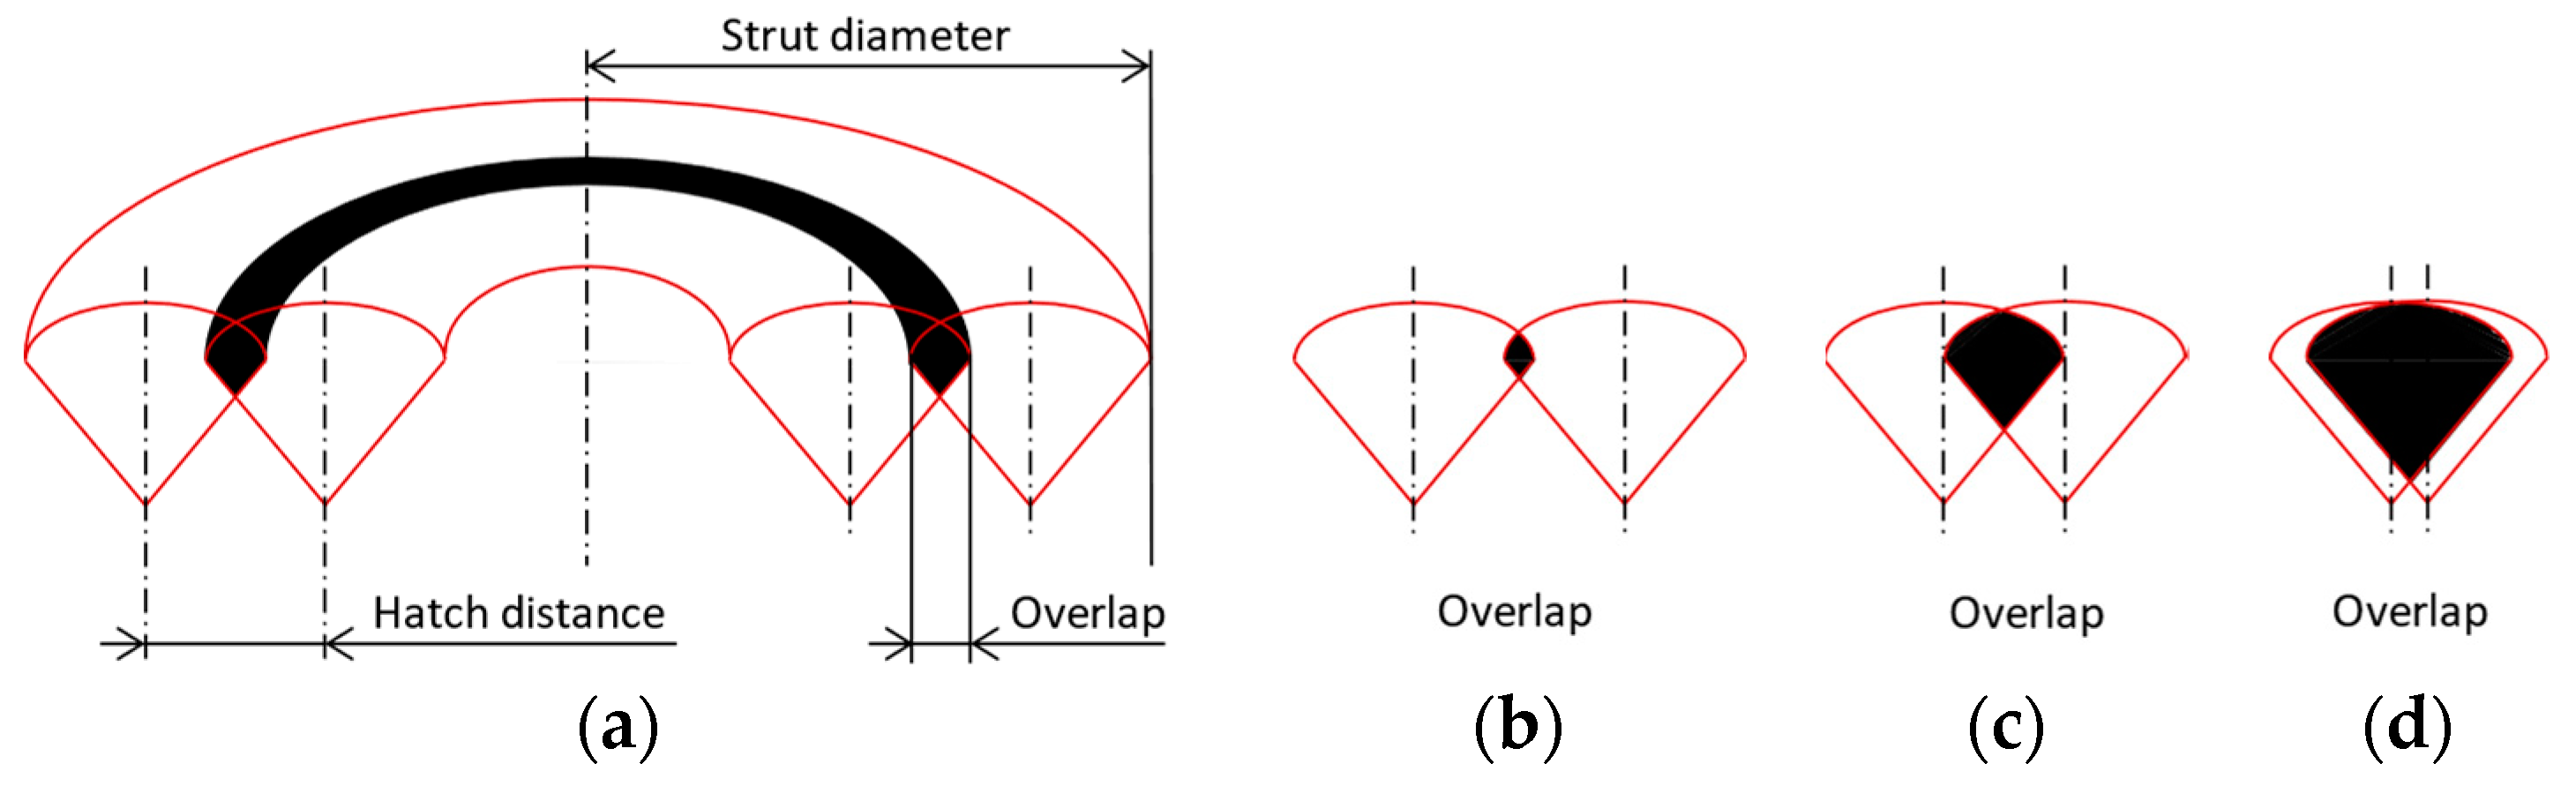
2.4. Overlap
2.5. Vertical and Inclined Struts
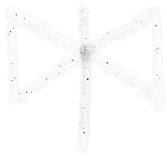
2.6. BCCZ Cells
2.7. Relative Material Density
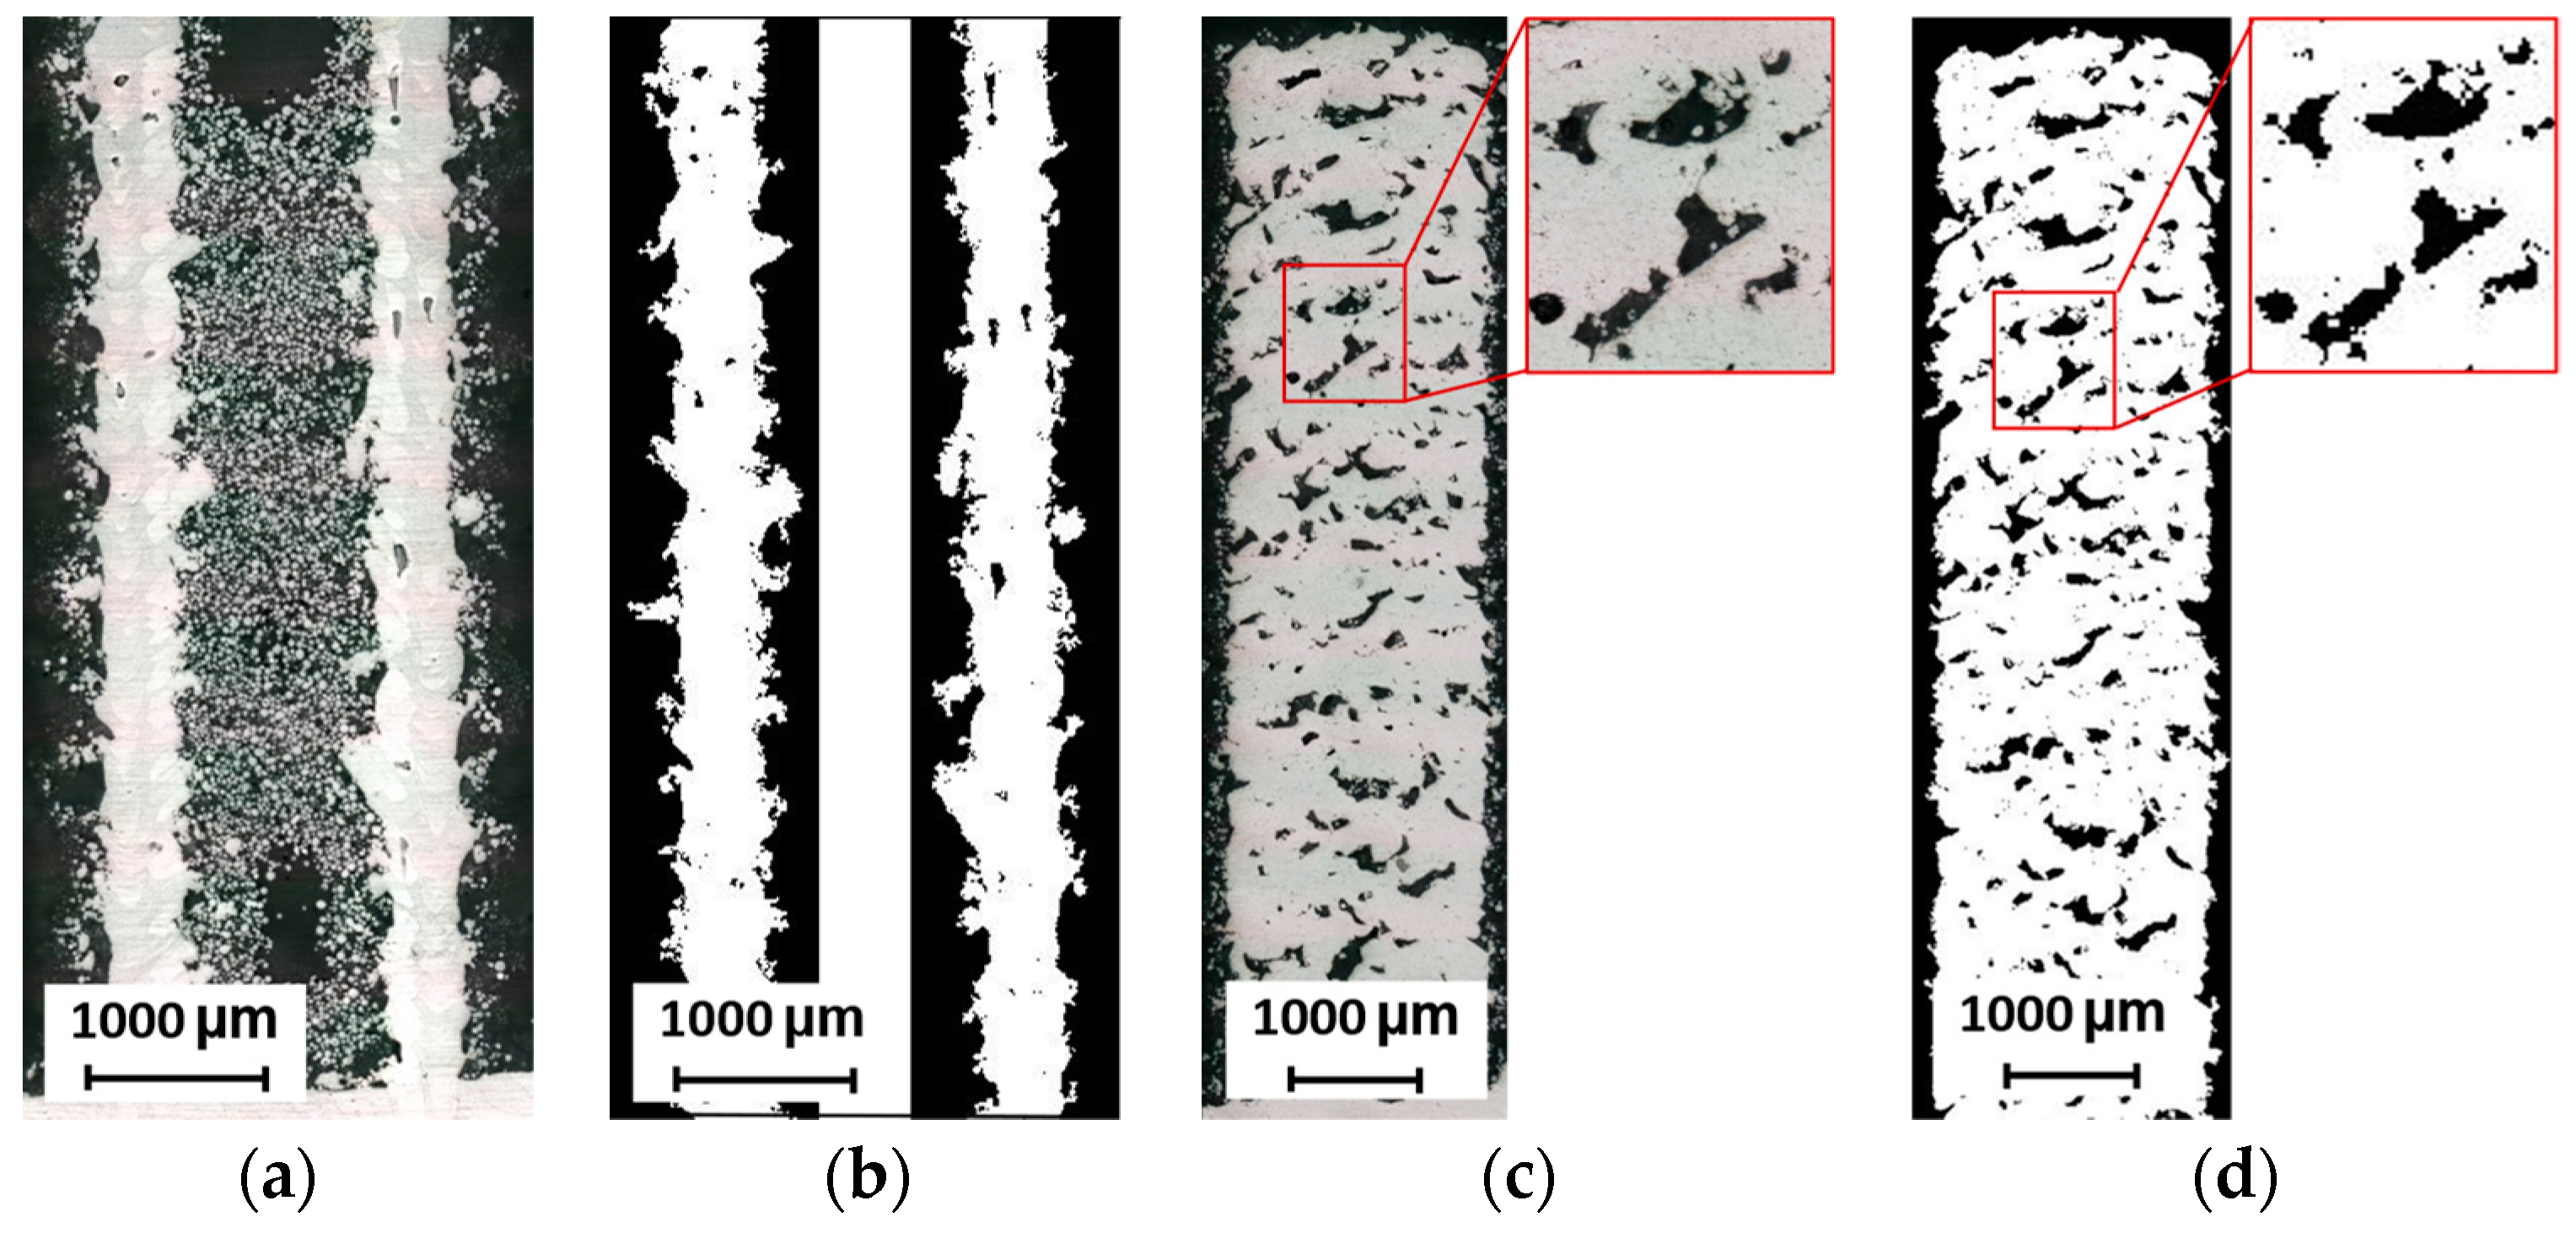
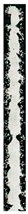
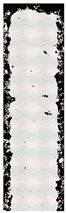
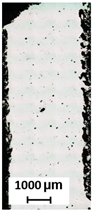
2.7.1. Metallographic Sections
2.7.2. CT Analysis
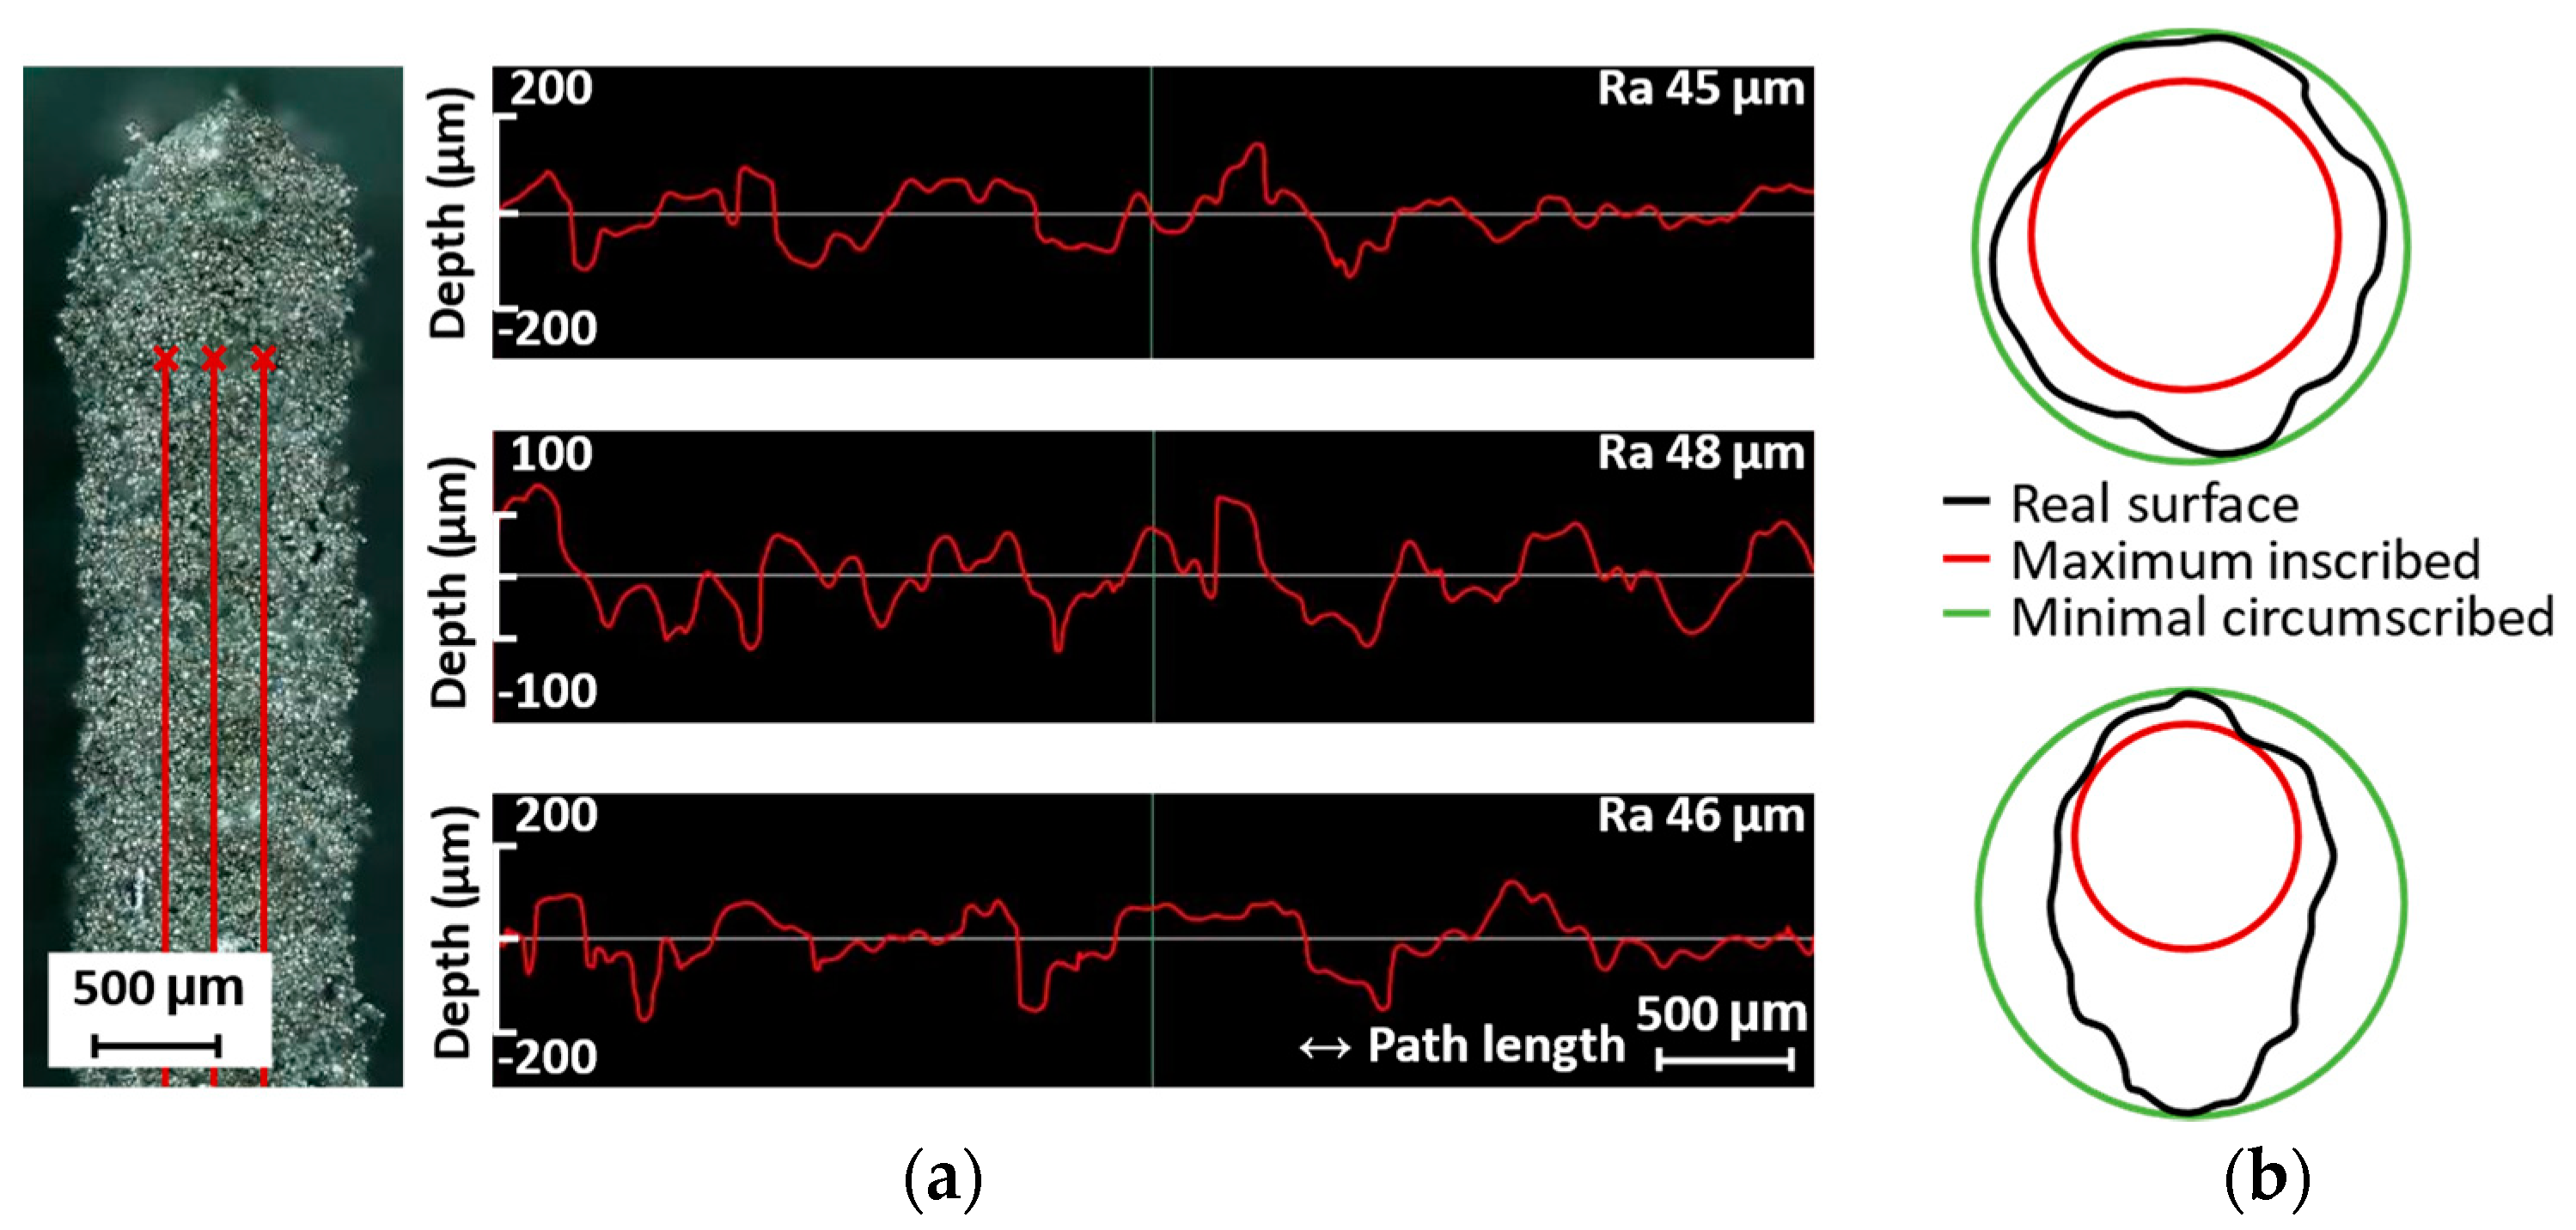
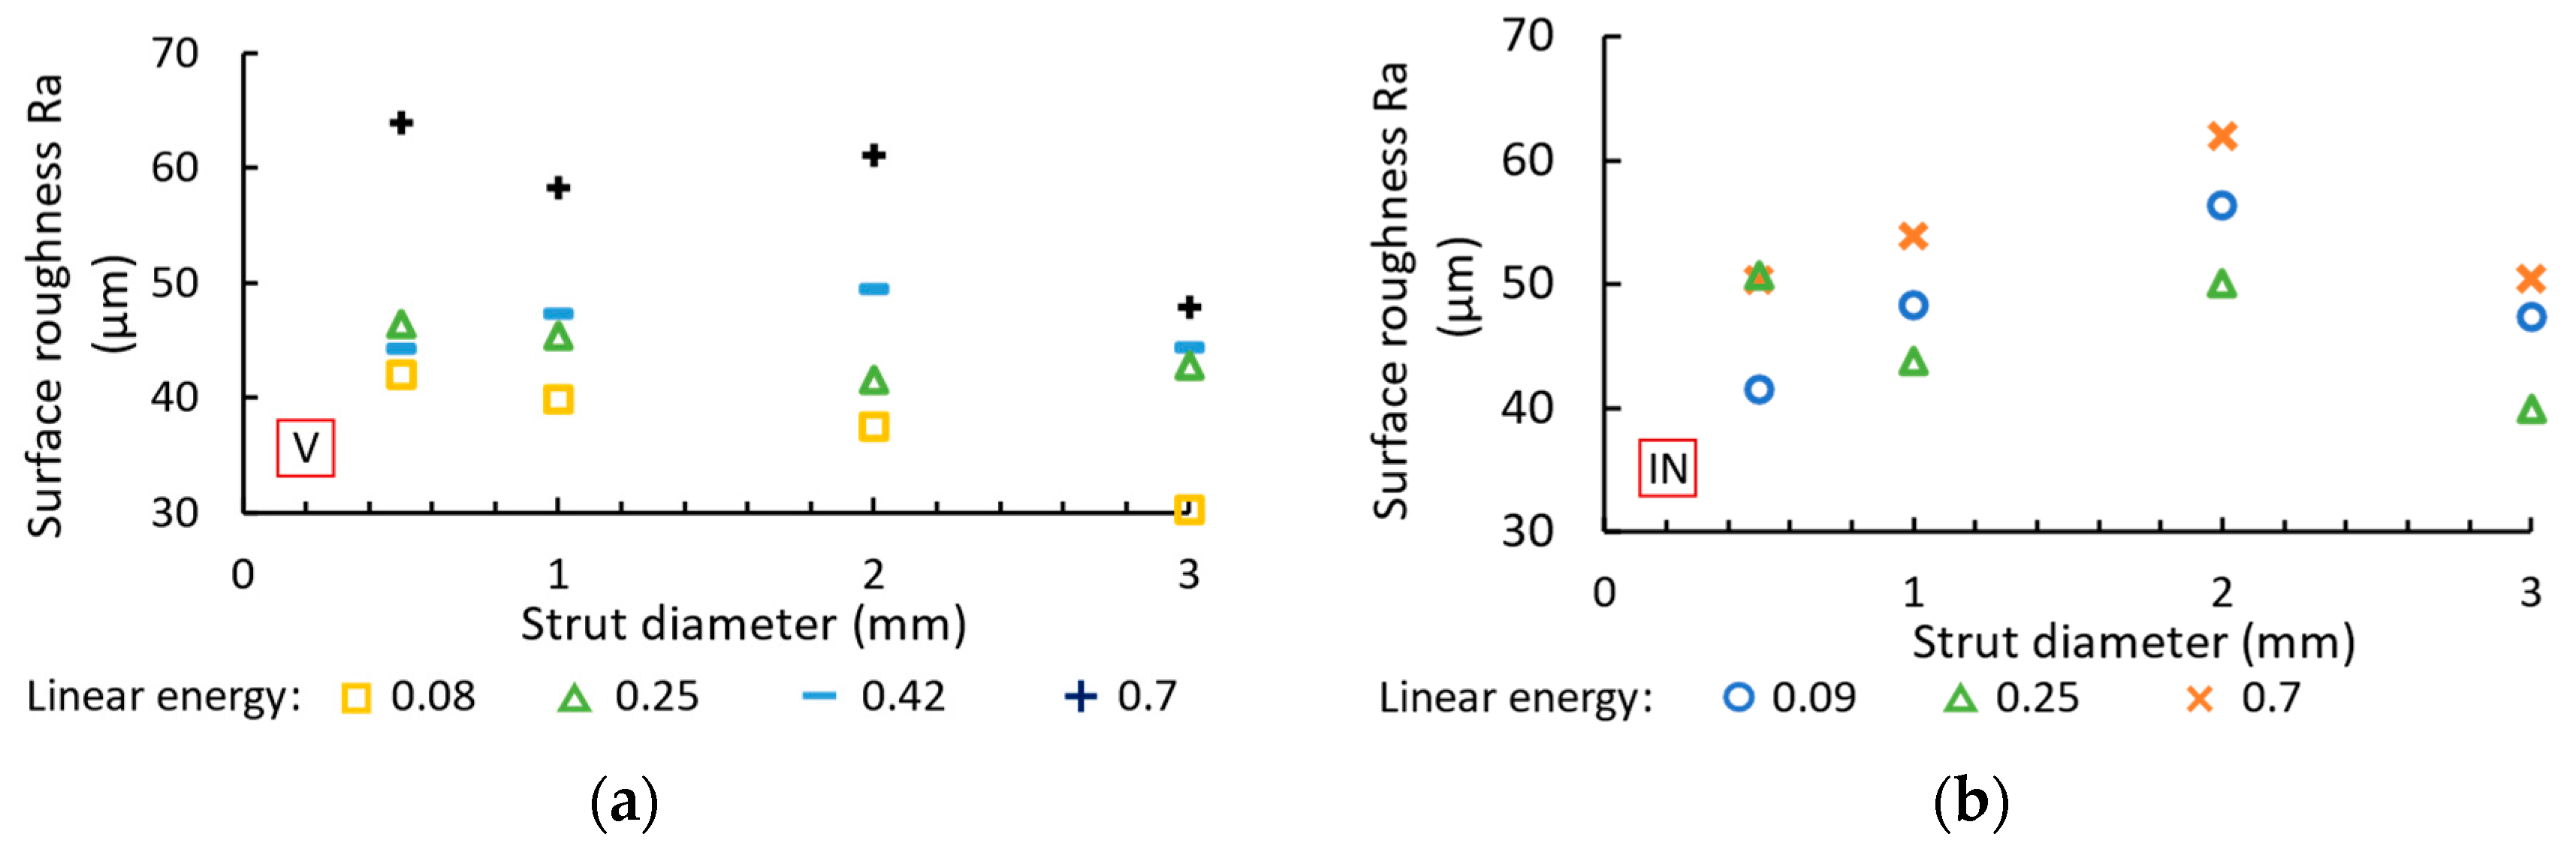
2.8. Surface Roughness
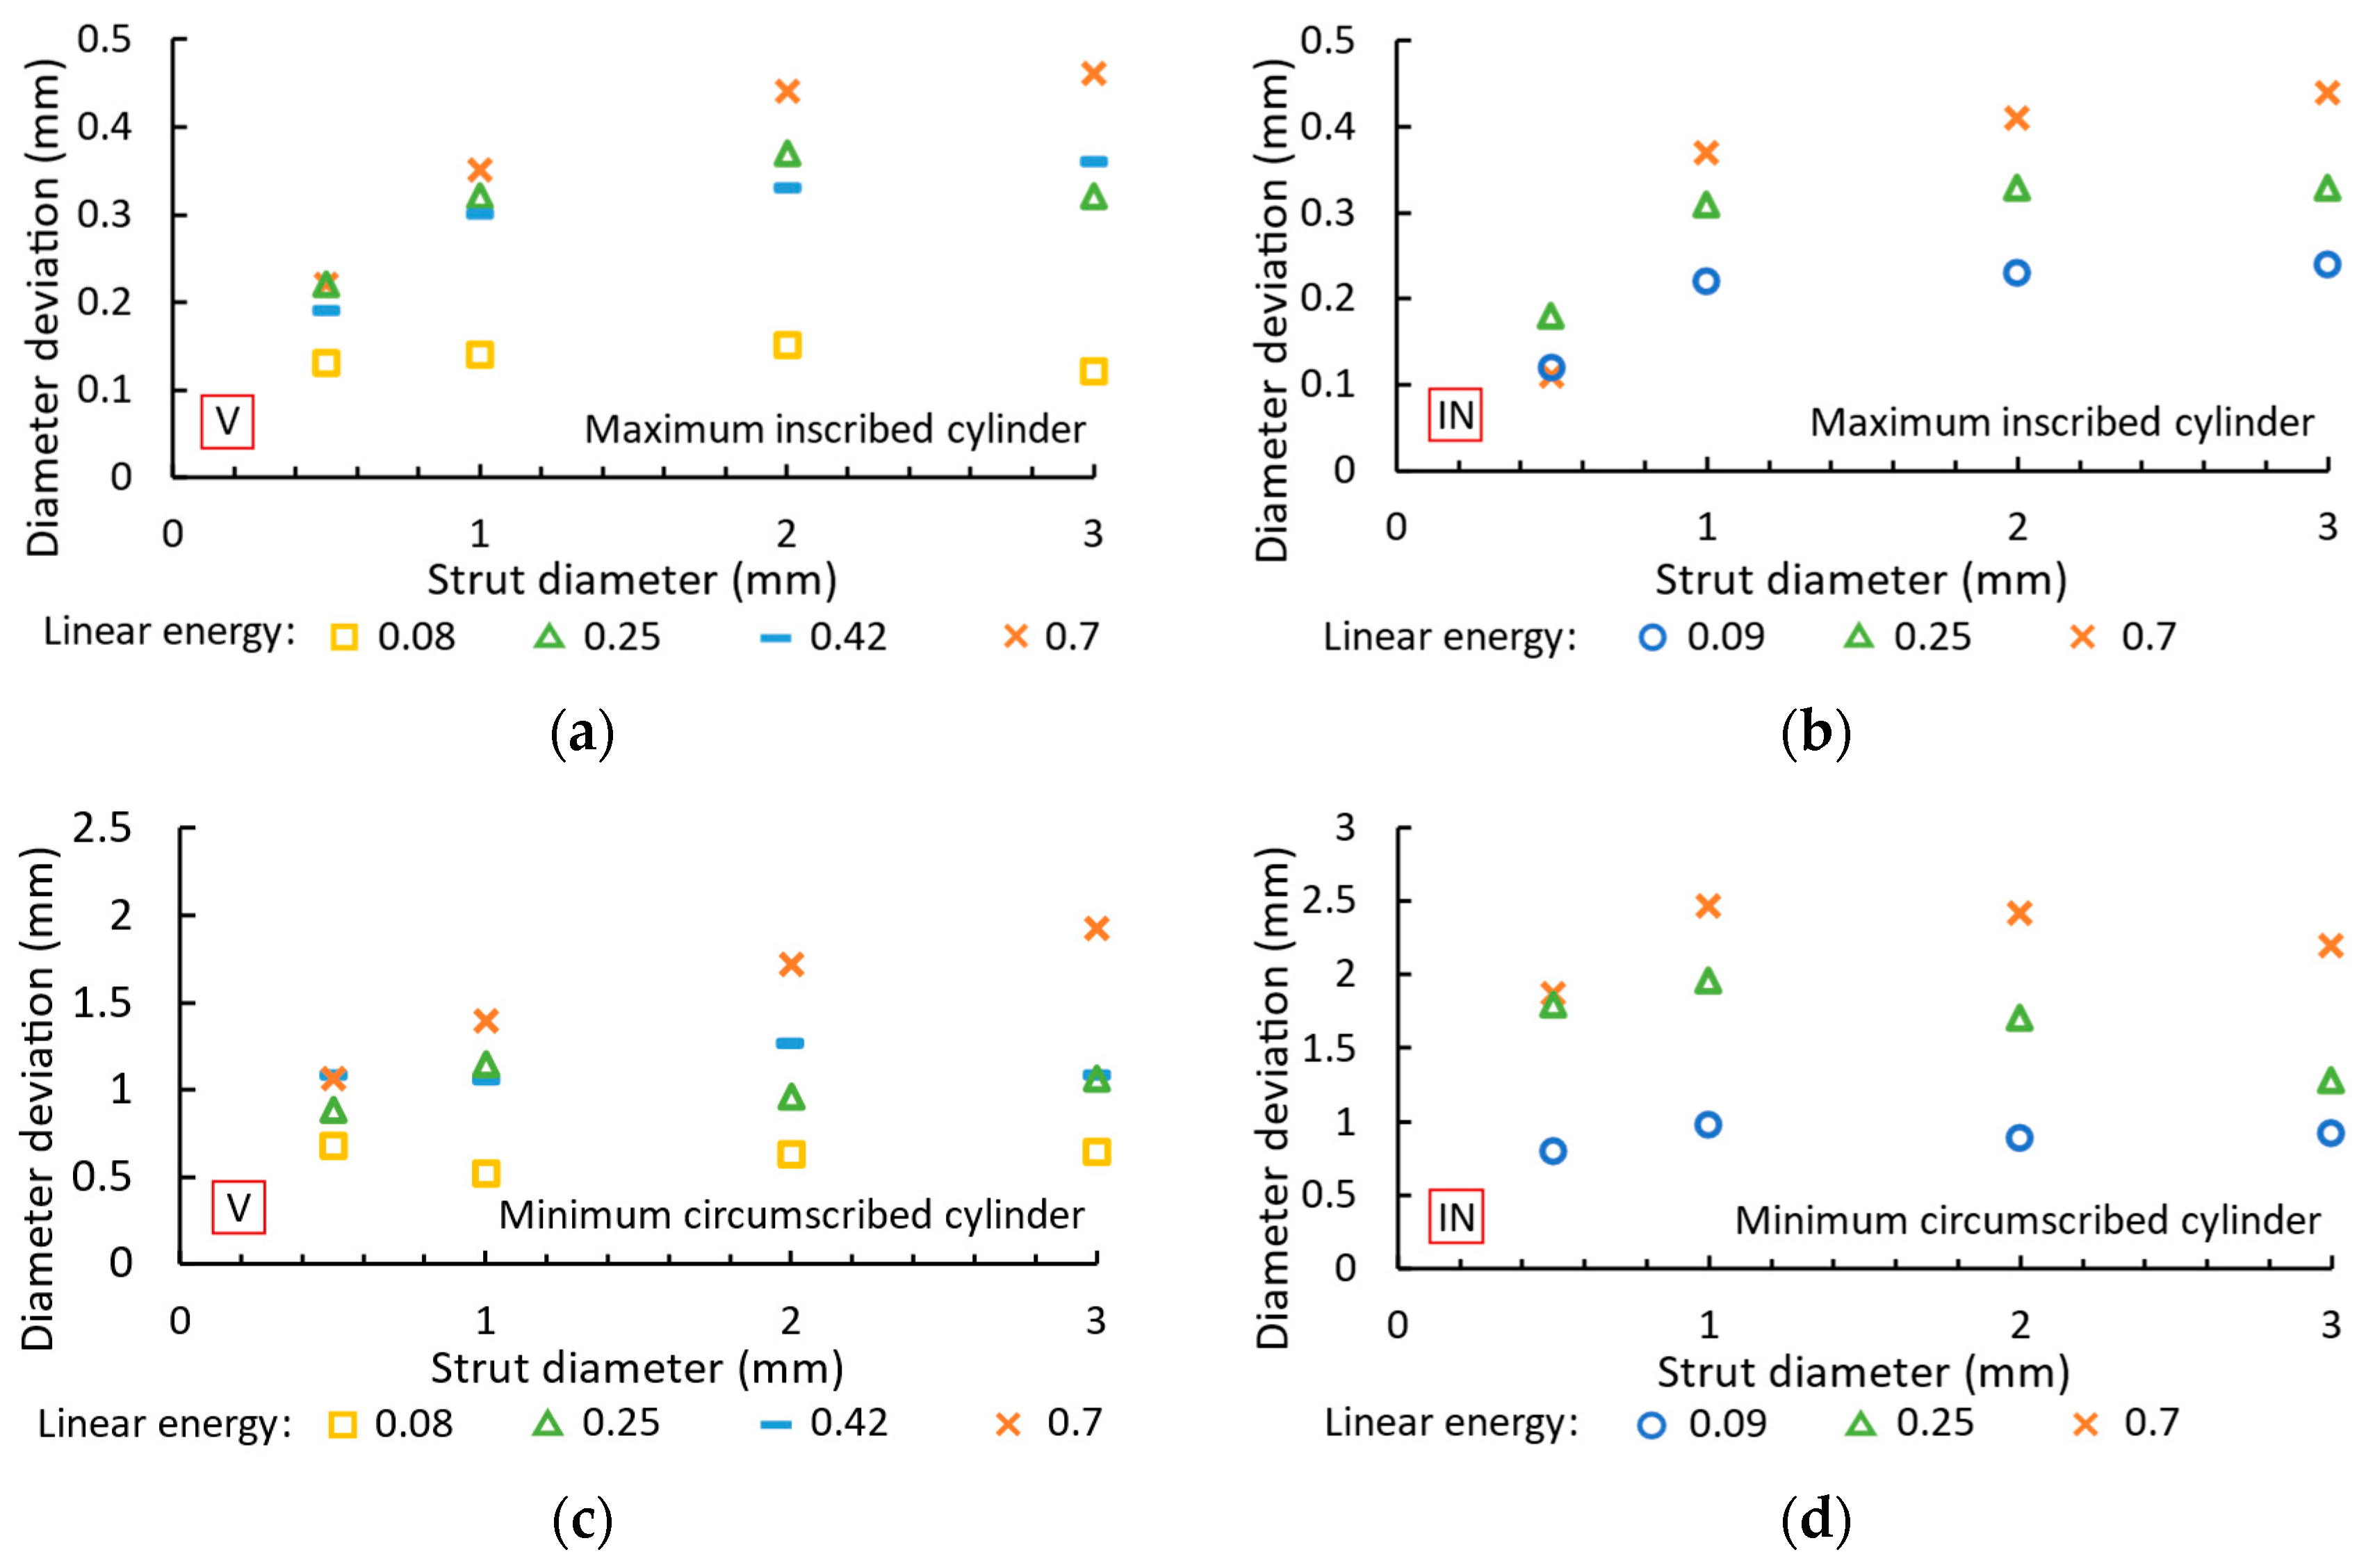
2.9. Diameter Deviation
3. Results and Discussion
3.1. Effect of Specimen Geometry on Weld Width
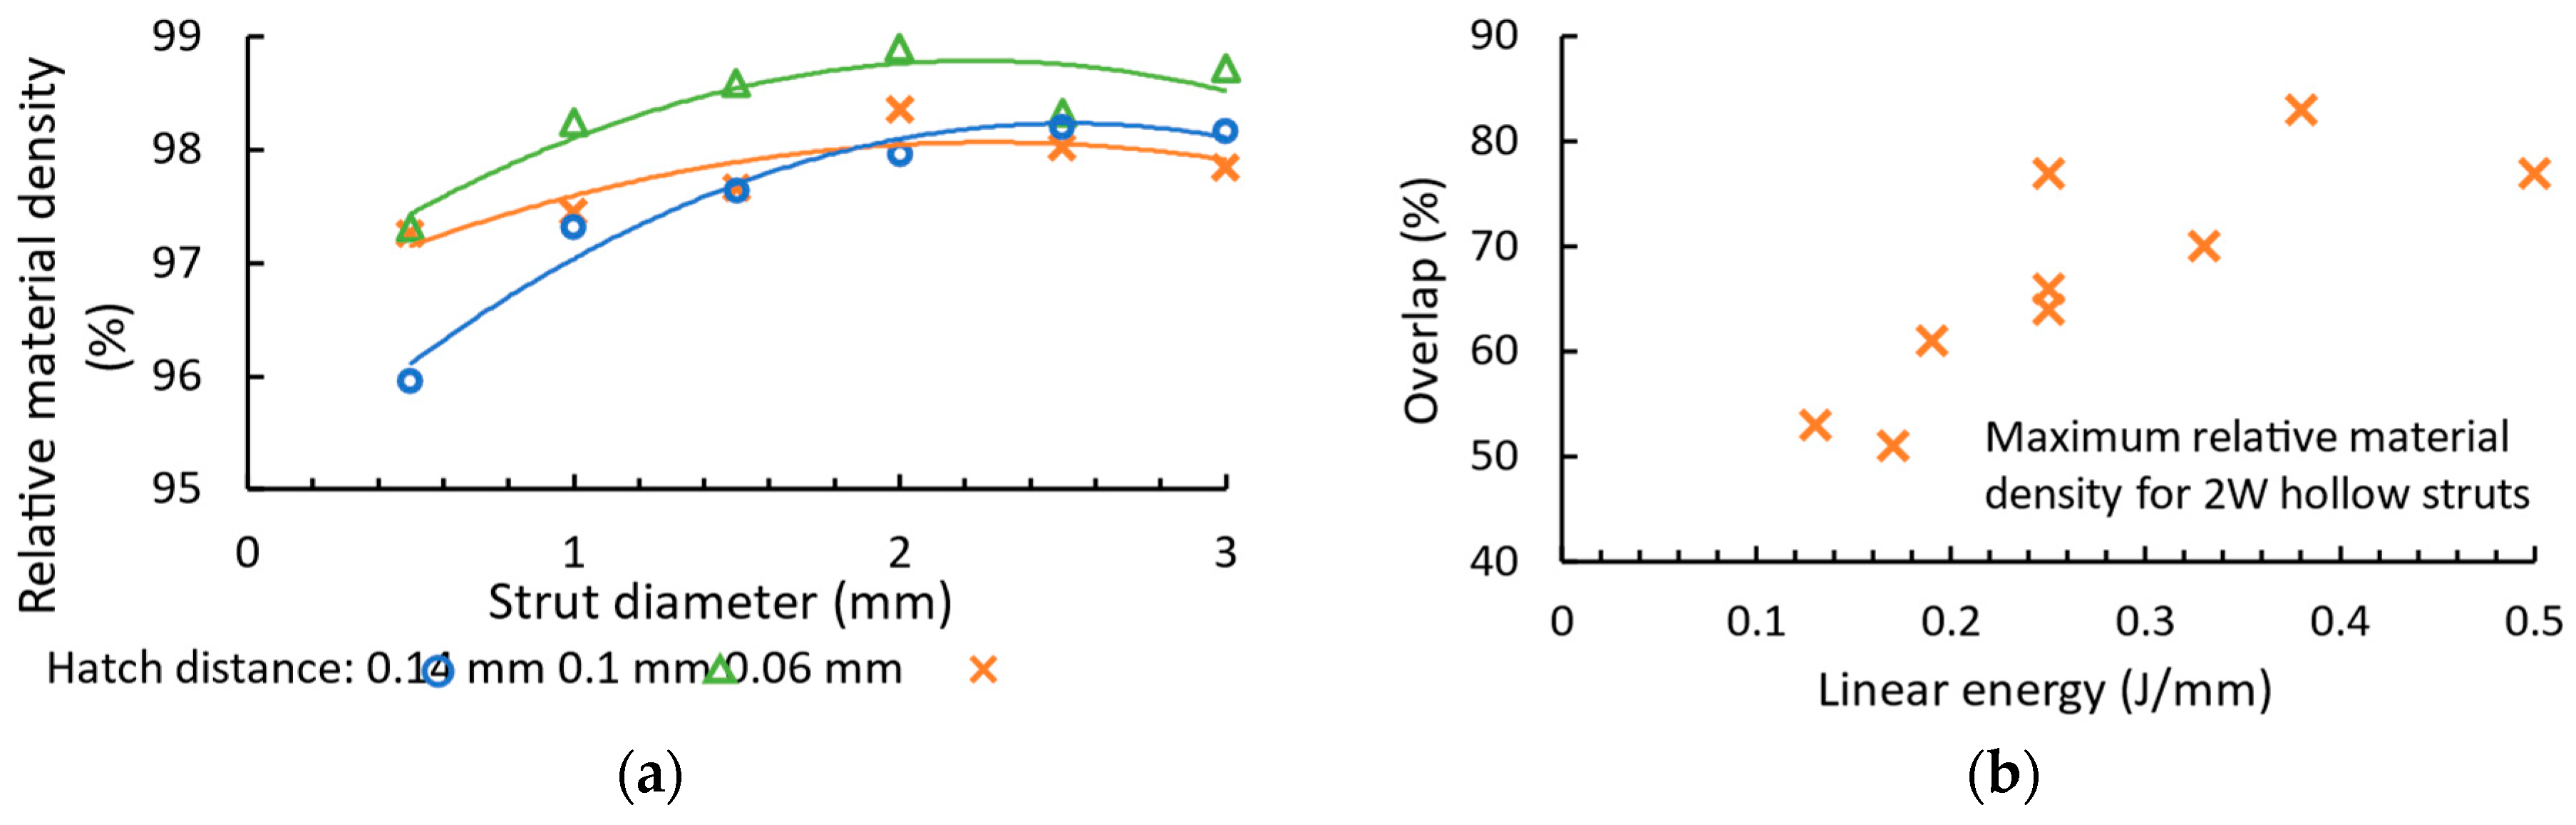
3.2. Overlap
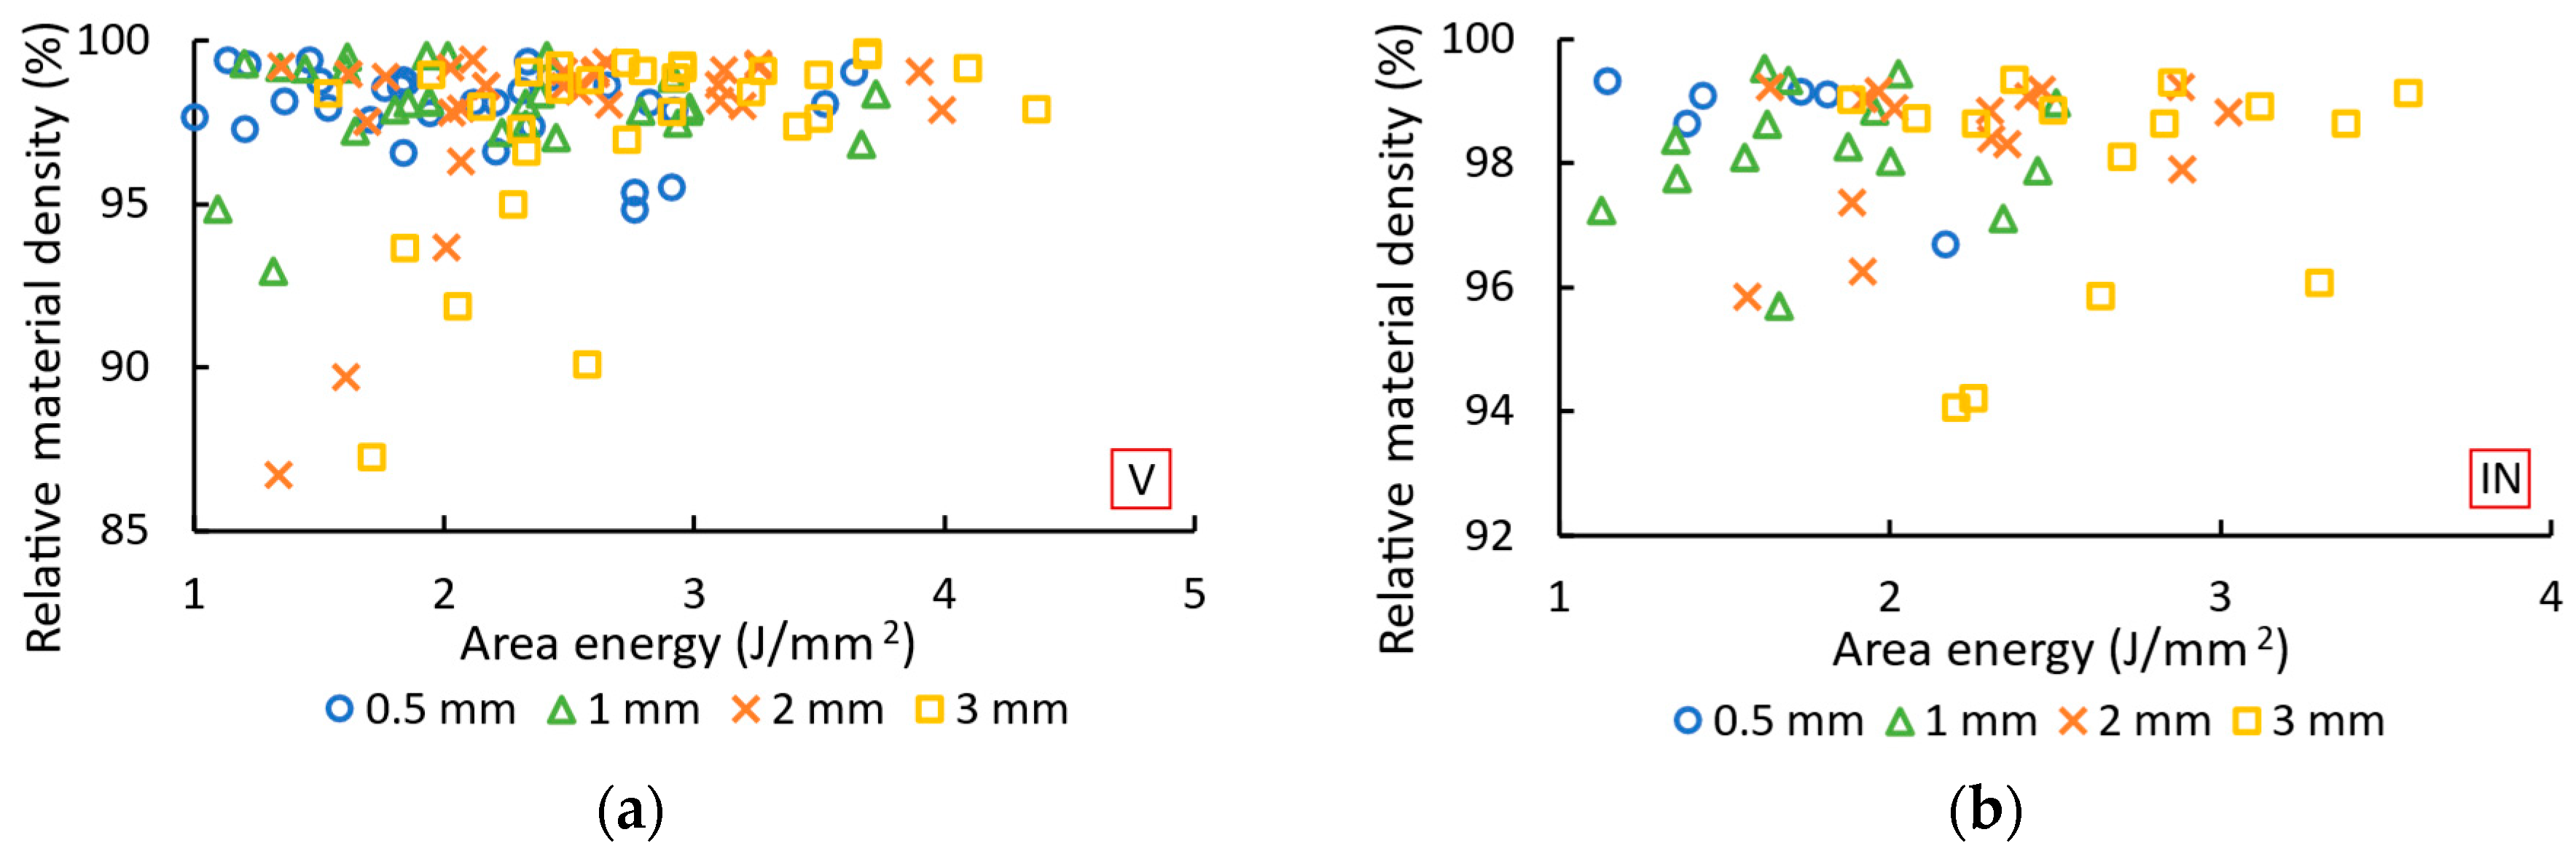
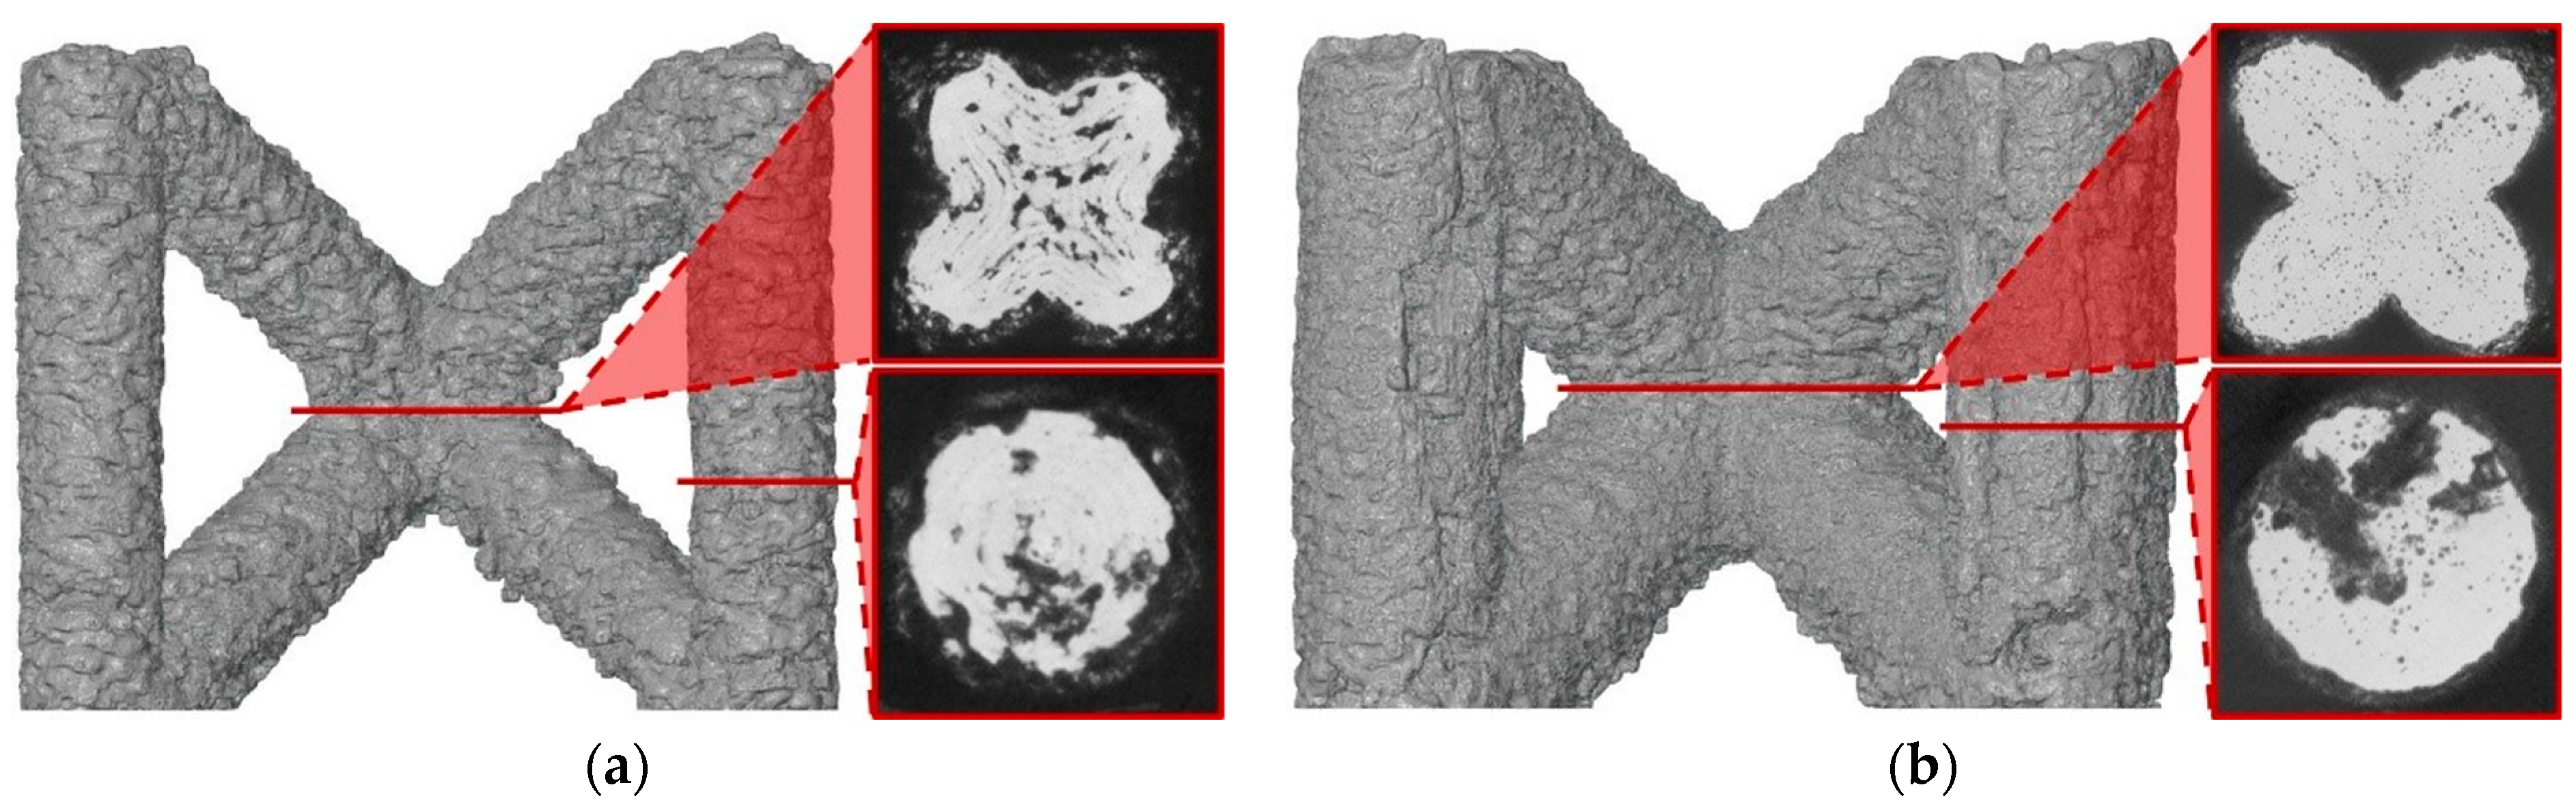
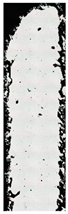
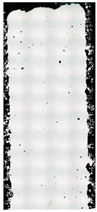
3.3. Relative Material Density
3.4. Surface Roughness
3.5. Diameters of Vertical and Inclined Struts
4. Conclusions
- The vertical and inclined struts achieved a relative material density of 99.3–99.6% with an area energy of the process parameters between 1.15 and 3.69 J/mm2 depending on the strut diameter and inclination.
- BCCZ cells with a diameter of 0.5 mm and 1 mm achieved a relative material density of 99.83–99.96% with small round pores. The BCCZ cells with a diameter of 2 mm and 3 mm achieved a relative material density of 99.32–99.72%.
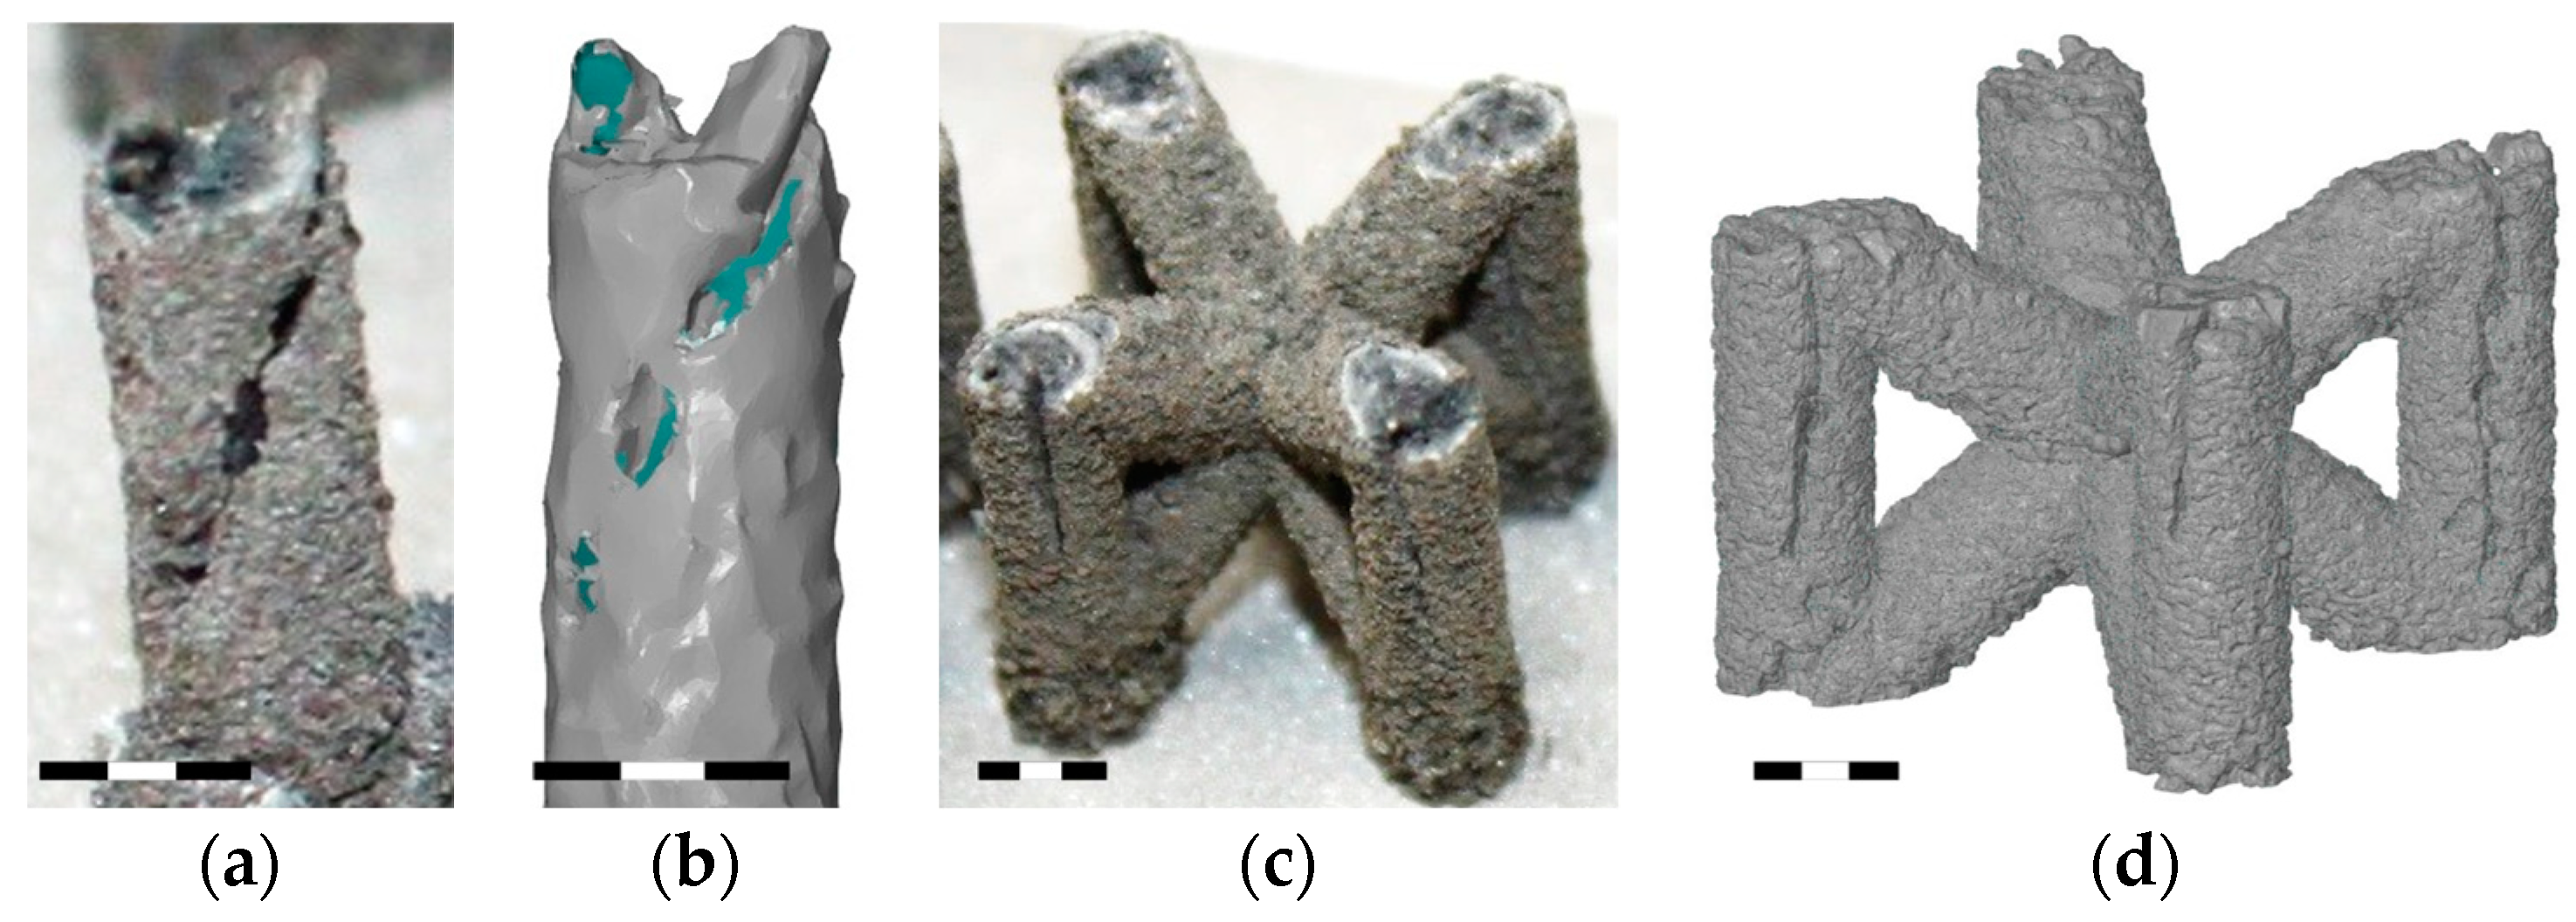
- Holes were observed in the vertical struts of the 3 mm diameter BCCZ cells, which can be related to contour scanning strategy and large strut diameter.
- The overlap of the welds had a major influence on the porosity formation in the contour scanning strategy. The overlap value was determined based on the width of the weld of hollow strut specimens.
- The low melting point of the magnesium alloy WE43 led to an increase in the diameter of the struts. The load-bearing diameter deviated from the nominal diameter by 4–44% depending on the orientation and diameter of the strut.
Author Contributions
Funding
Data Availability Statement
Acknowledgments
Conflicts of Interest
References
- Wong, K.V.; Hernandez, A. A Review of Additive Manufacturing. ISRN Mech. Eng. 2012, 2012, 208760. [Google Scholar] [CrossRef]
- Bhuvanesh Kumar, M.; Sathiya, P. Methods and Materials for Additive Manufacturing: A Critical Review on Advancements and Challenges. Thin-Walled Struct. 2021, 159, 107228. [Google Scholar] [CrossRef]
- Wang, X.; Xu, S.; Zhou, S.; Xu, W.; Leary, M.; Choong, P.; Qian, M.; Brandt, M.; Xie, Y.M. Topological Design and Additive Manufacturing of Porous Metals for Bone Scaffolds and Orthopaedic Implants: A Review. Biomaterials 2016, 83, 127–141. [Google Scholar] [CrossRef] [PubMed]
- Zhang, W.-N.; Wang, L.-Z.; Feng, Z.-X.; Chen, Y.-M. Research Progress on Selective Laser Melting (SLM) of Magnesium Alloys: A Review. Optik 2020, 207, 163842. [Google Scholar] [CrossRef]
- Staiger, M.P.; Pietak, A.M.; Huadmai, J.; Dias, G. Magnesium and Its Alloys as Orthopedic Biomaterials: A Review. Biomaterials 2006, 27, 1728–1734. [Google Scholar] [CrossRef] [PubMed]
- Kulekci, M.K. Magnesium and its alloys applications in automotive industry. Int. J. Adv. Manuf. Technol. 2008, 39, 851–865. [Google Scholar] [CrossRef]
- Bai, J.; Yang, Y.; Wen, C.; Chen, J.; Zhou, G.; Jiang, B.; Peng, X.; Pan, F. Applications of Magnesium Alloys for Aerospace: A Review. J. Magnes. Alloys 2023, 11, 3609–3619. [Google Scholar] [CrossRef]
- Zhu, L.; Li, N.; Childs, P.R.N. Light-Weighting in Aerospace Component and System Design. Propuls. Power Res. 2018, 7, 103–119. [Google Scholar] [CrossRef]
- Budholiya, S.; Bhat, A.; Raj, S.A.; Sultan, M.T.H.; Shah, A.U.M.; Basri, A.A. State of the Art Review about Bio-Inspired Design and Applications: An Aerospace Perspective. Appl. Sci. 2021, 11, 5054. [Google Scholar] [CrossRef]
- Ge, S.; Wang, Y.; Tian, J.; Lei, D.; Yu, Q.; Wang, G. An in Vitro Study on the Biocompatibility of WE Magnesium Alloys. J. Biomed. Mater. Res. Part B Appl. Biomater. 2016, 104, 482–487. [Google Scholar] [CrossRef]
- Li, Y.; Zhou, J.; Pavanram, P.; Leeflang, M.A.; Fockaert, L.I.; Pouran, B.; Tümer, N.; Schröder, K.U.; Mol, J.M.C.; Weinans, H.; et al. Additively Manufactured Biodegradable Porous Magnesium. Acta Biomater. 2018, 67, 378–392. [Google Scholar] [CrossRef]
- Levorova, J.; Duskova, J.; Drahos, M.; Vrbova, R.; Vojtech, D.; Kubasek, J.; Bartos, M.; Dugova, L.; Ulmann, D.; Foltan, R. In Vivo Study on Biodegradable Magnesium Alloys: Bone Healing around WE43 Screws. J. Biomater. Appl. 2018, 32, 886–895. [Google Scholar] [CrossRef]
- Aboulkhair, N.T.; Everitt, N.M.; Ashcroft, I.; Tuck, C. Reducing Porosity in AlSi10Mg Parts Processed by Selective Laser Melting. Addit. Manuf. 2014, 1–4, 77–86. [Google Scholar] [CrossRef]
- Galy, C.; Le Guen, E.; Lacoste, E.; Arvieu, C. Main Defects Observed in Aluminum Alloy Parts Produced by SLM: From Causes to Consequences. Addit. Manuf. 2018, 22, 165–175. [Google Scholar] [CrossRef]
- Dong, Z.; Zhang, X.; Shi, W.; Zhou, H.; Lei, H.; Liang, J. Study of Size Effect on Microstructure and Mechanical Properties of AlSi10Mg Samples Made by Selective Laser Melting. Materials 2018, 11, 2463. [Google Scholar] [CrossRef]
- Delroisse, P.; Jacques, P.J.; Maire, E.; Rigo, O.; Simar, A. Effect of Strut Orientation on the Microstructure Heterogeneities in AlSi10Mg Lattices Processed by Selective Laser Melting. Scr. Mater. 2017, 141, 32–35. [Google Scholar] [CrossRef]
- Qiu, C.; Yue, S.; Adkins, N.J.E.; Ward, M.; Hassanin, H.; Lee, P.D.; Withers, P.J.; Attallah, M.M. Influence of Processing Conditions on Strut Structure and Compressive Properties of Cellular Lattice Structures Fabricated by Selective Laser Melting. Mater. Sci. Eng. A 2015, 628, 188–197. [Google Scholar] [CrossRef]
- Han, X.; Zhu, H.; Nie, X.; Wang, G.; Zeng, X. Investigation on Selective Laser Melting AlSi10Mg Cellular Lattice Strut: Molten Pool Morphology, Surface Roughness and Dimensional Accuracy. Materials 2018, 11, 392. [Google Scholar] [CrossRef]
- Vrána, R.; Koutný, D.; Paloušek, D.; Pantělejev, L.; Jaroš, J.; Zikmund, T.; Kaiser, J. Selective Laser Melting Strategy for Fabrication of Thin Struts Usable in Lattice Structures. Materials 2018, 11, 1763. [Google Scholar] [CrossRef] [PubMed]
- Vrána, R.; Jaroš, J.; Koutný, D.; Nosek, J.; Zikmund, T.; Kaiser, J.; Paloušek, D. Contour Laser Strategy and Its Benefits for Lattice Structure Manufacturing by Selective Laser Melting Technology. J. Manuf. Process. 2022, 74, 640–657. [Google Scholar] [CrossRef]
- Pawlak, A.; Rosienkiewicz, M.; Chlebus, E. Design of Experiments Approach in AZ31 Powder Selective Laser Melting Process Optimization. Arch. Civ. Mech. Eng. 2017, 17, 9–18. [Google Scholar] [CrossRef]
- Wei, K.; Gao, M.; Wang, Z.; Zeng, X. Effect of Energy Input on Formability, Microstructure and Mechanical Properties of Selective Laser Melted AZ91D Magnesium Alloy. Mater. Sci. Eng. A 2014, 611, 212–222. [Google Scholar] [CrossRef]
- Wei, K.; Wang, Z.; Zeng, X. Influence of Element Vaporization on Formability, Composition, Microstructure, and Mechanical Performance of the Selective Laser Melted Mg–Zn–Zr Components. Mater. Lett. 2015, 156, 187–190. [Google Scholar] [CrossRef]
- Chen, H.; Zhang, Y.; Giam, A.; Yan, W. Experimental and Computational Study on Thermal and Fluid Behaviours of Powder Layer during Selective Laser Melting Additive Manufacturing. Addit. Manuf. 2022, 52, 102645. [Google Scholar] [CrossRef]
- Song, B.; Dong, S.; Deng, S.; Liao, H.; Coddet, C. Microstructure and Tensile Properties of Iron Parts Fabricated by Selective Laser Melting. Opt. Laser Technol. 2014, 56, 451–460. [Google Scholar] [CrossRef]
- Attar, H.; Calin, M.; Zhang, L.C.; Scudino, S.; Eckert, J. Manufacture by Selective Laser Melting and Mechanical Behavior of Commercially Pure Titanium. Mater. Sci. Eng. A 2014, 593, 170–177. [Google Scholar] [CrossRef]
- Attar, H.; Bönisch, M.; Calin, M.; Zhang, L.-C.; Scudino, S.; Eckert, J. Selective Laser Melting of in Situ Titanium–Titanium Boride Composites: Processing, Microstructure and Mechanical Properties. Acta Mater. 2014, 76, 13–22. [Google Scholar] [CrossRef]
- Hyer, H.; Zhou, L.; Benson, G.; McWilliams, B.; Cho, K.; Sohn, Y. Additive Manufacturing of Dense WE43 Mg Alloy by Laser Powder Bed Fusion. Addit. Manuf. 2020, 33, 101123. [Google Scholar] [CrossRef]
- Pauly, S.; Schricker, C.; Scudino, S.; Deng, L.; Kühn, U. Processing a Glass-Forming Zr-Based Alloy by Selective Laser Melting. Mater. Des. 2017, 135, 133–141. [Google Scholar] [CrossRef]
- Kempen, K.; Thijs, L.; Van Humbeeck, J.; Kruth, J.-P. Mechanical Properties of AlSi10Mg Produced by Selective Laser Melting. Phys. Procedia 2012, 39, 439–446. [Google Scholar] [CrossRef]
- Krištofová, P.; Roudnická, M.; Kubásek, J.; Paloušek, D.; Suchý, J.; Vojtěch, D. Influence of Production Parameters on the Properties of 3D Printed Magnesium Alloy Mg-4Y-3RE-Zr (WE43). Manuf. Technol. 2019, 19, 613–618. [Google Scholar] [CrossRef]
- Tammas-Williams, S.; Zhao, H.; Léonard, F.; Derguti, F.; Todd, I.; Prangnell, P.B. XCT Analysis of the Influence of Melt Strategies on Defect Population in Ti–6Al–4V Components Manufactured by Selective Electron Beam Melting. Mater. Charact. 2015, 102, 47–61. [Google Scholar] [CrossRef]
- Abele, E.; Stoffregen, H.A.; Kniepkamp, M.; Lang, S.; Hampe, M. Selective Laser Melting for Manufacturing of Thin-Walled Porous Elements. J. Mater. Process. Technol. 2015, 215, 114–122. [Google Scholar] [CrossRef]
- King, W.E.; Barth, H.D.; Castillo, V.M.; Gallegos, G.F.; Gibbs, J.W.; Hahn, D.E.; Kamath, C.; Rubenchik, A.M. Observation of Keyhole-Mode Laser Melting in Laser Powder-Bed Fusion Additive Manufacturing. J. Mater. Process. Technol. 2014, 214, 2915–2925. [Google Scholar] [CrossRef]
- Zhang, C.; Liao, Q.; Zhang, X.; Ma, F.; Wu, M.; Xu, Q. Characterization of Porosity in Lack of Fusion Pores in Selective Laser Melting Using the Wavefunction. Mater. Res. Express 2023, 10, 016501. [Google Scholar] [CrossRef]
- Véle, F.; Ackermann, M.; Bittner, V.; Šafka, J. Influence of Selective Laser Melting Technology Process Parameters on Porosity and Hardness of Aisi H13 Tool Steel: Statistical Approach. Materials 2021, 14, 6052. [Google Scholar] [CrossRef] [PubMed]
- Metel, A.S.; Stebulyanin, M.M.; Fedorov, S.V.; Okunkova, A.A. Power Density Distribution for Laser Additive Manufacturing (SLM): Potential, Fundamentals and Advanced Applications. Technologies 2018, 7, 5. [Google Scholar] [CrossRef]
- Nudelis, N.; Mayr, P. A Novel Classification Method for Pores in Laser Powder Bed Fusion. Metals 2021, 11, 1912. [Google Scholar] [CrossRef]
- Vrána, R.; Koutecký, T.; Červinek, O.; Zikmund, T.; Pantělejev, L.; Kaiser, J.; Koutný, D. Deviations of the SLM Produced Lattice Structures and Their Influence on Mechanical Properties. Materials 2022, 15, 3144. [Google Scholar] [CrossRef]


| Mg (wt %) | Y (wt %) | Zr (wt %) | Nd (wt %) | Si (wt %) | Cu (wt %) | |
|---|---|---|---|---|---|---|
| WE43 powder | Bal. | 3.96 | 0.56 | 2.30 | <0.01 | <0.01 |
| LP (W) | 250 | 50 | 150 | 221 | 79 | 79 | |
| LS (mm/s) | 600 | 600 | 600 | 883 | 883 | 317 | |
| AE (J/mm2) | 3.99 | 1.34 | 3.26 | 2.88 | 1.57 | 2.46 | |
| OL (%) | 71 | 41 | 67 | 76 | 78 | 69 | |
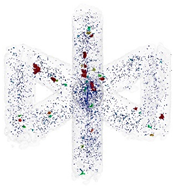
| Vertical struts |  |  | 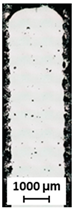 | Inclined struts |  | 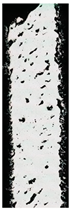 |  |
| RD (%) | 97.9 | 86.7 | 99.2 | 97.9 | 95.9 | 99.2 |
| LP (W) | 79 | 79 | 79 | 150 | ||||
| LS (mm/s) | 883 | 317 | 317 | 600 | ||||
| AE (J/mm2) | 1.46 | 1.15 | 2.41 | 1.62 | 2.12 | 1.64 | 3.69 | 2.38 |
| D (mm) | 0.5 | 1 | 2 | 3 | ||||
| OL (%) | 75 | 75 | 64 | 58 | 54 | 54 | 69 | 64 |
| Orient. | V | IN | V | IN | V | IN | V | IN |
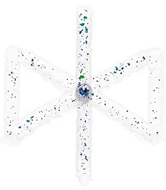
 |  |  |  |  |  |  |  | |
| RD (%) | 99.4 | 99.3 | 99.6 | 99.5 | 99.4 | 99.2 | 99.6 | 99.3 |
| D (mm) | 0.5 | 1 | 2 | 3 |
 |  |  | 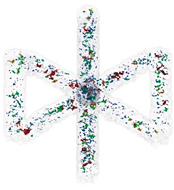 |  |
| RD (%) | 99.96 | 99.83 | 99.32 | 99.72 |
Disclaimer/Publisher’s Note: The statements, opinions and data contained in all publications are solely those of the individual author(s) and contributor(s) and not of MDPI and/or the editor(s). MDPI and/or the editor(s) disclaim responsibility for any injury to people or property resulting from any ideas, methods, instructions or products referred to in the content. |
© 2024 by the authors. Licensee MDPI, Basel, Switzerland. This article is an open access article distributed under the terms and conditions of the Creative Commons Attribution (CC BY) license (https://creativecommons.org/licenses/by/4.0/).
Share and Cite
Jaroš, J.; Vaverka, O.; Senck, S.; Koutný, D. Influence of Process Energy on the Formation of Imperfections in Body-Centered Cubic Cells with Struts in the Vertical Orientation Produced by Laser Powder Bed Fusion from the Magnesium Alloy WE43. Micromachines 2024, 15, 278. https://doi.org/10.3390/mi15020278
Jaroš J, Vaverka O, Senck S, Koutný D. Influence of Process Energy on the Formation of Imperfections in Body-Centered Cubic Cells with Struts in the Vertical Orientation Produced by Laser Powder Bed Fusion from the Magnesium Alloy WE43. Micromachines. 2024; 15(2):278. https://doi.org/10.3390/mi15020278
Chicago/Turabian StyleJaroš, Jan, Ondřej Vaverka, Sascha Senck, and Daniel Koutný. 2024. "Influence of Process Energy on the Formation of Imperfections in Body-Centered Cubic Cells with Struts in the Vertical Orientation Produced by Laser Powder Bed Fusion from the Magnesium Alloy WE43" Micromachines 15, no. 2: 278. https://doi.org/10.3390/mi15020278
APA StyleJaroš, J., Vaverka, O., Senck, S., & Koutný, D. (2024). Influence of Process Energy on the Formation of Imperfections in Body-Centered Cubic Cells with Struts in the Vertical Orientation Produced by Laser Powder Bed Fusion from the Magnesium Alloy WE43. Micromachines, 15(2), 278. https://doi.org/10.3390/mi15020278