Article

Highly Reliable Multicomponent MEMS Sensor for Predictive Maintenance Management of Rolling Bearings

1
Department of Information Engineering and Mathematical Sciences, University of Siena, 53100 Siena, Italy
2
Division of Applied Metrology and Engineering INRiM, National Institute of Metrological Research, 10135 Turin, Italy
3
Department of Mechanical and Aerospace Engineering, Politecnico di Torino, 10129 Turin, Italy
*
Author to whom correspondence should be addressed.
Micromachines 2023, 14(2), 376; https://doi.org/10.3390/mi14020376
Submission received: 22 December 2022 / Revised: 20 January 2023 / Accepted: 27 January 2023 / Published: 2 February 2023
(This article belongs to the Special Issue MEMS Accelerometers: Design, Applications and Characterization)

Abstract

:
In the field of vibration monitoring and control, the use of low-cost multicomponent MEMS-based accelerometer sensors is nowadays increasingly widespread. Such sensors allow implementing lightweight monitoring systems with low management costs, low power consumption and a small size. However, for the monitoring systems to provide trustworthy and meaningful data, the high accuracy and reliability of sensors are essential requirements. Consequently, a metrological approach to the calibration of multi-component accelerometer sensors, including appropriate uncertainty evaluations, are necessary to guarantee traceability and reliability in the frequency domain of data provided, which nowadays is not fully available. In addition, recently developed metrological characterizations at the microscale level allow to provide detailed and accurate quantification of the enhanced technical performance and the responsiveness of these sensors. In this paper, a dynamic calibration procedure is applied to provide the sensitivity parameters of a low-cost, multicomponent MEMS sensor accelerometer prototype (MDUT), designed, developed and realized at the University of Siena, conceived for rolling bearings vibration monitoring in a broad frequency domain (from 10 Hz up to 25 kHz). The calibration and the metrological characterization of the MDUT are carried out by comparison to a reference standard transducer, at the Primary Vibration Laboratory of the National Institute of Metrological Research (INRiM).

1. Introduction

Nowadays, the management of monitoring and control for early fault diagnosis in equipment and industrial production processes is enormously enhanced, mainly thanks to the development of Machine Learning (ML) [1,2,3], Deep Learning (DL) [4,5] and Artificial Intelligence (AI) [6,7]. The possibility to manage huge data flows, in real time, from extensive sensors and multi-sensors networks [8], allows for monitoring the proper functioning of systems and sub-systems in detail [9,10], early identification of possible malfunctions [11], precisely localizing failures and planning proper decision making for targeted and timely intervention actions [12]. As highlighted in the cited review articles, high data quality is the premise and foundation of any functional and accurate monitoring process, in order to achieve the goal of the ‘Zero Defect Manufacturing paradigm’ [13].
The modernization and automation of the manufacturing industry involves the use of increasingly complex, interdependent (often interconnected), precise and fast mechanical equipment. The onset of a defect [14], if not properly identified [15], can cause cascading component failures [16], causing economic damage [17], financial losses [18] and industry downtime [19]. However, for the evolved ML and DL algorithms to provide reliable and trustworthy information on the monitored process, data provided by interconnected sensors must be truly accurate and traceable. Indeed, if data provided are incorrect or affected by uncontrolled bias or unknown errors, the learning system can store and return false or improper information. This, in turn, can generate a cascading effect of errors and therefore an inaccurate and unreliable diagnosis of the process to be monitored.
Metrological characterizations and suitable calibration procedures of sensors used in the monitoring networks are needed to guarantee the reliability of the measurements [20], providing high quality [21] and trustworthy information [22], ensuring a learning process based on reliable and accurate data [23]; moreover, in the case of sensor substitution, the calibration of data would allow to maintain the metrological traceability from sensor-to-sensor, ensuring the continuity of data-flow trustworthiness. Nevertheless, at present, suitable metrological calibration methods (traceable to the SI, International Systems of Units, and supported by detailed uncertainty budgets), can be applied only to ‘measuring instruments’, but not to ‘MEMS-based sensors’, since standard procedures are unavailable, and thus proper sensitivity parameters cannot be accurately identified. This lack, which prevents a functional and safe development of the latest generation monitoring systems, can be filled by the recent progresses in metrological research applied to micro mechanical systems and components [24]. This issue has been properly addressed by the Consultative Committee for Acoustic, Ultrasound and Vibration (CCAUV) of the Bureau International des Poids et Measures (BIPM), since «the deployment of such systems need to be underpinned by new metrology to support reliable and safe operation» of these technologies [25].
In this work, a tailored calibration procedure is developed and applied to provide traceability in the frequency domain (from 10 Hz up to 25 kHz) to a robust, lightweight, low-cost and low-power consuming multicomponent MEMS accelerometer sensor (MDUT), conceived for vibration monitoring of rolling-bearings. The MDUT is built by orthogonally embedding three separated uniaxial analogue sensing elements in a resin cube. The sensing elements are commercially available, low-noise, high frequency, uniaxial MEMS accelerometers, provided by Analog Devices Inc. (ADXL1005Z) [26]. The sensing elements independently detect the vibrations along three orthogonal axes, without cross-talk effects and transverse overlap. Although the manufacturer provided a calibration statement for individual ADXL1005Z MEMS sensor accelerometers, no information about traceability and related uncertainties is made available. In the following, the calibration of the whole assembled MDUT (realized by embedment of three sensing elements) is performed, in order to identify the main sensitivities and the transverse sensitivities along the three axes and the related uncertainties. Once the MDUT was opportunely calibrated, according to metrological standard procedures, the information provided of the dynamic phenomena under investigation is expected to be reliable and accurate enough to be managed, processed and returned by DL and AI systems, with the due trustworthiness.

2. Vibration-Based Rolling Bearings Fault Diagnosis: A Brief Survey

Since 1934, when the classic book by J. P. Den Hartog “Mechanical Vibrations” was first published [27], a very huge scientific and technical literature has amassed about rolling bearings fault diagnosis and functional monitoring in mechanical industry and manufacturing (namely, about 60,000 papers, according to the public Google Scholar database). In particular, during the last decades up to present day, thanks to the development of computational capabilities (e.g., ML, DL, AI and neural networks) and to the miniaturization of sensors and measuring systems (e.g., MEMS and NEMS), the management of early fault diagnosis, functioning monitoring, anomaly detection, as well as overall quality control procedures, has been greatly enhanced, with perspectives of further improvements in the near future.
In very general terms, applied procedures and methods for monitoring and early fault diagnosis of rolling bearings and related industrial processes are mainly supported by time–frequency–amplitude analysis of occurring vibrations [28,29,30,31], occasionally integrated with information on temperature fluctuations [32,33], noise levels [34,35] and other degradative harsh working environmental conditions affecting the functionality [36,37,38,39].
Rolling bearings are composed of four basic elements: the outer ring/race, the inner ring/race, a cage/train (to reduce friction and wear) and balls (or cylindrical rollers, spherical rollers, tapered rollers and needle rollers). Rolling-element bearings can range from ten millimeters to a few meters in diameter, with a load-carrying capacity from a few tens of grams to many thousands of tons. In Figure 1 a schematic picture of a typical rolling bearing and related elements and geometry are shown.
Once the geometrical parameters and shape of the rolling bearing elements, the number of rotating balls/rollers (Nk) and the applied rotation velocity (RPM) are known, it is possible to univocally define the characteristic frequencies of the cage rotation (FTF), the ball passing at a given point of the inner race/ring (BPFI), the ball passing at a given point of the outer race/ring (BPFO) and the ball/roller spin (BSF), on the basis of simple formulae. Obviously, these formulae hold if no slips occur between the bearing elements. If a fault occurs, it can be related to the presence of a defect in one of the elements forming the rolling bearing, i.e., the inner ring/race, the outer ring/race or one ball. The rotation of the elements causes periodic impacts of the defect with the other elements, which in turn generate transient vibrations of the bearing components. Therefore, the vibrational signals can be seen as signatures of the different types of faults as it is a train of vibration transients with fundamental frequencies and spectral characteristics related to the location of the fault. In Figure 2, on the left, typical fault signatures are shown and correlated to the characteristic rotation frequencies of the elements of a rolling bearing (reported and defined in the figure). In the same figure, on the right, a vibration signal generated by a double fault (inner race and outer race) is plotted both in frequency (upper plot) and in the time domain (lower plot).
As shown in Figure 2, the characteristic rotation frequency values can be considered as a well-defined signature of the faulty element and can be clearly identified and monitored; any variation occurring in returned spectra, in terms of onset of harmonics, amplitude, width of peaks, clipping, as well as many other time–frequency–amplitude descriptors, are indications of incoming failures. In particular, frequency domain analysis of the signal or of the preprocessed signal (typically envelope extraction) involves extraction of features that can be found in a particular frequency band, allowing to identify localized or distributed bearing defects by means of spectrum analysis. Time domain analysis allows detecting defects and assessing their related magnitude by means of several statistical indicators, such as the peaks, peak-to-peak, energy content (Root Mean Square—RMS), the crest factor (CF), kurtosis (KU), skewness or the energy index (EI). In addition, combined time–frequency domain analysis allows capturing the progressive changes in spectrum components of the vibration signals in both frequency and time [40,41,42,43]. More recently, these classical methods have been replaced or reinforced by AI or ML techniques, used to identify defects and cope with noise or reduced measurement system bandwidth.
The earliest detectable indications of rolling bearings malfunctioning appear at very high frequencies, also beyond 20 kHz. At this early stage of deterioration, microscopic cracks appear, creating elastic waves with very low energy content. Once the deterioration progresses, the level of high frequency “noise” increases and the intensity of the impact forces excitation of the natural frequencies of the various bearing components; typically, depending on the rolling bearings dimensions and mounting, the natural frequencies range between 2 kHz and 6 kHz. When degradation increases, some sidebands above and below natural frequency resonances appear. After these early signals, the process of deterioration of the rolling bearings moves towards an irreversible damage and total failure. During this process, the clearances within the bearing increase substantially, and as a result, the overall vibration velocity amplitudes noticeably increase, the discrete bearing defect frequencies disappear and random vibrations appear in the form of a background noise. At this stage, total catastrophic failure of the machine can occur at any time. In Figure 3, an explicative summary of a typical spectrum of incoming failure in rolling bearings is shown.
In depth and accurate amplitude–time–frequency analysis of the rolling bearings signatures allows to properly identify the process of deterioration of the elements and the location and the typology of defects. Nevertheless, the accuracy of the analysis strongly depends on the quality of occurring vibrations measured quantities. The accuracy and the reliability of the sensors thus plays a crucial role in order to provide trustworthy information to be processed by the ML algorithms, as well as other computational processes.

3. Materials and Method

3.1. The MDUT and Embedded Sensing Elements

The MDUT is a multicomponent MEMS accelerometer sensor, realized at the University of Siena. Three individual sensing elements are orthogonally embedded in an epoxy resin cube. The MDUT is designed to be not very pervasive in terms of mass and size (it is a 30 g cube with sides of 2.5 cm). The sensing elements embedded in the MDUT are low-noise, high frequency uniaxial MEMS accelerometers, provided by Analog Device Inc. (Analog Devices, Norwood, London, England, MA, ADXL 1005Z), as shown in Figure 4.
The sensing element (ADXL 1005Z), according to the manufacturer’s information, has a frequency response from 0 Hz (DC) to 23 kHz (3dB frequency), with a resonant frequency at 42 kHz. The linearity is within ±0.1% of the full-scale range, with a cross axis sensitivity of ±1% along the perpendicular axes. The low-noise density is 30 µg/√Hz, it has a low-power consumption (current adsorption is 1.0 mA with 5 V power supply) and the single-supply operation is from 3.3 V to 5.25 V. The three sensing elements are installed on three specific demo boards, mounted by orienting the sensing axes orthogonally. The boards were initially fixed together with cyanoacrylate glue then they were coated with commercial epoxy resin.

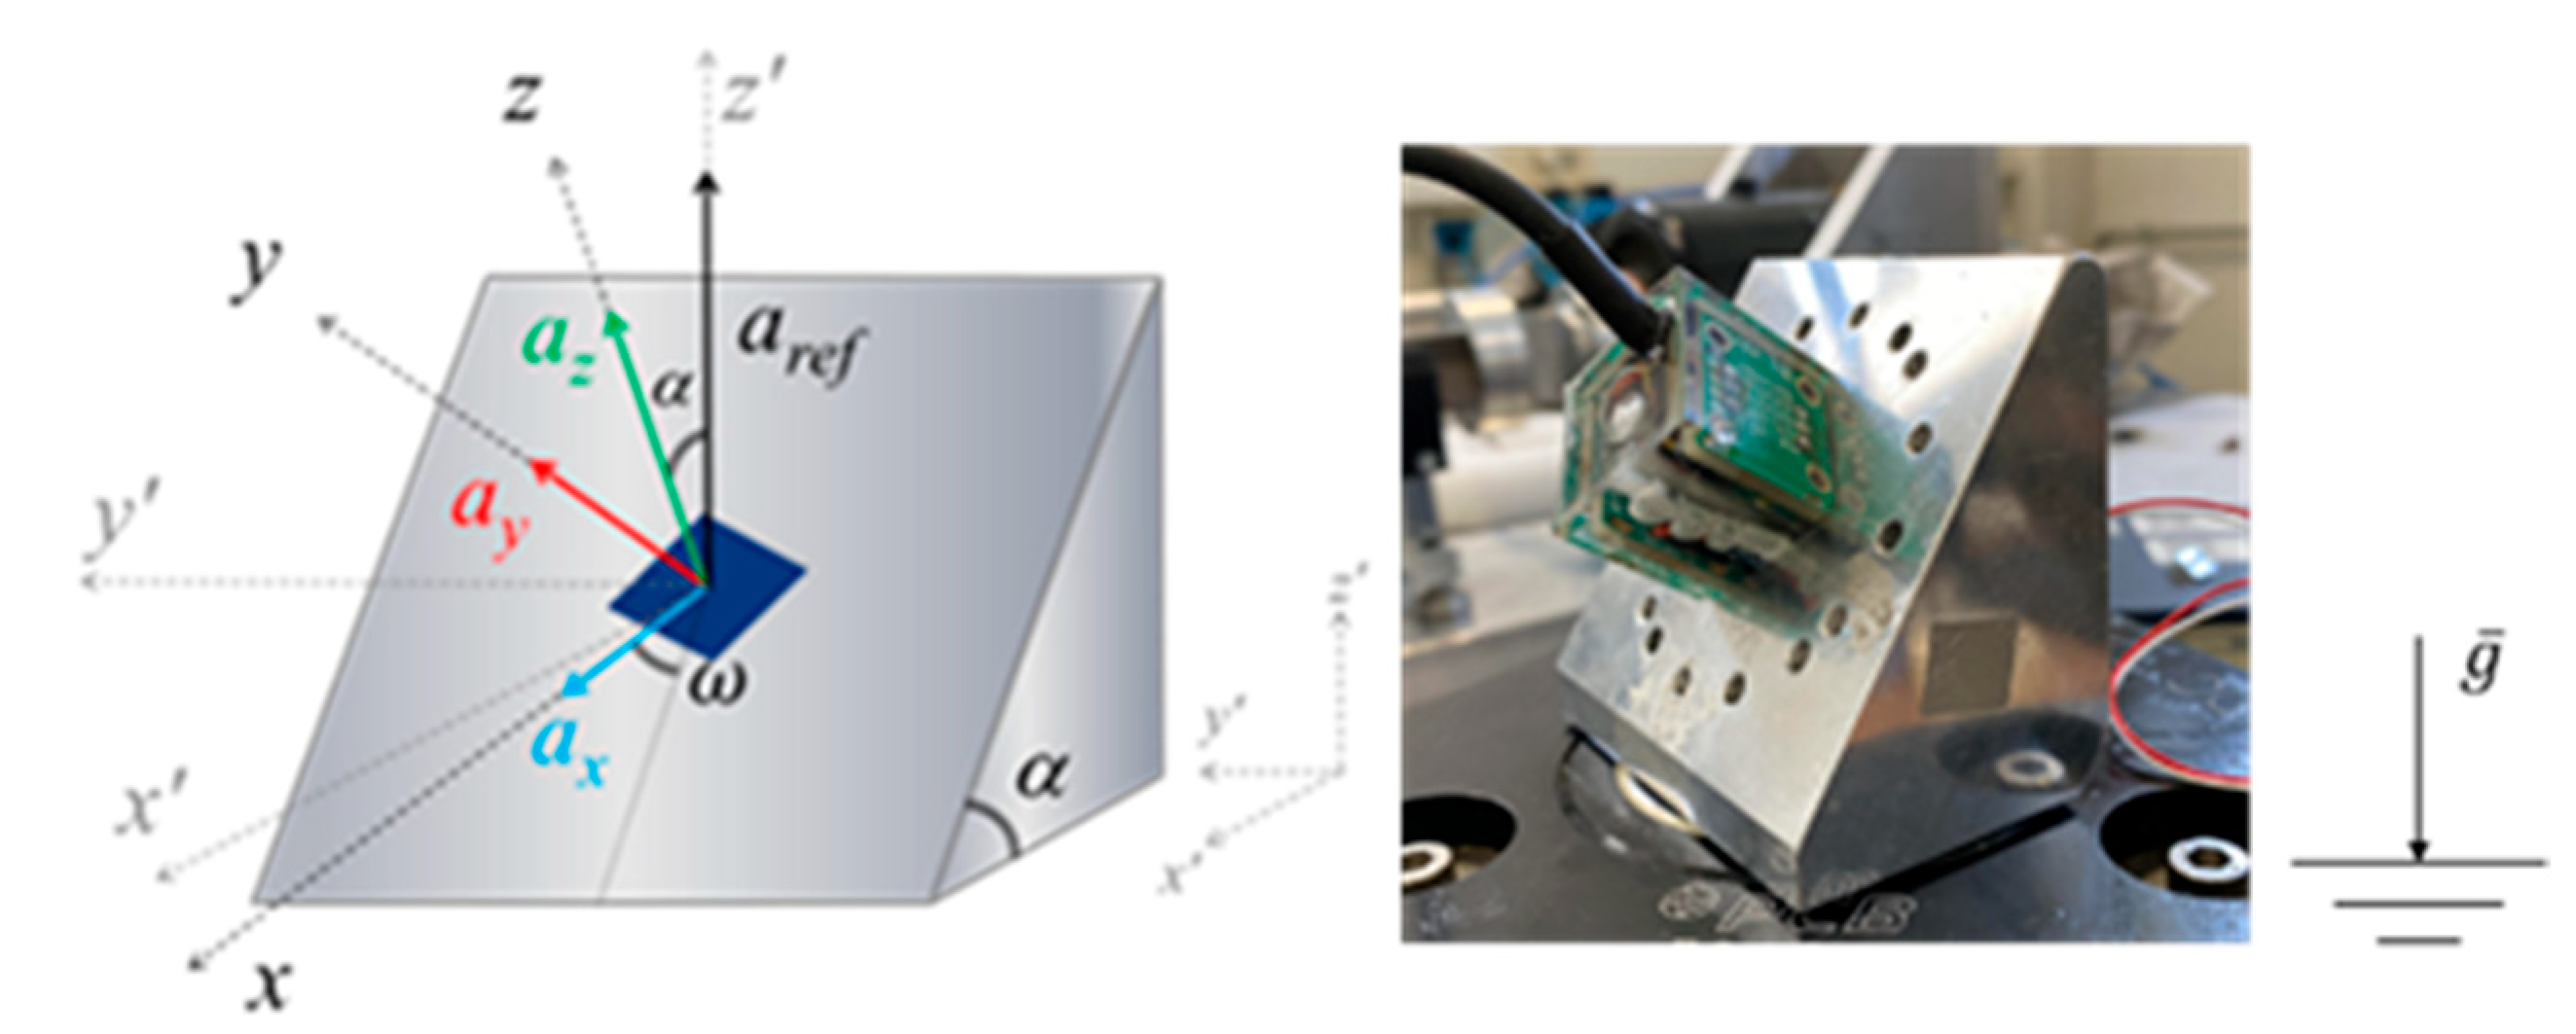
3.2. Calibration Procedures

As a first step, the sensing element ADXL 1005Z was individually calibrated to evaluate the intrinsic responsiveness as a function of deterministic mechanical vibrations. Calibration was carried out by gluing (Loctite®) the sensing element on a hexagonal prism mass and the assembly was screwed on a vertical instrumented vibrating table (PCB Piezotronics, Depew, NY, USA), as shown in Figure 5.
The instrumented vibration table was equipped with a single axis reference transducer (PCB Piezotronics, Depew, the United States, NY model 080A199/482A23), calibrated according to ISO 16063-11:1999 [44] against INRiM primary standard and integrated within the stroke of the shaker, allowing to measure the reference acceleration along the vertical axis, aref (parallel to g). The calibration of the individual sensing element was carried out according to ISO 16063-21:2003 [45]. The reference acceleration was acquired by an acquisition board NI 4431 (National Instruments, Austin, TX, USA) with a sampling rate of 50 kHz, fed to the PC and processed through LabVIEW® 22 software to provide the RMS reference value in ms−2. Actually, the calibration of the individual sensing element, by using the set-up shown in Figure 5, was affected by some systematic errors induced by the vibrational modes of the hexagonal prism mass, and by the small (but not negligible) damping of the glue. The errors depend on both frequency and amplitude and cannot be experimentally evaluated with this calibration setup; thus, it needs to be considered in the evaluation of the overall uncertainty [46,47,48].
Once the sensitivity of the individual sensing element was known, the calibration of the MDUT, embedded in resin, was carried out. Calibration was performed by screwing the MDUT directly onto the vibrating instrumented table, as shown in Figure 6. The aim of the investigation was to characterize the possible effects on the sensing elements response due to the embedding resin and to quantify the occurring transverse accelerations in the horizontal direction.

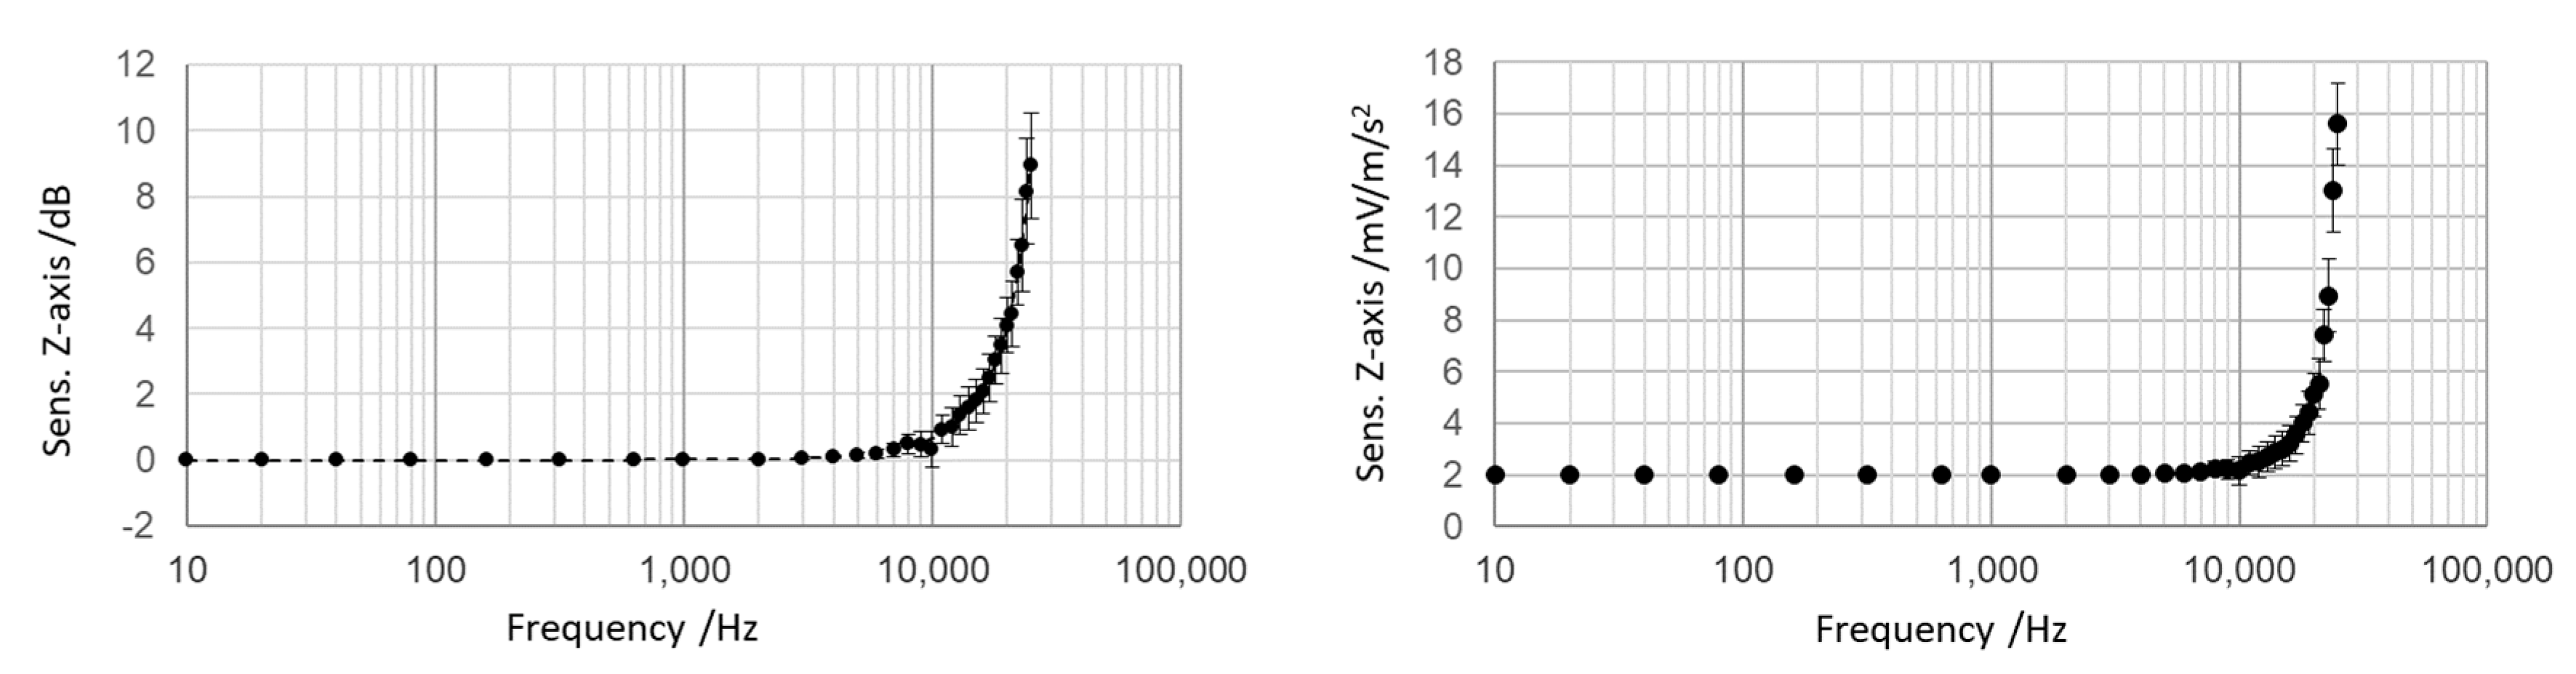
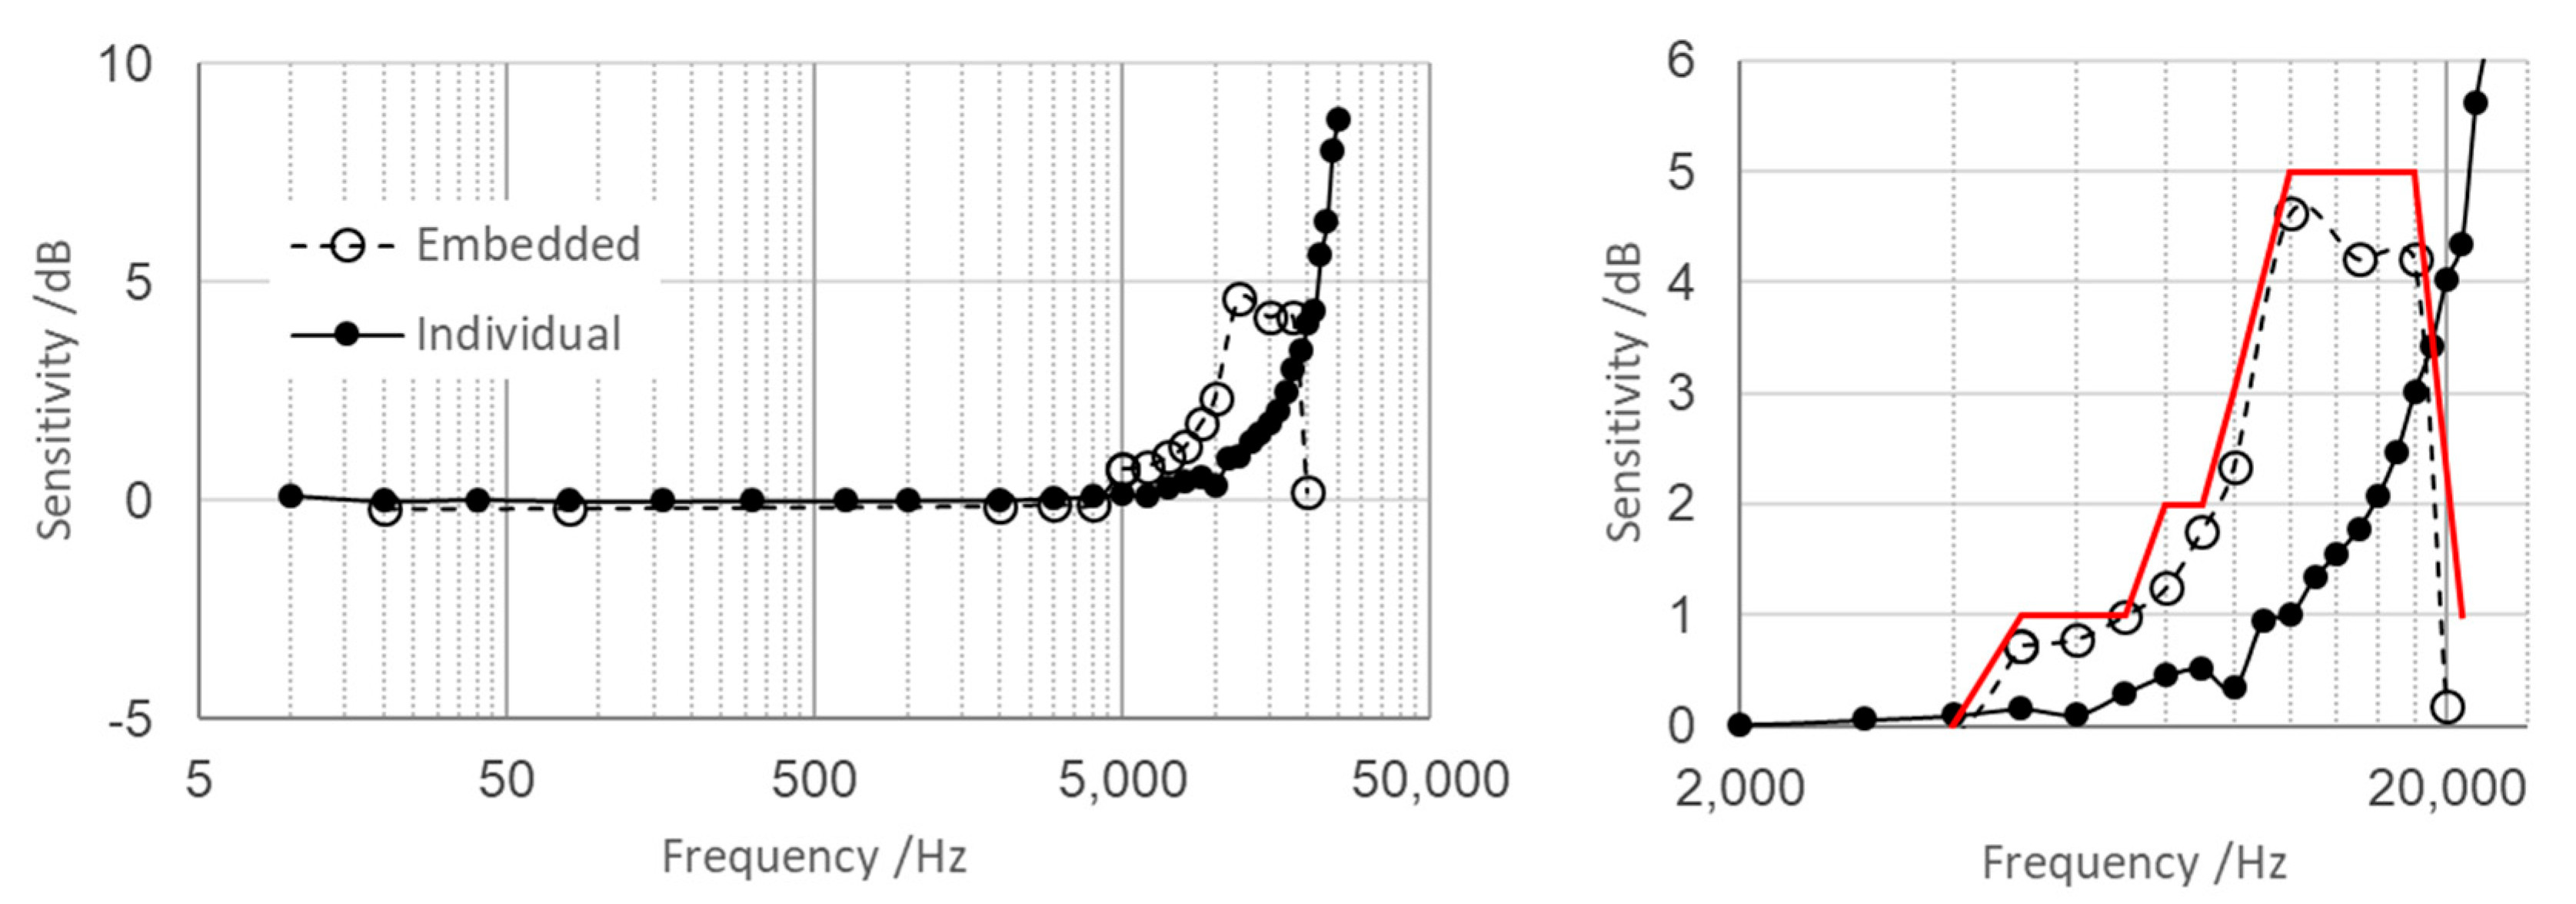
3.3. Calibration Results

Calibration was carried out from 10 Hz up to 25 kHz and the sensitivity values were determined with different values of power supply, namely 3.5 V, 4 V, 4.5 V and 5 V. Since the standard deviation of calibration at different values of power supply was negligible (<1%), the overall average values were considered representative of the actual sensitivity of the individual sensing element under investigation. In the graphs in Figure 7, the sensitivity of the individual sensing element ADXL 1005Z with associated uncertainties is shown. Data expressed in dB are referred to as the sensitivity at 10 Hz, which is 2.004 mV/(ms−2).
Sensitivity values were determined with the calibration set-up shown in Figure 5. By applying this procedure, it could be seen that the 10% accuracy bandwidth is 12 kHz. The effect of the intrinsic resonance (at 47 kHz, according to the manufacturer’s information) amplifies the sensitivity of 3 dB to 18 kHz (slightly lower than the typical value provided by the manufacturer’s specifications) and 6 dB to 21.5 kHz.
The sensitivity of the vertical single axis of the MDUT was then determined by screwing the resin case onto the instrumented vibrating table. Calibration was performed according to the set-up shown in Figure 6, from 10 Hz up to 25 kHz, and the sensitivity values were compared with the sensitivity of the individual sensing element not embedded in resin. Figure 8 shows a comparison of the calibration experimental results in the whole tested frequency range in the left-hand plot, and in detail between 2 kHz and 25 kHz in the right-hand plot.
As observed, the effects due to the resin of the embedding case affect the amplitude of the frequency response of the sensing element with respect to the individual calibrated sensor. In particular, the embedding case acts as a “damper” (or mechanical low-pass filter) by smoothing the intrinsic resonance peak. The amplification due to the intrinsic resonance of the embedded sensing element was limited to 2 dB up to 10 kHz, and increased to 5 dB at 20 kHz. Beyond 21.5 kHz, the external vibrations were fully dampened. Once the amplification was quantified, a proper correction factor can be applied, e.g., between 5 kHz and 20 kHz, allowing to provide accurate measurements of the vibration amplitude in the typical frequency range of bearing resonance frequencies, with the related onset of sidebands near the resonance and the onset of random vibration noise, as shown in Figure 3.
The following graph in Figure 9 shows the measured relative transverse sensitivities on the horizontal plane (along the x and y directions) by the sensing elements embedded perpendicularly with respect to the vertical direction (z) of the applied dynamic acceleration. The transverse sensitivities can be considered negligible up to 14 kHz, where the amplitudes values are in general below −6 dB and around −3 dB up to 25 kHz.

3.4. Metrological Characterization

The main sensitivities along the three axes were also evaluated in order to define the actual responsiveness of the MDUT in dynamic conditions. Once the sensitivity of the vertical axis of the individual sensing elements embedded in the resin was known, the MDUT was mounted on an inclined plane screwed on to the vibrating table. This experimental set-up allowed to generate a projection of the vertical reference acceleration, aref, along the three axes simultaneously. In this application, a specific system suitable for the simultaneous amplitude calibration of multicomponent MEMS sensors was used. The calibration method and the experimental set-up, shown in Figure 10, have been described in detail in [49,50].
By means of simple geometrical laws, it is possible to define the expected acceleration along the three main axes as follows:
a x = a r e f sin α cos ω a y = a r e f sin α sin ω a z = a r e f cos α ,
where α is the tilt angle (α = 55° ± 0.1°) and ω is the rotation angle (ω = 45° ± 0.1°).
A nearly constant peak amplitude of 1 m/s2 was applied between 100 Hz and 1 kHz and the corresponding experimental sensitivities were determined according to the inclination and rotation angles. Any difference observed between the experimental values of acceleration along the three axes and the expected values of acceleration, from Equation (1), were dependent on both the possible differences in individual sensitivities of the embedded sensors and on possible misalignment due to the gluing and embedding of the sensing elements in the resin cube. Once these differences were known it was possible to definitively adjust the sensitivities of the MDUT.
As shown in Figure 11, by measuring the occurring accelerations along the three axes of the MDUT on the inclined plane during calibration, and by calculating the difference between the expected acceleration (from Equation (1)) and the measured ones, the possible misalignment among the three sensitivity axes, as well as the possible differences in the proper sensitivities of the sensing elements orthogonally glued and embedded in the resin cube, were quantified. These differences can be considered as systematic effects to be adjusted.
As is possible to notice, very small differences were observed between measured and expected values of MDUT sensitivities. This means that systematic effects due to possible misalignments among sensing elements and differences among the proper sensitivities were negligible, at less than 1 dB. The complete description of the method to be applied for calculation can be found in [51]; in this application the misalignment was assessed in dynamic conditions in the gravity field instead of in static conditions.

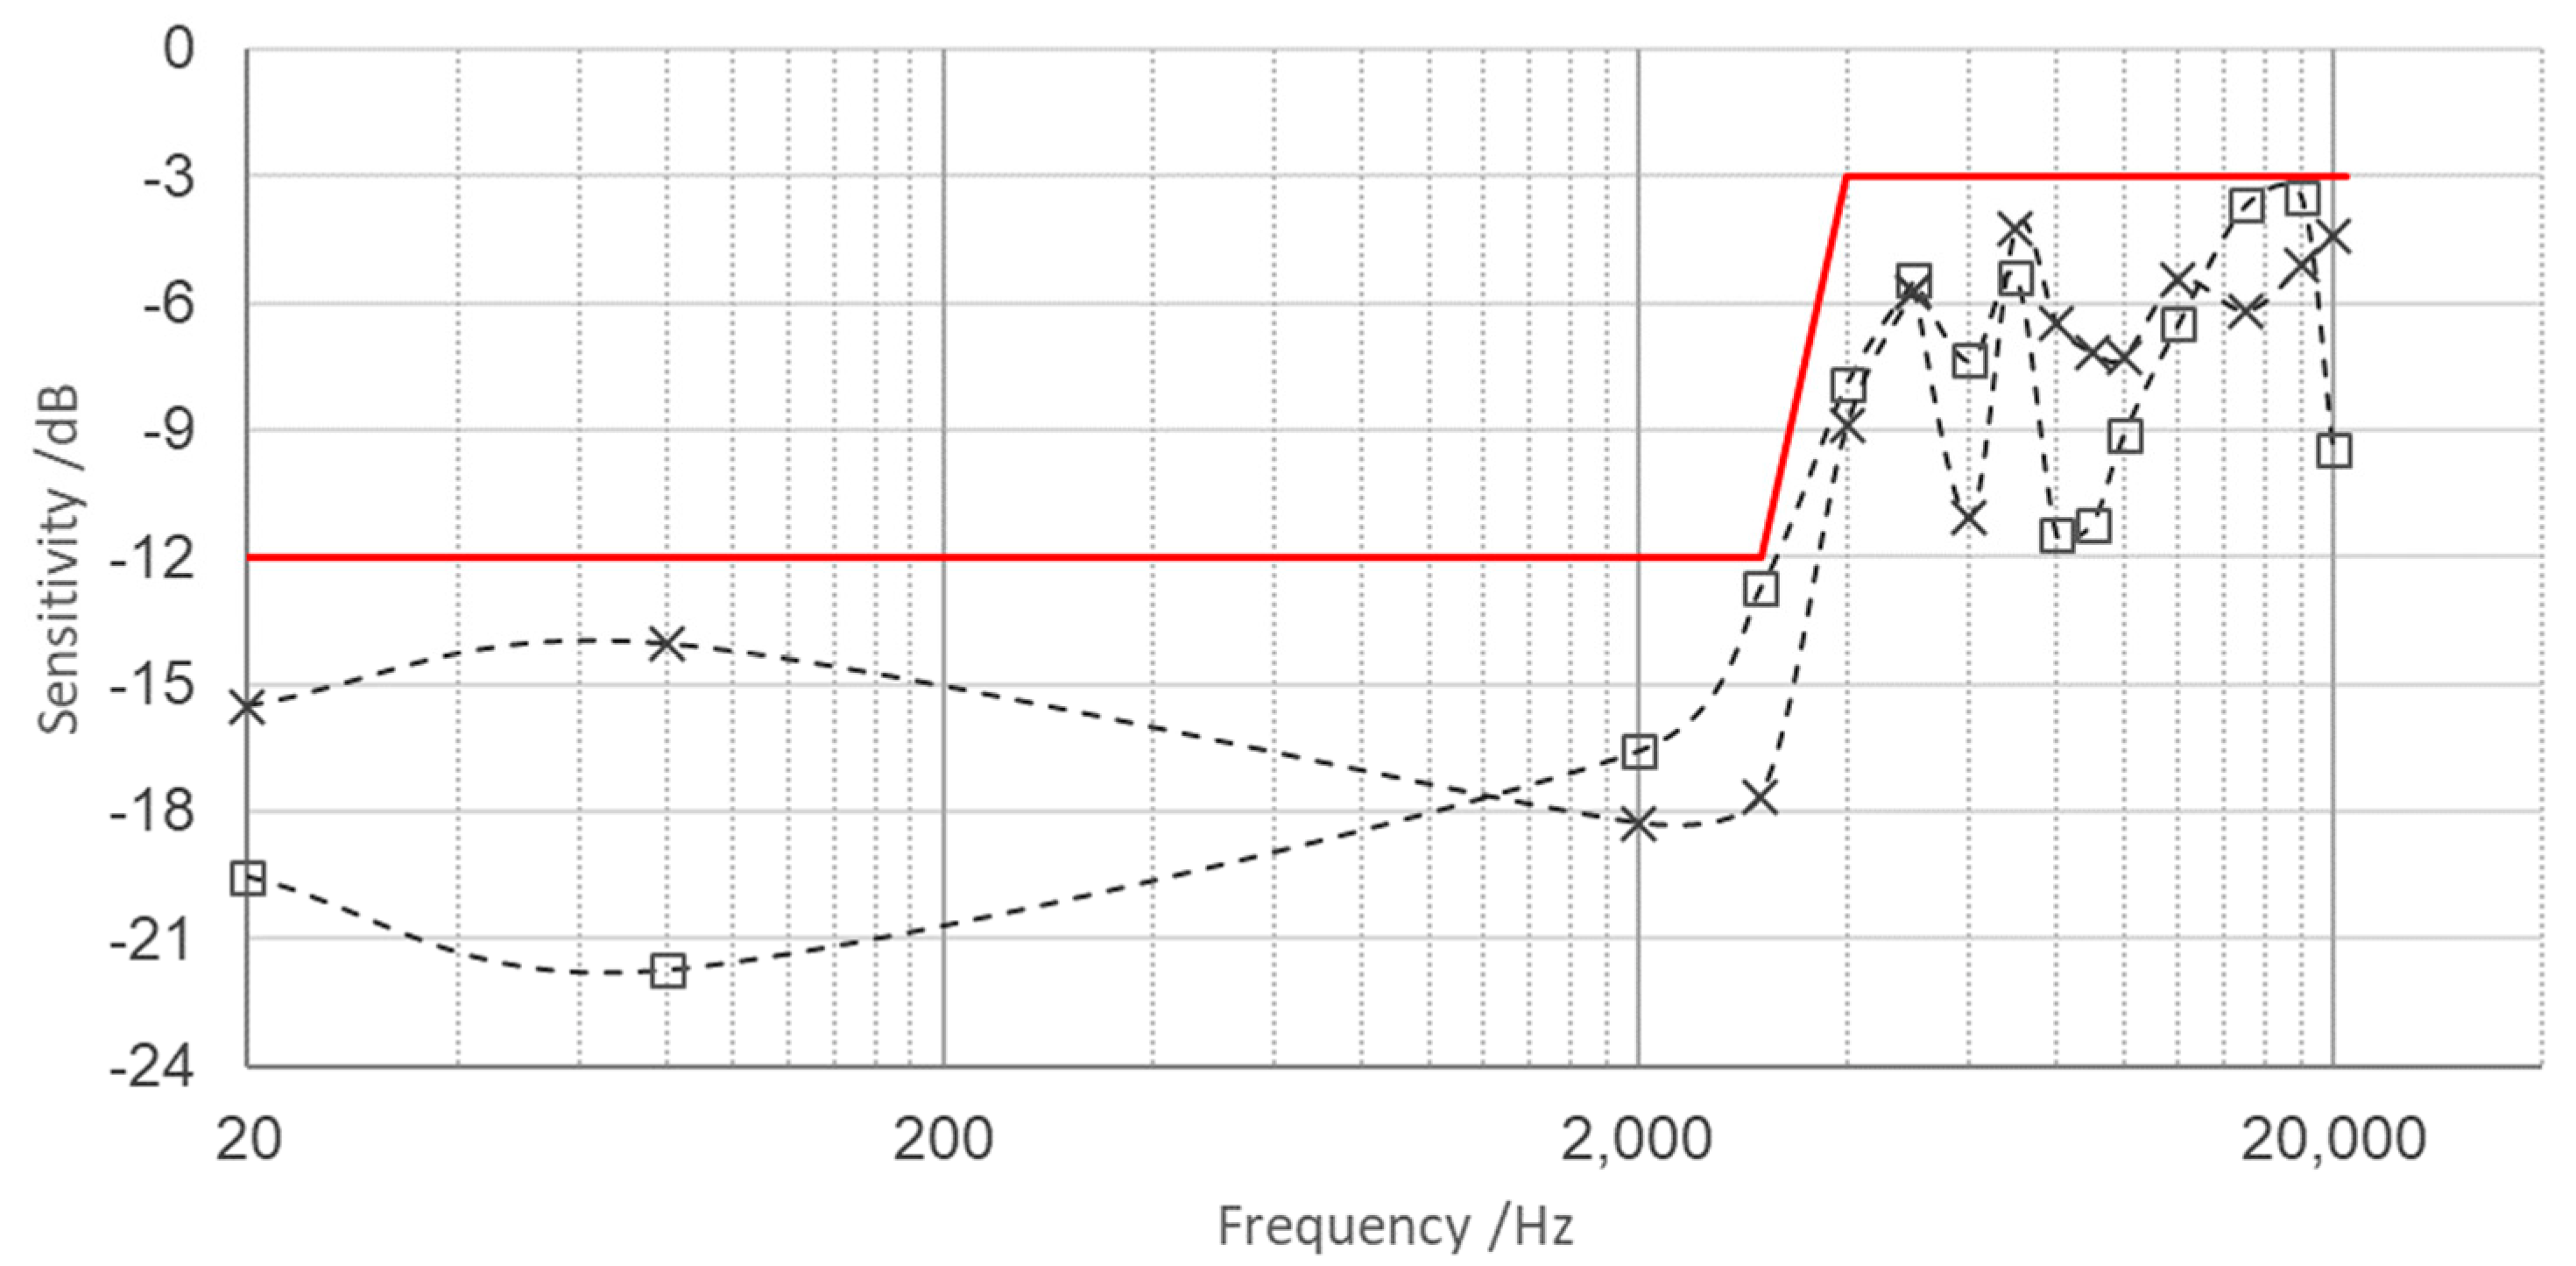
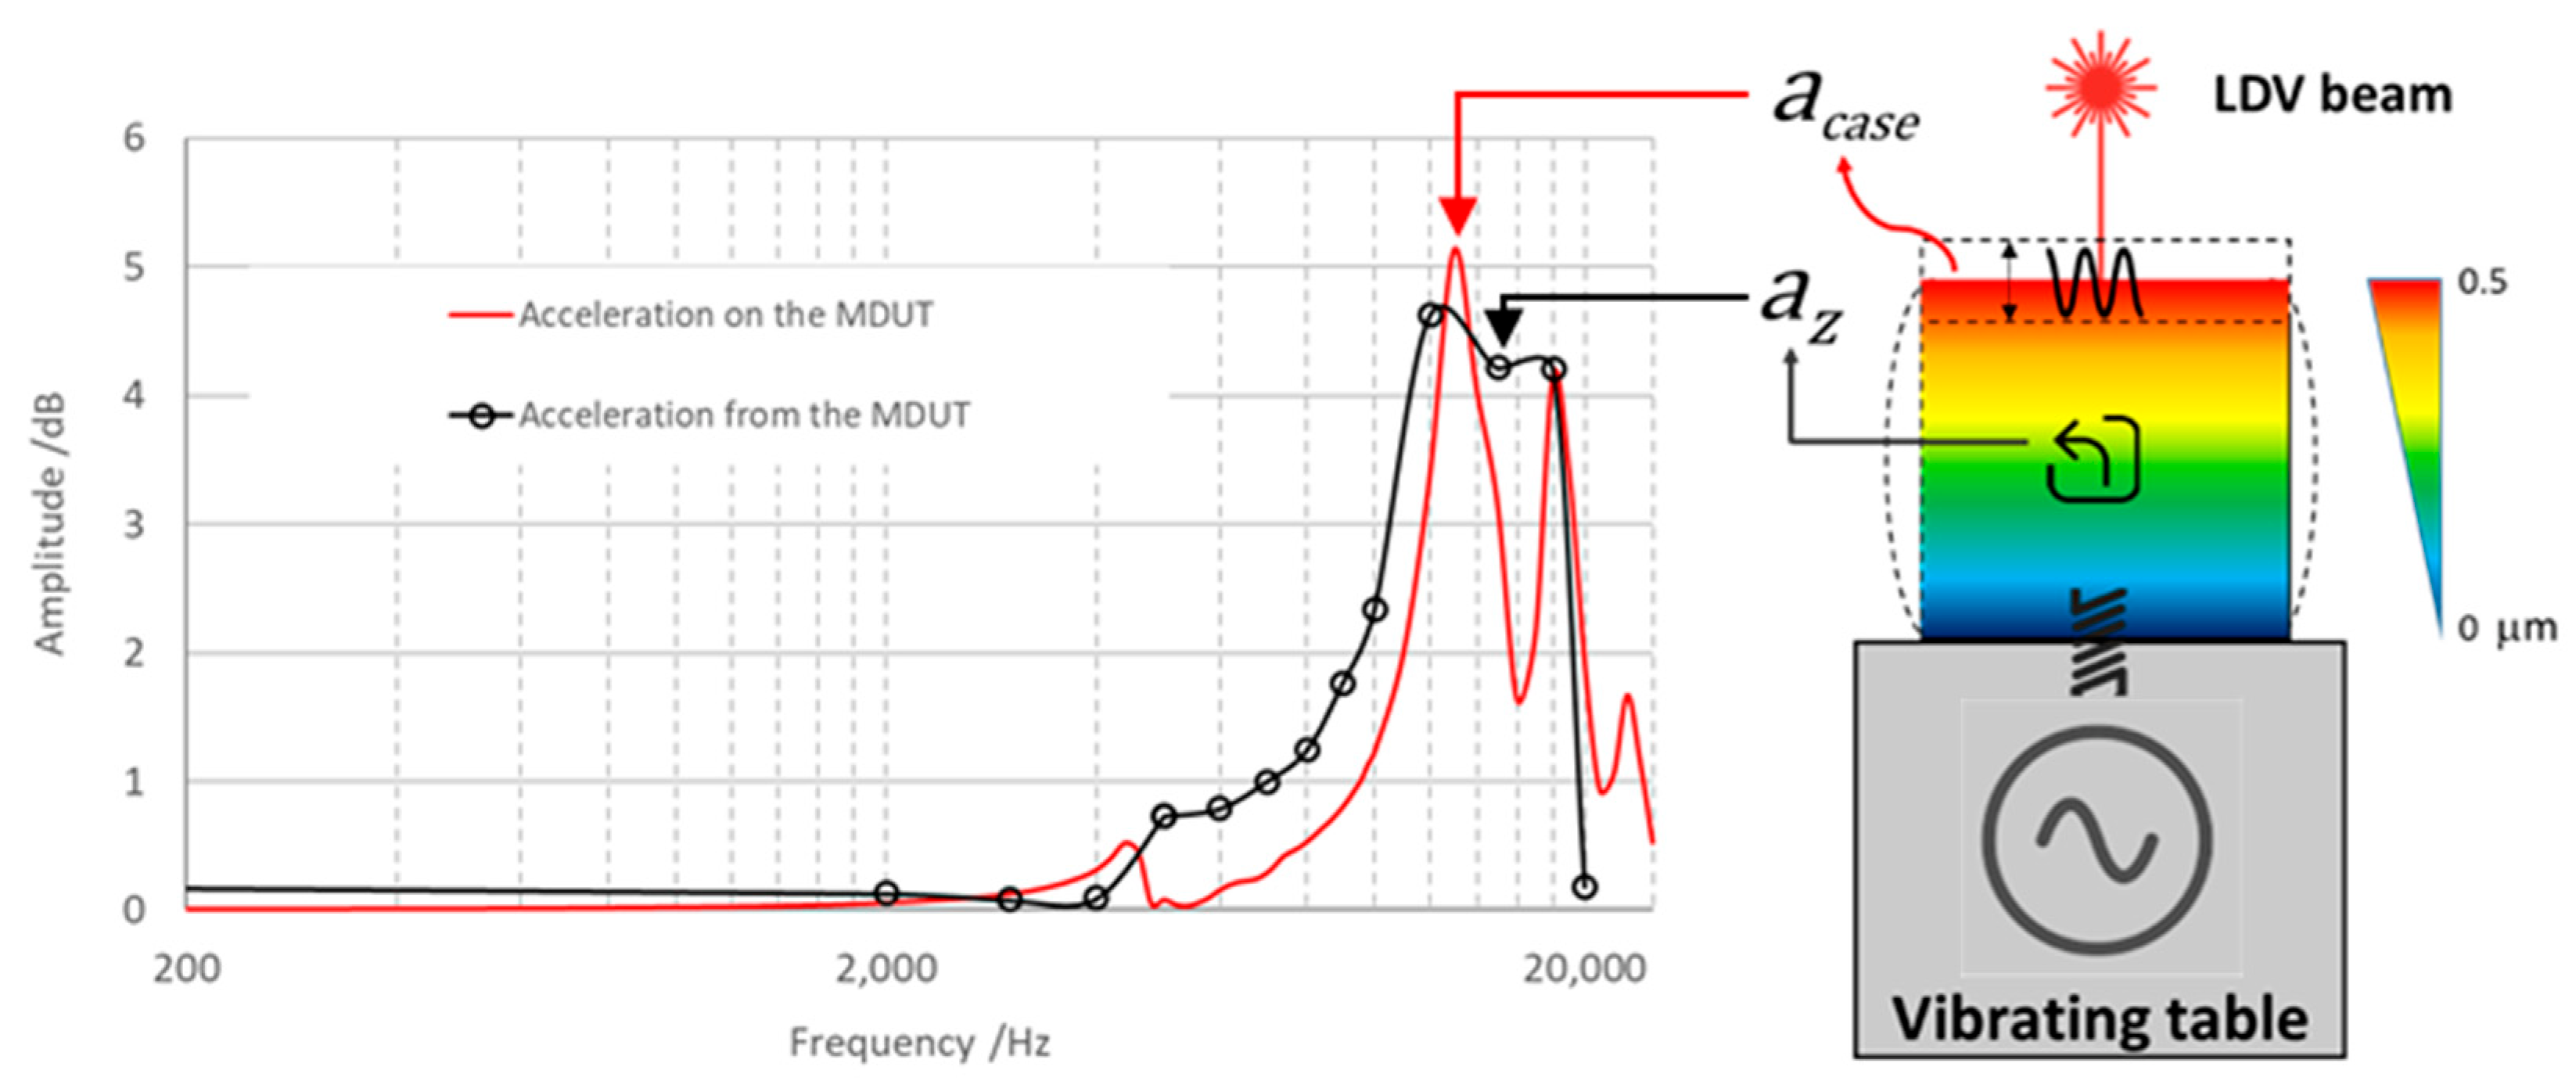
3.5. The Role of the Embedding Resin Case: Actualization of a “Mechanical Filter”

The frequency response of the embedded sensing element was “dampened” by the mechanical dissipative behavior of the epoxy resin, as shown in Figure 8. As a matter of fact, the cube (in which sensing elements are encapsulated) acted as a mechanical filter [52,53,54] due to the intrinsic elastic and dissipative properties of the constitutive polymeric material. In order to quantify the mechanical behavior of the embedding resin case, once subjected to vertical acceleration, the actual vibrations occurring on the MDUT during calibration were monitored by single-point Laser-Doppler velocimetry (Laser head Polytec GmbH, Waldbronn, Germany, model OFV 505, vibrometer controller Polytec GmbH, Waldbronn, DE, model OFV 5000), acquired by an acquisition board NI 4431 (sampling rate of 50 kHz) integrated in a PC and processed through LabVIEW® software. The laser beam hits the upper surface of the MDUT, returning the frequency response of the resin case, as shown in Figure 12.
The frequency response, measured on the upper surface of the MDUT, allows to evaluate the mechanical behavior of the epoxy resin case during dynamic vertical excitation. In the graph in Figure 13, the comparison between the relative amplitude of acceleration measured by the sensing elements within the resin case, az, and the corresponding amplitude of acceleration measured on the resin case, acase, along the vertical axis with respect to the reference acceleration amplitude, aref, are represented.
As it is possible to notice, the acceleration amplitude measured by the sensing element embedded in the resin case was modelled according to the resonant modes of the resin cube. This mechanical effect has two very useful practical advantages which can be favorably exploited in the early fault diagnosis monitoring process: the deep attenuation of the sensor resonance and the mechanically controlled amplification of the signal in a well-defined frequency range. Indeed, since the amplification due to the intrinsic resonance frequency of the free sensing element rapidly increases, according to the slope of sensitivity shown in Figure 7, serious waveshape distortions could occur in the frequency range starting from 0.1 times the resonance frequency (namely from 4.7 kHz), and more relevant measurement uncertainties are expected beyond 12 kHz, where the accuracy of the bandwidth exceeds 10%. Once the amplitude of the intrinsic resonance of the sensing element is dampened, the frequency range exploitable for measurements can be extended up to 25 kHz or beyond, depending on the measurement capabilities. Moreover, since the mechanical amplification occurs in a well-defined frequency range, with a known quality factor and peak amplitude, it is possible to exploit this effect to identify the onset of microscopic cracks beyond 20 kHz and up to 25 kHz early, by considering the amplification as kind of a “magnifying glass” pointed at a certain frequency range. In consequence, it is possible to opportunely design the embedding case with different resins in order to build up tunable mechanical filters and amplifiers, depending on the frequency range to be monitored.
In the following, a comparison between the mechanical behavior of four different embedding resins (including only epoxy) is carried out by using the method and the procedure described above. In this analysis, only the embedding resin material is investigated in order to identify the performance of different types of materials. To this aim, four cubes were characterized, the first of which was bare epoxy resin, whereas the other three were obtained by reinforcing the resins with nanoparticles of SnO2 (5% v/v), TiO2 (5% v/v) and WO3 (5% v/v). The comparison is shown in the graph in Figure 14.
The experimental characteristics of the embedding resins resonant modes are summarized in Table 1. These parameters allow to define the properties of the cases acting as mechanical filters and amplifiers.

4. Reinforced Resins: MDUTs Realization and Test through Case Studies

From the experimental characterization of the different reinforced resins, it is possible to notice that the epoxy filled with 5% (v/v) TiO2 is the one with the highest resonant frequency. A second embedded MDUT was realized by exploiting this reinforced resin.
The realization follows the same procedure as the one used for the MDUT in bare epoxy, adopting three ADXL1005 MEMS accelerometers in a triaxial configuration.
Tests were performed exploiting the test bench described in [55], which adopted a modified loudspeaker as a vibration source. The actuator consists of a loudspeaker magnetic motor and a moving assembly realized exploiting the speaker voice coil. The MDUT and a reference accelerometer were mounted on an aluminum disc firmly fixed at the edge of the voice coil.
The responses of the two MDUTs were compared with the one of a triaxial piezoelectric reference accelerometer (B&K, Nærum, Denmark, model 4426) characterized by 10% accuracy bandwidths of 9 kHz, 8 kHz and 16 kHz along the x, y and z axes, respectively. The z-axis was mounted in the direction of the aluminum plate displacement. All the accelerometers were tested by screwing them on to the aluminum plate with an M3 thread.
For all the accelerometers, the signals of the three axes were acquired with an acquisition board (National Instruments, Austin, TX, USA, model DAQ PCI 6259 1.2 MS/s, 16 channels, 16 bits) with a sampling frequency of 160 kHz.
To test the DUTs in realistic conditions, excitation signals emulating the bearing fault vibration signatures were chosen as excitation signals with a harmonic content up to 50 kHz; the bandwidth of a power amplifier equal to 100 kHz. In this context, the loudspeaker acts as a mechanical filter for the higher frequencies. Tests performed with the reference accelerometer proved that the harmonic content of the acceleration generated by exciting the loudspeaker with the emulated signals was extended up to 20 kHz. The reported results are the responses of the two MDUTs and the piezo reference accelerometer along the excitation axis (z axis).
The devices were tested individually since the emulated signals were stationary and the payload given by the two different devices was comparable in terms of added mass.
In particular, vibration signatures of different types of single faults, i.e., outer race, inner race and ball faults, were emulated exploiting the technique presented in [56], based on the following model for the vibration signature, s(t):
s t = 1 + K F sin 2 π f F 60 i [ A C 1 2   1 1 i + A C 2 2   1 1 i + 1 e t i F C τ sin 2 π f r e s t i F C   u t i F C + A R P M sin 2 π R P M 60   t + ϕ
where the first term of the sum is the acceleration signal due to the presence of the fault, given by a train of transient vibration of the bearing components started by each defect impact, and u(t) is the step function with u(t) = 1 if t ≥ 0, u(t) = 0 if t < 0. FC = BPFO in the case of an outer race fault, FC = BPFI in the case of an inner race fault and FC = BSF in the case of a ball fault. AC1 = AC2 = A0 and KF = 0 in the case of an outer race fault; AC1 = AC2 = A0, KF 0 and fF = RPM in the case of an inner race fault; and AC1 > AC2, KF 0 and fF = FTF in the case of a ball fault. fres is the resonance frequency of the bearing components, τ is the time constant characterizing the component transient vibration and ARPM is the amplitude of the component related to the shaft rotation. The leftmost term in Equation (2) represents the vibration of the accelerometer due to the vibration of the rotating part of the engine and can be seen as a low frequency noise.
Obviously, this mathematical model of bearing failures holds if no slipping occurs in the bearing components. In real applications, this is true when the failures are at early stages and the mechanical load on the bearing itself is not critical. When the defect increases in severity, slipping starts to occur, especially in the case of ball failures. Moreover, in real life, the accelerometers can be mounted far from the bearings or shafts; in this case, the vibration components, which are present near the bearing structure, can be attenuated by the path between the vibration source and the sensor itself and disturbed by other vibration signatures generated by other mechanical sources.
Many different conditions were considered, accounting for different roller bearing types, machine RPMs and component resonant frequencies, fres, and in all cases the performance of the MDUTs proved to be satisfactory in accordance with what was expected from the calibration study. Resonance frequencies up to 10 kHz were considered. The following figures show some examples of the results obtained considering a roller bearing (22209E1K bearing), an RPM = 3000 rev/min and resonant frequency of the bearing components, fres = 10 kHz, by emulating an outer race fault characterized by BPFO = 361 Hz, an inner race fault with BPFI = 488 Hz and finally a ball fault with BSF = 161 Hz and FTF = 21 Hz. In detail, Figure 15 presents three different cases of fault signature vibration signals in the time domain, whereas Figure 16 shows the same signals in the frequency domain. As it can be seen, both the presented MDUTs allow for an accurate detection of faults in both the time and frequency domains, even considering the high frequency band of the component resonant (modal) vibrations emulated in this test. As expected, reinforcing the epoxy resin with TiO2 provided a larger bandwidth and a higher fidelity.

5. Conclusions

In this paper, we present a low-cost, multicomponent MEMS sensor accelerometer prototype (MDUT), designed, developed and realized at the University of Siena, to be applied for rolling bearings vibration monitoring in a broad frequency domain. The technical performance of the MDUT is evaluated from calibrations and suitable metrological characterizations at the Primary Vibration Laboratory of the National Institute of Metrological Research (INRiM). In particular, both the sensitivity of the individual sensing element and the sensitivity of the MDUT embedded in resin are determined, according to ISO 16063-21:2003. Calibration of MDUT is carried out from 10 Hz up to 25 kHz, and the main sensitivities along the three axes are evaluated in order to define the actual responsiveness of the MDUT in dynamic conditions; this approach allows to identify and quantify possible misalignments among the axes and to quantify the occurring transverse accelerations and cross-sensitivities. Moreover, the mechanical behavior of the embedding resin case, once subjected to vertical acceleration, is determined in order to evaluate the actual vibrations occurring on the MDUT during operative conditions. Since it is observed that the resin cube acts as a “mechanical filter”, four different kinds of embedding resins; namely, epoxy resin alone and epoxy resins filled with nanoparticles of SnO2 (5% v/v), TiO2 (5% v/v) and WO3 (5% v/v), are investigated and their mechanical behaviors compared. The epoxy filled with 5% (v/v) TiO2 is the one with the highest resonant frequency; therefore, a MDUT embedded with this reinforced resin is applied for case studies to test the DUTs in realistic operative conditions. Tests were undertaken exploiting a previously realized test bench which allows to emulate different vibration signatures of bearing failures considering the different bearing characteristics. As expected, the device realized with reinforced epoxy performs better than the one realized with epoxy alone in terms of fidelity of the reproduction and bandwidth.

Author Contributions

Conceptualization, E.L., A.P., A.F. (Ada Fort) and A.S.; methodology, F.M. and A.S.; software, E.L., A.P. and F.M.; validation, A.P., A.F. (Ada Fort), M.M. (Marco Mugnaini), V.V., M.M. (Michele Murgia) and A.S.; formal analysis, A.P., A.F. (Ada Fort) and A.S.; investigation, E.L., A.P., A.F. (Ada Fort) and A.S.; resources, A.F. (Ada Fort), M.M. (Marco Mugnaini), V.V., A.F. (Alessio Facello) and A.S.; data curation, E.L., A.P., A.F. (Ada Fort) and A.S.; writing—original draft preparation, E.L., A.P., A.F. (Ada Fort) and A.S.; writing—review and editing, E.L., A.P., A.F. (Ada Fort) and A.S.; visualization, E.L., A.P., A.F. (Ada Fort) and A.S.; supervision, M.M. (Marco Mugnaini), V.V., Alessio F., M.M. (Michele Murgia) and A.S.; project administration, A.S. All authors have read and agreed to the published version of the manuscript.

Funding

This research received no external funding.

Data Availability Statement

Data sharing not applicable. No new data were created or analyzed in this study. Data sharing is not applicable to this article.

Conflicts of Interest

The authors declare no conflict of interest.

References

  1. Barai, V.; Ramteke, S.M.; Dhanalkotwar, V.; Nagmote, Y.; Shende, S.; Deshmukh, D. Bearing fault diagnosis using signal processing and machine learning techniques: A review. In IOP Conference Series: Materials Science and Engineering; IOP Publishing: Bristol, UK, 2022; Volume 1259, p. 012034. [Google Scholar]
  2. Cen, J.; Yang, Z.; Liu, X.; Xiong, J.; Chen, H. A Review of Data-Driven Machinery Fault Diagnosis Using Machine Learning Algorithms. J. Vib. Eng. Technol. 2022, 10, 2481–2507. [Google Scholar] [CrossRef]
  3. Bertocco, M.; Fort, A.; Landi, E.; Mugnaini, M.; Parri, L.; Peruzzi, G.; Pozzebon, A. Roller Bearing Failures Classification with Low Computational Cost Embedded Machine Learning. In 2022 IEEE International Workshop on Metrology for Automotive (MetroAutomotive); IEEE: New York, NY, USA, 2022; pp. 12–17. [Google Scholar]
  4. Hakim, M.; Omran, A.A.B.; Ahmed, A.N.; Al-Waily, M.; Abdellatif, A. A systematic review of rolling bearing fault diagnoses based on deep learning and transfer learning: Taxonomy, overview, application, open challenges, weaknesses and recommendations. Ain Shams Eng. J. 2022, 14, 101945. [Google Scholar] [CrossRef]
  5. Mushtaq, S.; Islam, M.M.; Sohaib, M. Deep learning aided Data-Driven fault diagnosis of rotatory machine: A comprehensive review. Energies 2021, 14, 5150. [Google Scholar] [CrossRef]
  6. Gawde, S.; Patil, S.; Kumar, S.; Kotecha, K. A scoping review on multi-fault diagnosis of industrial rotating machines using multi-sensor data fusion. Artif. Intell. Rev. 2022, 55, 1–54. [Google Scholar] [CrossRef]
  7. Anwarsha, A.; Narendiranath Babu, T. Recent advancements of signal processing and artificial intelligence in the fault detection of rolling element bearings: A review. J. Vibroengineering 2022, 24, 1027–1055. [Google Scholar] [CrossRef]
  8. Jiao, J.; Zhao, M.; Lin, J.; Liang, K. A comprehensive review on convolutional neural network in machine fault diagnosis. Neurocomputing 2020, 417, 36–63. [Google Scholar] [CrossRef]
  9. Jieyang, P.; Kimmig, A.; Dongkun, W.; Niu, Z.; Zhi, F.; Jiahai, W.; Ovtcharova, J. A systematic review of data-driven approaches to fault diagnosis and early warning. J. Intell. Manuf. 2022, 33, 1–28. [Google Scholar] [CrossRef]
  10. Zhao, Z.; Wu, J.; Li, T.; Sun, C.; Yan, R.; Chen, X. Challenges and opportunities of AI-enabled monitoring, diagnosis & prognosis: A review. Chin. J. Mech. Eng. 2021, 34, 1–29. [Google Scholar]
  11. Yang, Z.; Xu, B.; Luo, W.; Chen, F. Autoencoder-based representation learning and its application in intelligent fault diagnosis: A review. Measurement 2021, 189, 110460. [Google Scholar] [CrossRef]
  12. Gonzalez-Jimenez, D.; Del-Olmo, J.; Poza, J.; Garramiola, F.; Madina, P. Data-driven fault diagnosis for electric drives: A review. Sensors 2021, 21, 4024. [Google Scholar] [CrossRef]
  13. Caiazzo, B.; Di Nardo, M.; Murino, T.; Petrillo, A.; Piccirillo, G.; Santini, S. Towards Zero Defect Manufacturing paradigm: A review of the state-of-the-art methods and open challenges. Comput. Ind. 2022, 134, 103548. [Google Scholar] [CrossRef]
  14. Wu, G.; Yan, T.; Yang, G.; Chai, H.; Cao, C. A Review on Rolling Bearing Fault Signal Detection Methods Based on Different Sensors. Sensors 2022, 22, 8330. [Google Scholar] [CrossRef]
  15. Yakhni, M.F.; Cauet, S.; Sakout, A.; Assoum, H.; Etien, E.; Rambault, L.; El-Gohary, M. Variable speed induction motors’ fault detection based on transient motor current signatures analysis: A review. Mech. Syst. Signal Process. 2023, 184, 109737. [Google Scholar] [CrossRef]
  16. Davari, N.; Veloso, B.; Costa, G.D.A.; Pereira, P.M.; Ribeiro, R.P.; Gama, J. A survey on data-driven predictive maintenance for the railway industry. Sensors 2021, 21, 5739. [Google Scholar] [CrossRef]
  17. Li, W.; Huang, R.; Li, J.; Liao, Y.; Chen, Z.; He, G.; Gryllias, K. A perspective survey on deep transfer learning for fault diagnosis in industrial scenarios: Theories, applications and challenges. Mech. Syst. Signal Process. 2022, 167, 108487. [Google Scholar] [CrossRef]
  18. Abbassi, R.; Arzaghi, E.; Yazdi, M.; Aryai, V.; Garaniya, V.; Rahnamayiezekavat, P. Risk-based and predictive maintenance planning of engineering infrastructure: Existing quantitative techniques and future directions. Process. Saf. Environ. Prot. 2022, 165, 776–790. [Google Scholar] [CrossRef]
  19. Liu, C.; Cichon, A.; Królczyk, G.; Li, Z. Technology development and commercial applications of industrial fault diagnosis system: A review. Int. J. Adv. Manuf. Technol. 2021, 118, 3497–3529. [Google Scholar] [CrossRef]
  20. Mohd Ghazali, M.H.; Rahiman, W. Vibration analysis for machine monitoring and diagnosis: A systematic review. Shock. Vib. 2021, 2021, 9469318. [Google Scholar] [CrossRef]
  21. Mohamed, A.; Hassan, M.; M’Saoubi, R.; Attia, H. Tool Condition Monitoring for High-Performance Machining Systems—A Review. Sensors 2022, 22, 2206. [Google Scholar] [CrossRef]
  22. Fanti, G.; Spinazzè, A.; Borghi, F.; Rovelli, S.; Campagnolo, D.; Keller, M.; Cavallo, D.M. Evolution and applications of recent sensing technology for occupational risk assessment: A rapid review of the literature. Sensors 2022, 22, 4841. [Google Scholar] [CrossRef]
  23. Tiboni, M.; Remino, C.; Bussola, R.; Amici, C. A Review on Vibration-Based Condition Monitoring of Rotating Machinery. Appl. Sci. 2022, 12, 972. [Google Scholar] [CrossRef]
  24. Prato, A.; Mazzoleni, F.; D’Emilia, G.; Gaspari, A.; Natale, E.; Schiavi, A. Metrological traceability of a digital 3-axis MEMS accelerometers sensor network. Measurement 2021, 184, 109925. [Google Scholar] [CrossRef]
  25. BIPM—Consultative Committee for Acoustics, Ultrasound, and Vibration (CCAUV). Strategy Plan 2019 to 2029; BIPM—Consultative Committee for Acoustics, Ultrasound, and Vibration (CCAUV): Paris, France, 2019. [Google Scholar]
  26. Available online: https://www.analog.com/media/en/technical-documentation/data-sheets/ADXL1001-1002.pdf (accessed on 10 December 2022).
  27. Den Hartog, J.P. Mechanical Vibrations, 1st ed.; McGraw-Hill Book Company, Inc.: New York, NY, USA, 1934. [Google Scholar]
  28. Lv, Y.; Zhao, W.; Zhao, Z.; Li, W.; Ng, K.K. Vibration signal-based early fault prognosis: Status quo and applications. Adv. Eng. Inform. 2022, 52, 101609. [Google Scholar] [CrossRef]
  29. Althubaiti, A.; Elasha, F.; Teixeira, J.A. Fault diagnosis and health management of bearings in rotating equipment based on vibration analysis—A review. J. Vibroeng. 2022, 24, 46–74. [Google Scholar] [CrossRef]
  30. Tama, B.A.; Vania, M.; Lee, S.; Lim, S. Recent advances in the application of deep learning for fault diagnosis of rotating machinery using vibration signals. Artif. Intell. Rev. 2022, 55, 1–43. [Google Scholar] [CrossRef]
  31. Ali, A.; Abdelhadi, A. Condition-Based Monitoring and Maintenance: State of the Art Review. Appl. Sci. 2022, 12, 688. [Google Scholar] [CrossRef]
  32. Yan, G.; Chen, J.; Bai, Y.; Yu, C.; Yu, C. A Survey on Fault Diagnosis Approaches for Rolling Bearings of Railway Vehicles. Processes 2022, 10, 724. [Google Scholar] [CrossRef]
  33. Ma, J.; Li, C.; Zhang, G. Rolling bearing fault diagnosis based on deep learning and autoencoder information fusion. Symmetry 2021, 14, 13. [Google Scholar] [CrossRef]
  34. Shi, H.; Li, Y.; Bai, X.; Zhang, K.; Sun, X. A two-stage sound-vibration signal fusion method for weak fault detection in rolling bearing systems. Mech. Syst. Signal Process. 2022, 172, 109012. [Google Scholar] [CrossRef]
  35. Zhou, Y.; Yan, S.; Ren, Y.; Liu, S. Rolling bearing fault diagnosis using transient-extracting transform and linear discriminant analysis. Measurement 2021, 178, 109298. [Google Scholar] [CrossRef]
  36. Xu, M.; Wang, Y. An imbalanced fault diagnosis method for rolling bearing based on semi-supervised conditional generative adversarial network with spectral normalization. IEEE Access 2021, 9, 27736–27747. [Google Scholar] [CrossRef]
  37. Zhang, K.; Xu, Y.; Liao, Z.; Song, L.; Chen, P. A novel Fast Entrogram and its applications in rolling bearing fault diagnosis. Mech. Syst. Signal Process. 2021, 154, 107582. [Google Scholar] [CrossRef]
  38. Karpat, F.; Kalay, O.C.; Dirik, A.E.; Doğan, O.; Korcuklu, B.; Yüce, C. Convolutional neural networks based rolling bearing fault classification under variable operating conditions. In Proceedings of the 2021 International Conference on INnovations in Intelligent SysTems and Applications (INISTA), Kocaeli, Turkey, 25–27 August 2021; pp. 1–6. [Google Scholar]
  39. Matsushita, O.; Tanaka, M.; Kobayashi, M.; Keogh, P.; Kanki, H. Vibration of Rolling Element Bearings. In Vibrations of Rotating Machinery; Springer: Tokyo, Japan, 2019; pp. 87–114. [Google Scholar]
  40. Tom, K.F. A Primer on Vibrational Ball Bearing Feature Generation for Prognostics and Diagnostics Algorithms; Army Research Lab Adelphi Md Sensors and Electron Devices Directorate: Adelphi, MD, USA, 2015. [Google Scholar]
  41. Kim, S.; An, D.; Choi, J.H. Diagnostics 101: A tutorial for fault diagnostics of rolling element bearing using envelope analysis in matlab. Appl. Sci. 2020, 10, 7302. [Google Scholar] [CrossRef]
  42. Jain, P.H.; Bhosle, S.P. A Review on Vibration Signal Analysis Techniques Used for Detection of Rolling Element Bearing Defects. SSRG Int. J. Mech. Eng. 2021, 8, 14–29. [Google Scholar] [CrossRef]
  43. Shakya, P.; Darpe, A.K.; Kulkarni, M.S. Vibration-based fault diagnosis in rolling element bearings: Ranking of various time, frequency and time-frequency domain data-based damage identi cation parameters. Int. J. Cond. Monit. 2013, 3, 53–62. [Google Scholar] [CrossRef]
  44. ISO 16063-11:1999; Methods for the Calibration of Vibration and Shock Transducers—Part 11: Primary Vibration Calibration by Laser Interferometry. International Organization for Standardization ISO Central Secretariat: Geneva, Switzerland, 1999.
  45. ISO 16063-21:2003; Methods for the Calibration of Vibration and Shock Transducers—Part 21: Vibration Calibration by Comparison to a Reference Transducer. International Organization for Standardization ISO Central Secretariat: Geneva, Switzerland, 2003.
  46. Galetto, M.; Schiavi, A.; Genta, G.; Prato, A.; Mazzoleni, F. Uncertainty evaluation in calibration of low-cost digital MEMS accelerometers for advanced manufacturing applications. CIRP Ann. Manuf. Technol. 2019, 68, 535–538. [Google Scholar] [CrossRef]
  47. D’Emilia, G.; Gaspari, A.; Mazzoleni, F.; Natale, E.; Prato, A.; Schiavi, A. Metrological characterization of MEMS accelerometers by LDV. In Journal of Physics: Conference Series; IOP Publishing: Bristol, UK, 2020; Volume 1589, p. 012011. [Google Scholar]
  48. D’Emilia, G.; Gaspari, A.; Mazzoleni, F.; Natale, E.; Schiavi, A. Calibration of tri-axial MEMS accelerometers in the low-frequency range. Part 2: Uncertainty assessment. J. Sens. Sens. Syst. 2018, 7, 403–410. [Google Scholar] [CrossRef]
  49. Prato, A.; Mazzoleni, F.; Schiavi, A. Traceability of digital 3-axis MEMS accelerometer: Simultaneous determination of main and transverse sensitivities in the frequency domain. Metrologia 2020, 57, 035013. [Google Scholar] [CrossRef]
  50. Prato, A.; Mazzoleni, F.; Schiavi, A. Evaluation and correction of systematic effects in a simultaneous 3-axis vibration calibration system. Acta Imeko 2020, 9, 388–393. [Google Scholar] [CrossRef]
  51. Gaitan, M.; Bautista, I.M.L.; Geist, J. Reduction of calibration uncertainty due to mounting of three-axis accelerometers using the intrinsic properties model. Metrologia 2021, 58, 035006. [Google Scholar] [CrossRef]
  52. Zega, V.; Nastro, A.; Ferrari, M.; Ardito, R.; Ferrari, V.; Corigliano, A. An Innovative Auxetic Electrically-Tunable Mems Mechanical Filter. In Proceedings of the 2022 IEEE 35th International Conference on Micro Electro Mechanical Systems Conference (MEMS), Tokyo, Japan, 9–13 January 2022; pp. 539–542. [Google Scholar]
  53. Yao, Z.; Zega, V.; Su, Y.; Corigliano, A. A metaplate in MEMS for innovative applications: Vibration isolation and tunable mechanical filters. In Proceedings of the 2020 IEEE Sensors, Virtual Conference, 25–28 October 2020; pp. 1–4. [Google Scholar]
  54. Cigada, A.; Lurati, M.; Redaelli, M.; Vanali, M. Mechanical performance and metrological characterization of MEMS accelerometers and application in modal analysis. In Proceedings of the IMAC XXV International Modal Analysis Conference, Orlando, FL, USA, 19–22 February 2007; pp. 19–22. [Google Scholar]
  55. Addabbo, T.; Fort, A.; Landi, E.; Moretti, R.; Mugnaini, M.; Parri, L.; Vignoli, V. A Characterization system for bearing condition monitoring sensors, a case study with a low power wireless Triaxial MEMS based sensor. In Proceedings of the 2020 IEEE International Workshop on Metrology for Industry 4.0 & IoT, Rome, Italy, 3–5 June 2020; pp. 11–15. [Google Scholar]
  56. Landi, E.; Parri, L.; Moretti, R.; Fort, A.; Mugnaini, M.; Vignoli, V. High Performance Analog MEMS for IoT Based Condition Monitoring, Characterization with a Bearing Failure Emulation Test Bench. In Proceedings of the 2022 IEEE International Workshop on Metrology for Automotive (MetroAutomotive), Modena, Italy, 4–6 July 2022; pp. 1–5. [Google Scholar]
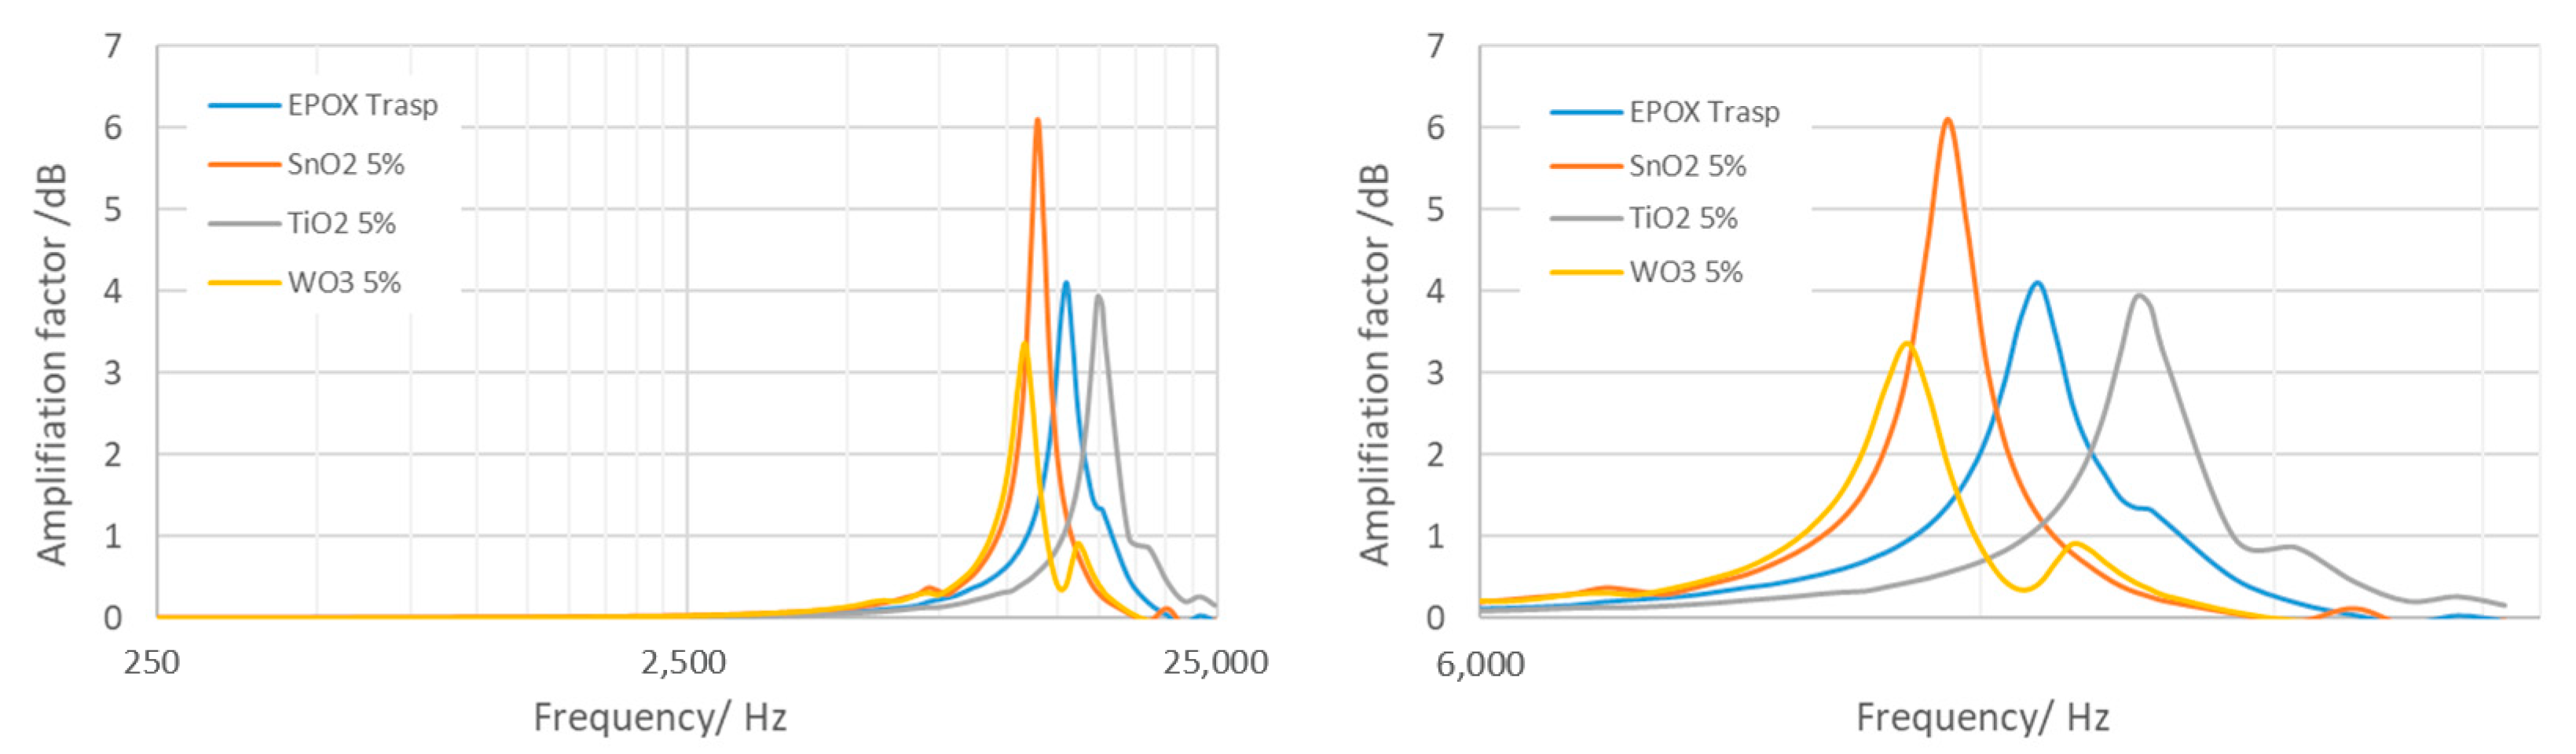
Figure 1. The basic elements of a rolling bearing and the related geometric parameters.
Micromachines 14 00376 g001
Figure 2. Example of characteristic rolling bearings frequency, and a typical time–frequency analysis. Left figure from [40].
Micromachines 14 00376 g002
Figure 3. Spectral components of vibration signals due to a fault occurring in rolling bearings, with related frequency regions.
Micromachines 14 00376 g003
Figure 4. The MDUT elements: (a) single sensing element board, (b) multicomponent assembly, (c) epoxy encapsulation.
Micromachines 14 00376 g004
Figure 5. The individual sensing element ADXL 1005Z on the vertical instrumented vibration table.
Micromachines 14 00376 g005
Figure 6. The vertical axial calibration of the MDUT embedded in the resin case: the MDUT on the instrumented vibrating table and a schematic picture of the calibration assembling.
Micromachines 14 00376 g006
Figure 7. Sensitivity expressed in mV/ms−2 and in dB of the individual sensing element.
Micromachines 14 00376 g007
Figure 8. Full scale range (left plot) and high-frequency range detail with related calibration uncertainties (right plots) of the comparison between the sensitivity of the individual sensing element and the sensitivity of the embedded sensor along the vertical axis.
Micromachines 14 00376 g008
Figure 9. Full scale range of the relative amplitude of transverse sensitivity (grey dotted lines, square X axis, cross Y axis) on the horizontal plane with respect to the sensitivity measured along the vertical axis, which is the direction of reference acceleration (parallel to g).
Micromachines 14 00376 g009
Figure 10. The multicomponent calibration system: inclined plane allows to generate a projection of the vertical reference acceleration along three axes simultaneously.
Micromachines 14 00376 g010
Figure 11. Quantification of differences between the measured acceleration and expected acceleration.
Micromachines 14 00376 g011
Figure 12. Characterization of the mechanical behavior of the embedding resin case during MDUT calibration in dynamic conditions: (a) the whole measuring system and (b) the MDUT on the vibrating table hit by the single-point Laser-Doppler vibrometer beam on the upper surface.
Micromachines 14 00376 g012
Figure 13. Comparison between the acceleration amplitude, acase, measured on the upper surface of MDUT by the Laser-Doppler Vibrometer (red curve), the acceleration amplitude, az, measured from the signal output of the sensing element embedded in the resin case (black curve) and a schematic picture of the mechanical behavior and deformations occurring during calibration.
Micromachines 14 00376 g013
Figure 14. Mechanical behavior of four resins subjected to dynamic excitation. The resonant frequency peaks are clearly identified, as well as the quality factor and amplification factor of each sample.
Micromachines 14 00376 g014
Figure 15. Measured fault signature vibration signals in the time domain. Sampling frequency = 160 kHz. (a) Outer race fault; (b) inner race fault; and (c) ball fault. Upper plots—signals measured by the reference piezoelectric accelerometer; middle plots—signals measured by the proposed MDUT encapsulated in epoxy resin; and lower plots—signals measured by the proposed MDUT encapsulated in epoxy resin filled with TiO2.
Micromachines 14 00376 g015
Figure 16. Measured fault signature vibration signals spectra. Sampling frequency = 160 kHz. (a) Outer race fault; (b) inner race fault; and (c) ball fault. Upper plots—signals measured by the reference piezoelectric accelerometer; middle plots—signals measured by the proposed MDUT encapsulated in epoxy resin; and lower plots—signals measured by the proposed MDUT encapsulated in epoxy resin reinforced with TiO2.
Micromachines 14 00376 g016
Table 1. Characteristics of the mechanical filters.
Resin CaseResonant Frequency
/kHz
Quality Factor
/-
Relative Amplification Factor
/dB
Epoxy only resin13.13.04
Epoxy with 5% SnO211.513.16
Epoxy with 5% TiO215.22.64
Epoxy with 5% WO310.82.43.5
Disclaimer/Publisher’s Note: The statements, opinions and data contained in all publications are solely those of the individual author(s) and contributor(s) and not of MDPI and/or the editor(s). MDPI and/or the editor(s) disclaim responsibility for any injury to people or property resulting from any ideas, methods, instructions or products referred to in the content.

