
Numerical Study on a Liquid Cooling Plate with a Double-Layer Minichannel for a Lithium Battery Module


Abstract
:1. Introduction
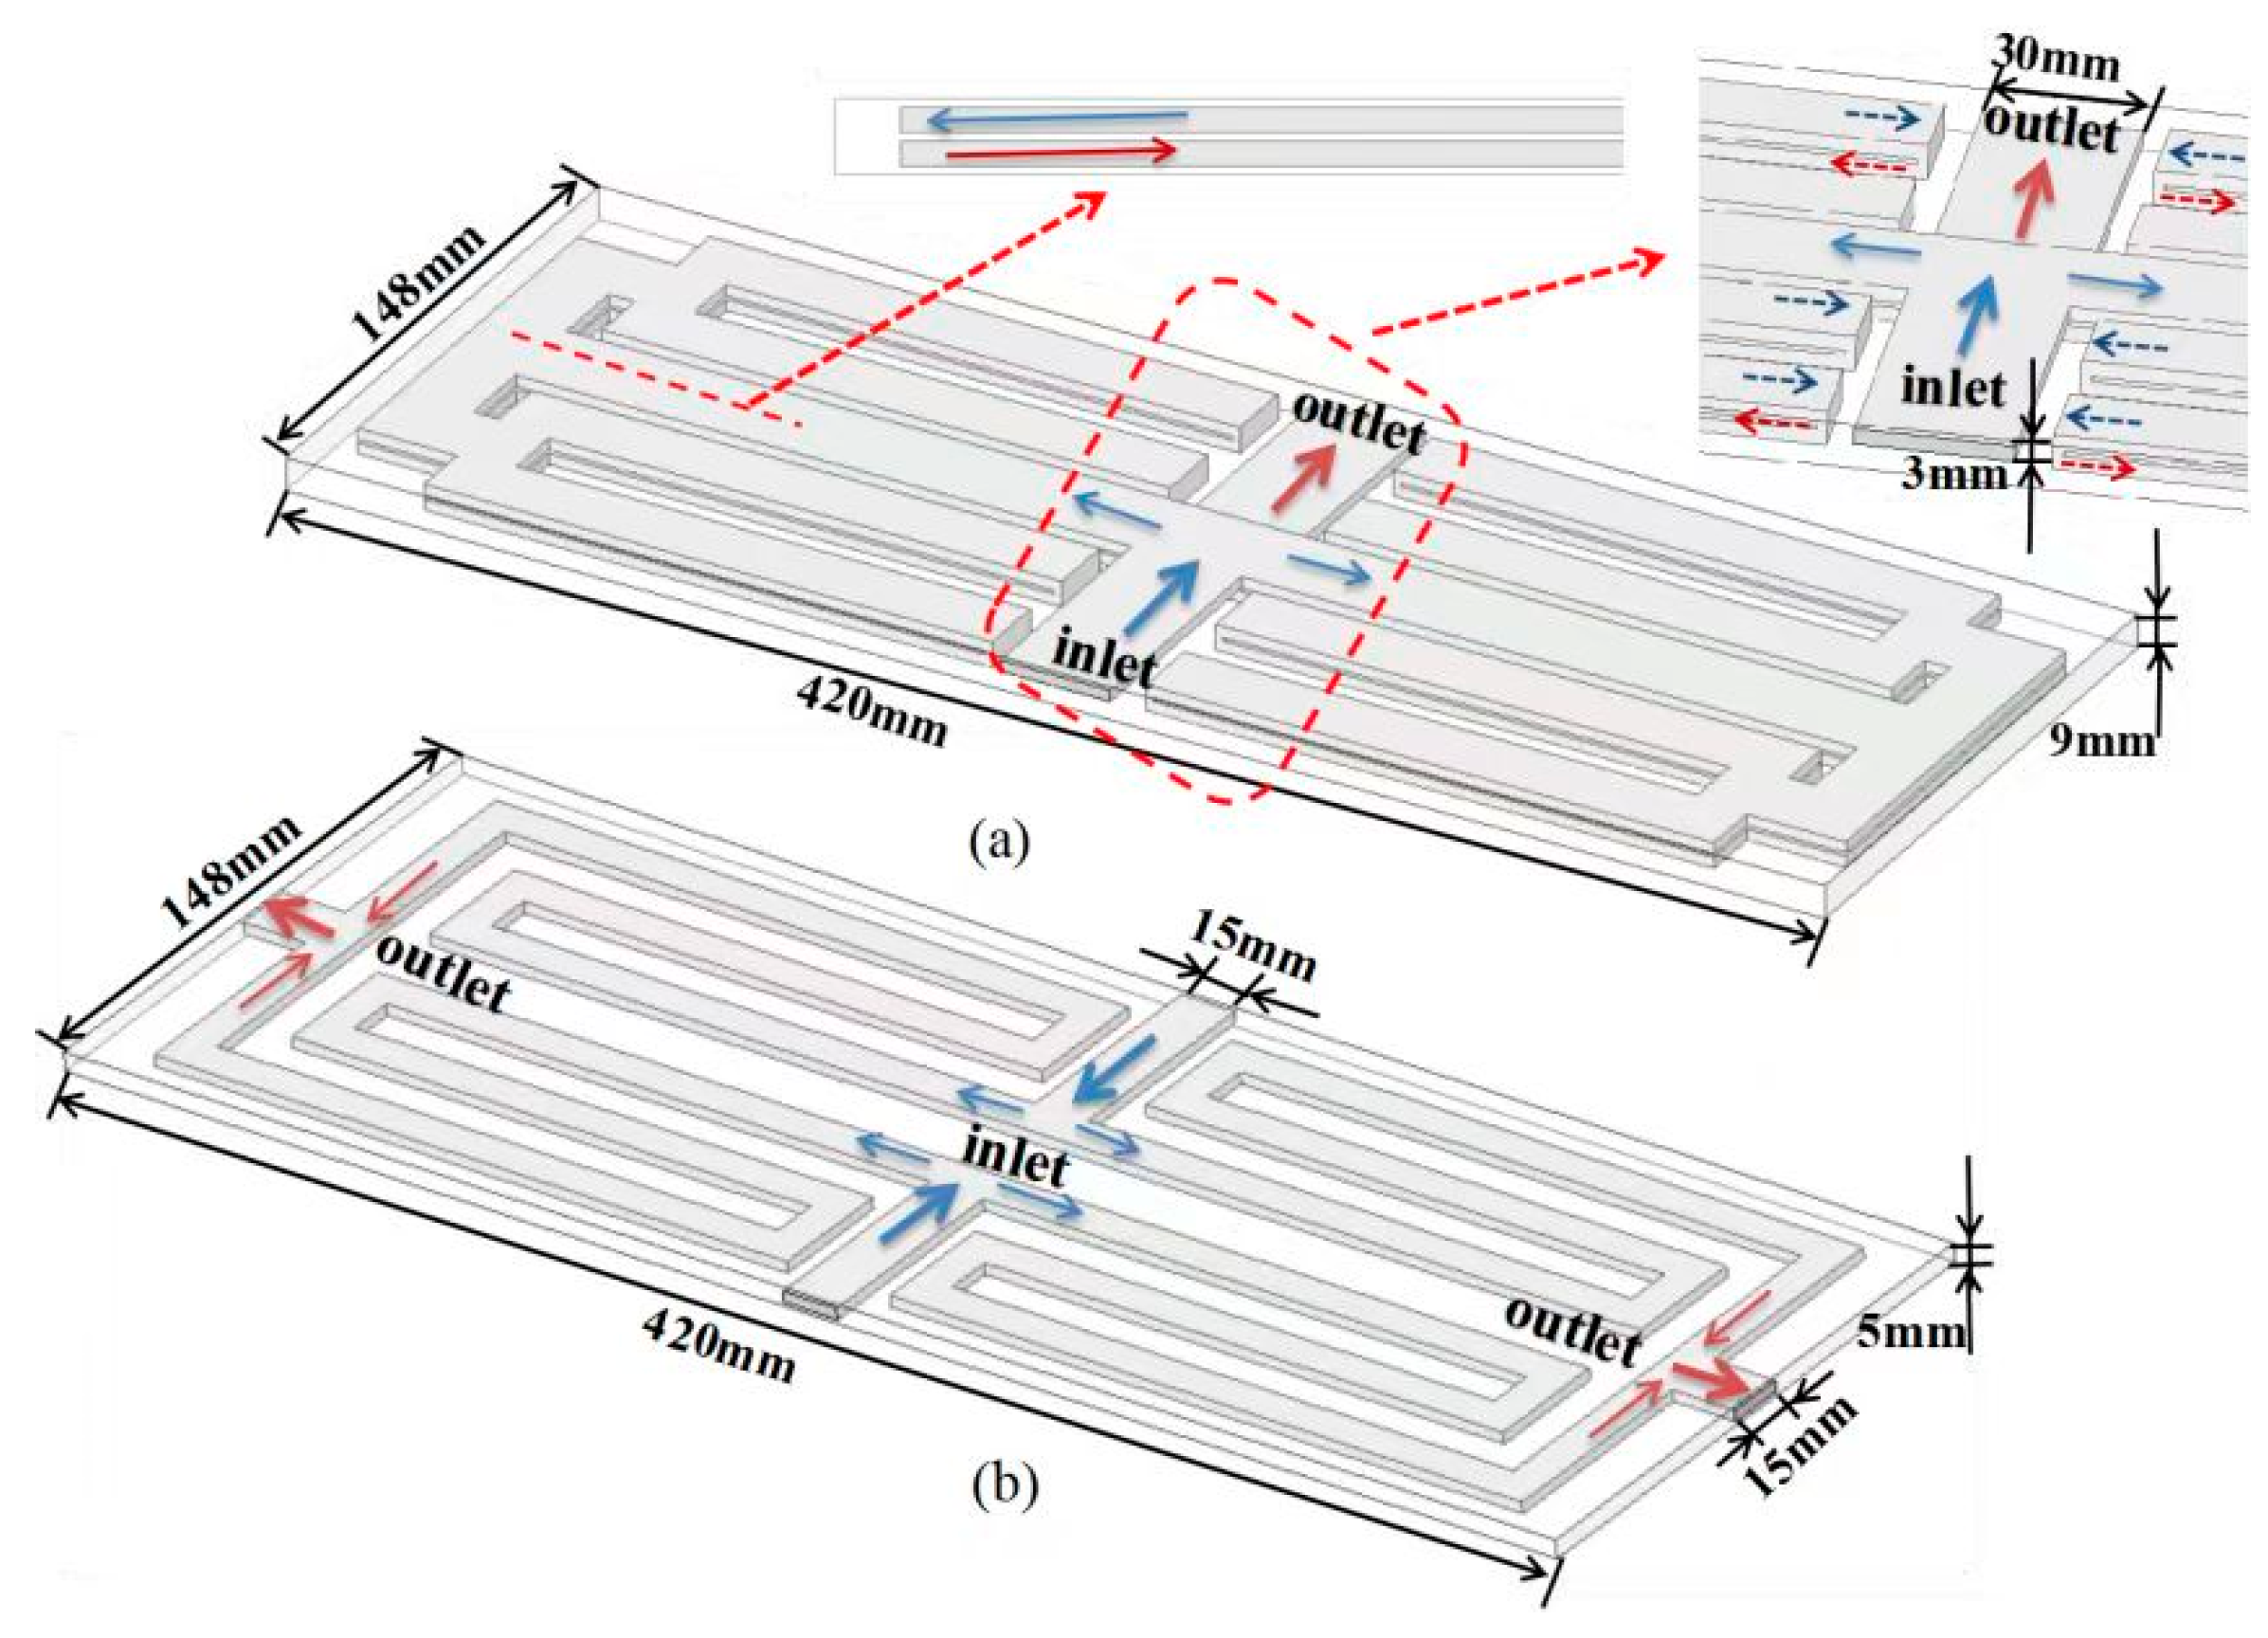
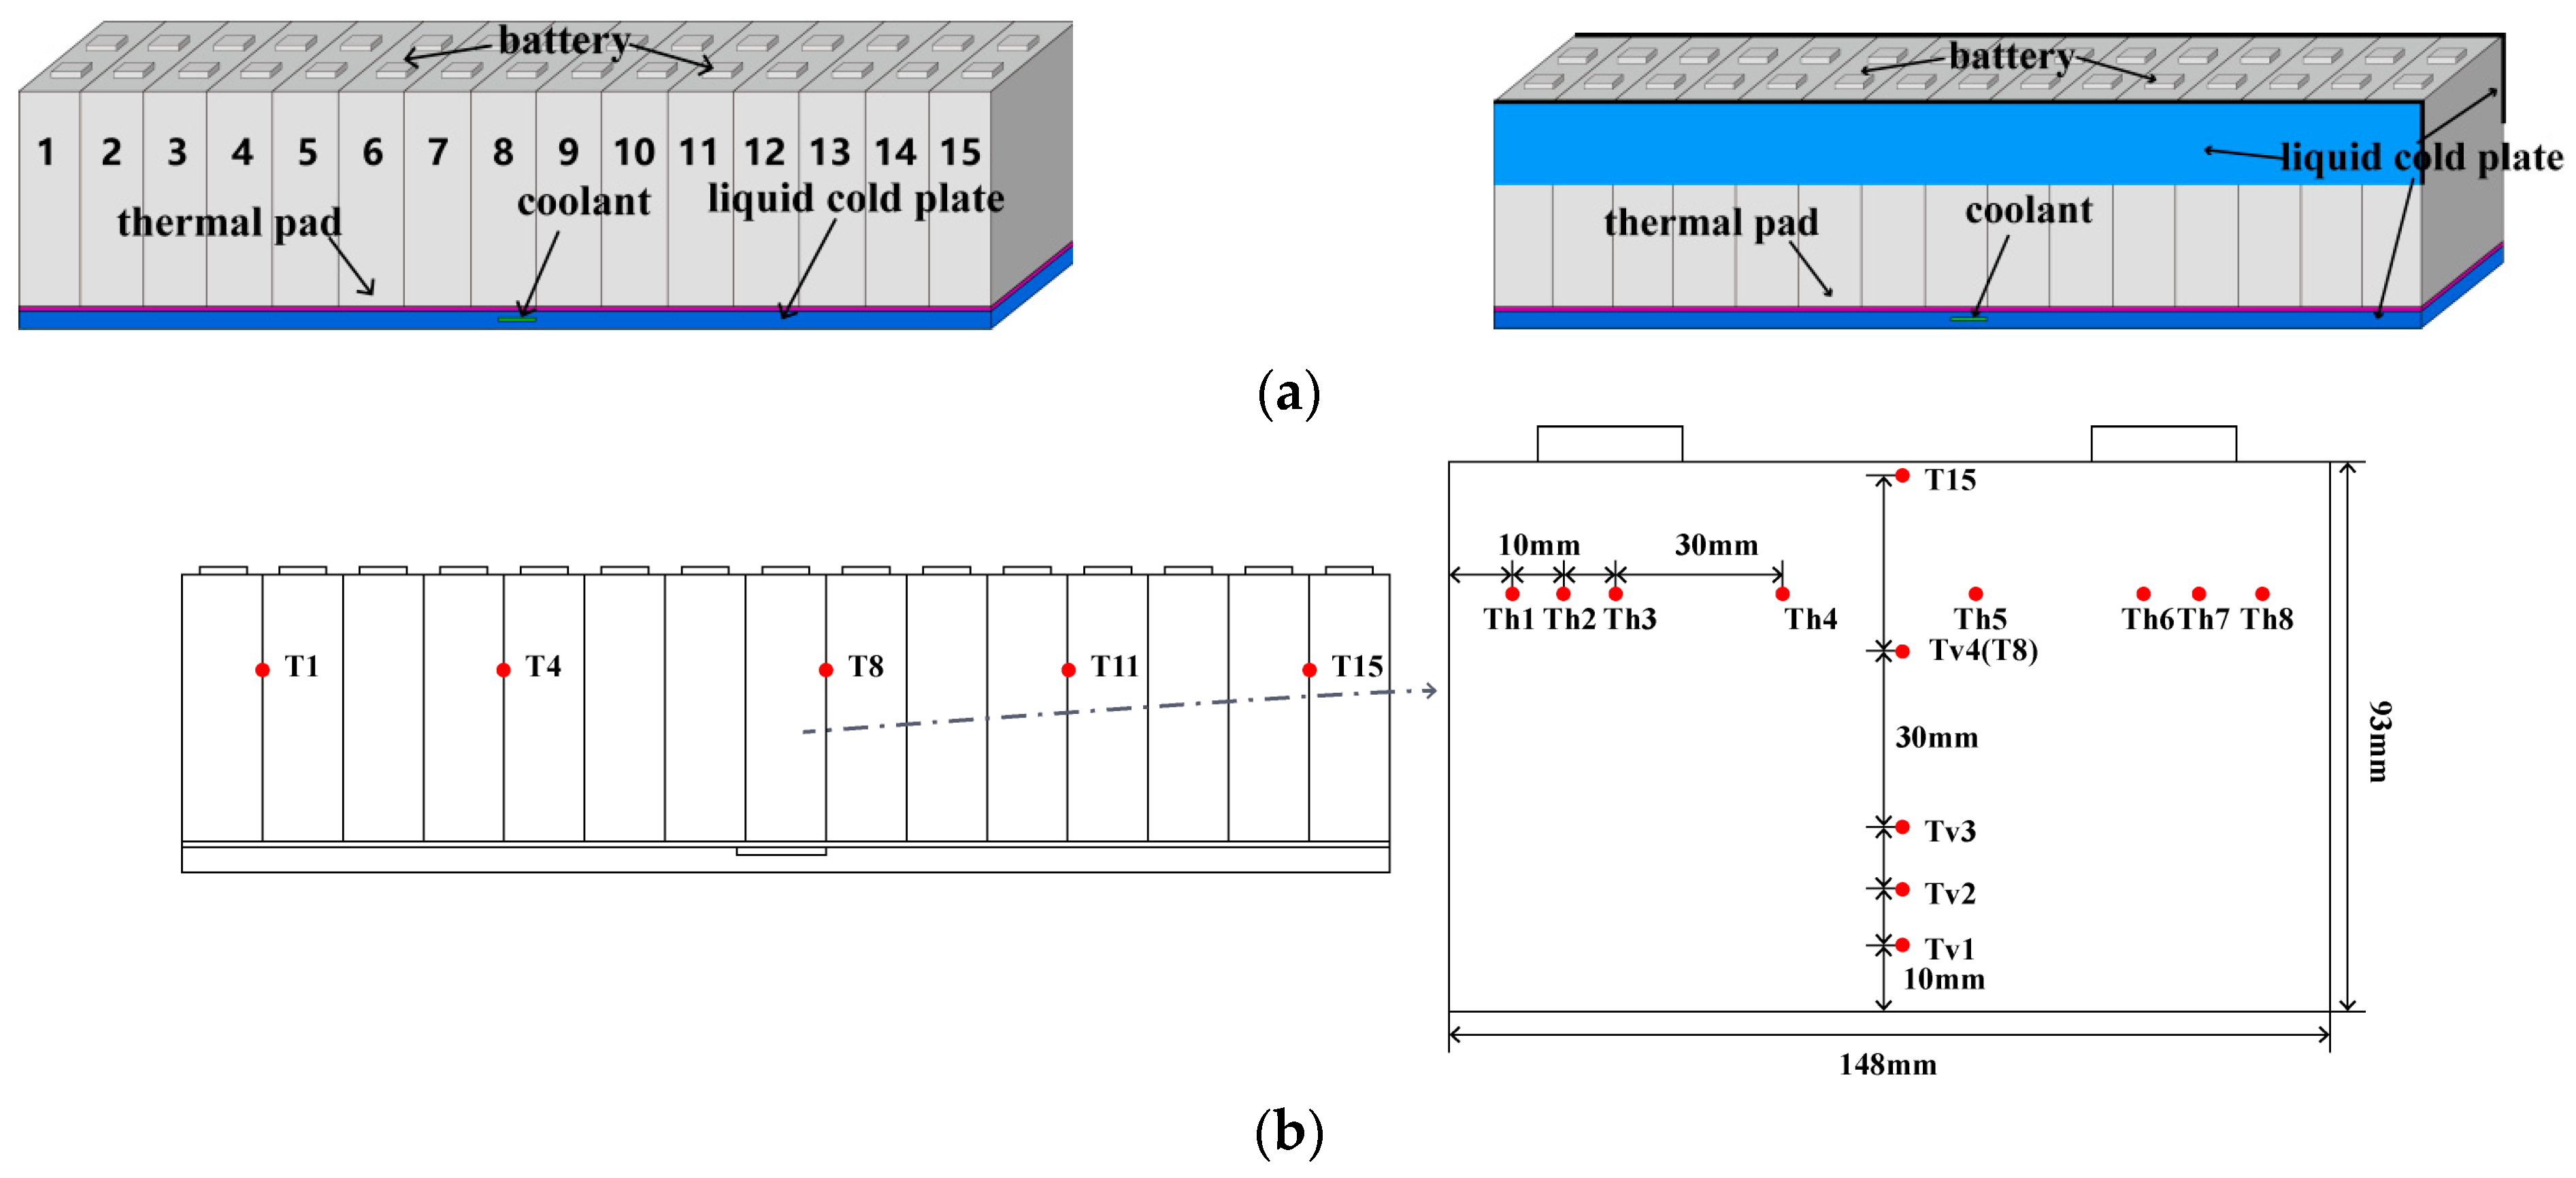
2. Geometric Model
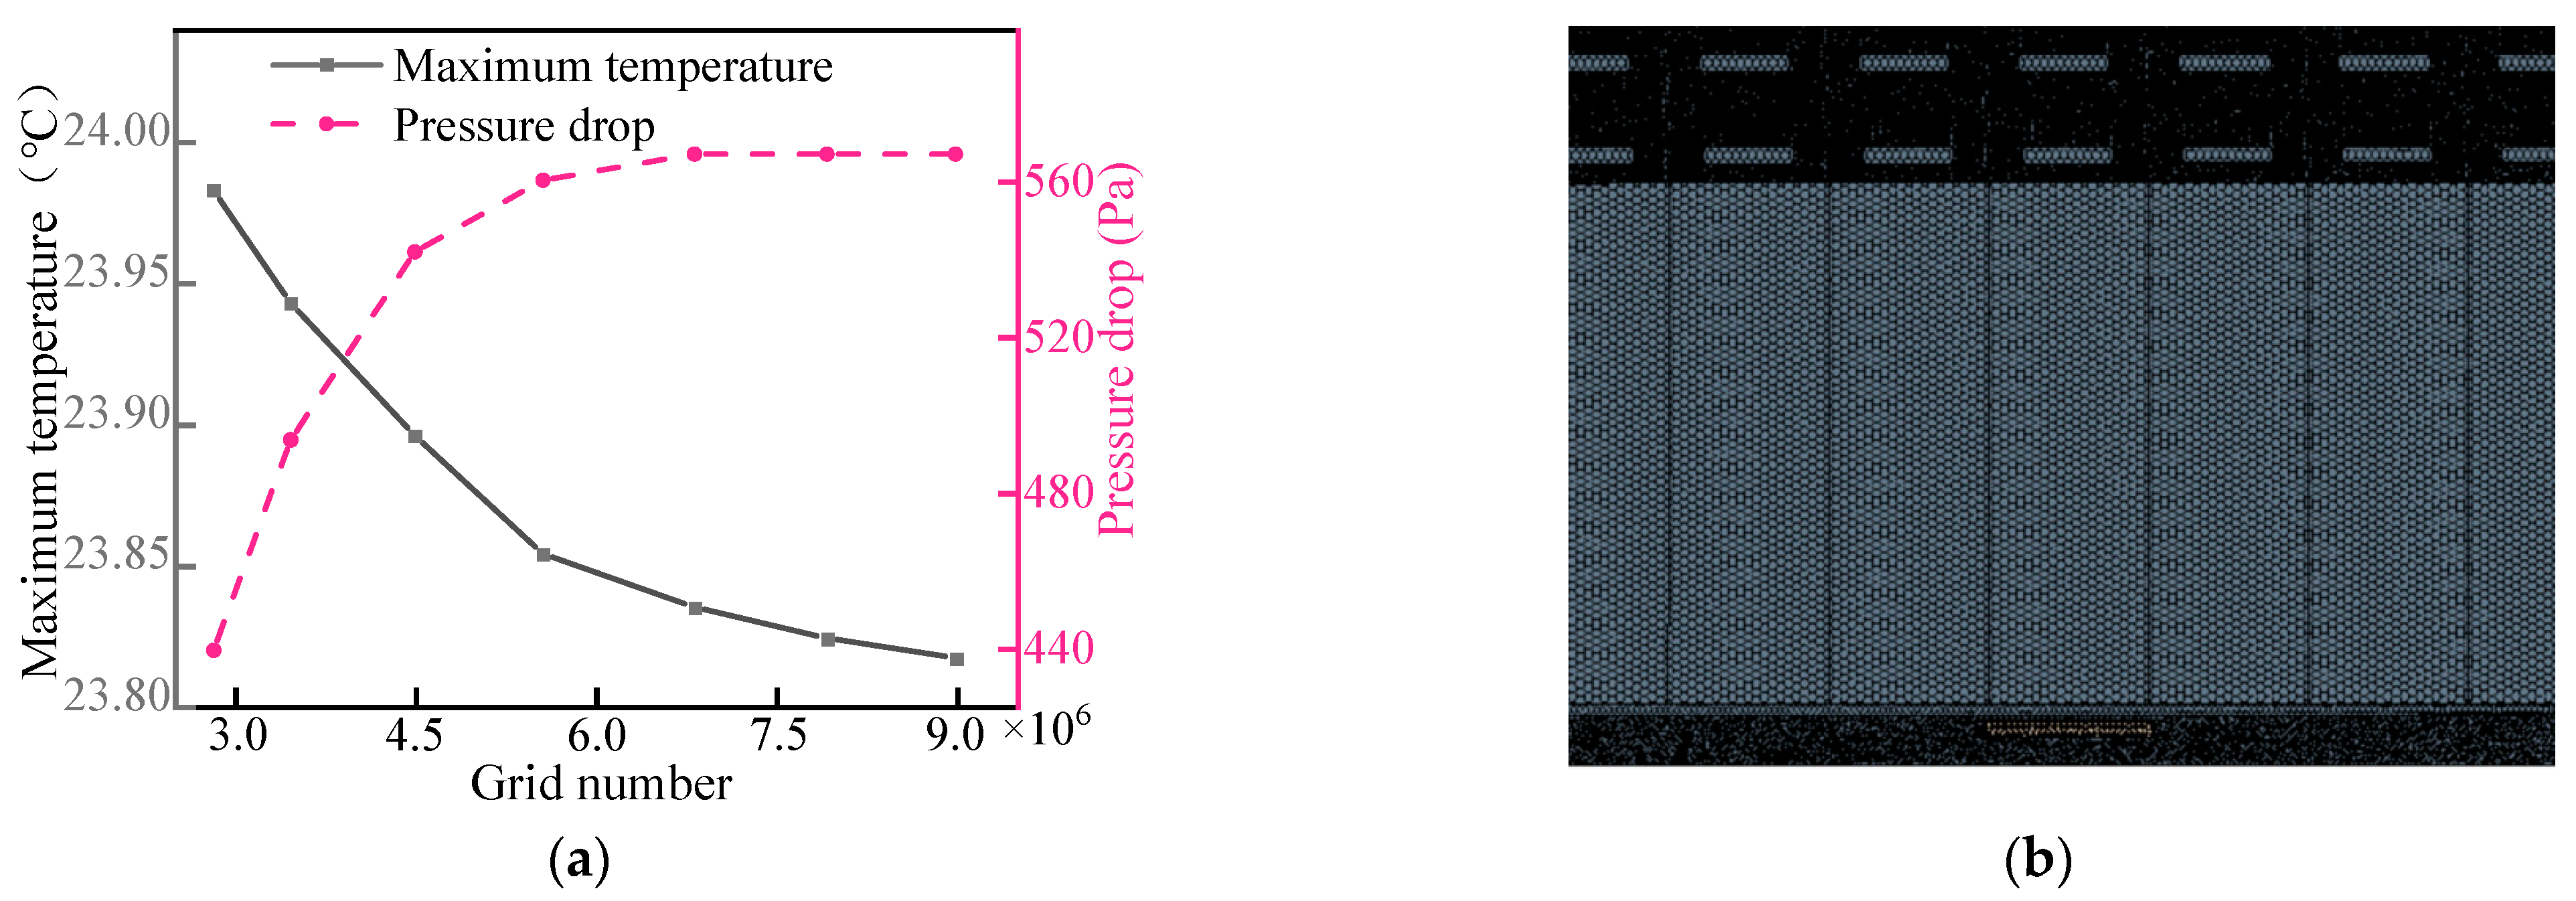
3. Numerical Analysis
3.1. Numerical Model
- (1)
- The cold plate is homogeneous and isotropic.
- (2)
- With the exception of the upper surfaces, the other five surfaces of the cold plate are assumed to be adiabatic.
- (3)
- Single-phase, incompressible, and steady flow are assumed.
- (4)
- The thermophysical properties of fluid and solid are independent of temperature.
3.2. Validity of the Numerical Model
4. Results and Discussion
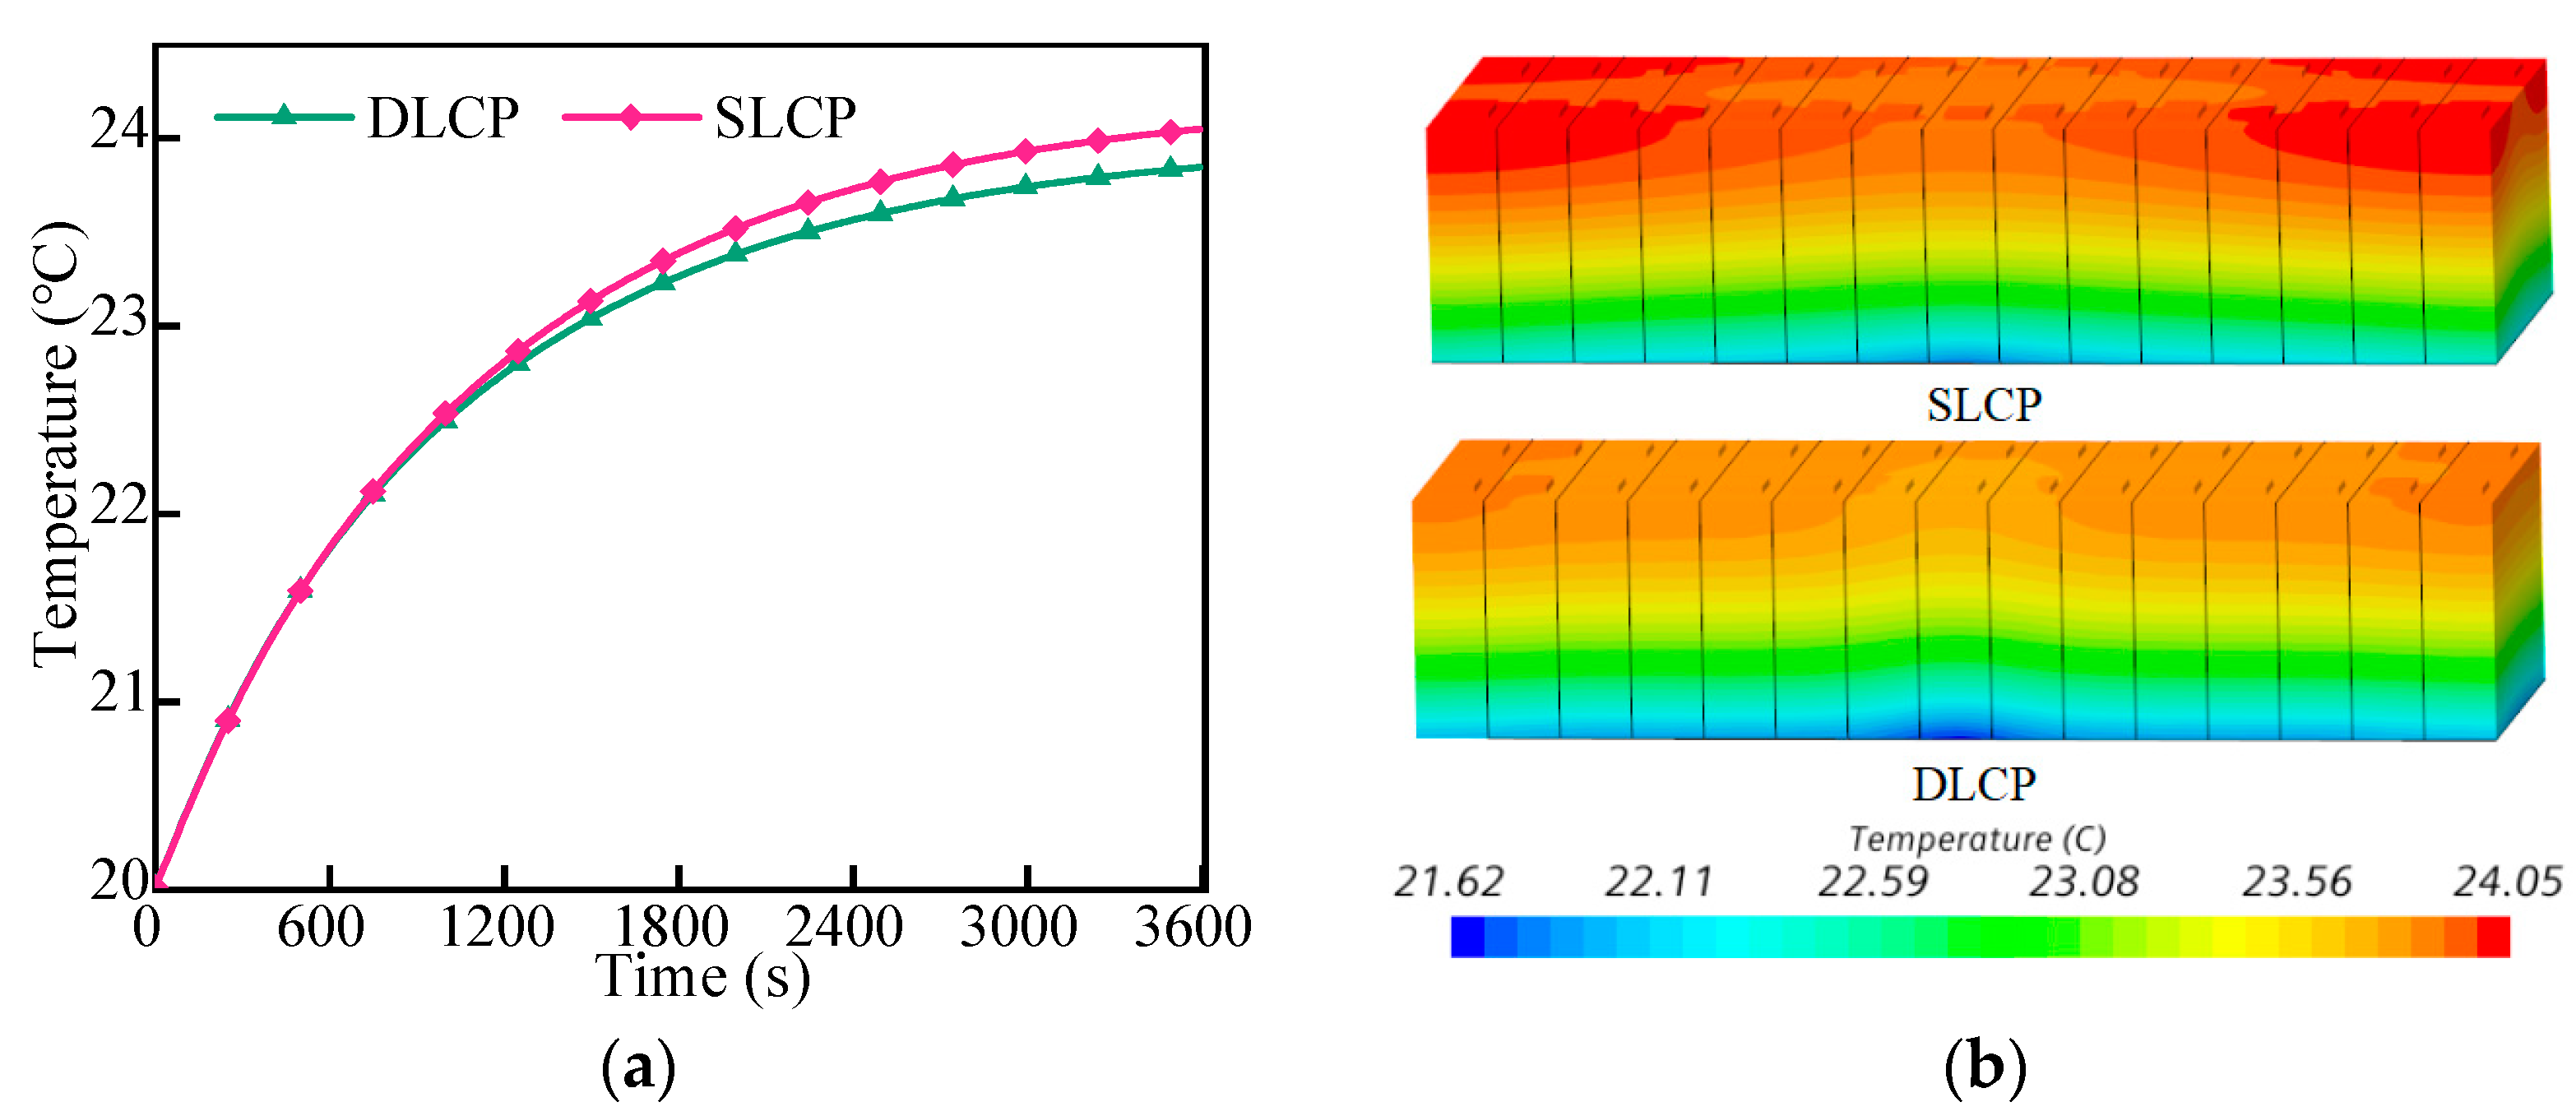
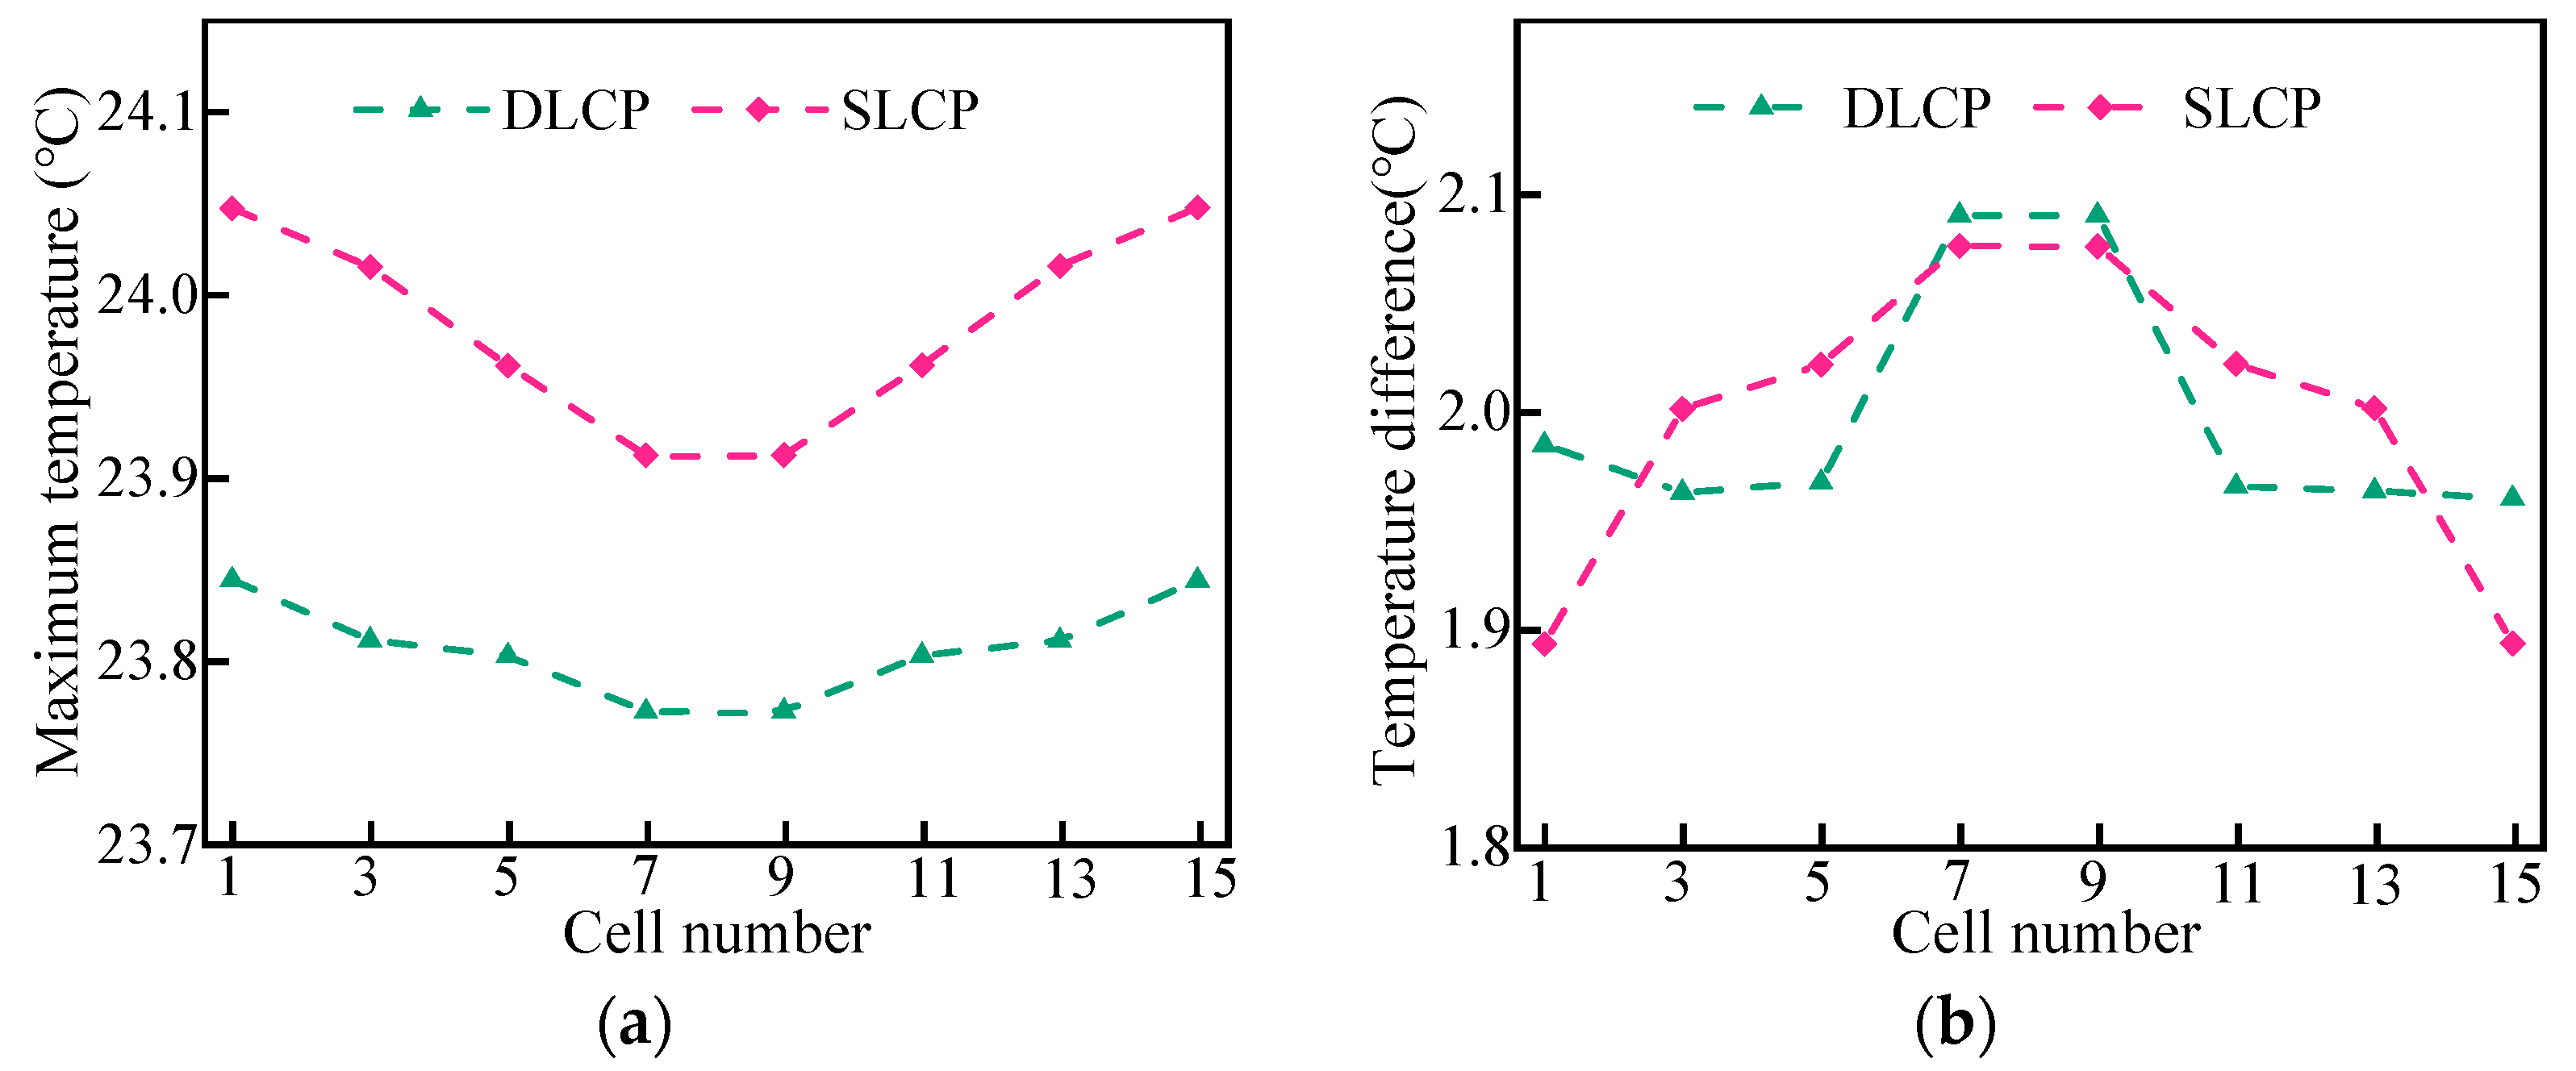
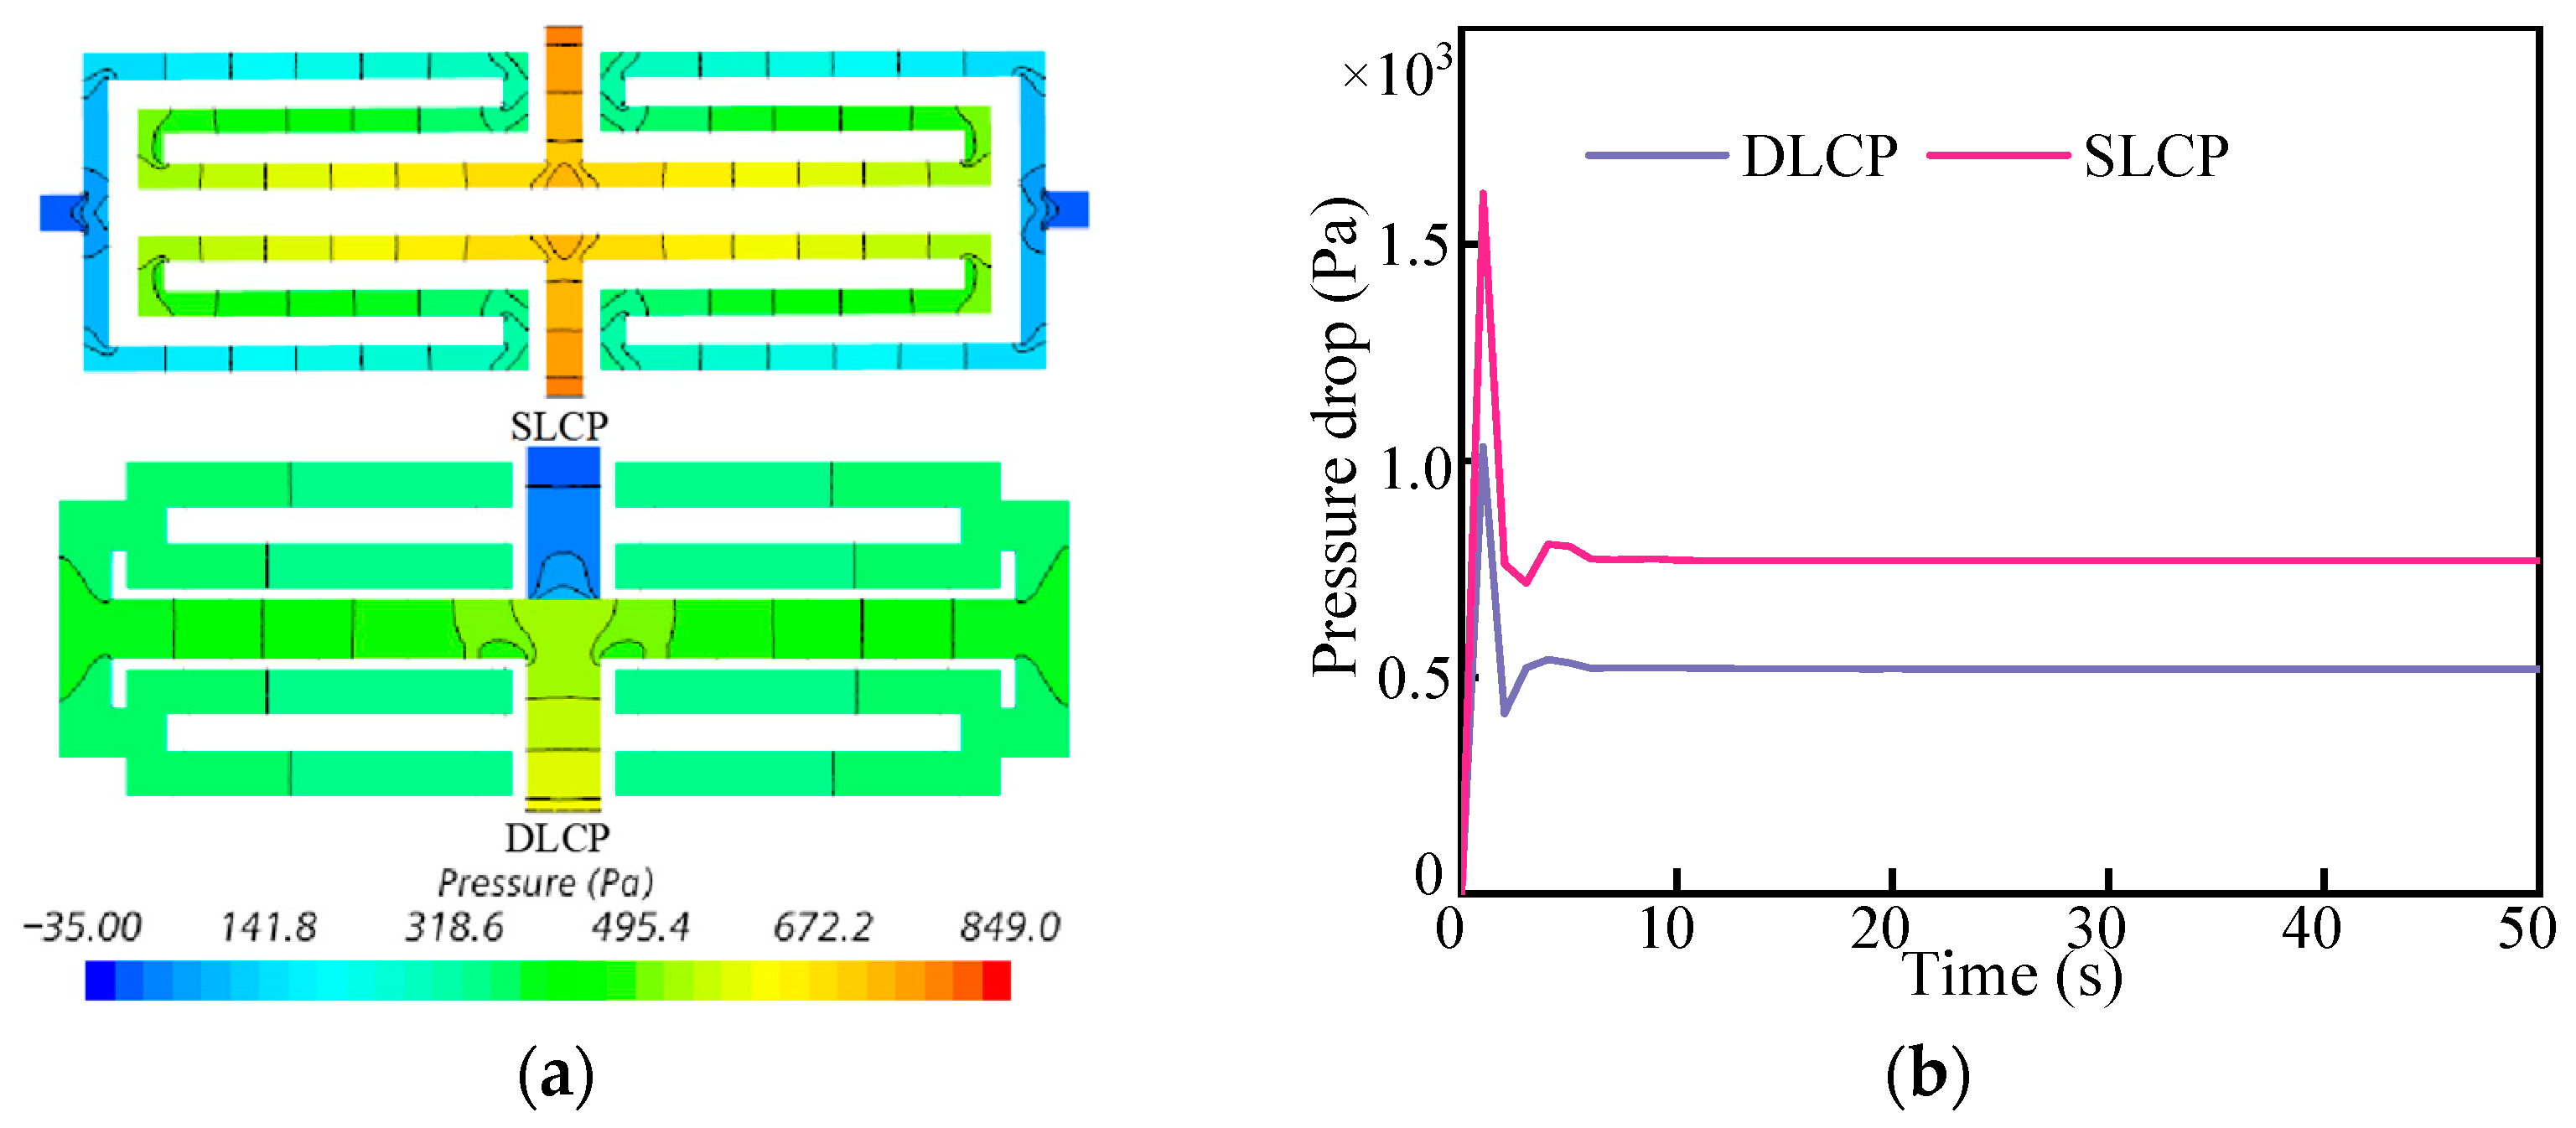
4.1. Cooling Effect of Different Channel Structures
4.2. Cooling Effect at Different Discharge Rates
4.3. Effect of Coolant Flow Rate and Temperature
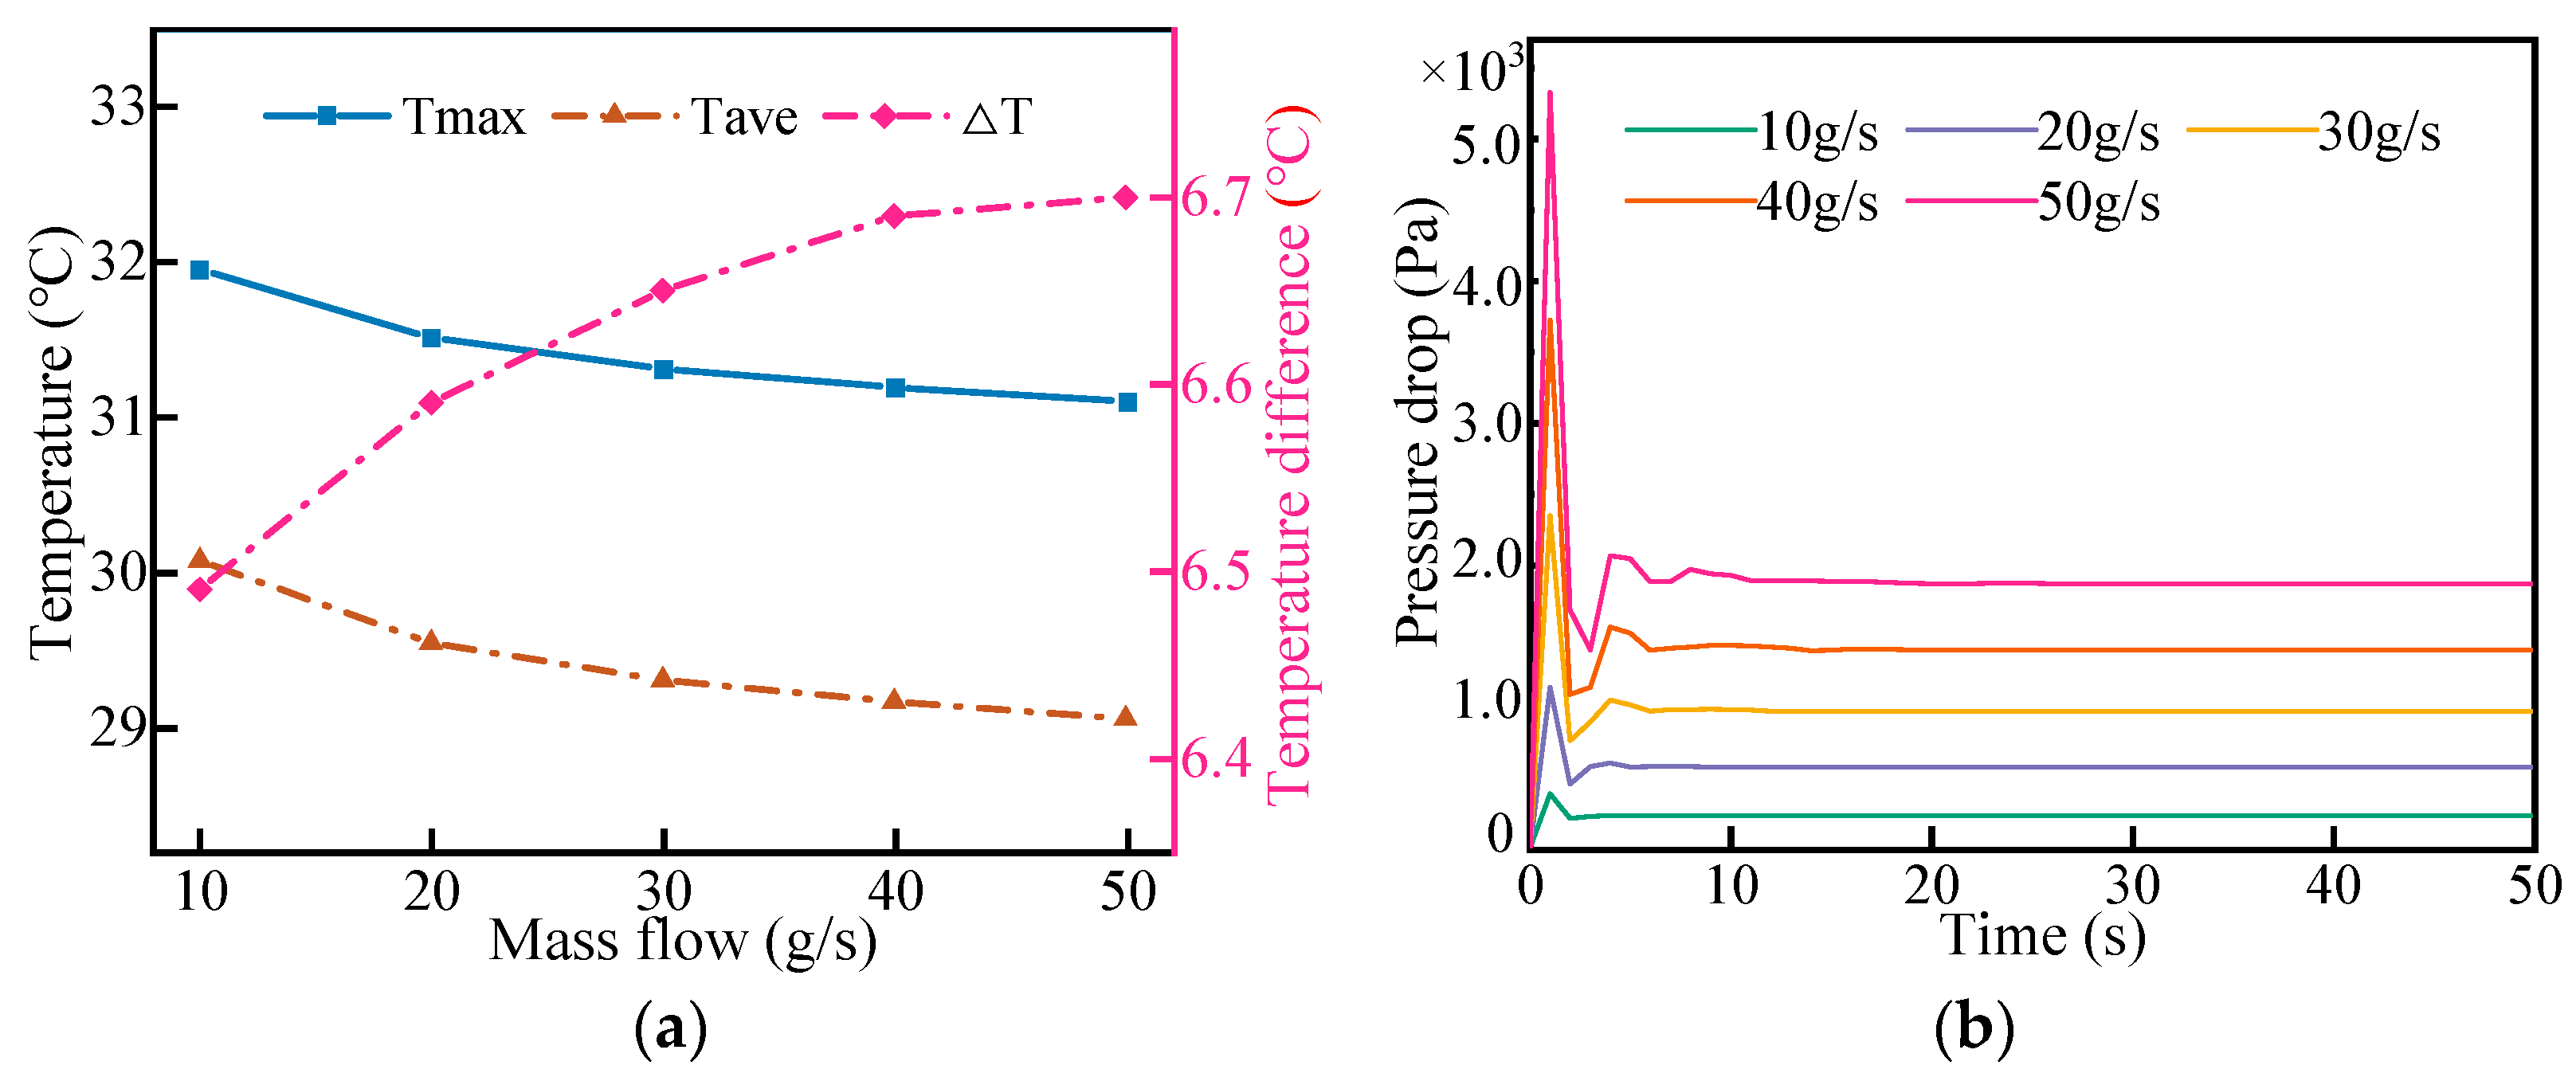
4.3.1. Effect of Coolant Flow Rate
4.3.2. Effect of Coolant Temperature
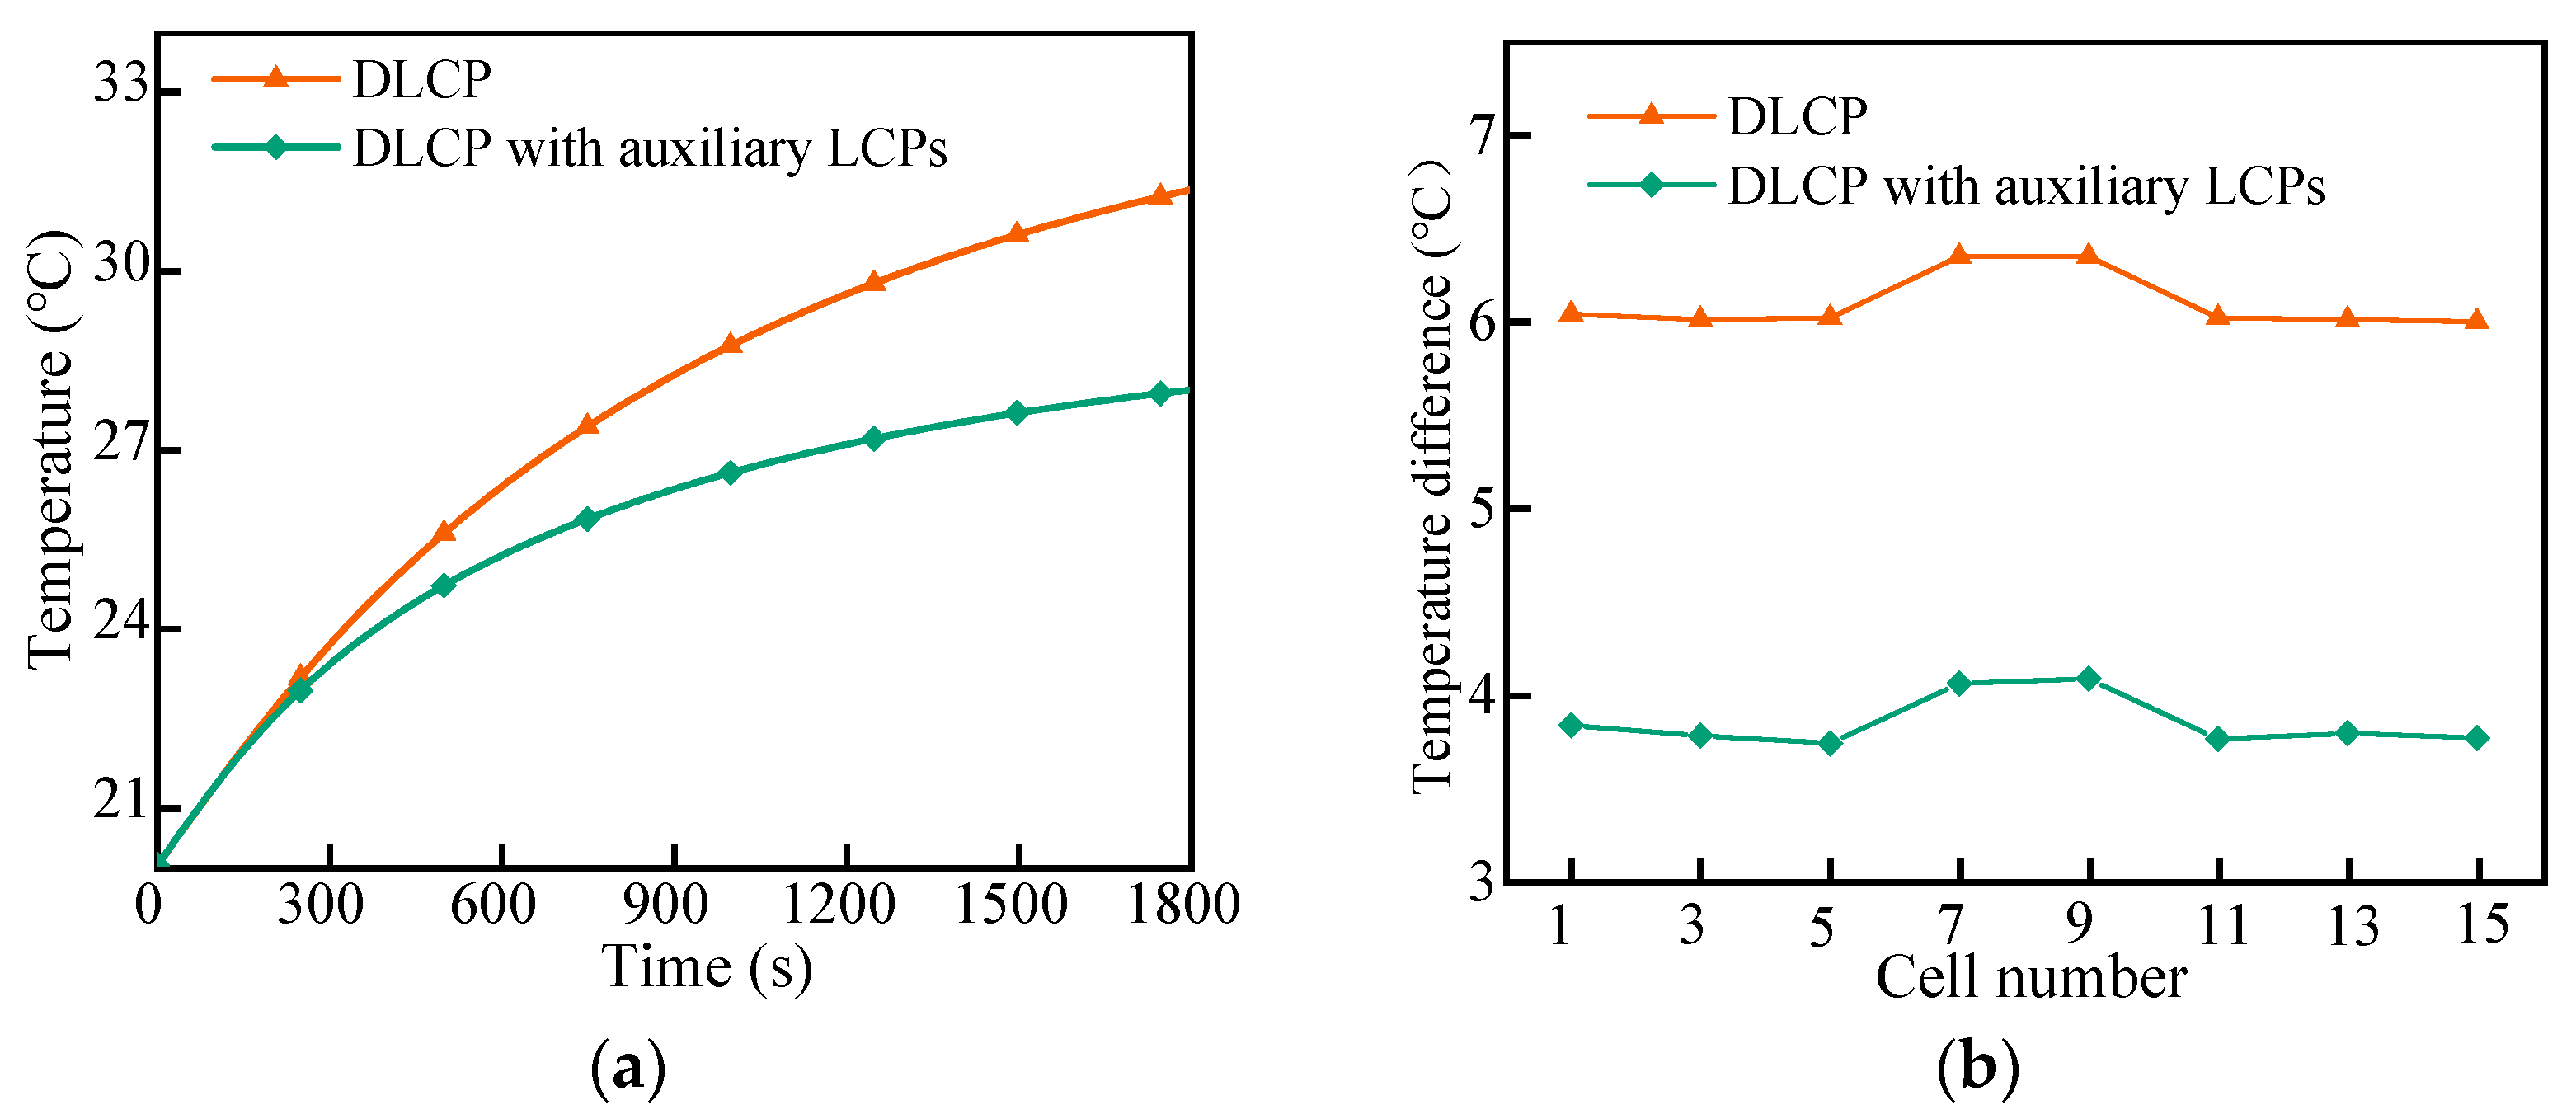
4.4. Effect of Adding Auxiliary Cold Plate
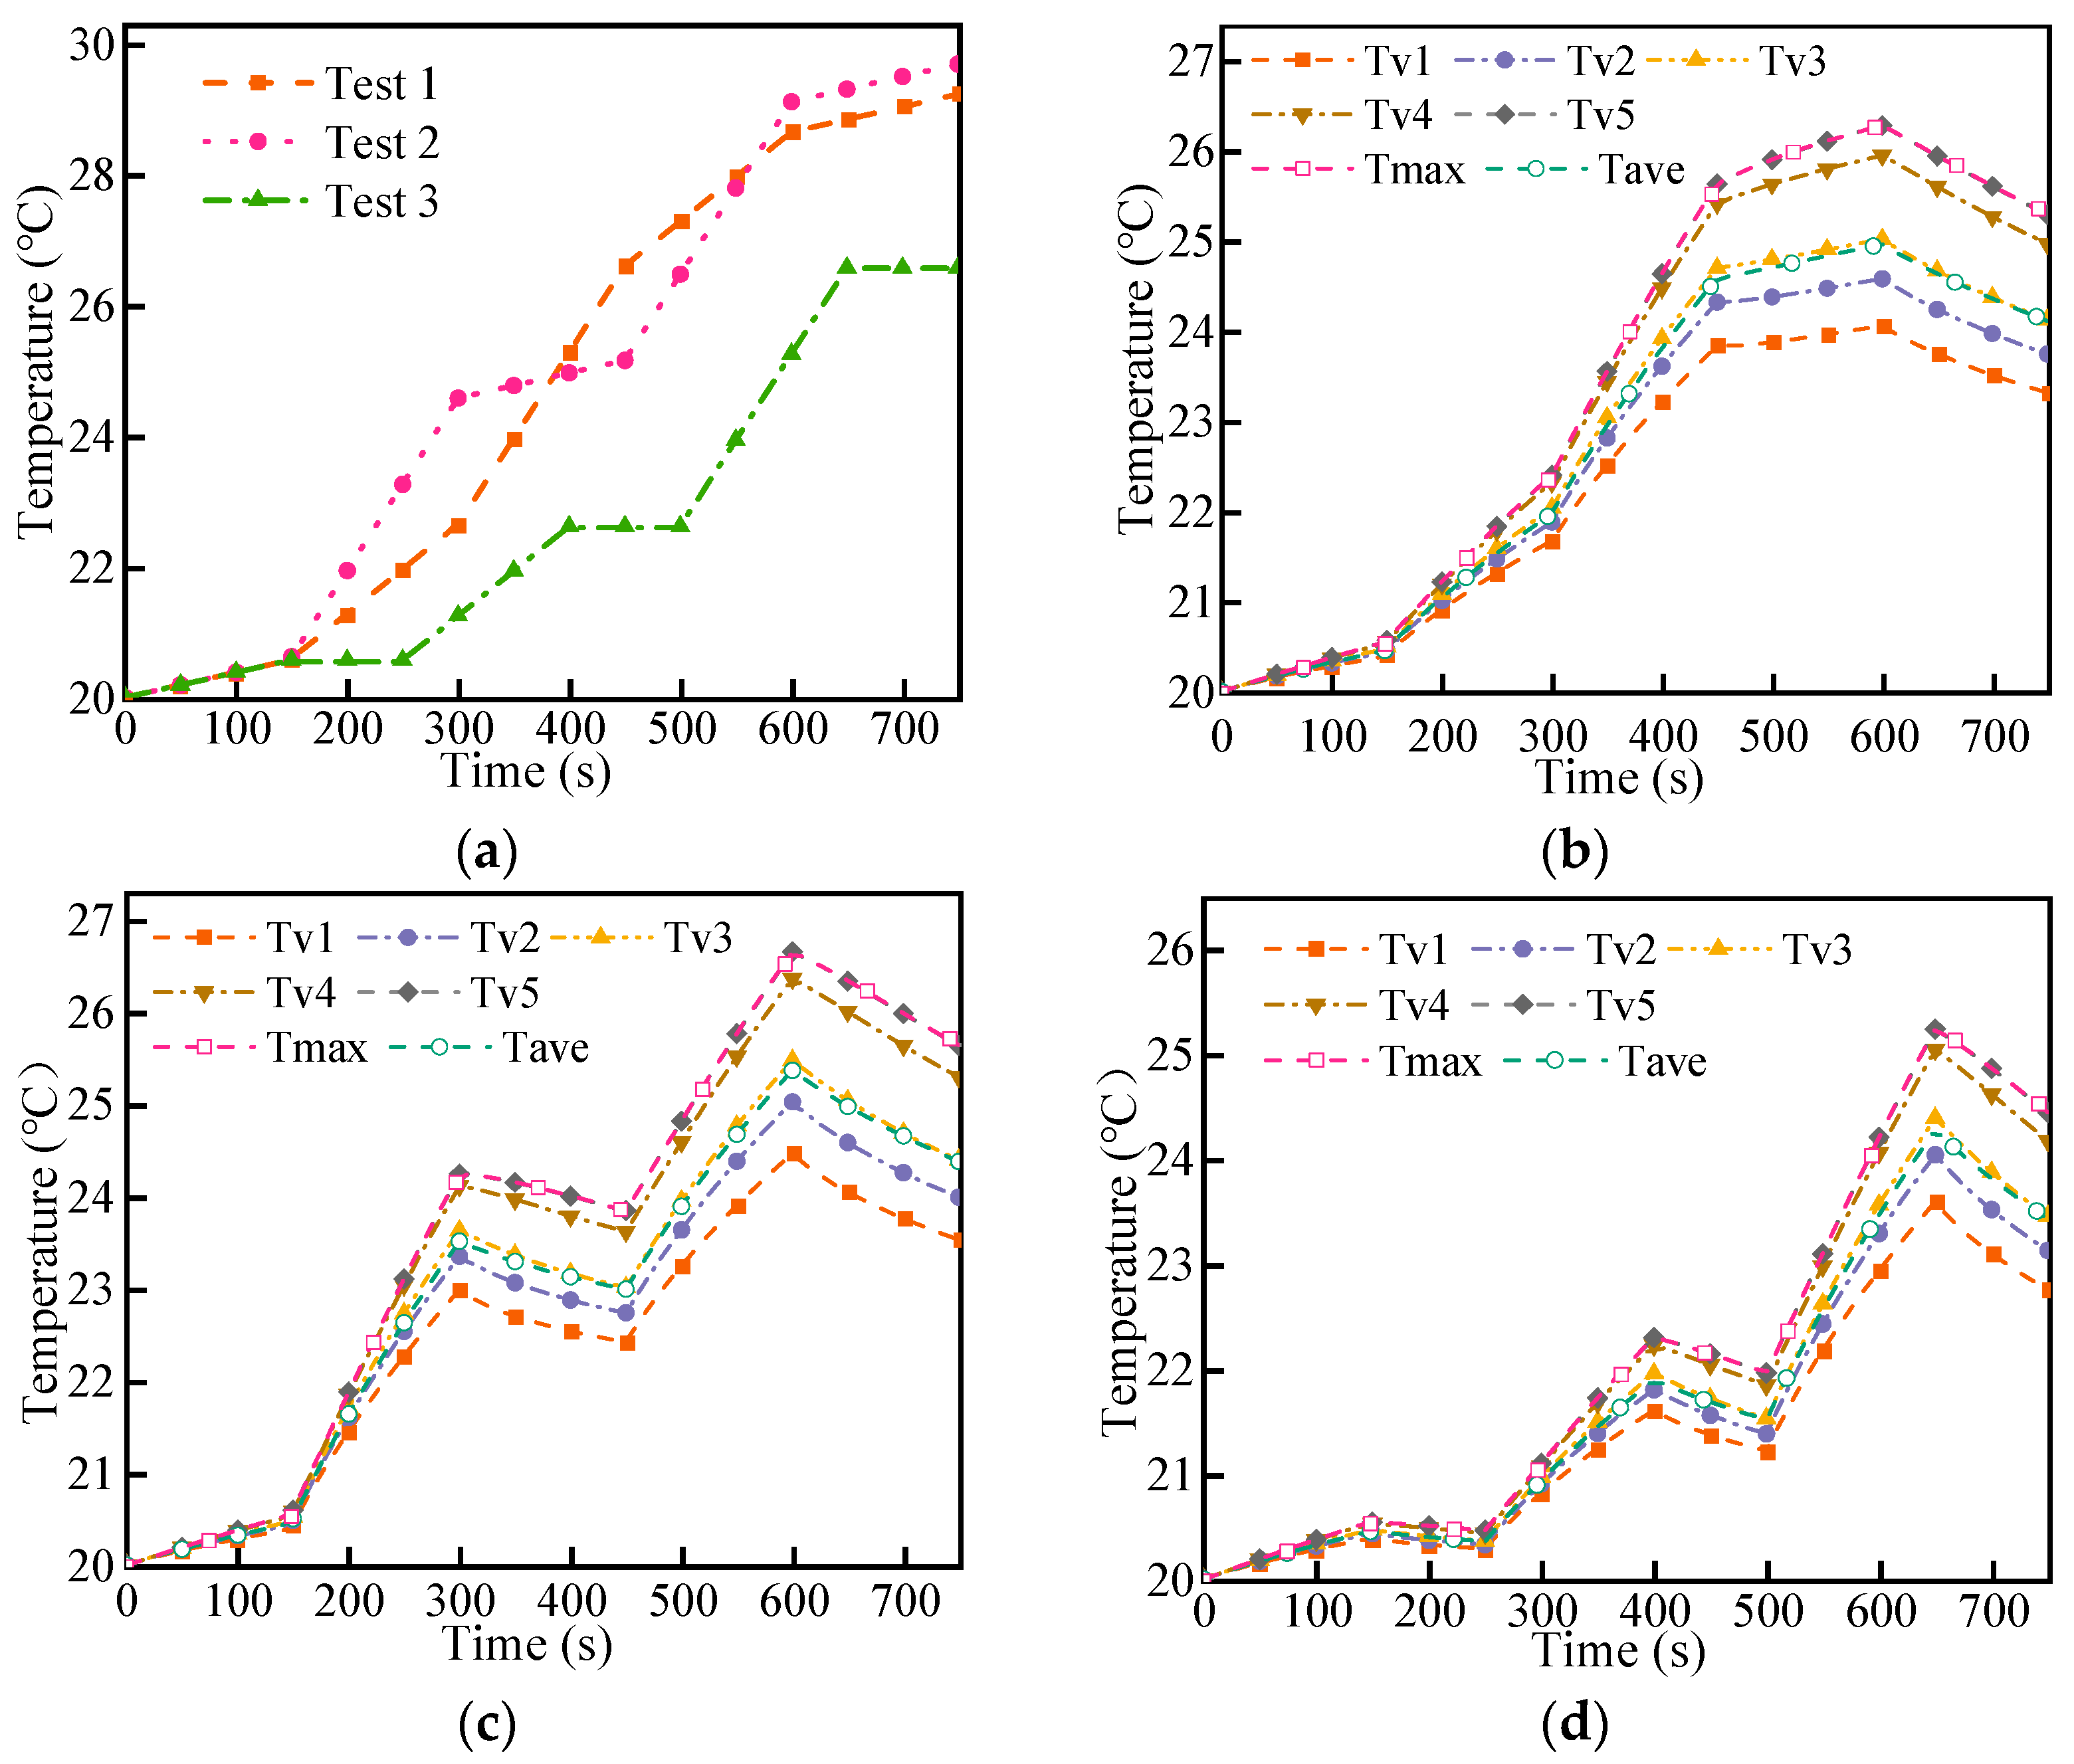
4.5. Effect of Non-Constant Discharge
5. Conclusions
- (1)
- When the discharge rate was 1C, the maximum temperature and temperature difference in the DLCP were 0.2 °C and 0.1 °C lower than those of the SLCP, respectively. The pressure drop of the DLCP liquid cooling system was 26% lower than that of the SLCP system under the same initial conditions. The comparison indicates that DLCP has better comprehensive cooling performance compared to SLCP.
- (2)
- Increasing the coolant flow rate improved the cooling performance. When the mass flow rate reached 30 g/s, the maximum temperature of the cell and the temperature difference tended to vary gently. Considering the energy consumption, a mass outflow rate of 20 g/s is more appropriate. Reducing the temperature of the coolant effectively reduced the maximum temperature of the LBM but caused a large temperature difference between cells. Therefore, the temperature of the coolant should be controlled to be close to the initial temperature of the battery, which is 20 °C.
- (3)
- When the battery discharge rate was 2C, the liquid cooling system with an auxiliary cold plate effectively controlled the maximum high temperature of the LBM within 28 °C, and the temperature difference between the cells was maintained at approximately 4 °C. In the case of high-rate discharges, the cooling performance of the liquid cooling system can be effectively improved by increasing the contact area between the LCP and the LBM.
- (4)
- When the current was not constant, the temperature difference in the cell increased with the increase in temperature. When the heating power of the cell was reduced, the larger internal temperature difference in the cell at higher temperatures favored a rapid decrease in cell temperature.
Author Contributions
Funding
Data Availability Statement
Conflicts of Interest
References
- Fan, X.; Meng, C.; Yang, Y.W.; Lin, J.S.; Li, W.Y.; Zhao, Y.R.; Xie, S.; Jiang, C.X. Numerical optimization of the cooling effect of a bionic fishbone channel liquid cooling plate for a large prismatic lithium-ion battery pack with high discharge rate. J. Energy Storage 2023, 72, 108239. [Google Scholar] [CrossRef]
- Muratori, M.; Alexander, M.; Arent, D.; Bazilian, M.; Cazzola, P.; Dede, E.M.; Farrell, J.; Gearhart, C.; Greene, D.; Jenn, A. The rise of electric vehicles—2020 status and future expectations. Prog. Energy 2021, 3, 022002. [Google Scholar] [CrossRef]
- He, P.; Lu, H.; Fan, Y.W.; Ruan, H.D.; Wang, C.Y.; Zhu, Y.F. Numerical investigation on a lithium-ion battery thermal management system utilizing a double-layered I-shaped channel liquid cooling plate exchanger. Int. J. Therm. Sci. 2023, 187, 108200. [Google Scholar] [CrossRef]
- Guo, Z.; Xu, J.; Xu, Z.; Mubashir, M.; Wang, H.; Mei, X. A three-heat-source electro-thermal coupled model for fast estimation of the temperature distribution of a lithium-ion battery cell. IEEE Trans. Transp. Electrif. 2021, 8, 288–297. [Google Scholar] [CrossRef]
- Tan, X.; Lyu, P.; Fan, Y.; Rao, J.; Ouyang, K. Numerical investigation of the direct liquid cooling of a fast-charging lithium-ion battery pack in hydrofluoroether. Appl. Therm. Eng. 2021, 196, 117279. [Google Scholar] [CrossRef]
- Mevawalla, A.; Shabeer, Y.; Tran, M.K.; Panchal, S.; Fowler, M.; Fraser, R. Thermal modelling utilizing multiple experimentally measurable parameters. Batteries 2022, 8, 147. [Google Scholar] [CrossRef]
- Xie, Y.; Liu, Y.; Fowler, M.; Tran, M.K.; Panchal, S.; Li, W.; Zhang, Y. Enhanced optimization algorithm for the structural design of an air-cooled battery pack considering battery lifespan and consistency. Int. J. Energy Res. 2022, 46, 24021–24044. [Google Scholar] [CrossRef]
- Zhao, C.; Sousa, A.C.; Jiang, F. Minimization of thermal non-uniformity in lithium-ion battery pack cooled by channeled liquid flow. Int. J. Heat Mass Transf. 2019, 129, 660–670. [Google Scholar] [CrossRef]
- Wu, W.; Ye, G.; Zhang, G.; Yang, X. Composite phase change material with room-temperature-flexibility for battery thermal management. Chem. Eng. J. 2022, 428, 131116. [Google Scholar] [CrossRef]
- Kim, J.; Oh, J.; Lee, H. Review on battery thermal management system for electric vehicles. Appl. Therm. Eng. 2019, 149, 192–212. [Google Scholar] [CrossRef]
- Wu, S.; Lao, L.; Wu, L.; Liu, L.; Lin, C.; Zhang, Q. Effect analysis on integration efficiency and safety performance of a battery thermal management system based on direct contact liquid cooling. Appl. Therm. Eng. 2022, 201, 117788. [Google Scholar] [CrossRef]
- Xin, S.; Wang, C.; Xi, H. Thermal management scheme and optimization of cylindrical lithium-ion battery pack based on air cooling and liquid cooling. Appl. Therm. Eng. 2023, 224, 120100. [Google Scholar] [CrossRef]
- Chen, D.; Jiang, J.; Kim, G.-H.; Yang, C.; Pesaran, A. Comparison of different cooling methods for lithium ion battery cells. Appl. Therm. Eng. 2016, 94, 846–854. [Google Scholar] [CrossRef]
- Babapoor, A.; Azizi, M.; Karimi, G. Thermal management of a Li-ion battery using carbon fiber-PCM composites. Appl. Therm. Eng. 2015, 82, 281–290. [Google Scholar] [CrossRef]
- Yang, H.; Li, M.; Wang, Z.; Ma, B. A compact and lightweight hybrid liquid cooling system coupling with Z-type cold plates and PCM composite for battery thermal management. Energy 2023, 263, 126026. [Google Scholar] [CrossRef]
- Wang, Y.; Gao, Q.; Wang, G.; Lu, P.; Zhao, M.; Bao, W. A review on research status and key technologies of battery thermal management and its enhanced safety. Int. J. Energy Res. 2018, 42, 4008–4033. [Google Scholar] [CrossRef]
- Deng, Y.; Feng, C.; Jiaqiang, E.; Zhu, H.; Chen, J.; Wen, M.; Yin, H. Effects of different coolants and cooling strategies on the cooling performance of the power lithium ion battery system: A review. Appl. Therm. Eng. 2018, 142, 10–29. [Google Scholar] [CrossRef]
- Wang, R.; Wang, J.; Lijin, B.; Zhu, Z. Parameterization investigation on the microchannel heat sink with slant rectangular ribs by numerical simulation. Appl. Therm. Eng. 2018, 133, 428–438. [Google Scholar] [CrossRef]
- Wang, R.; Yuan, W.; Wang, J.; Zhu, Z. Parametric investigation on a micro-array heat sink with staggered trapezoidal bumps. Micromachines 2019, 10, 845. [Google Scholar] [CrossRef]
- Xie, J.; Liu, X.; Zhang, G.; Yang, X. A novel strategy to optimize the liquid cooling plates for battery thermal management by precisely tailoring the internal structure of the flow channels. Int. J. Therm. Sci. 2023, 184, 107877. [Google Scholar] [CrossRef]
- Rao, Z.; Qian, Z.; Kuang, Y.; Li, Y. Thermal performance of liquid cooling based thermal management system for cylindrical lithium-ion battery module with variable contact surface. Appl. Therm. Eng. 2017, 123, 1514–1522. [Google Scholar] [CrossRef]
- Monika, K.; Chakraborty, C.; Roy, S.; Dinda, S.; Singh, S.A.; Datta, S.P. Parametric investigation to optimize the thermal management of pouch type lithium-ion batteries with mini-channel cold plates. Int. J. Heat Mass Transf. 2021, 164, 120568. [Google Scholar] [CrossRef]
- Lai, Y.; Wu, W.; Chen, K.; Wang, S.; Xin, C. A compact and lightweight liquid-cooled thermal management solution for cylindrical lithium-ion power battery pack. Int. J. Heat Mass Transf. 2019, 144, 118581. [Google Scholar] [CrossRef]
- Chen, S.; Zhang, G.; Zhu, J.; Feng, X.; Wei, X.; Ouyang, M.; Dai, H. Multi-objective optimization design and experimental investigation for a parallel liquid cooling-based Lithium-ion battery module under fast charging. Appl. Therm. Eng. 2022, 211, 118503. [Google Scholar] [CrossRef]
- Deng, T.; Ran, Y.; Yin, Y.; Chen, X.; Liu, P. Multi-objective optimization design of double-layered reverting cooling plate for lithium-ion batteries. Int. J. Heat Mass Transf. 2019, 143, 118580. [Google Scholar] [CrossRef]
- Wang, R.; Wang, J.; Yuan, W. Analysis and optimization of a microchannel heat sink with V-Ribs using nanofluids for micro solar cells. Micromachines 2019, 10, 620. [Google Scholar] [CrossRef]
- Kalkan, O.; Celen, A.; Bakirci, K.; Dalkilic, A.S. Experimental investigation of thermal performance of novel cold plate design used in a Li-ion pouch-type battery. Appl. Therm. Eng. 2021, 191, 116885. [Google Scholar] [CrossRef]
- Jiaqiang, E.; Han, D.; Qiu, A.; Zhu, H.; Deng, Y.; Chen, J.; Zhao, X.; Zuo, W.; Wang, H.; Chen, J. Orthogonal experimental design of liquid-cooling structure on the cooling effect of a liquid-cooled battery thermal management system. Appl. Therm. Eng. 2018, 132, 508–520. [Google Scholar]
- Wang, C.; Zhang, G.; Meng, L.; Li, X.; Situ, W.; Lv, Y.; Rao, M. Liquid cooling based on thermal silica plate for battery thermal management system. Int. J. Energy Res. 2017, 41, 2468–2479. [Google Scholar] [CrossRef]
- Ding, Y.; Ji, H.; Wei, M.; Liu, R. Effect of liquid cooling system structure on lithium-ion battery pack temperature fields. Int. J. Heat Mass Transf. 2022, 183, 122178. [Google Scholar] [CrossRef]
- Zhang, Y.; Wang, S.; Ding, P. Effects of channel shape on the cooling performance of hybrid micro-channel and slot-jet module. Int. J. Heat Mass Transf. 2017, 113, 295–309. [Google Scholar] [CrossRef]
- Huang, Y.; Mei, P.; Lu, Y.; Huang, R.; Yu, X.; Chen, Z.; Roskilly, A.P. A novel approach for Lithium-ion battery thermal management with streamline shape mini channel cooling plates. Appl. Therm. Eng. 2019, 157, 113623. [Google Scholar] [CrossRef]
- Du, J.; Wang, R.; Zhuo, Q.; Yuan, W. Heat transfer enhancement of Fe3O4-water nanofluid by the thermo-magnetic convection and thermophorestic effect. Int. J. Energy Res. 2022, 46, 9521–9532. [Google Scholar] [CrossRef]
- Wang, R.; Chen, T.; Qi, J.; Du, J.; Pan, G.; Huang, L. Investigation on the heat transfer enhancement by nanofluid under electric field considering electrophorestic and thermophoretic effect. Case Stud. Therm. Eng. 2021, 28, 101498. [Google Scholar] [CrossRef]
- Wang, G.; Zhang, Z.; Wang, R.; Zhu, Z. A review on heat transfer of nanofluids by applied electric field or magnetic field. Nanomaterials 2020, 10, 2386. [Google Scholar] [CrossRef] [PubMed]
- Liu, H.; Wei, Z.; He, W.; Zhao, J. Thermal issues about Li-ion batteries and recent progress in battery thermal management systems: A review. Energy Convers. Manag. 2017, 150, 304–330. [Google Scholar] [CrossRef]
- Zhang, X.; Li, Z.; Luo, L.; Fan, Y.; Du, Z. A review on thermal management of lithium-ion batteries for electric vehicles. Energy 2022, 238, 121652. [Google Scholar] [CrossRef]
- Zhao, G.; Wang, X.; Negnevitsky, M.; Li, C. An up-to-date review on the design improvement and optimization of the liquid-cooling battery thermal management system for electric vehicles. Appl. Therm. Eng. 2022, 219, 119626. [Google Scholar] [CrossRef]
- Yang, Y. Research on the Heat Dissipation Characteristics of Lithium-ion Power Battery System for Vehicles Based on Mini-channel Liquid Cooling. Ph.D. Thesis, Jiangsu University, Zhenjiang, China, 2021. [Google Scholar] [CrossRef]
- Chen, S.; Peng, X.; Bao, N.; Garg, A. A comprehensive analysis and optimization process for an integrated liquid cooling plate for a prismatic lithium-ion battery module. Appl. Therm. Eng. 2019, 156, 324–339. [Google Scholar] [CrossRef]
- Cicconi, P.; Landi, D.; Germani, M. Thermal analysis and simulation of a Li-ion battery pack for a lightweight commercial EV. Appl. Energy 2017, 192, 159–177. [Google Scholar] [CrossRef]
- Bernardi, D.; Pawlikowski, E.; Newman, J. A general energy balance for battery systems. J. Electrochem. Soc. 1985, 132, 5. [Google Scholar] [CrossRef]
- Yang, Y.; Li, W.; Xu, X.; Tong, G. Heat dissipation analysis of different flow path for parallel liquid cooling battery thermal management system. Int. J. Energy Res. 2020, 44, 5165–5176. [Google Scholar] [CrossRef]


| Specification | Parameters |
|---|---|
| Nominal capacity (Ah) | 40 |
| Nominal voltage (V) | 3.6 |
| Mass (g) | 825 ± 10 |
| Dimensions (mm) | 148 × 93 × 28 (length × width × thickness) |
| Density (kg/m3) | 2100 |
| Specific heat (J/kg·K) | 1030 |
| Thermal conductivity (W/(m·K)) | 18.7/18.7/1.8 |
| Preferences for inlet and outlet | One in and one out |
| Aluminum | 50/50 Glycol Water | Thermal Pad | |
|---|---|---|---|
| Density (kg/m3) | 2719 | 1065 | 1200 |
| Specific heat (J/kg·K) | 871 | 3494 | 800 |
| Thermal conductivity (W/(m·K)) | 202 | 0.419 | 2 |
| Dynamic viscosity (Pa.s) | — | 0.0035 |
| Discharge rate | 1C | 2C | 3C |
| Heat generation | 3.24 w | 11.48 w | 22.18 w |
Disclaimer/Publisher’s Note: The statements, opinions and data contained in all publications are solely those of the individual author(s) and contributor(s) and not of MDPI and/or the editor(s). MDPI and/or the editor(s) disclaim responsibility for any injury to people or property resulting from any ideas, methods, instructions or products referred to in the content. |
© 2023 by the authors. Licensee MDPI, Basel, Switzerland. This article is an open access article distributed under the terms and conditions of the Creative Commons Attribution (CC BY) license (https://creativecommons.org/licenses/by/4.0/).
Share and Cite
Xu, Y.; Wang, R. Numerical Study on a Liquid Cooling Plate with a Double-Layer Minichannel for a Lithium Battery Module. Micromachines 2023, 14, 2128. https://doi.org/10.3390/mi14112128
Xu Y, Wang R. Numerical Study on a Liquid Cooling Plate with a Double-Layer Minichannel for a Lithium Battery Module. Micromachines. 2023; 14(11):2128. https://doi.org/10.3390/mi14112128
Chicago/Turabian StyleXu, Yu, and Ruijin Wang. 2023. "Numerical Study on a Liquid Cooling Plate with a Double-Layer Minichannel for a Lithium Battery Module" Micromachines 14, no. 11: 2128. https://doi.org/10.3390/mi14112128
APA StyleXu, Y., & Wang, R. (2023). Numerical Study on a Liquid Cooling Plate with a Double-Layer Minichannel for a Lithium Battery Module. Micromachines, 14(11), 2128. https://doi.org/10.3390/mi14112128