
Deployable Lab-on-a-Chip Sensor for Colorimetric Measurements


Abstract
:1. Introduction
2. Materials and Methods
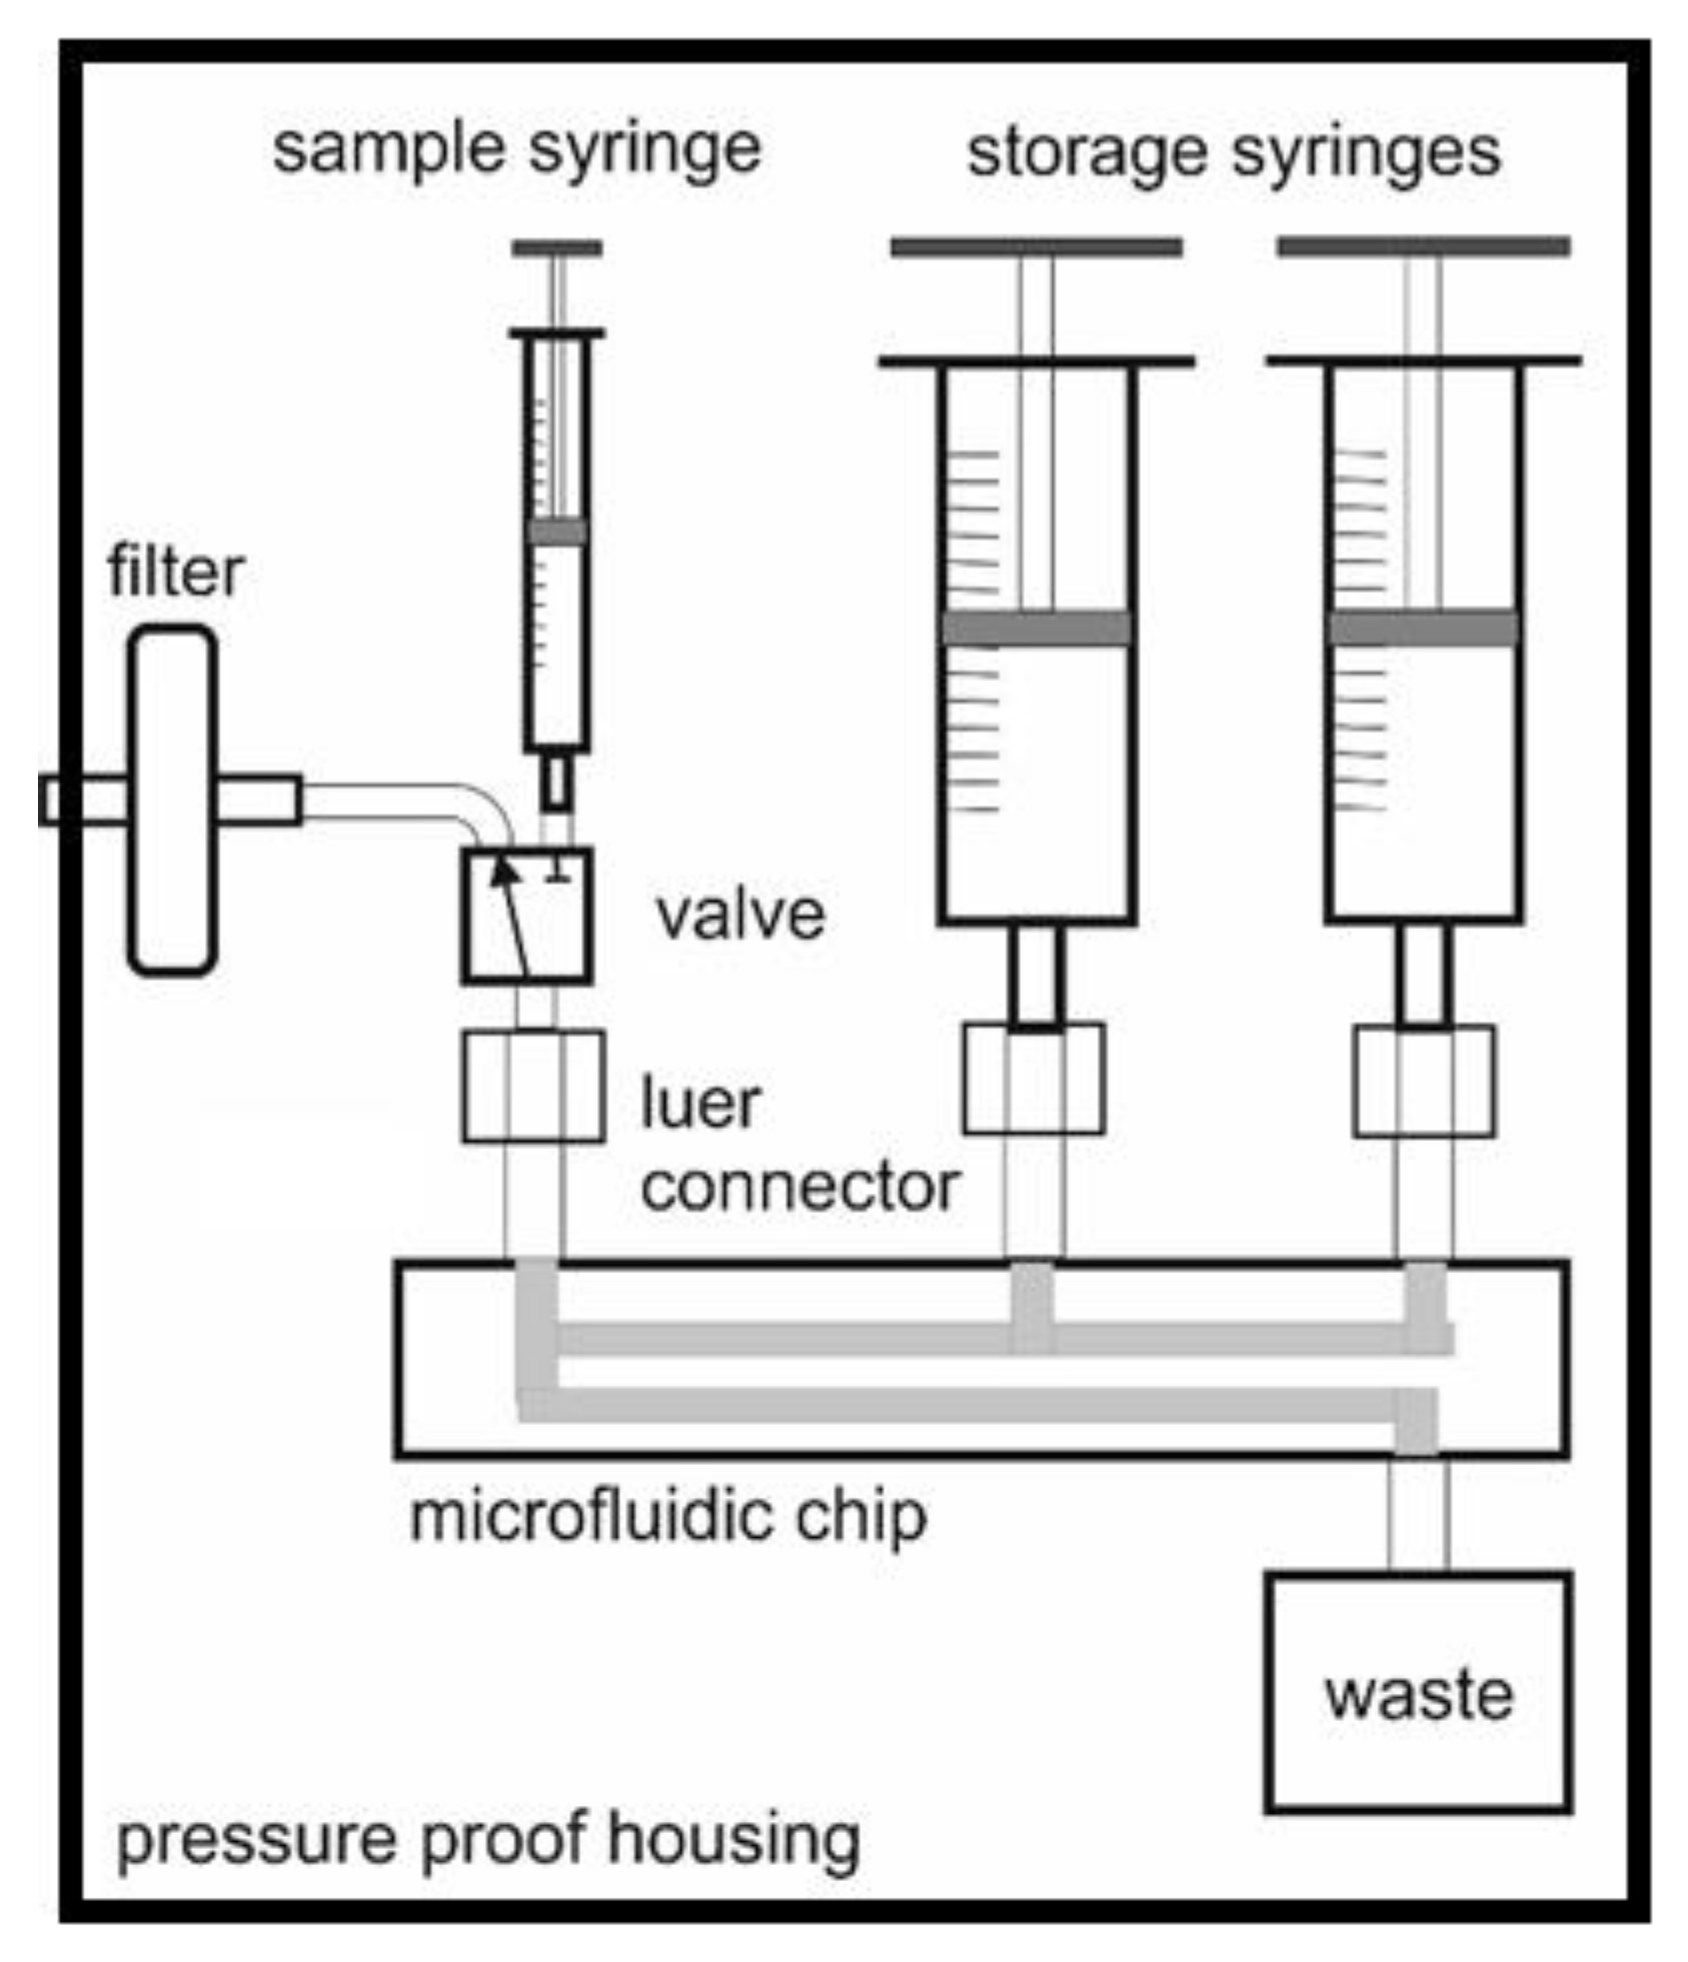
2.1. Sensor Design
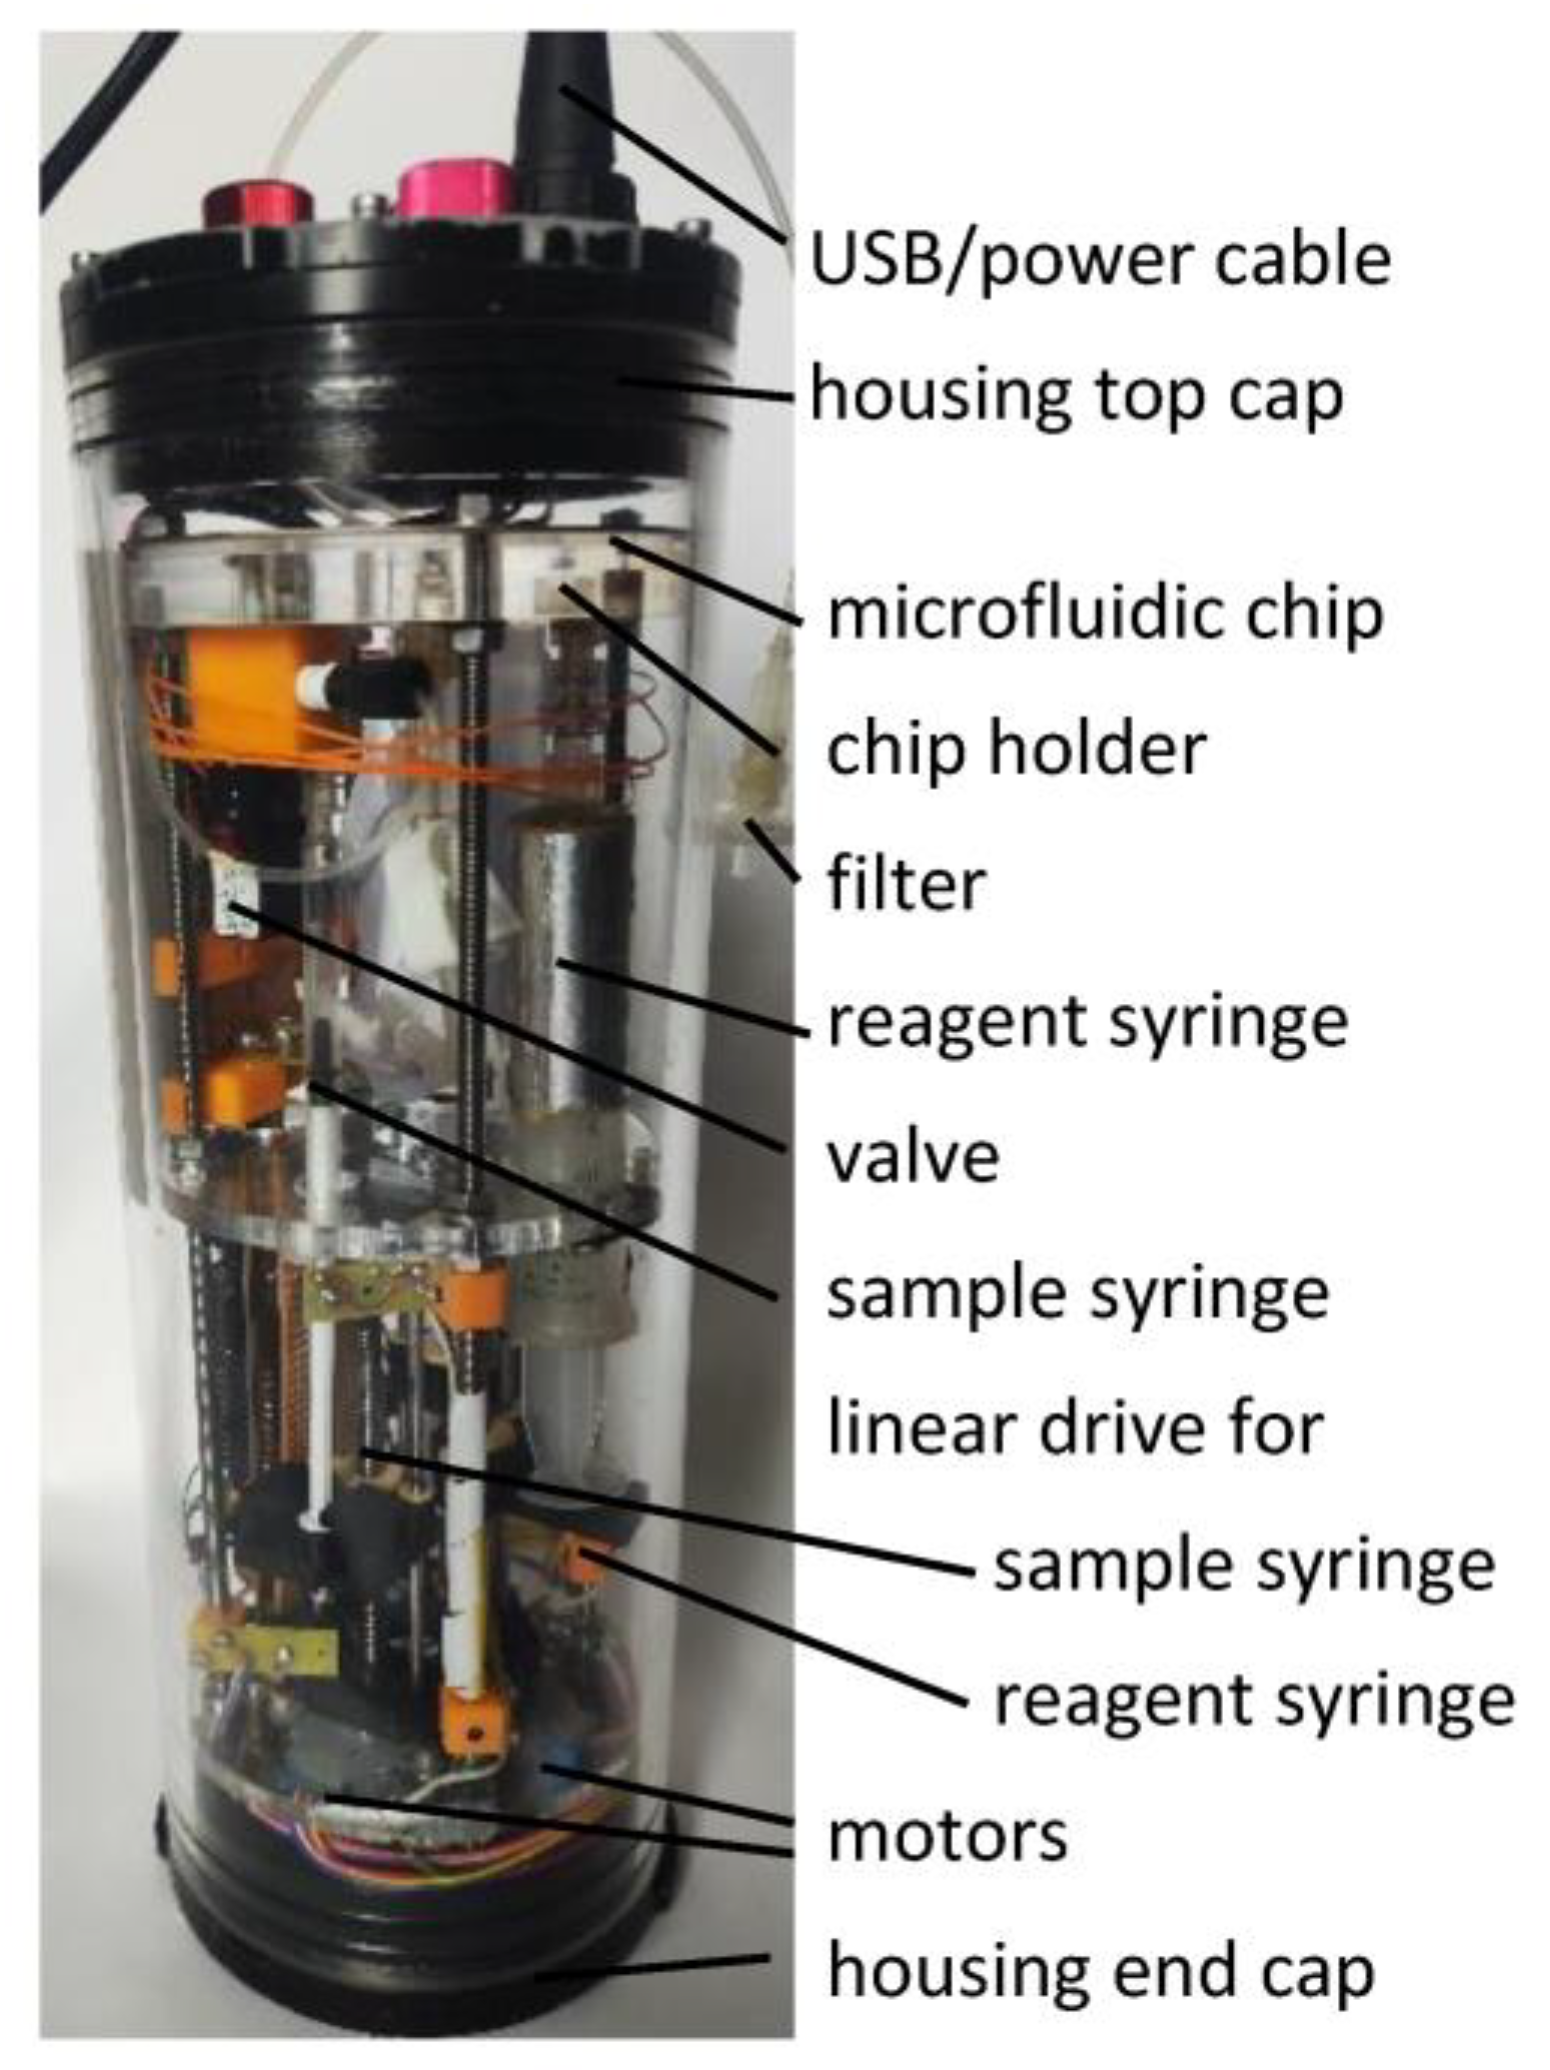
2.1.1. Housing
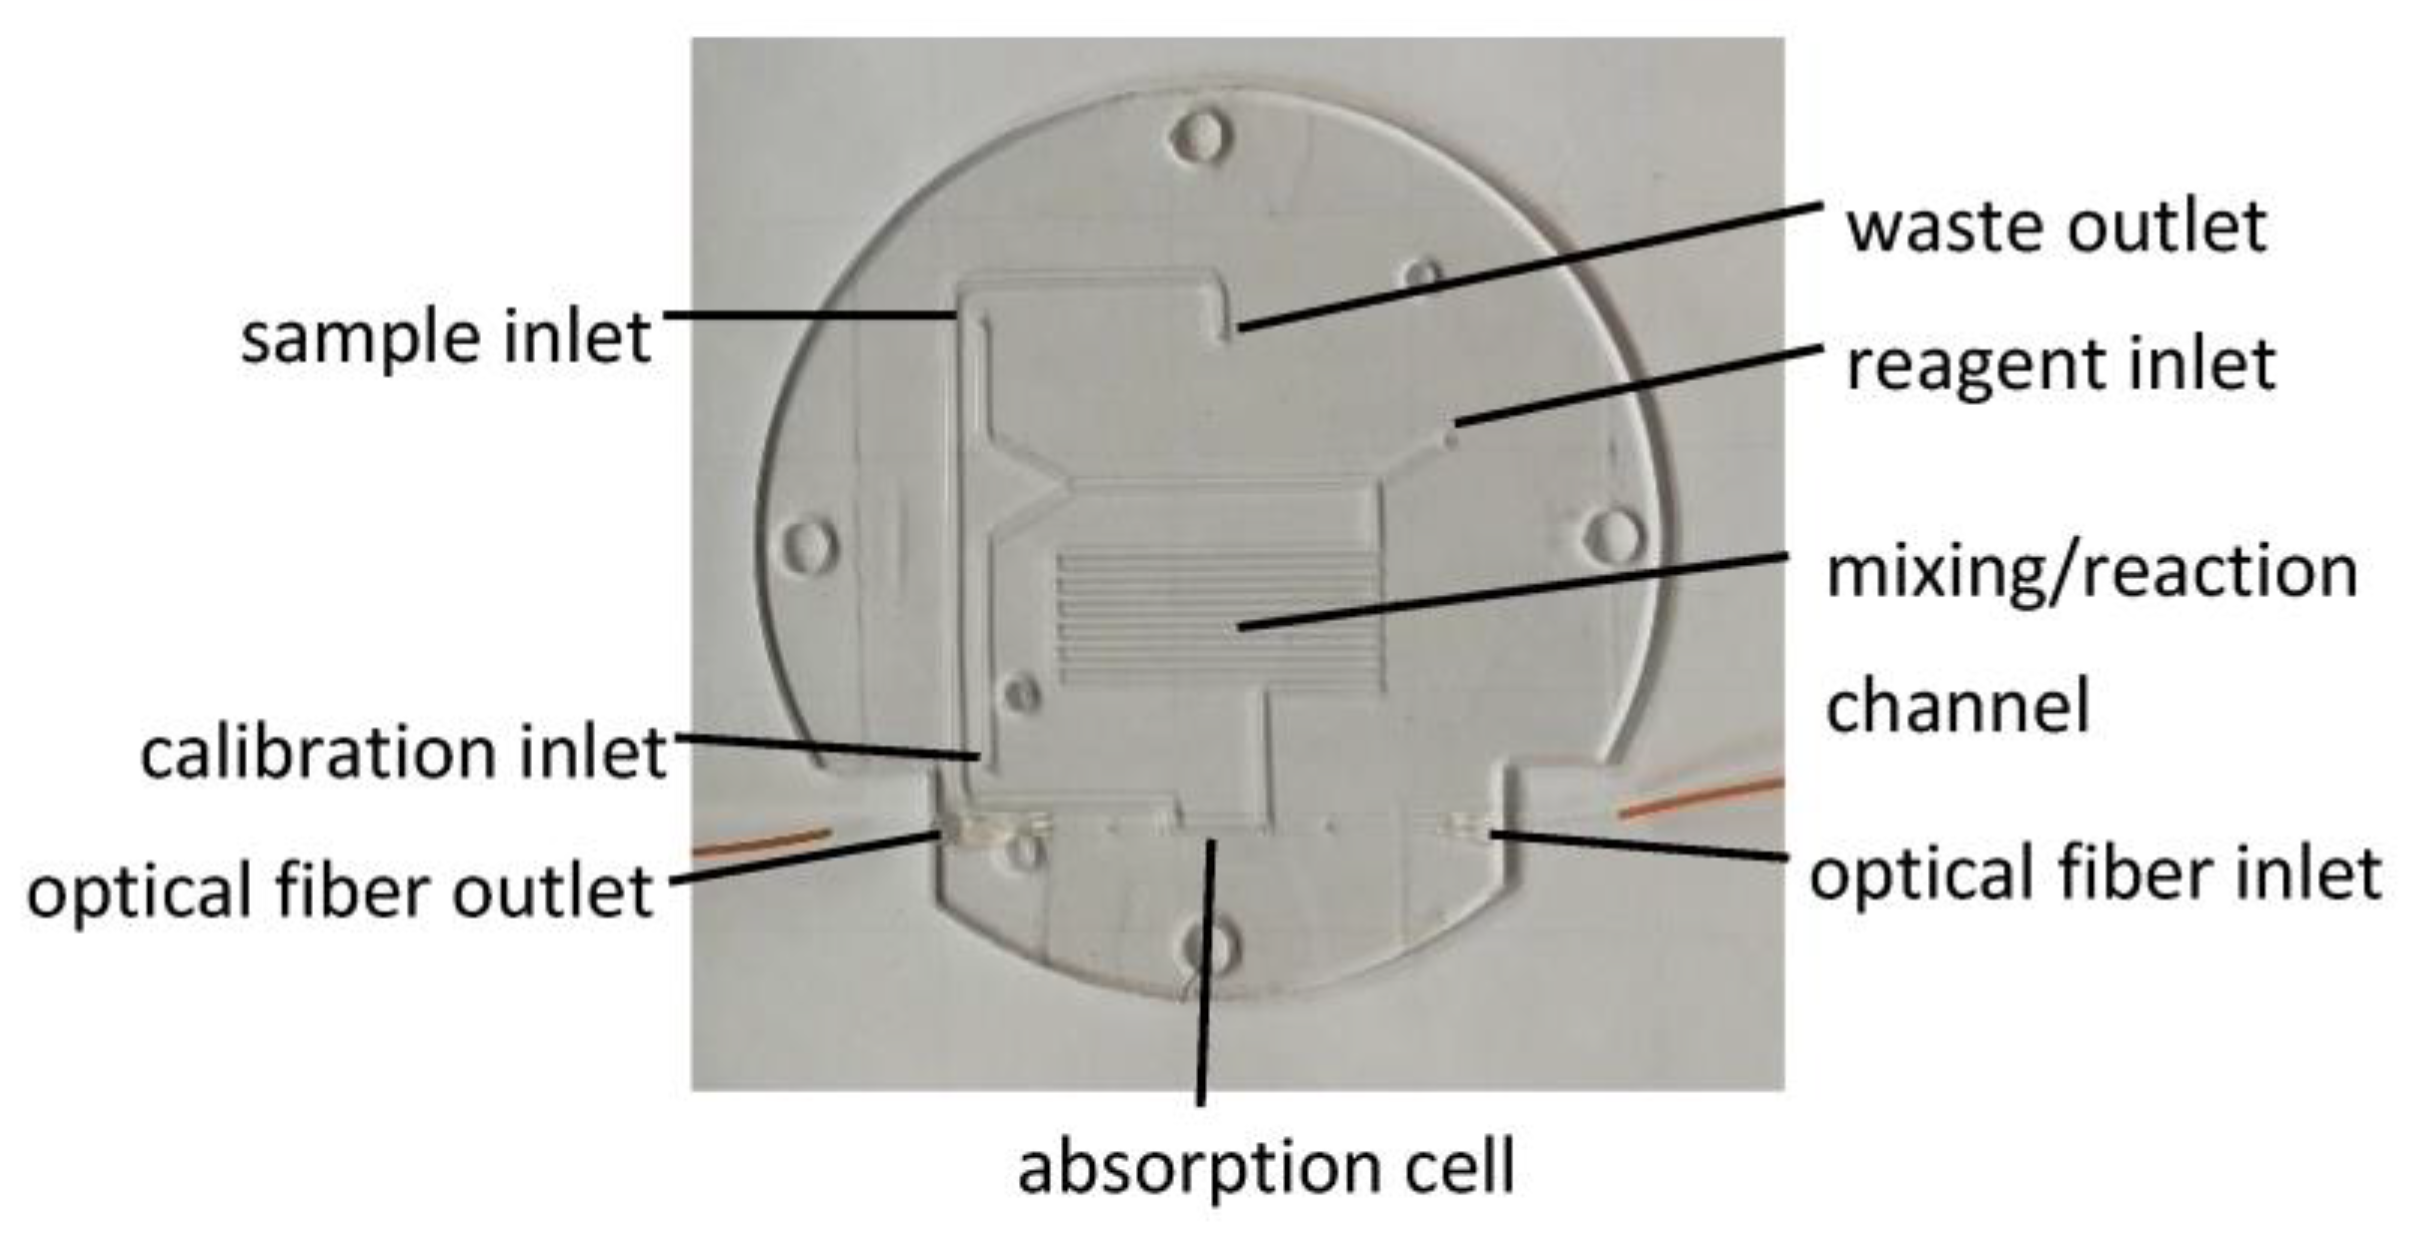
2.1.2. Microfluidic Chip
2.1.3. Sample Inlet and Pump
2.1.4. Pumps for Reagent and Other Solutions
2.1.5. Waste Storage
2.1.6. Electronic Control System
2.2. Chemical Reaction
2.3. Sensor Preparation
2.4. Measurement Procedure
2.5. Calibration Measurement
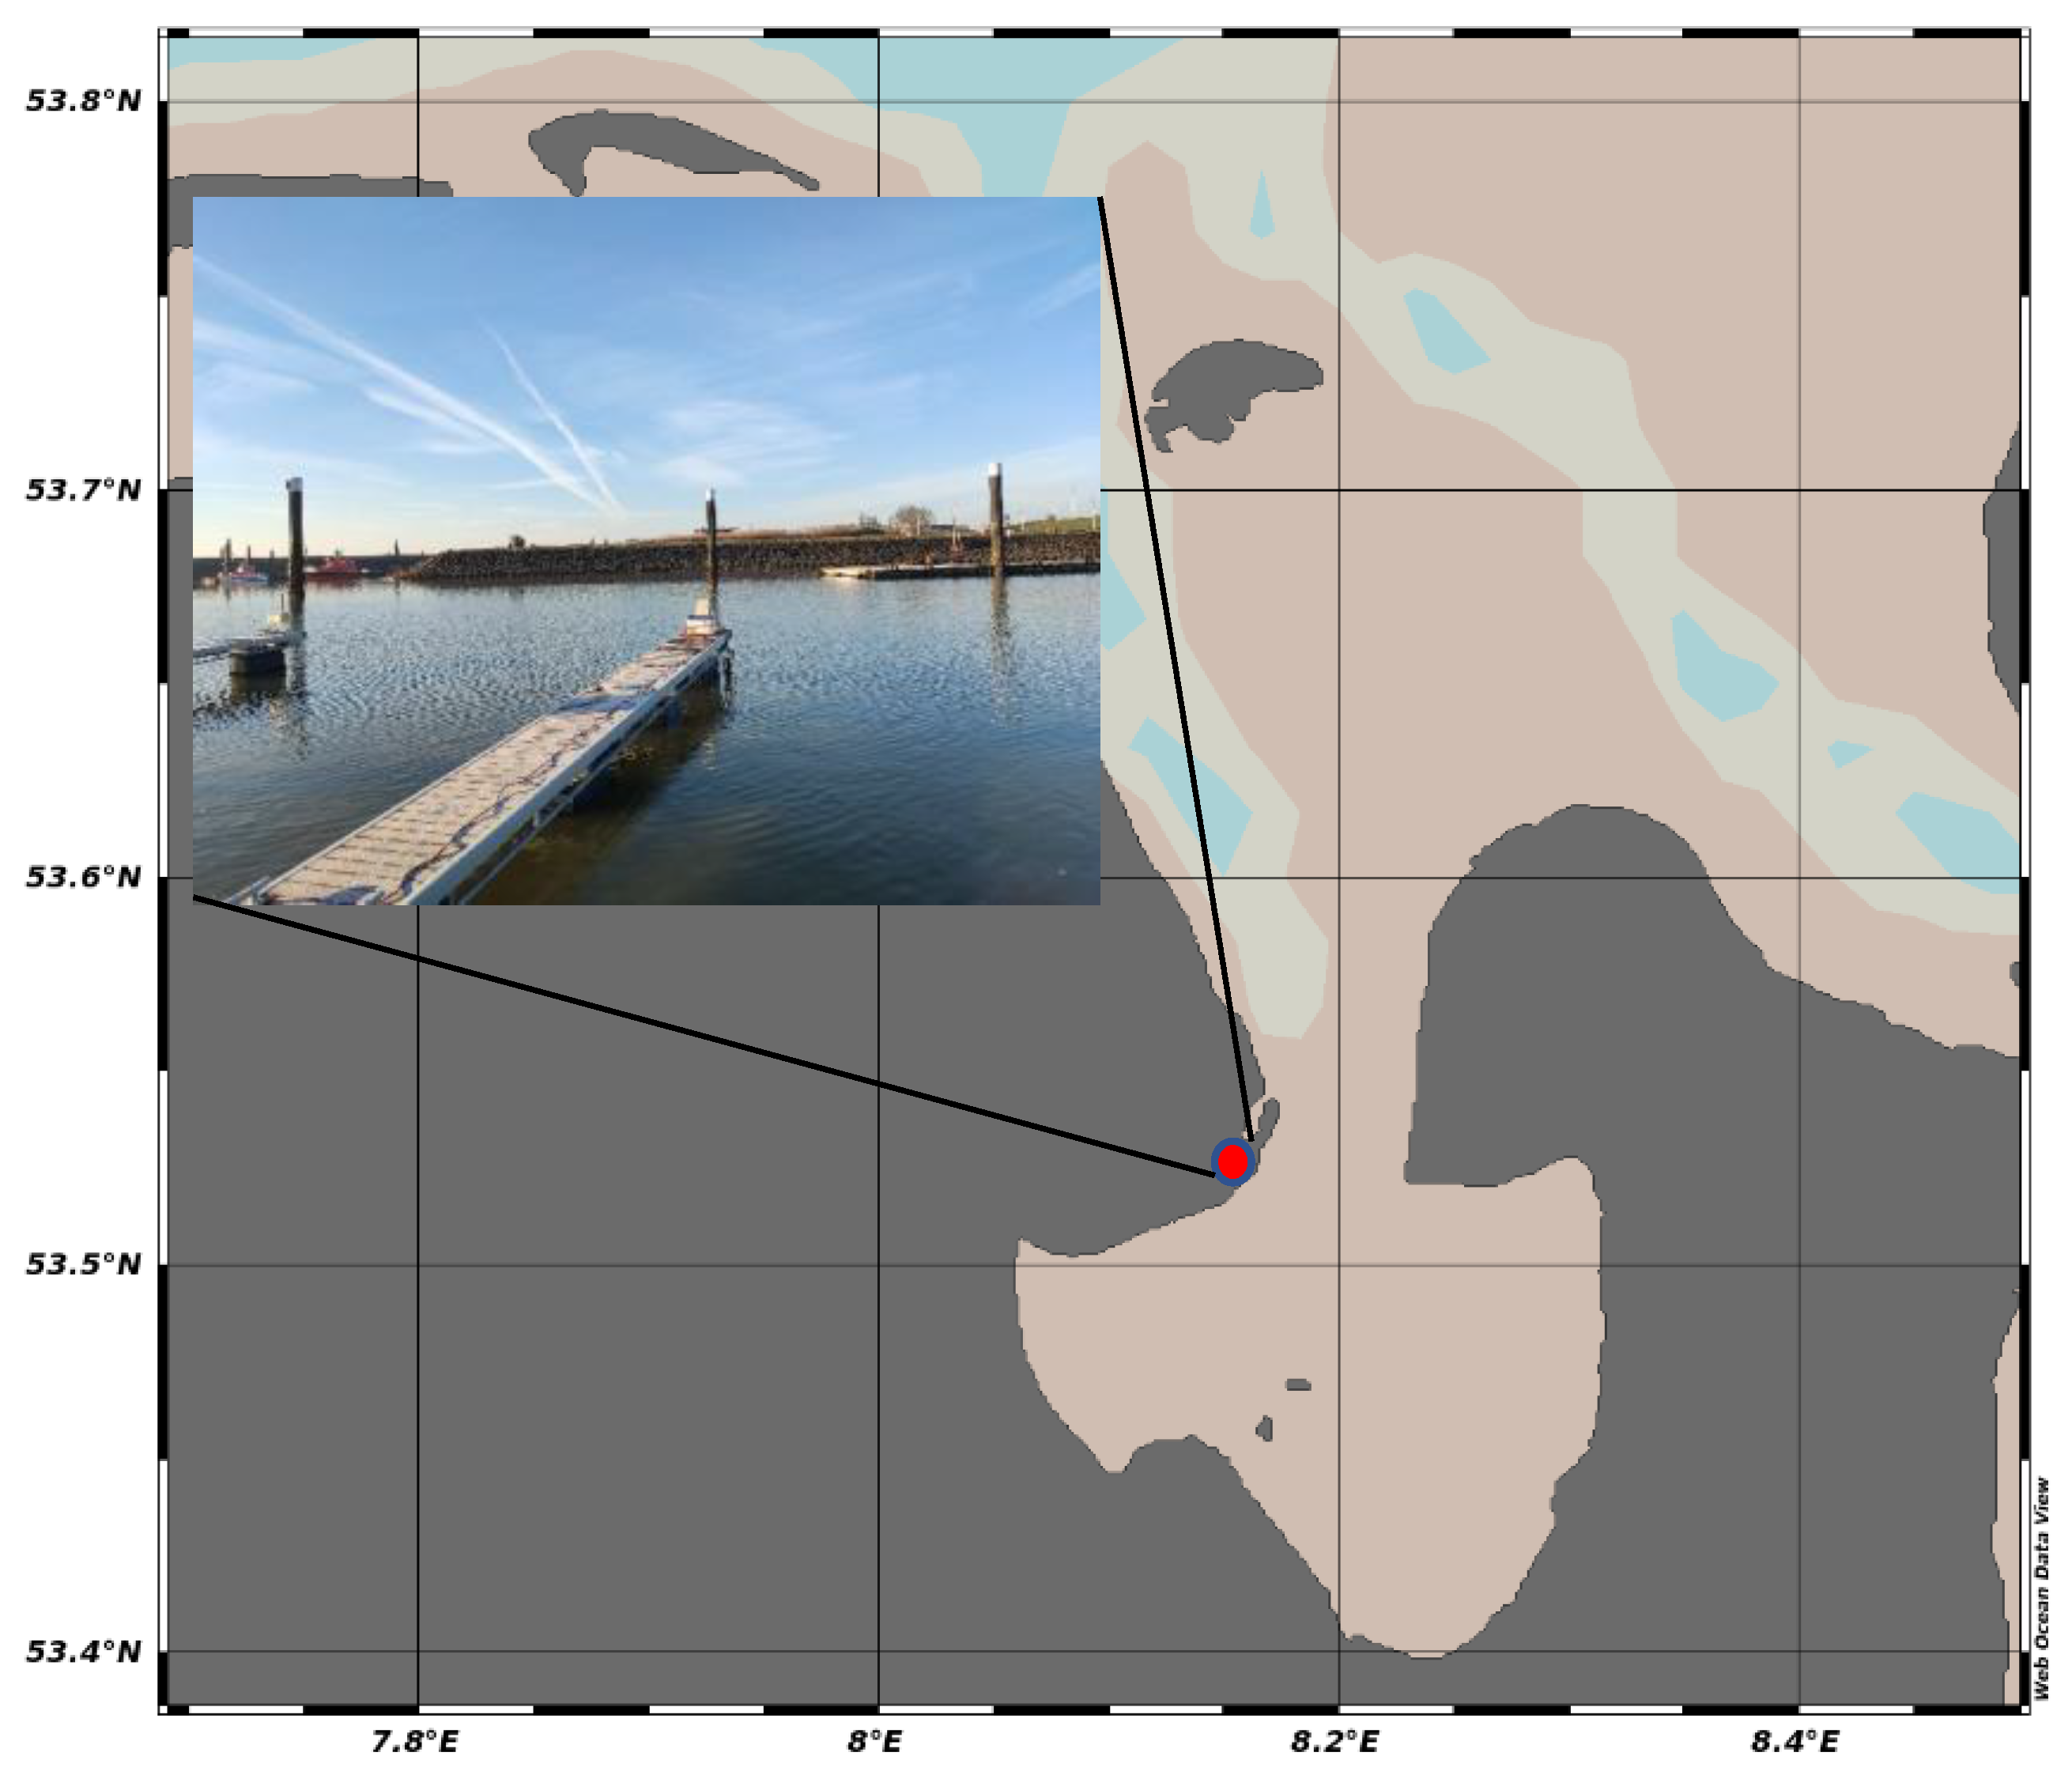
2.6. Deployment
2.7. Reference Measurements
3. Results
4. Conclusions
Author Contributions
Funding
Data Availability Statement
Acknowledgments
Conflicts of Interest
References
- Lindon, J.C.; Tranter, G.E.; Koppenaal, D.W. Encyclopedia of Spectroscopy and Spectrometry, 3rd ed.; Elsevier: Amsterdam, The Netherlands, 2017. [Google Scholar]
- Gummadi, S.; Kommoju, M. Colorimetric Approaches to Drug Analysis and Applications—A Review. Am. J. Pharmtech Res. 2019, 9, 14–37. [Google Scholar] [CrossRef]
- Liu, B.; Zhuang, J.; Wei, G. Recent advances in the design of colorimetric sensors for environmental monitoring. Environ. Sci. Nano 2020, 7, 2195–2213. [Google Scholar] [CrossRef]
- Fernandes, G.M.; Silva, W.R.; Barreto, D.N.; Lamarca, R.S.; Gomes, P.C.F.L.; Petruci, J.F.D.S.; Batista, A.D. Novel approaches for colorimetric measurements in analytical chemistry—A review. Anal. Chim. Acta 2020, 1135, 187–203. [Google Scholar] [CrossRef] [PubMed]
- Huang, C.-W.; Lin, C.; Nguyen, M.K.; Hussain, A.; Bui, X.-T.; Ngo, H.H. A review of biosensor for environmental monitoring: Principle, application, and corresponding achievement of sustainable development goals. Bioengineered 2023, 14, 58–80. [Google Scholar] [CrossRef]
- Butt, M.A.; Voronkov, G.S.; Grakhova, E.P.; Kutluyarov, R.V.; Kazanskiy, N.L.; Khonina, S.N. Environmental Monitoring: A Comprehensive Review on Optical Waveguide and Fiber-Based Sensors. Biosensors 2022, 12, 1038. [Google Scholar] [CrossRef] [PubMed]
- Baranwal, J.; Barse, B.; Gatto, G.; Broncova, G.; Kumar, A. Electrochemical Sensors and Their Applications: A Review. Chemosensors 2022, 10, 363. [Google Scholar] [CrossRef]
- Saez, J.; Catalan-Carrio, R.; Owens, R.M.; Basabe-Desmonts, L.; Benito-Lopez, F. Microfluidics and materials for smart water monitoring: A review. Anal. Chim. Acta 2021, 1186, 338392. [Google Scholar] [CrossRef]
- Dutt, J.; Davis, J. Current strategies in nitrite detection and their application to field analysis. J. Environ. Monit. 2002, 4, 465–471. [Google Scholar] [CrossRef] [PubMed]
- Li, Z.; Liu, H.; Wang, D.; Zhang, M.; Yang, Y.; Ren, T.-L. Recent advances in microfluidic sensors for nutrients detection in water. TrAC Trends Anal. Chem. 2023, 158, 116790. [Google Scholar] [CrossRef]
- Beaton, A.D.; Cardwell, C.L.; Thomas, R.S.; Sieben, V.J.; Legiret, F.-E.; Waugh, E.M.; Statham, P.J.; Mowlem, M.C.; Morgan, H. Lab-on-chip measurement of nitrate and nitrite for in situ analysis of natural waters. Environ. Sci. Technol. 2012, 46, 9548–9556. [Google Scholar] [CrossRef] [PubMed]
- Nightingale, A.M.; Hassan, S.-U.; Warren, B.M.; Makris, K.; Evans, G.W.H.; Papadopoulou, E.; Coleman, S.; Niu, X. A droplet microfluidic-based sensor for simultaneous in situ monitoring of nitrate and nitrite in natural waters. Environ. Sci. Technol. 2019, 53, 9677–9685. [Google Scholar] [CrossRef] [PubMed]
- Gassmann, S.; Schütte, H.; Thoma, C. Macro-Micro-Interface for a Microfluidic Nitrite Sensor. In Proceedings of the ACTUATOR18 International Conference on New Actuators and Drive Systems, Bremen, Germany, 25–27 June 2018. [Google Scholar]
- Gassmann, S.; Schuette, H.; Thoma, C. Colorimetric microfluidic Nitrite sensor with optical fiber coupling. In Proceedings of the IECON 2016—42nd Annual Conference of the IEEE Industrial Electronics Society, Florence, Italy, 23–26 October 2016; pp. 4947–4951. [Google Scholar] [CrossRef]
- EPA/600/4-79/020; Methods for the Chemical Analysis of Water and Wastes (MCAWW). U.S. Environmental Protection Agency: Washington, DC, USA. Available online: https://www.nemi.gov/methods/method_summary/5777/ (accessed on 1 September 2023).
- 4500-NO2− Nitrogen (Nitrite); Standard Methods For the Examination of Water and Wastewater. APHA Press: Washington, DC, USA, 1992.
- DIN EN 26 777; Water Quality—Determination of Nitrite—Molecular Absorption Spectrometric Method. Beuth Verlag: Berlin, Germany, 1993.
- Merck. Spectroquant Nitrite Test Nr. 1.14776.0001, 2021, Data Sheet, File Name: 114776e.pdf. Available online: https://www.emdmillipore.com/US/en/product/Nitrite-Test,MDA_CHEM-114776 (accessed on 1 September 2023).
- Schnetger, B.; Lehners, C. Determination of nitrate plus nitrite in small volume marine water samples using vanadium(III)chloride as a reduction agent. Mar. Chem. 2014, 160, 91–98. [Google Scholar] [CrossRef]
- Miranda, K.M.; Espey, M.G.; Wink, D.A. A Rapid, Simple Spectrophotometric Method for Simultaneous Detection of Nitrate and Nitrite. Nitric Oxide 2001, 5, 62–71. [Google Scholar] [CrossRef] [PubMed]


Disclaimer/Publisher’s Note: The statements, opinions and data contained in all publications are solely those of the individual author(s) and contributor(s) and not of MDPI and/or the editor(s). MDPI and/or the editor(s) disclaim responsibility for any injury to people or property resulting from any ideas, methods, instructions or products referred to in the content. |
© 2023 by the authors. Licensee MDPI, Basel, Switzerland. This article is an open access article distributed under the terms and conditions of the Creative Commons Attribution (CC BY) license (https://creativecommons.org/licenses/by/4.0/).
Share and Cite
Gassmann, S.; Schleifer, T.; Schuette, H. Deployable Lab-on-a-Chip Sensor for Colorimetric Measurements. Micromachines 2023, 14, 2102. https://doi.org/10.3390/mi14112102
Gassmann S, Schleifer T, Schuette H. Deployable Lab-on-a-Chip Sensor for Colorimetric Measurements. Micromachines. 2023; 14(11):2102. https://doi.org/10.3390/mi14112102
Chicago/Turabian StyleGassmann, Stefan, Till Schleifer, and Helmut Schuette. 2023. "Deployable Lab-on-a-Chip Sensor for Colorimetric Measurements" Micromachines 14, no. 11: 2102. https://doi.org/10.3390/mi14112102
APA StyleGassmann, S., Schleifer, T., & Schuette, H. (2023). Deployable Lab-on-a-Chip Sensor for Colorimetric Measurements. Micromachines, 14(11), 2102. https://doi.org/10.3390/mi14112102