
Electrostatic Potential Analysis in Polyelectrolyte Brush-Grafted Microchannels Filled with Polyelectrolyte Dispersion


Abstract
:1. Introduction
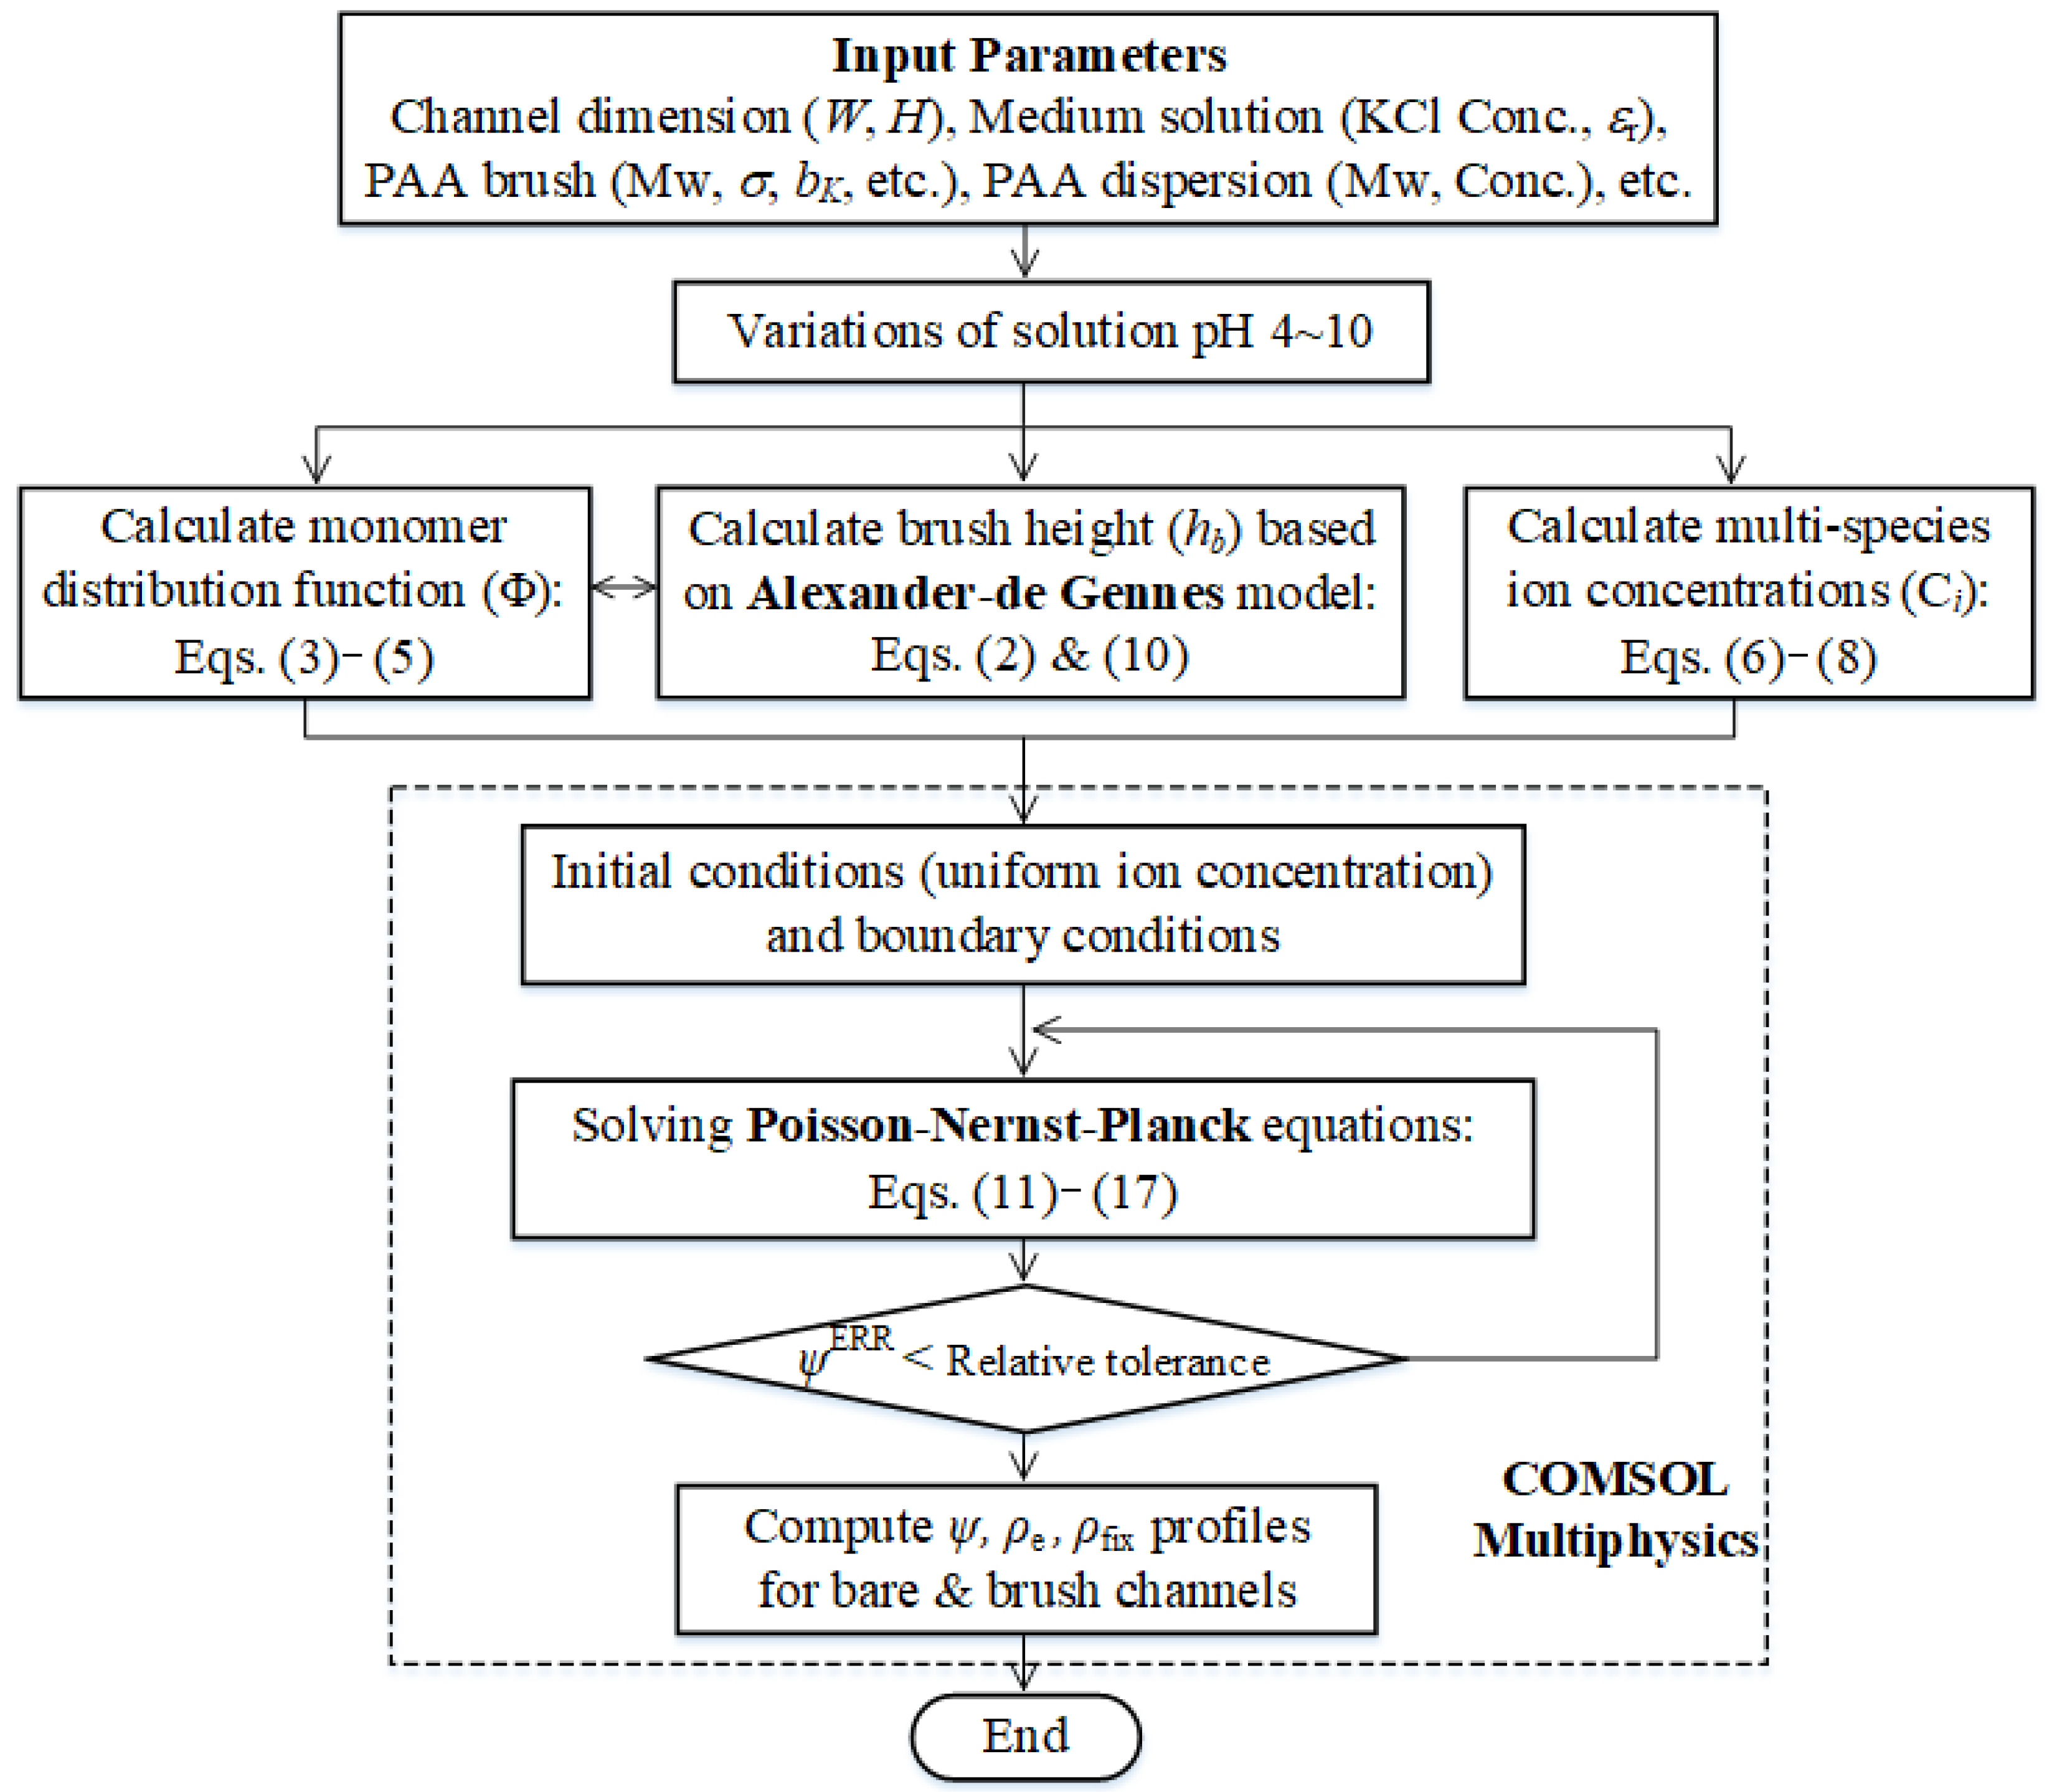
2. Model Formulations
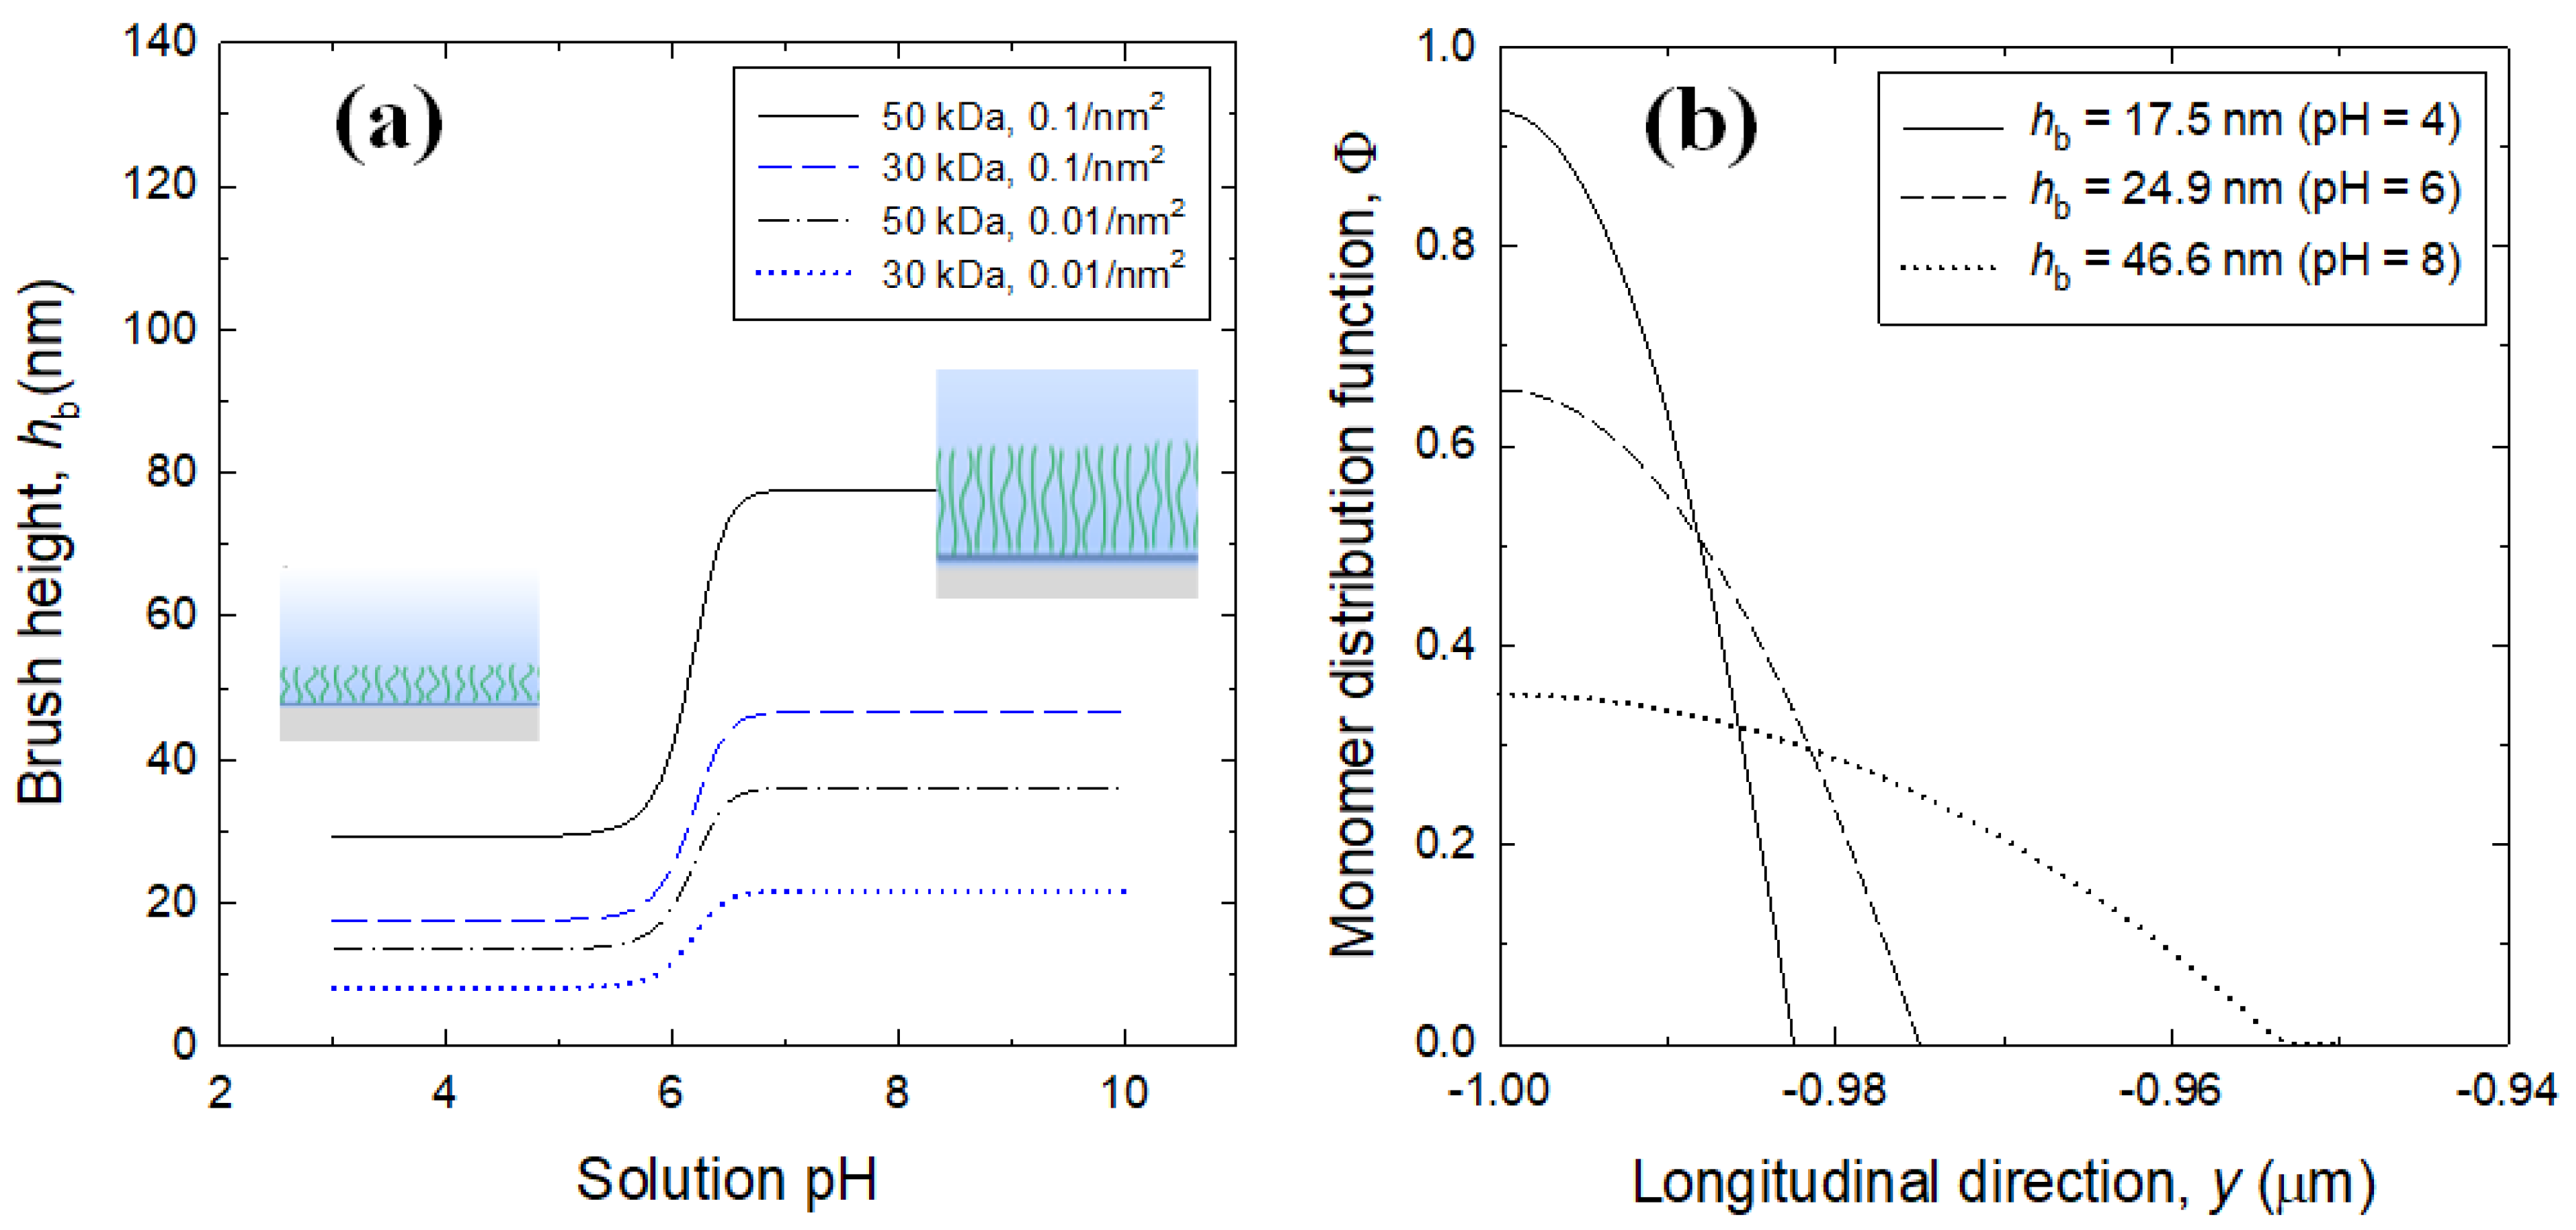
2.1. Polyelectrolyte Brush Model with Monomer Density Profile
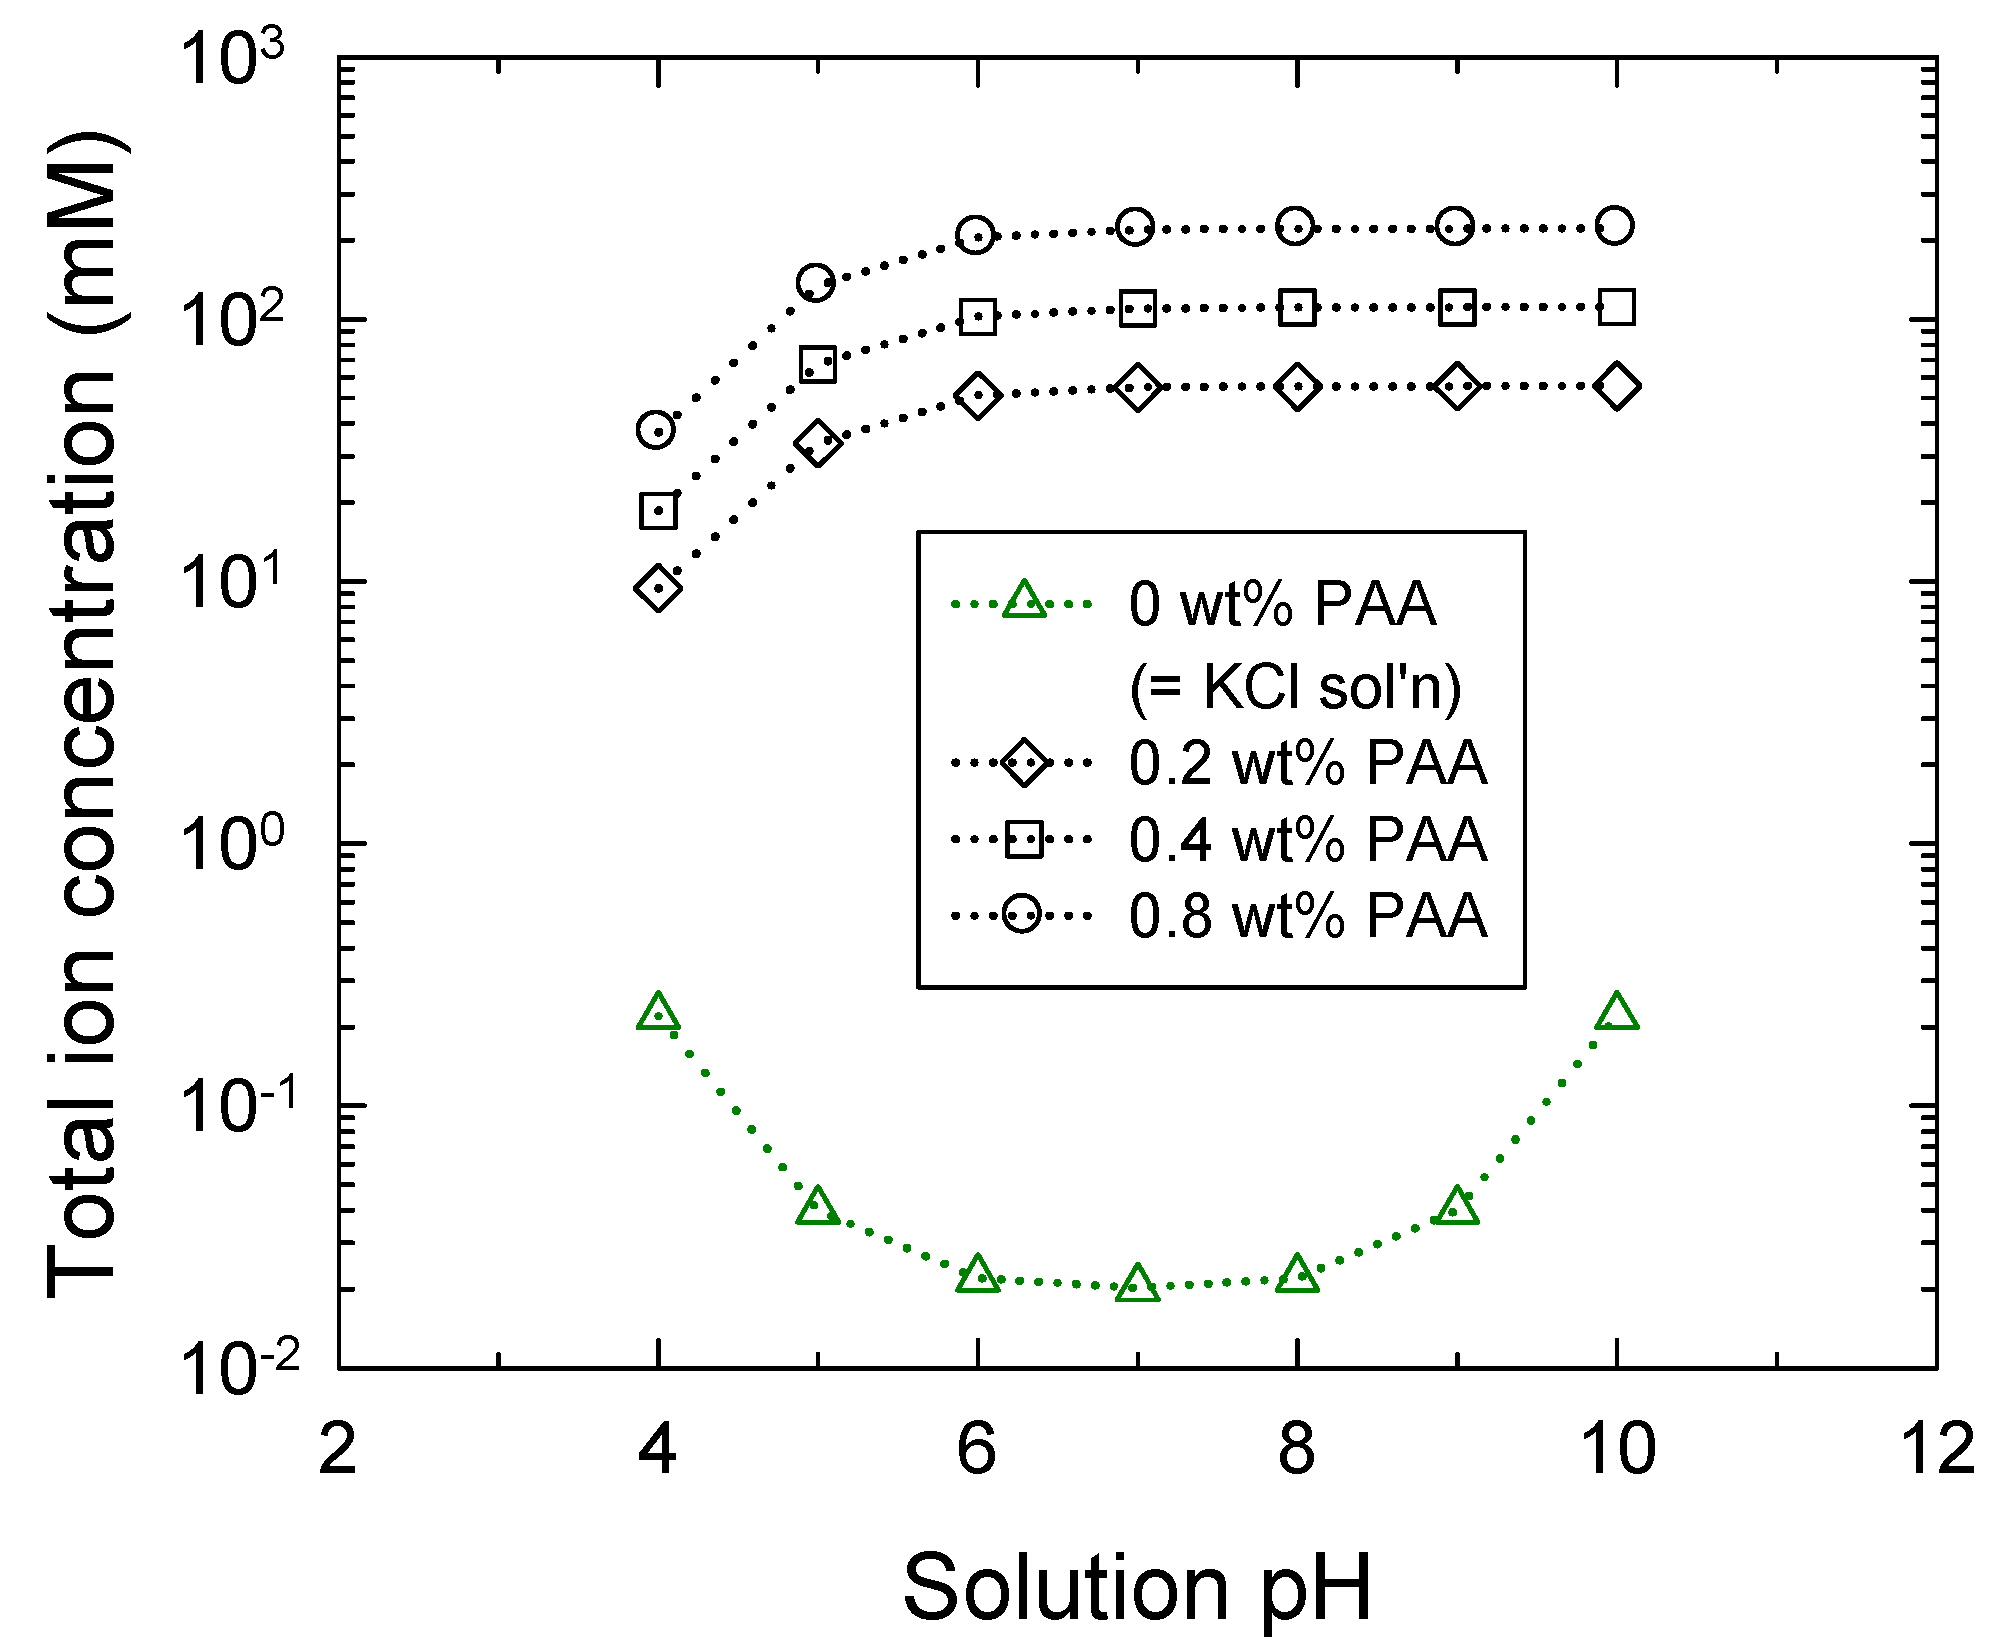
2.2. Multi-Species Ion Balance in the Bulk Solution
2.3. The Poisson–Nernst–Planck Model
3. Results and Discussion
3.1. Brush Layer and Bulk Solution Analysis
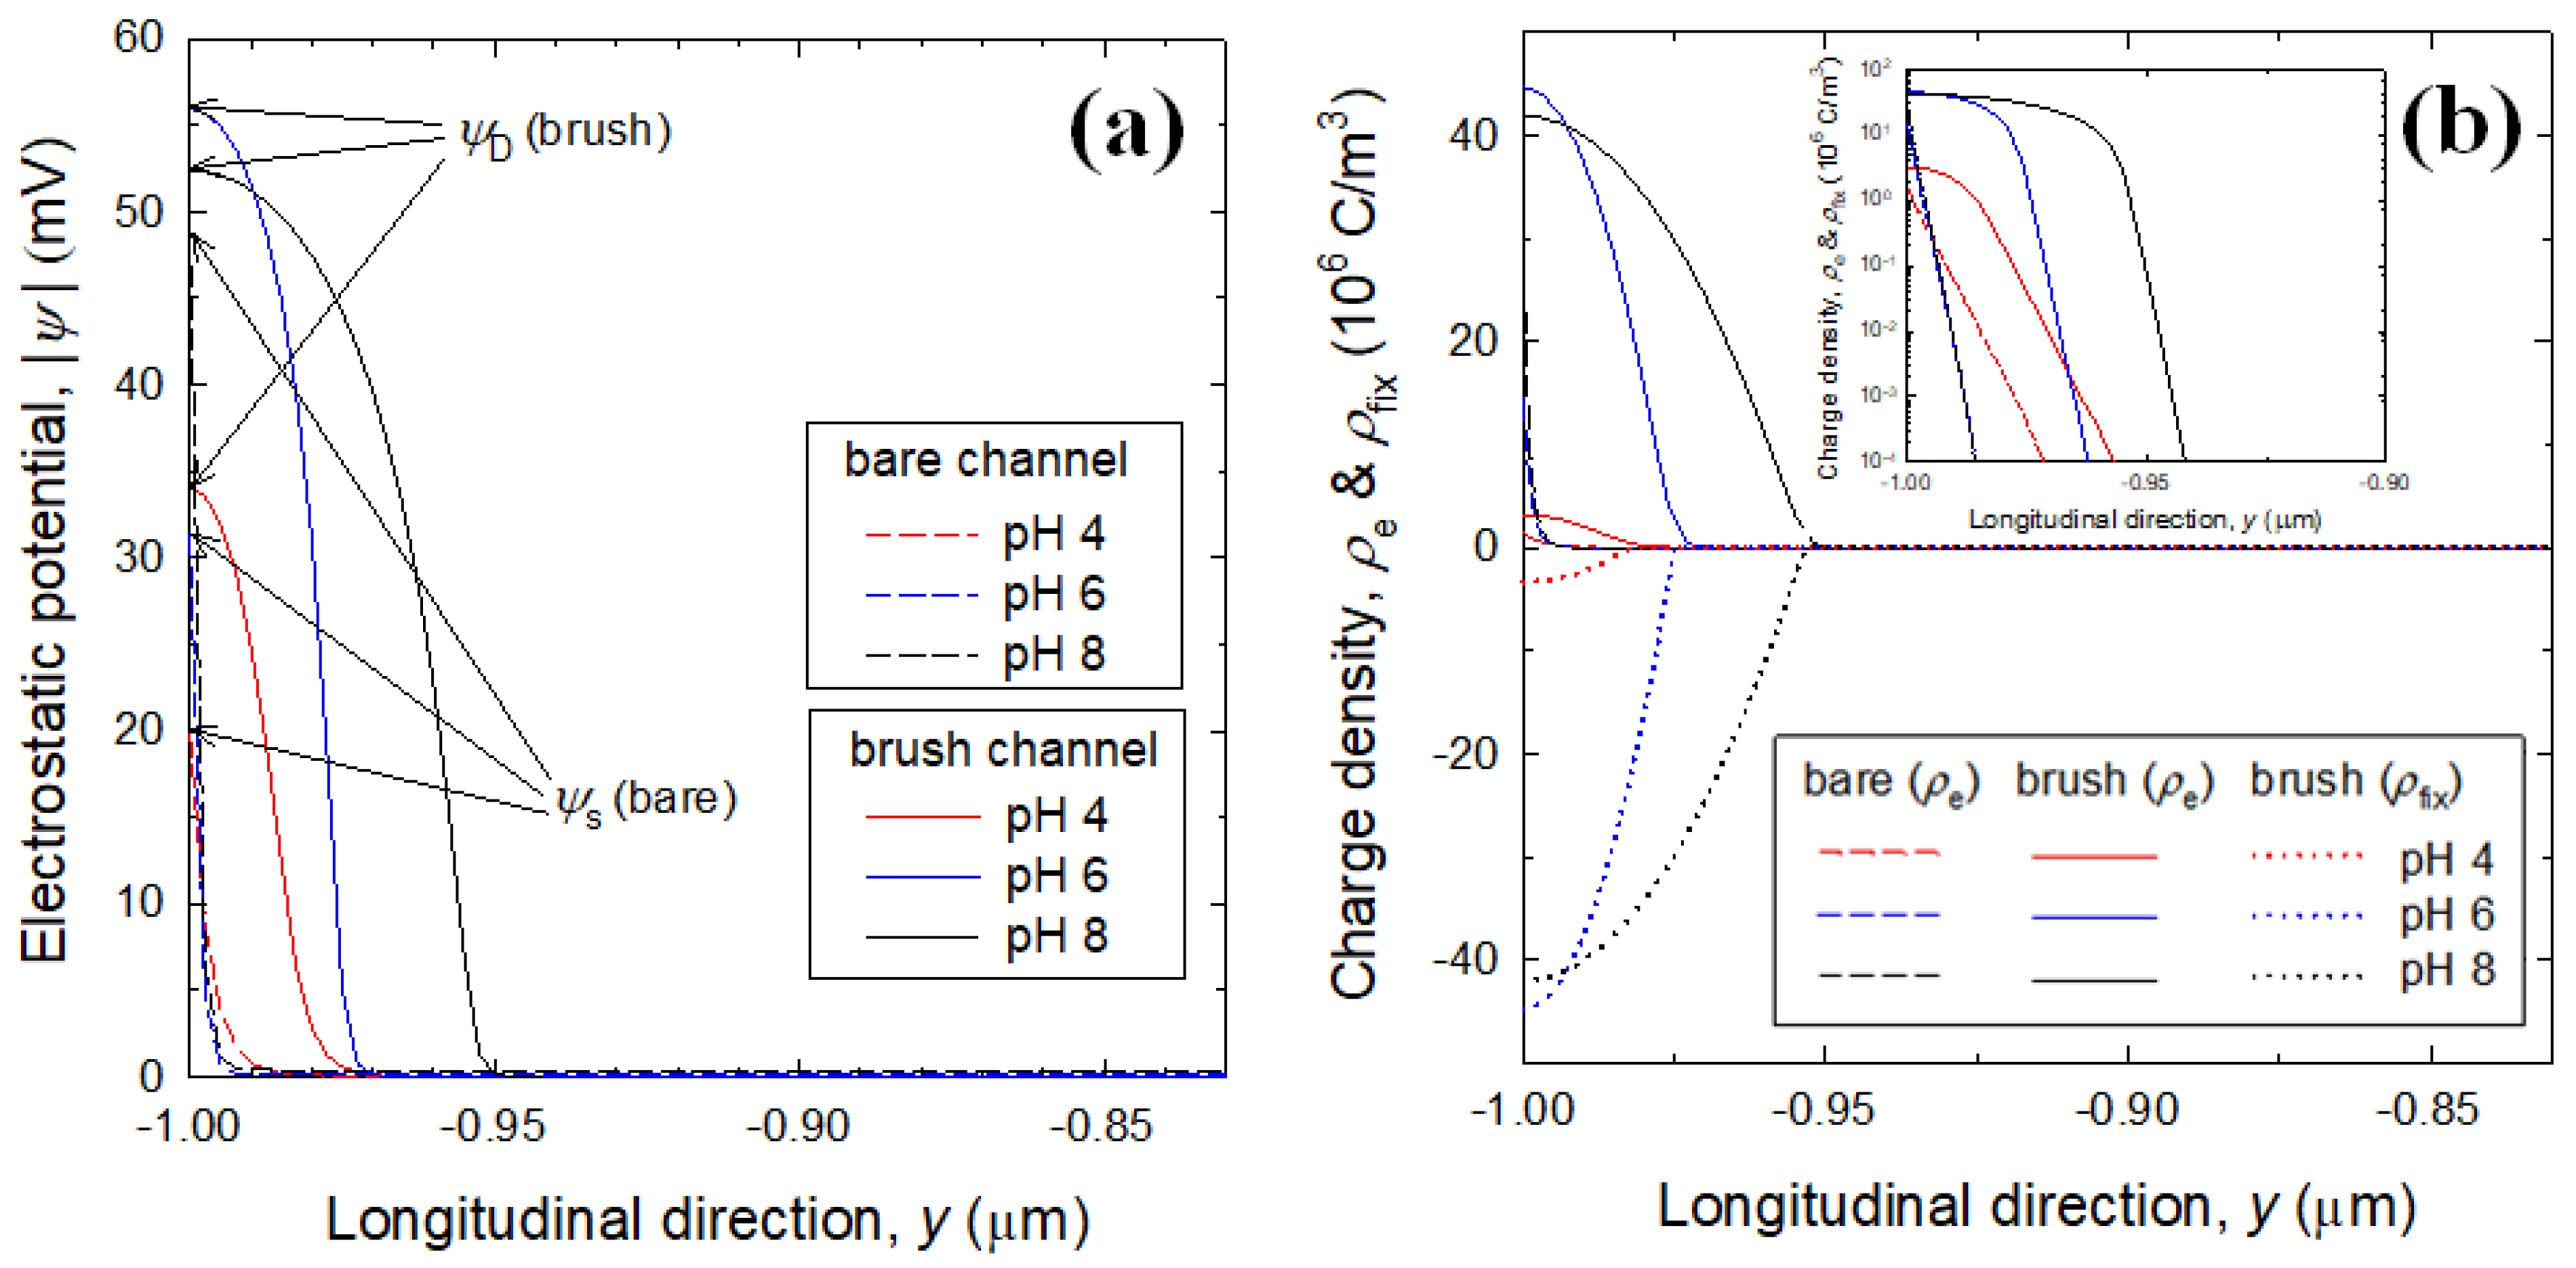
3.2. Electrostatic Potential and Charge Density Profiles
4. Conclusions
Author Contributions
Funding
Data Availability Statement
Conflicts of Interest
Nomenclature
| bK | length of Kuhn segment [m] |
| Ci | molar concentration of ion species i [mol/m3] |
| Di | diffusivity of ion species i [m2/s] |
| e | elementary charge [C] |
| Fbrush | free energy of polymer brush [J] |
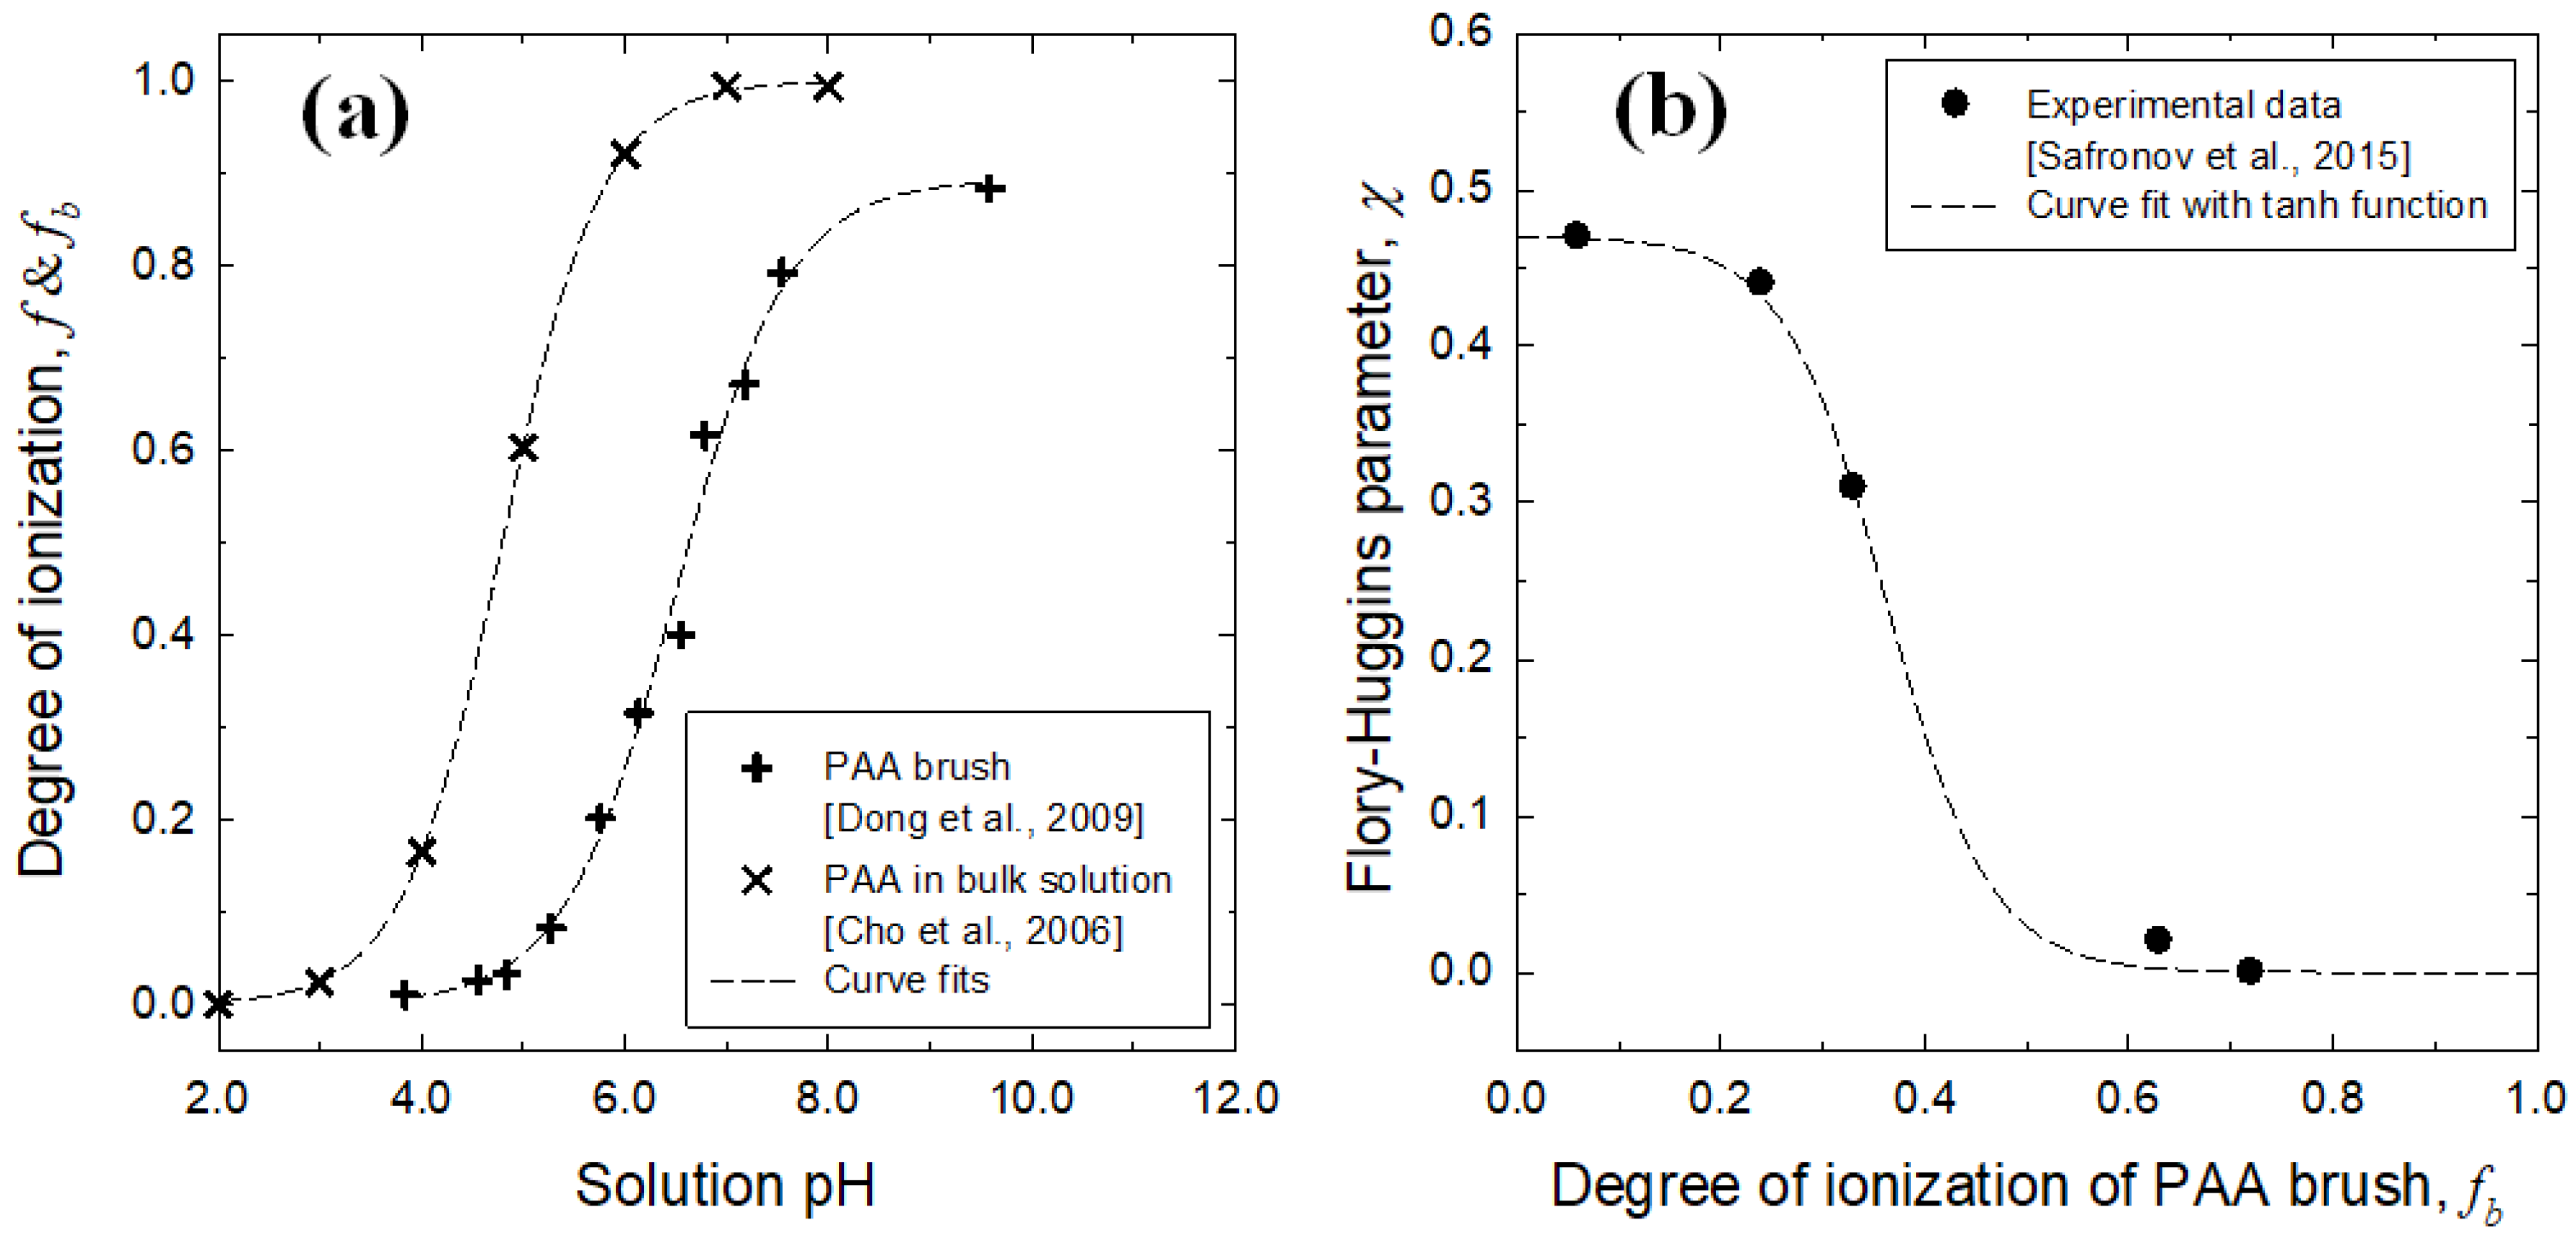
| f | degree of ionization of PAA chain dispersed in the bulk solution [-] |
| fb | degree of ionization of PAA brush [-] |
| H | channel height [m] |
| hb | brush height [m] |
| I | ionic strength [mM] |
| Ji | flux vector of ion species i [mol/m2 s] |
| Ki | mobility of ion species i [s/kg] |
| kBT | Boltzmann thermal energy [J] |
| lb | average distance between grafting points [m] |
| NA | Avogadro number [1/mol] |
| NK | number of Kuhn segments of a polymer chain [-] |
| nb | number of monomers in a PAA chain of brush [-] |
| ns | number of monomers in a PAA chain dispersed in the bulk solution [-] |
| Ka | acid ionization constant in the bulk solution [-] |
| Kab | acid ionization constant in the brush [-] |
| vi | ionic velocity vector [m/s] |
| x, y | spanwise and longitudinal distances from channel centerline [m] |
| W | channel width [m] |
| Greek symbols | |
| εo | dielectric permittivity of vacuum [C/V m] |
| εr | relative dielectric permittivity of aqueous medium [-] |
| κ–1 | electric double layer thickness [m] |
| Λi | valence of ion species i [-] |
| ρe | charge density in the solution [C/m3] |
| ρfix | charge density in the brush layer [C/m3] |
| ρenet | net charge density [C/m3] |
| σ | grafting density [1/m2] |
| Φ | monomer distribution function [-] |
| φ | normalized monomer distribution function [-] |
| χ | Flory–Huggins parameter [-] |
| ψ | electrostatic potential [V] |
| ψD | Donnan potential [V] |
| ψs | surface potential [V] |
| ω | excluded volume parameter [m3] |
References
- Minko, S. Responsive polymer brushes. J. Macromol. Sci. C Polym. Rev. 2006, 46, 397–420. [Google Scholar] [CrossRef]
- Peng, S.; Bhushan, B. Smart polymer brushes and their emerging applications. RSC Adv. 2012, 2, 8557–8578. [Google Scholar] [CrossRef]
- Zoppe, J.O.; Ataman, N.C.; Mocny, P.; Wang, J.; Moraes, J.; Klok, H.-A. Surface-Initiated Controlled Radical Polymerization: State-of-the-Art, Opportunities, and Challenges in Surface and Interface Engineering with Polymer Brushes. Chem. Rev. 2017, 117, 1105–1318. [Google Scholar] [CrossRef] [Green Version]
- Li, D.; He, Q.; Li, J. Smart core/shell nanocomposites: Intelligent polymers modified gold nanoparticles. Adv. Colloid Interface Sci. 2009, 149, 28–38. [Google Scholar] [CrossRef]
- Stuart, M.A.C.; Huck, W.T.S.; Genzer, J.; Müller, M.; Ober, C.; Stamm, M.; Sukhorukov, G.B.; Szleifer, I.; Tsukruk, V.V.; Urban, M.; et al. Emerging applications of stimuli-responsive polymer materials. Nat. Mater. 2010, 9, 101–113. [Google Scholar] [CrossRef] [PubMed]
- Weir, M.P.; Parnell, A.J. Water Soluble Responsive Polymer Brushes. Polymers 2011, 3, 2107–2132. [Google Scholar] [CrossRef]
- Adiga, S.P.; Brenner, D.W. Stimuli-Responsive Polymer Brushes for Flow Control through Nanopores. J. Funct. Biomater. 2012, 3, 239–256. [Google Scholar] [CrossRef] [Green Version]
- Liu, H.; Liu, X.; Meng, J.; Zhang, P.; Yang, G.; Su, B.; Sun, K.; Chen, L.; Han, D.; Wang, S.; et al. Hydrophobic Interaction-Mediated Capture and Release of Cancer Cells on Thermoresponsive Nanostructured Surfaces. Adv. Mater. 2012, 25, 922–927. [Google Scholar] [CrossRef]
- Klinghammer, S.; Rauch, S.; Pregl, S.; Uhlmann, P.; Baraban, L.; Cuniberti, G. Surface Modification of Silicon Nanowire Based Field Effect Transistors with Stimuli Responsive Polymer Brushes for Biosensing Applications. Micromachines 2020, 11, 274. [Google Scholar] [CrossRef] [Green Version]
- de Groot, G.W.; Santonicola, M.G.; Sugihara, K.; Zambelli, T.; Reimhult, E.; Vörös, J.; Vancso, G.J. Switching transport through nanopores with pH-responsive polymer brushes for controlled ion permeability. ACS Appl. Mater. Interfaces 2013, 5, 1400–1407. [Google Scholar] [CrossRef] [PubMed]
- Fortin, N.; Klok, H.-A. Glucose Monitoring Using a Polymer Brush Modified Polypropylene Hollow Fiber-based Hydraulic Flow Sensor. ACS Appl. Mater. Interfaces 2015, 7, 4631–4640. [Google Scholar] [CrossRef]
- Hollingsworth, N.R.; Wilkanowicz, S.I.; Larson, R.G. Salt- and pH-induced swelling of a poly(acrylic acid) brush via quartz crystal microbalance w/dissipation (QCM-D). Soft Matter 2019, 15, 7838–7851. [Google Scholar] [CrossRef]
- Masuda, T.; Hidaka, M.; Murase, Y.; Akimoto, A.M.; Nagase, K.; Okano, T.; Yoshida, R. Self-Oscillating Polymer Brushes. Angew. Chem. Int. Ed. 2013, 52, 7468–7471. [Google Scholar] [CrossRef]
- Elbert, J.; Krohm, F.; Rüttiger, C.; Kienle, S.; Didzoleit, H.; Balzer, B.N.; Hugel, T.; Stühn, B.; Gallei, M.; Brunsen, A. Polymer-Modified Mesoporous Silica Thin Films for Redox-Mediated Selective Membrane Gating. Adv. Funct. Mater. 2014, 24, 1591–1601. [Google Scholar] [CrossRef]
- Chanda, S.; Sinha, S.; Das, S. Streaming potential and electroviscous effects in soft nanochannels: Towards designing more efficient nanofluidic electrochemomechanical energy converters. Soft Matter 2014, 10, 7558–7568. [Google Scholar] [CrossRef]
- Das, S.; Banik, M.; Chen, G.; Sinha, S.; Mukherjee, R. Polyelectrolyte brushes: Theory, modelling, synthesis and applications. Soft Matter 2015, 11, 8550–8583. [Google Scholar] [CrossRef] [PubMed]
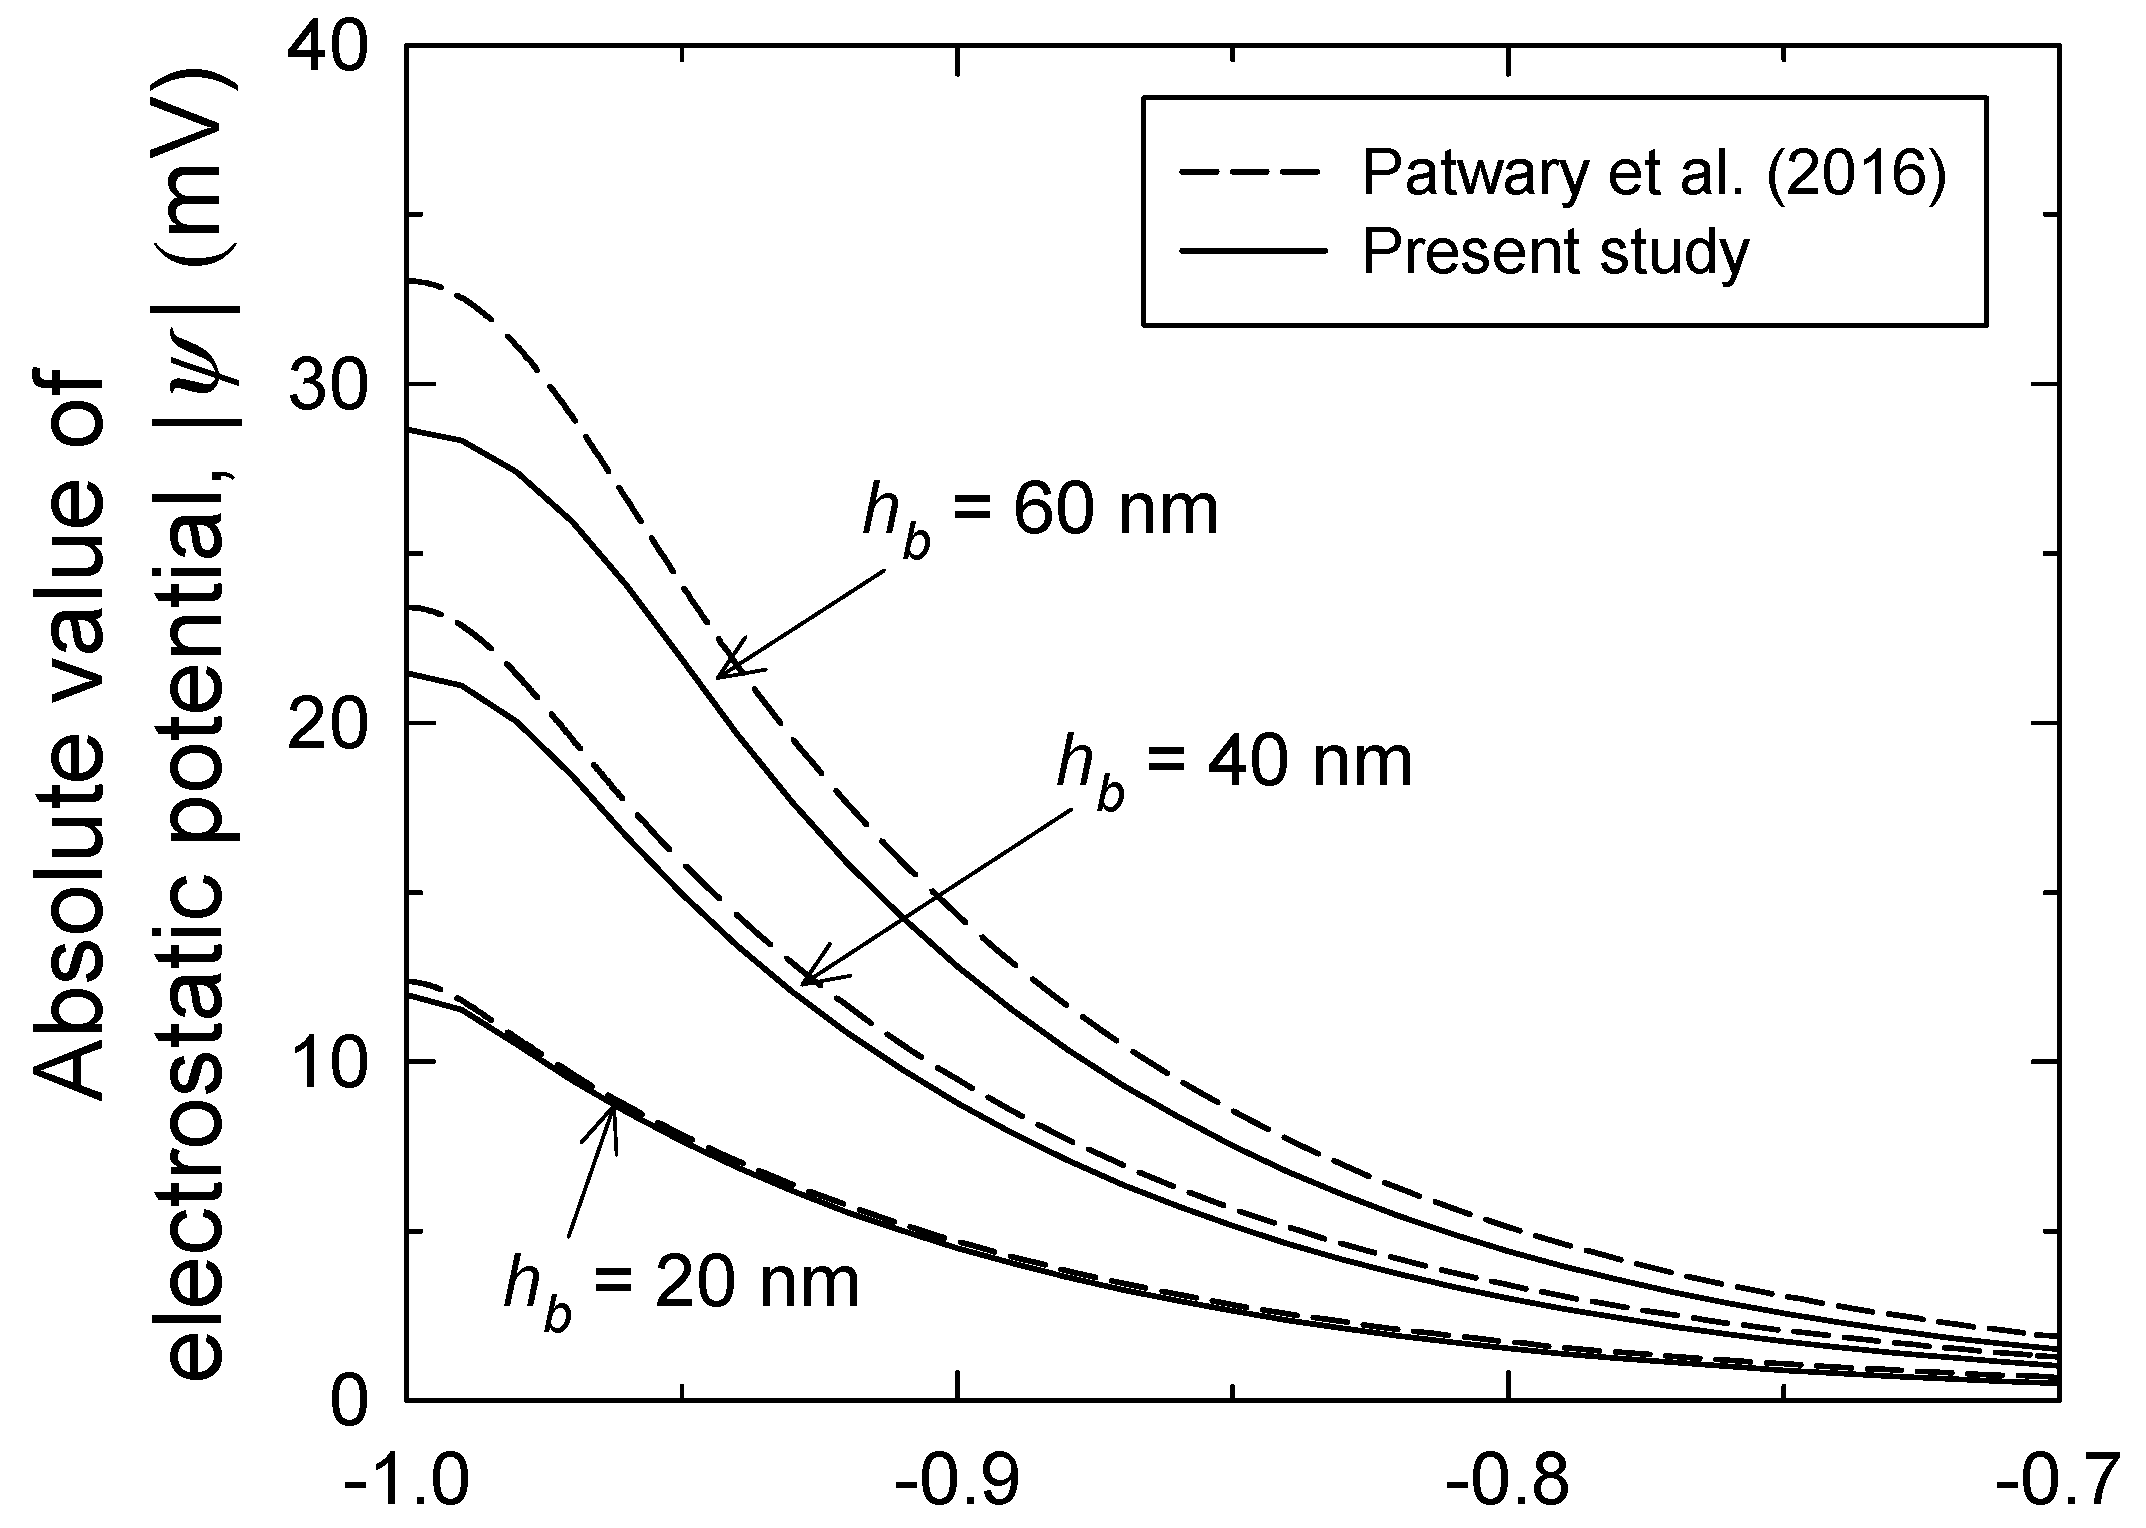
- Patwary, J.; Chen, G.; Das, S. Efficient electrochemomechanical energy conversion in nanochannels grafted with polyelectrolyte layers with pH-dependent charge density. Microfluid. Nanofluid 2016, 20, 37. [Google Scholar] [CrossRef]
- Sivasankar, V.S.; Etha, S.A.; Sachar, H.S.; Das, S. Thermo-osmotic transport in nanochannels grafted with pH-responsive polyelectrolyte brushes modelled using augmented strong stretching theory. J. Fluid Mech. 2021, 917, A31. [Google Scholar] [CrossRef]
- Pincus, P. Colloid stabilization with grafted polyelectrolytes. Macromolecules 1991, 24, 2912–2919. [Google Scholar] [CrossRef]
- Mei, L.; Yeh, L.-H.; Qian, S. Buffer effect on the ionic conductance in a pH-regulated nanochannel. Electrochem. Commun. 2015, 51, 129–132. [Google Scholar] [CrossRef]
- Deng, L.; Shi, L.; Zhou, T.; Zhang, X.; Joo, S.W. Charge Properties and Electric Field Energy Density of Functional Group-Modified Nanoparticle Interacting with a Flat Substrate. Micromachines 2020, 11, 1038. [Google Scholar] [CrossRef] [PubMed]
- Alexander, S. Adsorption of chain molecules with a polar head a scaling description. J. Phys. 1977, 38, 983–987. [Google Scholar] [CrossRef]
- de Gennes, P.G. Conformations of Polymers Attached to an Interface. Macromolecules 1980, 13, 1069–1075. [Google Scholar] [CrossRef]
- Milner, S.T. Polymer brushes. Science 1991, 251, 905–914. [Google Scholar] [CrossRef]
- Tsori, Y.; Andelman, D.; Joanny, J.-F. Interfacial instability of charged–end-group polymer brushes. EPL Europhysics Lett. 2008, 82, 46001. [Google Scholar] [CrossRef]
- Chun, M.-S.; Lee, T.S.; Choi, N.W. Microfluidic analysis of electrokinetic streaming potential induced by microflows of monovalent electrolyte solution. J. Micromech. Microeng. 2005, 15, 710–719. [Google Scholar] [CrossRef]
- Lim, J.-M.; Chun, M.-S. Curvature-induced secondary microflow motion in steady electro-osmotic transport with hydrodynamic slippage effect. Phys. Fluids 2011, 23, 102004. [Google Scholar] [CrossRef] [Green Version]
- Zhao, C.; Yang, C. Electrokinetics of non-Newtonian fluids: A review. Adv. Colloid Interface Sci. 2013, 201-202, 94–108. [Google Scholar] [CrossRef] [PubMed]
- Murat, M.; Grest, G.S. Structure of a grafted polymer brush: A molecular dynamics simulation. Macromolecules 1989, 22, 4054–4059. [Google Scholar] [CrossRef]
- Cho, J.; Hong, J.; Char, K.; Caruso§, F. Nanoporous Block Copolymer Micelle/Micelle Multilayer Films with Dual Optical Properties. J. Am. Chem. Soc. 2006, 128, 9935–9942. [Google Scholar] [CrossRef] [PubMed]
- Koetz, J.; Kesmella, S. Polyelectrolytes and Nanoparticles; Springer: Berlin/Heidelberg, Germany, 2007; pp. 12–20. [Google Scholar]
- Dong, R.; Lindau, M.; Ober, C.K. Dissociation Behavior of Weak Polyelectrolyte Brushes on a Planar Surface. Langmuir 2009, 25, 4774–4779. [Google Scholar] [CrossRef]
- Safronov, A.P.; Adamova, L.V.; Blokhina, A.S.; Kamalov, I.A.; Shabadrov, P.A. Flory-Huggins parameters for weakly crosslinked hydrogels of poly(acrylic acid) and poly(methacrylic acid) with various degrees of ionization. Polym. Sci. Ser. A 2015, 57, 33–42. [Google Scholar] [CrossRef]
- Masliyah, J.H.; Bhattacharjee, S. Electrokinetic and Colloid Transport Phenomena; Wiley: Hoboken, NJ, USA, 2006; pp. 185–214. [Google Scholar]
- COMSOL. Multiphysics® v5.2a Users Guide; COMSOL Inc.: Burlington, MA, USA, 2015. [Google Scholar]
- Chun, M.-S.; Lee, S. Flow imaging of dilute colloidal suspension in PDMS-based microfluidic chip using fluorescence microscopy. Colloids Surf. A Physicochem. Eng. Asp. 2005, 267, 86–94. [Google Scholar] [CrossRef]
- Song, J.; Duval, J.F.L.; Stuart, M.A.C.; Hillborg, H.; Gunst, U.; Arlinghaus, A.H.F.; Vancso, G.J. Surface Ionization State and Nanoscale Chemical Composition of UV-Irradiated Poly(dimethylsiloxane) Probed by Chemical Force Microscopy, Force Titration, and Electrokinetic Measurements. Langmuir 2007, 23, 5430–5438. [Google Scholar] [CrossRef] [PubMed]
- Lego, B.; Skene, W.G.; Giasson, S. Swelling Study of Responsive Polyelectrolyte Brushes Grafted from Mica Substrates: Effect of pH, Salt, and Grafting Density. Macromolecules 2010, 43, 4384–4393. [Google Scholar] [CrossRef]
- Li, H.; Liu, B.; Zhang, X.; Gao, C.; Shen, J.; Zou, G. Single-Molecule Force Spectroscopy on Poly(acrylic acid) by AFM. Langmuir 1999, 15, 2120–2124. [Google Scholar] [CrossRef]
- Swift, T.; Swanson, L.; Geoghegan, M.; Rimmer, S. The pH-responsive behaviour of poly(acrylic acid) in aqueous solution is dependent on molar mass. Soft Matter 2016, 12, 2542–2549. [Google Scholar] [CrossRef] [Green Version]
- Teorell, T. Transport phenomena in membranes eighth Spiers Memorial Lecture. Discuss. Faraday Soc. 1956, 21, 9–26. [Google Scholar] [CrossRef]
- Ohshima, H.; Ohki, S. Donnan potential and surface potential of a charged membrane. Biophys. J. 1985, 47, 673–678. [Google Scholar] [CrossRef] [Green Version]


Publisher’s Note: MDPI stays neutral with regard to jurisdictional claims in published maps and institutional affiliations. |
© 2021 by the authors. Licensee MDPI, Basel, Switzerland. This article is an open access article distributed under the terms and conditions of the Creative Commons Attribution (CC BY) license (https://creativecommons.org/licenses/by/4.0/).
Share and Cite
Chun, B.; Chun, M.-S. Electrostatic Potential Analysis in Polyelectrolyte Brush-Grafted Microchannels Filled with Polyelectrolyte Dispersion. Micromachines 2021, 12, 1475. https://doi.org/10.3390/mi12121475
Chun B, Chun M-S. Electrostatic Potential Analysis in Polyelectrolyte Brush-Grafted Microchannels Filled with Polyelectrolyte Dispersion. Micromachines. 2021; 12(12):1475. https://doi.org/10.3390/mi12121475
Chicago/Turabian StyleChun, Byoungjin, and Myung-Suk Chun. 2021. "Electrostatic Potential Analysis in Polyelectrolyte Brush-Grafted Microchannels Filled with Polyelectrolyte Dispersion" Micromachines 12, no. 12: 1475. https://doi.org/10.3390/mi12121475
APA StyleChun, B., & Chun, M.-S. (2021). Electrostatic Potential Analysis in Polyelectrolyte Brush-Grafted Microchannels Filled with Polyelectrolyte Dispersion. Micromachines, 12(12), 1475. https://doi.org/10.3390/mi12121475