2.1. Optimization of assay conditions
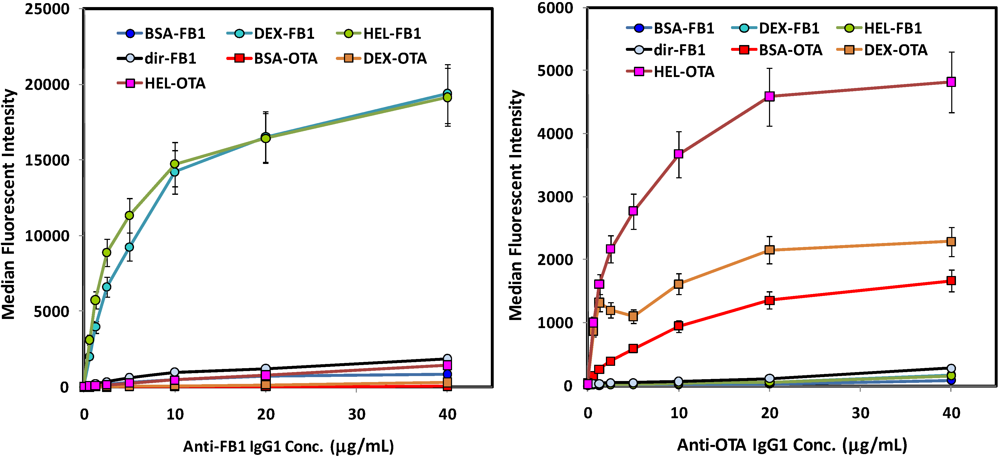
Initial experiments were designed to evaluate binding of the anti-toxin antibodies to the various toxin-coated microspheres before a competitive assay was developed; dose-response curves were generated to assess the optimal concentration of tracer antibodies that provide both strong signal in the absence of toxin, but whose binding to the toxin-coated beads could be effectively competed at low concentrations of soluble mycotoxin. While K
ds have not been determined for either antibody, neither approached binding saturation rapidly, indicating fairly low affinities. Thus, one is forced to compromise between using sufficient antibody to generate a strong signal, while limiting excess antibody which would negatively affect assay sensitivity. We chose concentrations of anti-FB1 and anti-OTA in the Luminex assays in the low μg/mL range (
Figure 1). A higher concentration of anti-OTA than anti-FB1 was required to generate a robust fluorescent signal, which may in part explain why in buffer the sensitivity of OTA assays was lower than that of FB1 assays.
Figure 1.
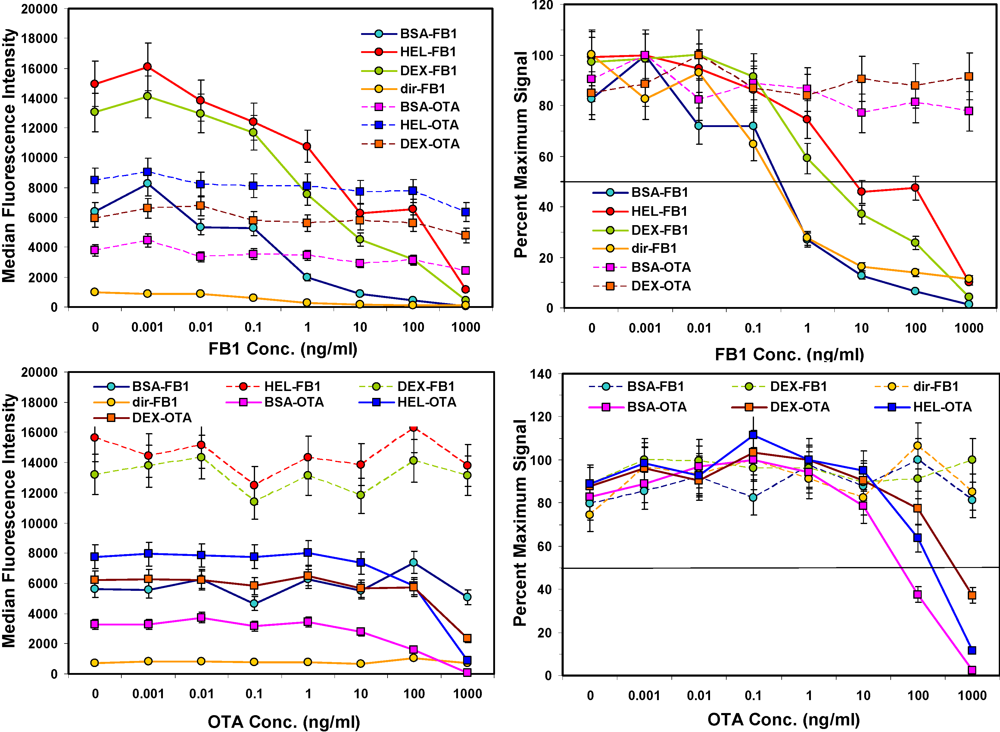
Direct binding assays of antibodies to mycotoxin-decorated beads (no competition). Left: FB1 assays using biotinylated anti-FB1 IgG tracer; FB1-coated beads are shown with circle symbols, whereas OTA-coated beads are shown with square symbols. Right: OTA assays using biotinylated anti-OTA IgG. Beads derivatized with mycotoxins are indicated as follows: FB1 via its amine (dir-FB1); FB1 via its carboxyls through BSA (BSA-FB1), lysozyme (HEL-FB1), or aminodextran (DEX-FB1); OTA via its carboxyl through BSA (BSA-OTA), lysozyme (HEL-OTA), or aminodextran (DEX-OTA).
Figure 1.
Direct binding assays of antibodies to mycotoxin-decorated beads (no competition). Left: FB1 assays using biotinylated anti-FB1 IgG tracer; FB1-coated beads are shown with circle symbols, whereas OTA-coated beads are shown with square symbols. Right: OTA assays using biotinylated anti-OTA IgG. Beads derivatized with mycotoxins are indicated as follows: FB1 via its amine (dir-FB1); FB1 via its carboxyls through BSA (BSA-FB1), lysozyme (HEL-FB1), or aminodextran (DEX-FB1); OTA via its carboxyl through BSA (BSA-OTA), lysozyme (HEL-OTA), or aminodextran (DEX-OTA).
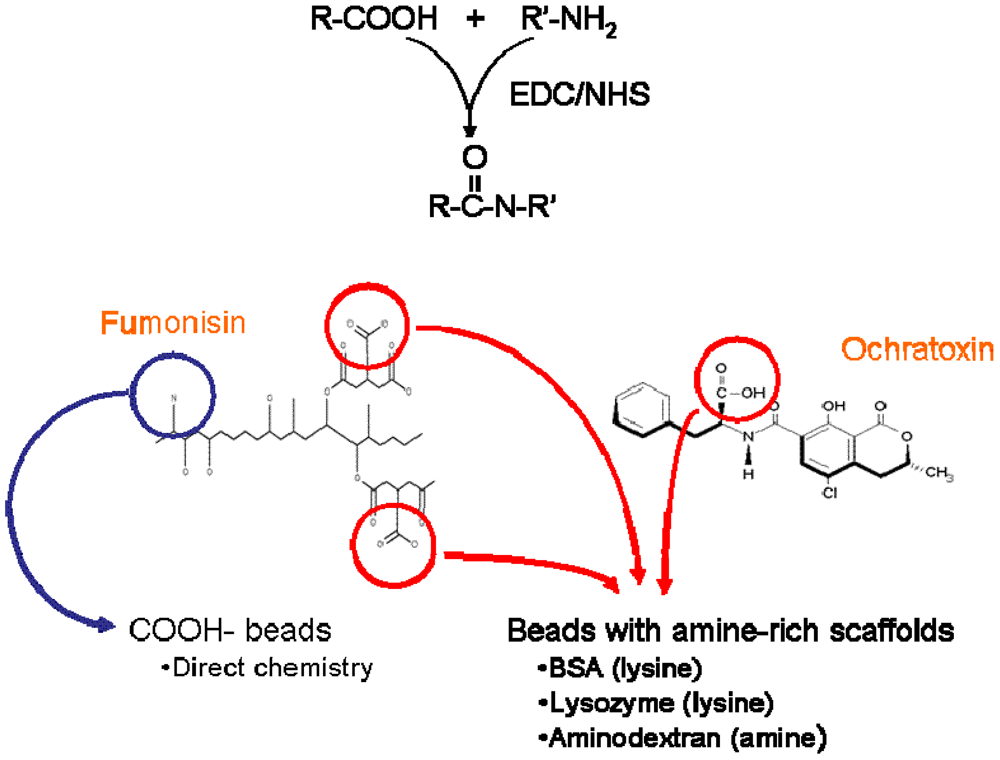
As mycotoxins and other small molecules most often possess only a single epitope and are frequently bound by antibodies in only one orientation, we addressed the critical issue of antigen presentation on the beads. Since the beads are commercially available with carboxyl-modified surfaces, FB1 can be linked directly to carboxyl-microspheres through its available amine using EDC chemistry (
Figure 2, left side, blue arrow). However, OTA does not possess a primary amine for EDC-mediated linking, but rather, a carboxyl residue; FB1 additionally possesses two carboxyl moieties. To allow immobilization of the toxins
via their carboxyl groups, we converted carboxyl-decorated microspheres to amine-decorated ones using a number of amine-rich scaffolds. These large molecules have the additional benefit of potentially increasing both the number and density of amines available for toxin attachment. BSA was used to provide a surface with low non-specific binding, whereas both lysozyme and amino-dextran were used to provide surfaces with a preponderance of amines available for the next reaction (
Figure 2, "beads with amine-rich scaffolds").
Figure 2.
Overall scheme for attachment of mycotoxins to microspheres. Top: EDC-mediated coupling of carboxyls to amines. Lower left: Fumonisin can be attached to carboxy-decorated beads via its single amine (blue arrow) or to beads decorated with amine-rich scaffolds via its two carboxyl residues (red). Lower right: Ochratoxin is attached to amine-decorated beads via its carboxyl moiety.
Direct binding studies of biotinylated antibodies to these various toxin-coated microspheres showed a similar pattern for both the OTA and the FB1 (
Figure 1): highest binding was obtained on both OTA and FB1 beads where the mycotoxins were immobilized through lysozyme and aminodextran. Interestingly, anti-FB1 antibodies bound very poorly to microspheres on which FB1 had been immobilized
via its primary amine (
Figure 1, left panel; light blue circles, black line). These results imply that the amine on FB1 is a critical part of the anti-FB1 antibody binding epitope. However, as EDC-mediated coupling results in a zero-length link, it is possible the signal was also reduced by limited freedom of movement of the directly-immobilized FB1; further immobilization studies utilizing linkers directed towards this end of the FB1 molecule should help elucidate the mechanism. In general, these results underscore the value in attaching a target, especially small molecule targets, to the surface using a variety of linkers that can provide a range of flexibilities and densities.
2.2. Mycotoxin assays in buffer
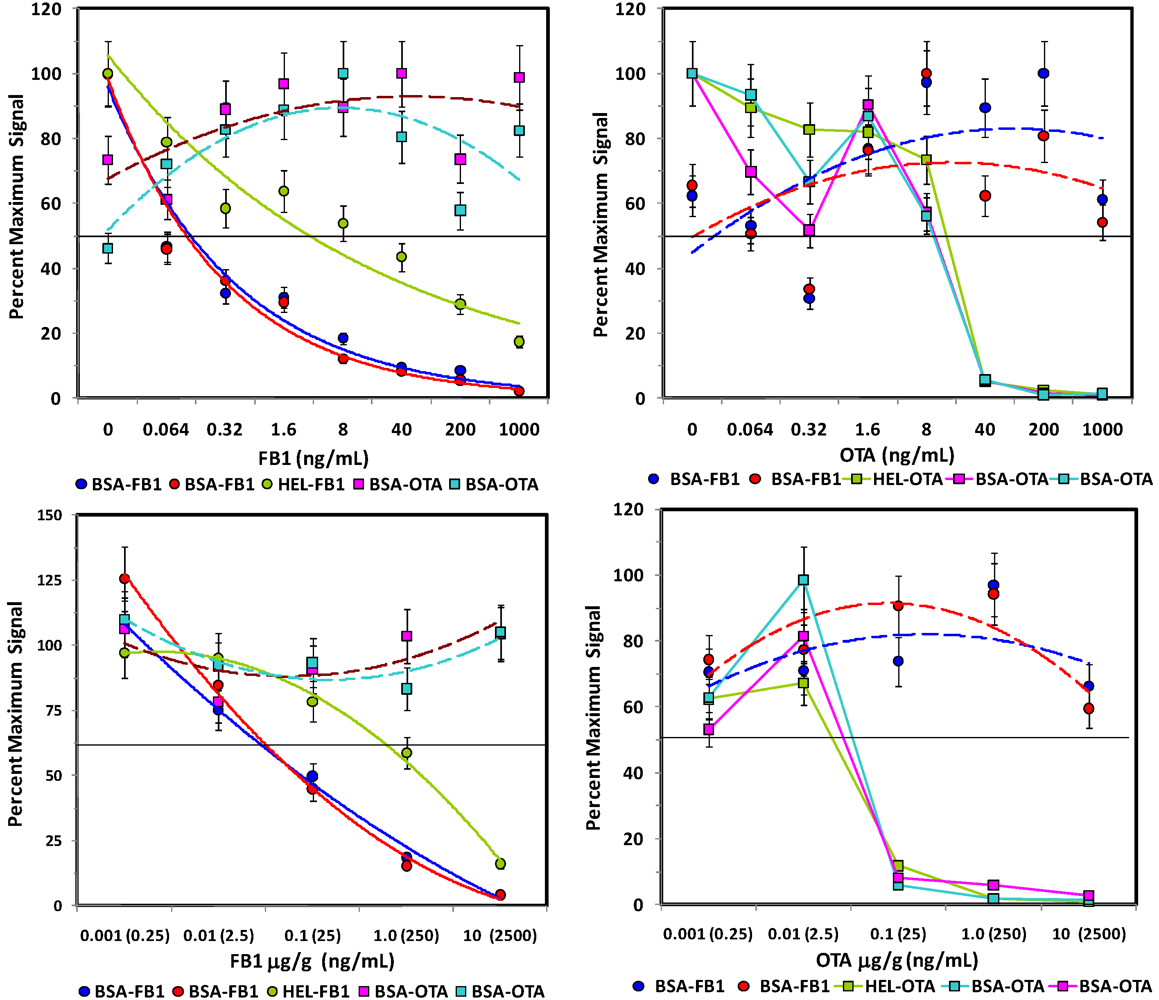
After the concentration of biotinylated tracer antibody was selected, the ability to inhibit the signal generated was examined by testing buffer samples with toxin spiked in at a wide range of concentrations. As expected, the higher the concentration of toxin, the lower the signal measured (
Figure 3, left hand panels). Signals from non-specific bead sets (
i.e., coated with a different toxin) were high and did not drop significantly. These results indicated that specificity of the bead sets was as expected: OTA present in solution caused inhibition on only OTA-coated beads and not FB1-coated beads, while FB1 in solution affected only FB1-coated beads and not OTA-coated beads. Although the microspheres with fumonisin immobilized
via its available amine were not bound well by the anti-FB1 antibody (solid orange line, upper left panel), when displayed as percent maximum signal (upper right panel), the inhibition curve was remarkably similar to that where FB1 was immobilized by its carboxyls using BSA as a scaffold.
Figure 3.
Competitive assays in buffer. FB1 or OTA were spiked into PBST, mixed with toxin-coated beads, and then incubated with a mix of both biotinylated-Mab tracers. After binding, unbound antibodies were removed by filtration and SA-PE was added prior to measurement on the Luminex 100. Top: FB1 assays; FB1-coated beads are shown with solid lines, whereas OTA-coated beads are shown with dashed lines. Bottom: OTA assays; OTA-coated beads are shown with solid lines, whereas FB1-coated beads are shown with dashed lines. Error bars represent SD.
2.3. Mycotoxin assays in food products
Various food extracts have been shown to affect mycotoxin immunoassays [
3,
4,
12,
13,
14]. To distinguish between interference from the sample matrix and overall extraction efficiencies, our approach was to test spiked control extracts, and later apply to grain samples spiked
before extraction. Since most validated methods for mycotoxin extraction from grains involve organic solvents, our initial experiments utilized methanolic extracts made from unspiked ground corn and oats. In contrast to our previous studies [
7,
8,
9,
15], even the presence of low methanol concentrations (5%) produced inconsistent results. We therefore tried drying down the methanolic extracts under nitrogen and resuspending them in buffer before analysis. Assay results from the dried methanolic oat extracts were reproducible and relatively sensitive; 10 ng/g concentrations of both FB1 and OTA gave 50% inhibition relative to controls. However, methanolic corn extracts showed an increase in signals from FB1-coated beads at low FB1 concentrations and high concentrations of OTA gave rise to (non-specific) inhibition on FB1-coated beads in the corn extracts (data not shown). When combined with the significant increase in overall processing time due to methanol removal, we chose to test extraction of mycotoxins from the corn and oatmeal in an aqueous buffer; this method has been shown effective in corn [
16]. Other methods with potential to mitigate this effect include solvent partitioning/removal [
17,
18] and use of recognition molecules tolerant to high methanol [
19,
20].
Figure 4.
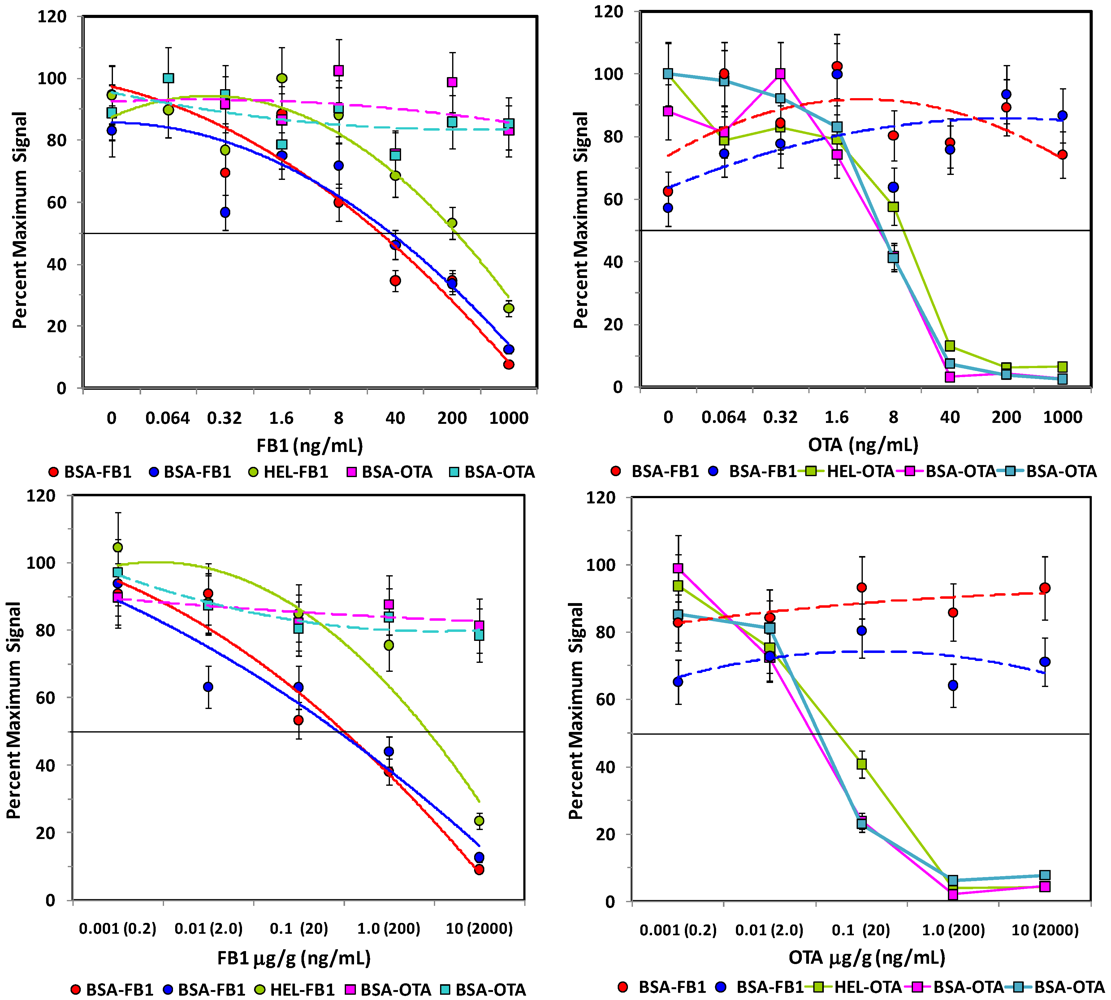
Competitive assays of spiked oats. Upper panels: Assays of control extracts spiked with FB1 (left) or OTA (right). Lower panels: Assays of oats spiked with FB1 (left) or OTA (right) before extraction. Plots are shown as percent of the maximum (uninhibited) signal. Microsphere sets specific for the FB1 are shown as square symbols, OTA-coated beads are shown as circle symbols. Error bars represent SEM.
Figure 4.
Competitive assays of spiked oats. Upper panels: Assays of control extracts spiked with FB1 (left) or OTA (right). Lower panels: Assays of oats spiked with FB1 (left) or OTA (right) before extraction. Plots are shown as percent of the maximum (uninhibited) signal. Microsphere sets specific for the FB1 are shown as square symbols, OTA-coated beads are shown as circle symbols. Error bars represent SEM.
The sensitivity for the toxins spiked into the aqueous oat extracts (
Figure 4, top panels) was generally similar to that observed in buffer (
Figure 3), although the response of the non-specific bead sets became more erratic (dashed lines), especially in OTA assays. These results indicate that a large degree of inhibition must be observed on the toxin-specific beads (e.g., 50% inhibition) to attribute any inhibition to the presence of the toxin with confidence. In contrast to oats extracted with methanol, the PBST oat extract was quite viscous, making filtration on the microtitre plate difficult. Future work in this matrix could potentially utilize MagPlex beads to facilitate separation and washing steps.
Analogous experiments were performed with corn samples spiked before and after extraction with aqueous buffer (
Figure 5). In contrast to the methanolic extracts, signals were more reproducible in the aqueous extracts with no artifacts. Although response in OTA assays was similar to that observed in both buffer and oat extract, inhibition in FB1-spiked corn extracts was dampened; 50% inhibition was observed at 40 ng/mL or higher in spiked corn extract, whereas this same inhibition was observed at a concentration at least 4-fold lower in buffer and oat extracts.
Figure 5.
Competitive assays of spiked corn. Upper panels: Assays of control extracts spiked with FB1 (left) or OTA (right). Lower panels: Assays of corn spiked with FB1 (left) or OTA [right]
before extraction. Plots displayed are analogous to those in
Figure 4.
Figure 5.
Competitive assays of spiked corn. Upper panels: Assays of control extracts spiked with FB1 (left) or OTA (right). Lower panels: Assays of corn spiked with FB1 (left) or OTA [right]
before extraction. Plots displayed are analogous to those in
Figure 4.
After the extent of interference due to the oat and corn matrices was evaluated, FB1 and OTA were spiked into the ground grains
prior to extraction to determine the extent of sample loss due to the extraction procedure (
Figure 4 and
Figure 5, lower panels). In contrast to studies using dried methanol extracts, FB1 and OTA could be detected in aqueous extracts of corn, as well as oats. However, while over 50% recovery was obtained when using methanol to extract FB1- and OTA-spiked oats, 1.5% and 15% recoveries was obtained from FB1- and OTA-spiked oat samples, respectively, when extracted with PBST. The exceedingly low recoveries may well be due to the viscosity of the PBST oat extract or to the presence of colloidal particulates, even when spun immediately before analysis. On the other hand, 20-40% recovery was obtained with PBST extracts of corn. Overall, these results were not surprising, since methanolic extractions have been demonstrated to have higher efficiencies than fully aqueous extractions [
16].
In spite of extraction efficiencies of <50%, FB1 was detectable at levels below FDA Advisory Levels (
Table 1) and gave a fairly linear response over a large concentration range. Thus, the FB1 assays were predictive of toxin concentration in both corn and oats. OTA assays, on the other hand, exhibited a very sharp transition in its dose-response, indicating that quantification for that toxin would be difficult in this matrix. However, at OTA concentrations over 100 ng/g, a yes/no determination could be made under the present assay conditions. Clearly however, significant improvement must be obtained for detection of OTA to assure contamination is below the required level (2 ng/g).
Table 1.
Mycotoxin concentrations giving 50% inhibition (BSA-FB1- or BSA-OTA-coated beads).
Table 1.
Mycotoxin concentrations giving 50% inhibition (BSA-FB1- or BSA-OTA-coated beads).
| | Buffer | Oats | Corn | FDA Level |
|---|
| Spiked extract | Spiked before extraction | Spiked extract | Spiked before extraction |
|---|
| FB1 | ~0.3 ng/mL | 0.32 ng/mL | 100 ng/g | 40 ng/mL | 1 μg/g | 2 ppm |
| OTA | ~30 ng/mL | 0.8 ng/mL | ~30 ng/g | 8 ng/mL | 100 ng/g | 5 ppb |
Overall, this work has demonstrated that competitive fluid array immunoassays can readily be developed for detection of mycotoxins found in food products. Although both FB1 and OTA could be detected in spiked oats and corn, sensitivity was a serious issue for OTA; FDA advisory levels for OTA are in the ppb, rather than ppm, range. Although initial experiments using methanol extraction protocol proved problematic with corn samples, a simple extraction using PBST could be used to detect FB1 in both corn and oats. Although the loss in extraction efficiency was a significant limitation, the PBST extraction eliminated the time-consuming drying step and provided sample extracts in a buffer compatible with Luminex immunoassays. Nonetheless, sample preparation is clearly a major consideration, and may require optimization for each food matrix being tested. There are a number of commercially available rapid sample preparation and/or solvent clean-up kits that can be used to accomplish the same purpose [
21,
22]. Although the Luminex 100 system can evaluate up to 100 different sets of microspheres simultaneously, for most of our experiments we only utilized 6 sets at a time to assay for two different mycotoxins in triplicate. A number of attempts were made to develop the assay as a simple homogeneous, one-step assay where all the reagents (microspheres, antibody, SA-PE, and sample) were simply mixed and measured (data not shown). While the homogeneous assays performed well in spiked buffer samples, tests in the food matrices were disappointingly erratic. After several failed attempts, the homogeneous method was abandoned in favor of the two-step method described here (incubation of sample/microspheres/antibody, followed by incubation with SA-PE conjugate). The two-step method, while requiring more handling steps, alleviates the need to accurately balance the amount of biotinylated antibody and SA-PE, a process which would become increasingly more problematic as one attempts to increase the level of multiplexing. That being said, we anticipate that the ability to multiplex mycotoxins immunoassays will likely be limited more by immuno-reagent capability than by the analytical system.


