Economic Evaluation of the InTENSE Program of Therapy Alongside Botulinum Neurotoxin a for the Rehabilitation of Chronic Upper Limb Spasticity

 , , , , and
Abstract
1. Introduction
2. Materials and Methods
2.1. Measurement, Valuation, and Analysis of Costs
2.2. Measurement and Valuation of Benefit
2.3. Cost–Utility Analysis
2.4. Statistical Analysis
3. Results
4. Discussion
5. Conclusions
Supplementary Materials
Author Contributions
Funding
Institutional Review Board Statement
Informed Consent Statement
Data Availability Statement
Acknowledgments
Conflicts of Interest
Abbreviations
| BoNT-A | Botulinum neurotoxin A |
| CI | Confidence interval |
| DOAJ | Directory of Open Access Journals |
| EQ-5D | Euroqol five dimension |
| EQ-5D-3L | Euroqol five dimension three level |
| GAS | Goal Attainment Scale |
| GP | General practitioner |
| HRQOL | Health-related quality of life |
| ICER | Incremental cost-effectiveness ratio |
| LD | Linear dichroism |
| MAR | Missing at random |
| MBS | Medicare Benefits Schedule |
| MICE | Multiple imputation by chained equations |
| MDPI | Multidisciplinary Digital Publishing Institute |
| OT | Occupational therapist |
| PBS | Pharmaceutical Benefits Scheme |
| PMM | Predictive mean matching |
| PT | Physiotherapist |
| QALYs | Quality-adjusted life years |
| SD | Standard deviation |
| SUR | Seemingly unrelated regression |
| UK | United Kingdom |
| US | United States of America |
| WTP | Willingness to pay |
References
- Global Burden of Disease 2021 Causes of Death Collaborators. Global burden of 288 causes of death and life expectancy decomposition in 204 countries and territories and 811 subnational locations, 1990–2021: A systematic analysis for the Global Burden of Disease Study 2021. Lancet 2024, 403, 2100–2132. [Google Scholar] [CrossRef]
- Gillard, P.J.; Sucharew, H.; Kleindorfer, D.; Belagaje, S.; Varon, S.; Alwell, K.; Moomaw, C.J.; Woo, D.; Khatri, P.; Flaherty, M.L.; et al. The negative impact of spasticity on the health-related quality of life of stroke survivors: A longitudinal cohort study. Health Qual. Life Outcomes 2015, 13, 159. [Google Scholar] [CrossRef]
- Urban, P.P.; Wolf, T.; Uebele, M.; Marx, J.J.; Vogt, T.; Stoeter, P.; Bauermann, T.; Weibrich, C.; Vucurevic, G.D.; Schneider, A.; et al. Occurence and clinical predictors of spasticity after ischemic stroke. Stroke 2010, 41, 2016–2020. [Google Scholar] [CrossRef]
- Corbetta, D.; Sirtori, V.; Castellini, G.; Moja, L.; Gatti, R. Constraint-induced movement therapy for upper extremities in people with stroke. Cochrane Database Syst. Rev. 2015, 2015, CD004433. [Google Scholar] [CrossRef]
- Coupar, F.; Pollock, A.; Legg, L.A.; Sackley, C.; van Vliet, P. Home-based therapy programmes for upper limb functional recovery following stroke. Cochrane Database Syst. Rev. 2012, 2012, CD006755. [Google Scholar] [CrossRef]
- Winter, J.; Hunter, S.; Sim, J.; Crome, P. Hands-on therapy interventions for upper limb motor dysfunction following stroke. Cochrane Database Syst. Rev. 2011, 2011, CD006609. [Google Scholar] [CrossRef]
- National Institute for Health and Care Excellence. Stroke Rehabilitation in Adults; NICE guideline NG236; National Institute for Health and Care Excellence: London, UK, 2023. Available online: www.nice.org.uk/guidance/ng236 (accessed on 20 April 2025).
- Gupta, A.D.; Baguley, I.; Estell, J.; Geffon, S.; Goh, K.; Rawicki, B.; De Graaf, S.; Olver, J. Statement of the Rehabilitation Medicine Society of Australia and New Zealand for the therapeutic use of botulinum toxin A in spasticity management. Intern. Med. J. 2024, 54, 178–182. [Google Scholar] [CrossRef]
- Demetrios, M.; Khan, F.; Turner-Stokes, L.; Brand, C.; McSweeney, S. Multidisciplinary rehabilitation following botulinum toxin and other focal intramuscular treatment for post-stroke spasticity. Cochrane Database Syst. Rev. 2013, 2013, CD009689. [Google Scholar] [CrossRef]
- Lannin, N.A.; Ada, L.; English, C.; Ratcliffe, J.; Faux, S.; Palit, M.; Gonzales, S.; Olver, J.; Schneider, E.; Crotty, M.; et al. Long-term effect of additional rehabilitation following botulinum toxin-A on upper limb activity in chronic stroke: The InTENSE randomised trial. BMC Neurol. 2022, 22, 154. [Google Scholar] [CrossRef]
- Lannin, N.A.; Ada, L.; English, C.; Ratcliffe, J.; Faux, S.; Palit, M.; Gonzales, S.; Olver, J.; Cameron, I.; Crotty, M. Effect of Additional Rehabilitation After Botulinum Toxin-A on Upper Limb Activity in Chronic Stroke: The InTENSE Trial. Stroke 2020, 51, 556–562. [Google Scholar] [CrossRef]
- Turcu-Stiolica, A.; Subtirelu, M.S.; Bumbea, A.M. Cost-Utility Analysis of Incobotulinumtoxin-A Compared with Conventional Therapy in the Management of Post-Stroke Spasticity in Romania. Front. Pharmacol. 2019, 10, 1516. [Google Scholar] [CrossRef]
- Rychlik, R.; Kreimendahl, F.; Schnur, N.; Lambert-Baumann, J.; Dressler, D. Quality of life and costs of spasticity treatment in German stroke patients. Health Econ. Rev. 2016, 6, 1–9. [Google Scholar]
- Rodriguez, M.E.; Fernandez, M.; Del Llano, J.; Nuno-Solinis, R. Systematic review and cost-effectiveness analysis of the treatment of post-stroke spasticity with abobotulinumtoxinA compared to physiotherapy. Farm. Hosp. 2023, 47, 201–209. [Google Scholar] [CrossRef]
- Fheodoroff, K.; Danchenko, N.; Whalen, J.; Balcaitiene, J.; Magalhães, B.; Szulc, E.; Zaffalon, A.; Burchakova, M.; Nechiporenko, D.; Robbins, S. Modelling Long-Term Outcomes and Risk of Death for Patients with Post-Stroke Spasticity Receiving Abobotulinumtoxina Treatment and Rehabilitation Therapy. J. Rehabil. Med. 2022, 54, 2422. [Google Scholar] [CrossRef]
- Moore, P.; Danchenko, N.; Weidlich, D.; Tijerina, A.R. Cost-effectiveness of abobotulinumtoxinA plus best supportive care compared with best supportive care alone for early treatment of adult lower limb spasticity following an acute event. PLoS ONE 2024, 19, e0296340. [Google Scholar] [CrossRef]
- Shackley, P.; Shaw, L.; Price, C.; van Wijck, F.; Barnes, M.; Graham, L.; Ford, G.A.; Steen, N.; Rodgers, H. Cost-effectiveness of treating upper limb spasticity due to stroke with botulinum toxin type a: Results from the botulinum toxin for the upper limb after stroke (BoTULS) trial. Toxins 2012, 4, 1415–1426. [Google Scholar] [CrossRef]
- Edney, L.C.; Haji Ali Afzali, H.; Cheng, T.C.; Karnon, J. Estimating the Reference Incremental Cost-Effectiveness Ratio for the Australian Health System. Pharmacoeconomics 2018, 36, 239–252. [Google Scholar] [CrossRef]
- Kazerooni, R.; Howard, I.M.; Keener, A.M.; Bounthavong, M. Real-World Six-Year National Cost-Minimization Analysis of IncobotulinumtoxinA and OnabotulinumtoxinA in the VA/DoD Healthcare Systems. Clin. Outcomes Res. 2021, 13, 603–609. [Google Scholar] [CrossRef]
- Danchenko, N.; Johnston, K.M.; Whalen, J. The cost-effectiveness of abobotulinumtoxinA (Dysport) and onabotulinumtoxinA (Botox) for managing spasticity of the upper and lower limbs, and cervical dystonia. J. Med. Econ. 2022, 25, 919–929. [Google Scholar] [CrossRef]
- Nomikos, N.; Eleftheriou, C.; Athanasakis, K. A Cost-Effectiveness and Budget Impact Analysis of AbobotulinumtoxinA in Greece. Toxins 2023, 15, 561. [Google Scholar] [CrossRef]
- Makino, K.; Tilden, D.; Guarnieri, C.; Mudge, M.; Baguley, I.J. Cost Effectiveness of Long-Term Incobotulinumtoxin-A Treatment in the Management of Post-stroke Spasticity of the Upper Limb from the Australian Payer Perspective. Pharmacoecon. Open 2018, 3, 93–102. [Google Scholar] [CrossRef]
- Kanovský, P.; Slawek, J.; Denes, Z.; Platz, T.; Sassin, I.; Comes, G.; Grafe, S. Efficacy and safety of botulinum neurotoxin NT 201 in poststroke upper limb spasticity. Clin. Neuropharmacol. 2009, 32, 259–265. [Google Scholar] [CrossRef]
- Milte, R.; Ratcliffe, J.; Ada, L.; English, C.; Crotty, M.; Lannin, N.A. Protocol for the economic evaluation of the InTENSE program for rehabilitation of chronic upper limb spasticity. BMC Health Serv. Res. 2020, 20, 1–6. [Google Scholar] [CrossRef]
- Lannin, N.A.; Ada, L.; English, C.; Ratcliffe, J.; Crotty, M. Effect of adding upper limb rehabilitation to botulinum toxin-A on upper limb activity after stroke: Protocol for the InTENSE trial. Int. J. Stroke 2018, 13, 648–653. [Google Scholar] [CrossRef]
- Ada, L.; Dorsch, S.; Canning, C.G. Strengthening interventions increase strength and improve activity after stroke: A systematic review. Aust. J. Physiother. 2006, 52, 241–248. [Google Scholar] [CrossRef]
- Australian Government Department of Veterans’ Affairs. Dental and Allied Health Fee Schedules Canberra, Australia: Australian Government Department of Veterans’ Affairs. Available online: https://www.dva.gov.au/get-support/providers/fees-forms-claims-providers/fee-schedules/dental-and-allied-health-fee-schedules (accessed on 5 March 2025).
- Australian Government Department of Health. MBS Online Medicare Benefits Schedule; Commonwealth of Australia: Canberra, Australia, 2018. Available online: http://www.mbsonline.gov.au/internet/mbsonline/publishing.nsf/Content/Home (accessed on 20 March 2021).
- Department of Health and Aged Care. The Pharmaceutical Benefits Scheme; Australian Government: Canberra, Australia, 2025. Available online: https://www.pbs.gov.au/pbs/home (accessed on 20 January 2025).
- Independent Hospital Pricing Authority. National Hospital Cost Data Collection Report, Public Sector, Round 23 (Financial Year 2018–2019); Independent Hospital Pricing Authority: Sydney, Australia, 2021. [Google Scholar]
- Department of Health and Aged Care. Commonwealth Home Support Programme (CHSP)—Payment in Arrears and Unit Pricing Fact Sheet; Australian Government: Canberra, Australia, 2021. Available online: https://www.health.gov.au/resources/publications/commonwealth-home-support-programme-chsp-payment-in-arrears-and-unit-pricing-fact-sheet?language=en (accessed on 20 January 2021).
- Department of Health and Aged Care. Home Care Package Fees; Australian Government: Canberra, Australia, 2022. Available online: https://www.health.gov.au/our-work/hcp/fees (accessed on 13 March 2022).
- Department of Health and Aged Care. Schedule of Fees and Charges for Residential and Home Care; Australian Government: Canberra, Australia, 2022. Available online: https://www.health.gov.au/our-work/residential-aged-care/charging/fees (accessed on 13 March 2022).
- Glick, H.A.; Doshi, J.A.; Sonnad, S.S.; Polsky, D. Economic Evaluation in Clinical Trials, 2nd ed.; Univeristy Press: Oxford, UK, 2015. [Google Scholar]
- Drummond, M.F.; Sculpher, M.J.; Claxton, K.; Stoddart, G.L.; Torrance, G.W. Methods for the Economic Evaluation of Health Care Programmes, 4th ed.; Univeristy Press: Oxford, UK, 2015. [Google Scholar]
- The EuroQol Group. EuroQol—A new facility for the measurement of health-related quality of life. Health Policy 1990, 16, 199–208. [Google Scholar] [CrossRef]
- Viney, R.; Norman, R.; King, M.T.; Cronin, P.; Street, D.J.; Knox, S.; Ratcliffe, J. Time trade-off derived EQ-5D weights for Australia. Value Health J. Int. Soc. Pharmacoecon. Outcomes Res. 2011, 14, 928–936. [Google Scholar] [CrossRef]
- Kiresuk, T.; Smith, A.; Cardillo, J. Goal Attainment Scaling: Applications, Theory, and Measurement; Taylor & Francis: New York, NY, USA, 2014. [Google Scholar]
- White, I.R.; Royston, P.; Wood, A.M. Multiple imputation using chained equations: Issues and guidance for practice. Stat. Med. 2011, 30, 377–399. [Google Scholar] [CrossRef]
- Australian Institute of Health and Welfare. Health Expenditure Australia 2018–2019; AIHW: Canberra, Australia, 2020. [Google Scholar]
- Little, R.; Rubin, D. Statistical Analysis with Missing Data; Wiley: New York, NY, USA, 1987. [Google Scholar]
- Zellner, A.; Huang, D.S. Further properties of efficient estimators for seemingly unrelated regression equations. Int. Econ. Rev. 1962, 3, 300–313. [Google Scholar] [CrossRef]
- Cameron, I.D.; Ada, L.; Crotty, M.; Palit, M.; Huang, L.; Olver, J.; Faux, S.G.; Gonzales, S.; Anthonisz, B.; Bowman, M.; et al. The Lack of Effect of Botulinum Toxin-A on Upper Limb Activity in Chronic Stroke: A Short Report from the InTENSE Trial. Toxins 2024, 16, 510. [Google Scholar] [CrossRef]
- Al-Janabi, H.; van Exel, J.; Brouwer, W.; Coast, J. A Framework for Including Family Health Spillovers in Economic Evaluation. Med. Decis. Making 2016, 36, 176–186. [Google Scholar] [CrossRef]
- Unangst, J.; Lewis, T.; Laflamme, E.; Prachand, N.; Weaver, K. Transitioning the Healthy Chicago Survey from a Telephone Mode to Self-administered by Mail Mode. J. Public Health Manag. Pract. 2022, 28, 309–316. [Google Scholar] [CrossRef]
- Sinclair, M.; O’Toole, J.; Malawaraarachchi, M.; Leder, K. Comparison of response rates and cost-effectiveness for a community-based survey: Postal, internet and telephone modes with generic or personalised recruitment approaches. BMC Med. Res. Methodol. 2012, 12, 132. [Google Scholar] [CrossRef]

| Cost | Value | Source of Data | Source of Unit Cost |
|---|---|---|---|
| Intervention therapist time | AU $67.95 for 30 min consultation | Intervention records | Australian Department of Veterans’ affairs [27] |
| Intervention therapist travel | AU $0.72 per km | Intervention records | Australian Taxation Office |
| Intervention consumables (e.g., casts) | AU $95 GRASP kit AU $255.45 electrical stimulation machine AU $14.99 per hard/soft cast roll AU $23.67 per padding roll | Intervention records | Hospital finance data |
| Doctor visits Laboratory tests Radiology | Various | Administrative linked data | Medicare Benefits Schedule [28] |
| Medications | Various | Administrative linked data | Pharmaceutical Benefits Scheme [29] |
| Inpatient admissions | AU $5324 | Participant monthly diary | National Hospital Cost Data Collection Round 23 [30] |
| Emergency department presentations | AU $775 | Participant monthly diary | National Hospital Cost Data Collection Round 23 |
| Allied health outpatient visits | Various | Participant monthly diary | Department of Veterans’ Affairs |
| Home aged care services | AU $29–170 per day | Participant monthly diary | My Aged Care, Commonwealth Home Support Program [31,32] |
| Residential aged care services | AU $229.43 per day | Participant monthly diary | Department of Health- and Aged Care [33] |
| Variable | Intervention | Control | Test of Difference |
|---|---|---|---|
| Age (in years) | 61.81 | 60.18 | ns |
| Gender (female) | 0.32 | 0.30 | ns |
| Time since stroke (days) | 59.46 | 66.76 | ns |
| Side of hemiplegia (Right) | 0.35 | 0.36 | ns |
| Can walk on own | 0.42 | 0.46 | ns |
| Short Portable Mental Status Questionnaire (0–10) | 8.94 | 9.11 | ns |
| Level of education | 0.19 | 0.30 | ns |
| Living situation | 0.19 | 0.15 | ns |
| Sensation (0–2) | 1.01 | 0.92 | ns |
| Neglect (0–3) | 0.22 | 0.28 | ns |
| Box and Block Test (number of valid boxes) | 1.67 | 2.15 | ns |
| Pain scale (0–111 mm) | 1.91 | 1.86 | ns |
| Variable | Intervention (SD) | Control (SD) | Difference (Bootstrapped 95% CI), p-Value |
|---|---|---|---|
| EQ-5D-3L Scores (Raw (unimputed) scores) | |||
| EQ-5D-3L Scores at baseline | 0.54 (0.03) | 0.50 (0.03) | 0.04, [−0.04, 0.13], p = 0.310 |
| EQ-5D-3L Scores at 3 months | 0.60 (0.03) | 0.54 (0.03) | 0.06, [−0.02, 0.14] p = 0.137 |
| EQ-5D-3L Scores at 12 months | 0.60 (0.03) | 0.57 (0.03) | 0.03, [−0.06, 0.11], p = 0.516 |
| EQ-5D-3L Scores (imputed values) | |||
| EQ-5D-3L Scores at 3 months a | Not imputed | ||
| EQ-5D-3L Scores at 12 months b | 0.60 (0.25) | 0.57 (0.24) | 0.03 [−0.05, 0.12] p = 0.458 |
| Goal Attainment Scale (GAS) Scores (unimputed) | |||
| GAS scores at 3 months | 43.19 (12.37) | 40.74 (12.15) | 2.44 [−1.76, 6.64] p = 0.254 |
| GAS scores at 12 months | 41.22 (14.33) | 41.00 (13.47) | 0.22 [−4.69, 5.12] p = 0.930 |
| Resources | Intervention (SD) | Control (SD) | Difference (Bootstrapped 95% CI), p-Value |
|---|---|---|---|
| GP visits | 9.91 (1.25) | 12.03 (1.64) | −2.12 [−6.28, 2.04] p = 0.318 |
| Imaging procedures | 1.58 (0.26) | 2.43 (0.47) | −0.85 [−1.89, 0.19] p = 0.108 |
| Diagnostic procedures | 0.58 (0.15) | 0.74 (0.16) | −0.16 [−0.57, 0.25] p = 0.450 |
| Miscellaneous procedures | 2.39 (0.34) | 3.47 (0.48) | −1.08 [−2.19, 0.04] p = 0.058 |
| Pathology procedures | 13.42 (2.14) | 15.84 (3.97) | −2.41 [−11.56, 6.73] p = 0.605 |
| Professional Attendances | 8.55 (1.59) | 9.66 (1.33) | −1.12 [−4.99, 2.76] p = 0.572 |
| Therapeutic procedures | 1.06 (0.24) | 1.63 (0.37) | −0.57 [−1.45, 0.31] p = 0.202 |
| BoNT-A injection procedures | 0.30 (0.09) | 0.28 (0.09) | 0.02 [−0.22, 0.27] p = 0.850 |
| Drug prescriptions | 57.80 (4.73) | 64.01 (5.22) | −6.21 [−19.67, 7.24] p = 0.366 |
| Costs (AU $) | Intervention (SD) | Control (SD) | Difference (Bootstrapped 95% CI) |
|---|---|---|---|
| Intervention costs | 3249.35 (1032.01) | 0 (0) | 3249.35 [2997.68, 3501.03] p = 0.000 |
| Hospital | |||
| In-hospital | 1746.80 (3007.70) | 1080.15 (2341.90) | 666.65 [−240.58, 1573.89] p = 0.150 |
| Emergency department | 147.65 (364.58) | 112.35 (305.35) | 35.31 [−80.24, 150.86] p = 0.549 |
| Community care | |||
| OT and PT | 654.32 (1886.98) | 264.62 (1122.17) | 389.69 [−134.36, 913.75] p = 0.145 |
| Podiatry | 114.18 (395.04) | 17.38 (93.57) | 96.80 [1.12, 192.48] p = 0.047 |
| Home nursing | 1724.67 (10532.42) | 605.26 (3193.52) | 1119.42 [−1362.94, 3061.77] p = 0.377 |
| Domestic assistance | 910.29 (2723.25) | 434.12 (1434.98) | 479.16 [−291.49, 1243.82] p = 0.224 |
| Residential aged care | 5281.11 (14427.76) | 2992.57 (10255.17) | 2288.54 [−1986.17, 6563.25] p = 0.294 |
| MBS and PBS | 2227.28 (1696.59) | 2962.91 (3401.55) | −735.64 [−1620.42, 149.14] p = 0.103 |
| General Practitioner | 521.99 (456.75) | 662.57 (860.83) | −140.59 [−364.48, 83.31] p = 0.218 |
| Imaging | 244.75 (388.34) | 326.94 (494.74) | −82.19 [−236.56, 72.18] p = 0.297 |
| Diagnostic procedures | 40.76 (89.66) | 56.42 (111.51) | −15.67 [−49.07, 17.74] p = 0.358 |
| Miscellaneous procedures | 150.02 (247.08) | 202.86 (259.67) | −52.84 [−136.46, 30.77] p = 0.215 |
| Pathology | 221.49 (296.88) | 272.82 (508.53) | −51.33 [−193.40, 90.73] p = 0.479 |
| Professional Attendances | 740.62 (600.80) | 961.04 (1150.52) | −220.42 [−528.91, 88.07] p = 0.161 |
| Therapeutic procedures | 260.29 (687.27) | 439.06 (1148.35) | −178.77 [−513.60, 156.06] p = 0.295 |
| BoNT-A procedures | 47.36 (120.20) | 41.19 (118.25) | 6.17 [−34.19, 46.52] p = 0.765 |
| Pharmaceuticals | 2736.29 (4414.67) | 3018.04 (4377.43) | −281.75 [−1751.98, 1188.47] p = 0.707 |
| Variable | Intervention | Control | Difference [Bootstrapped 95% CI], p-Value |
|---|---|---|---|
| Base Case (Imputed Values, n = 140) | |||
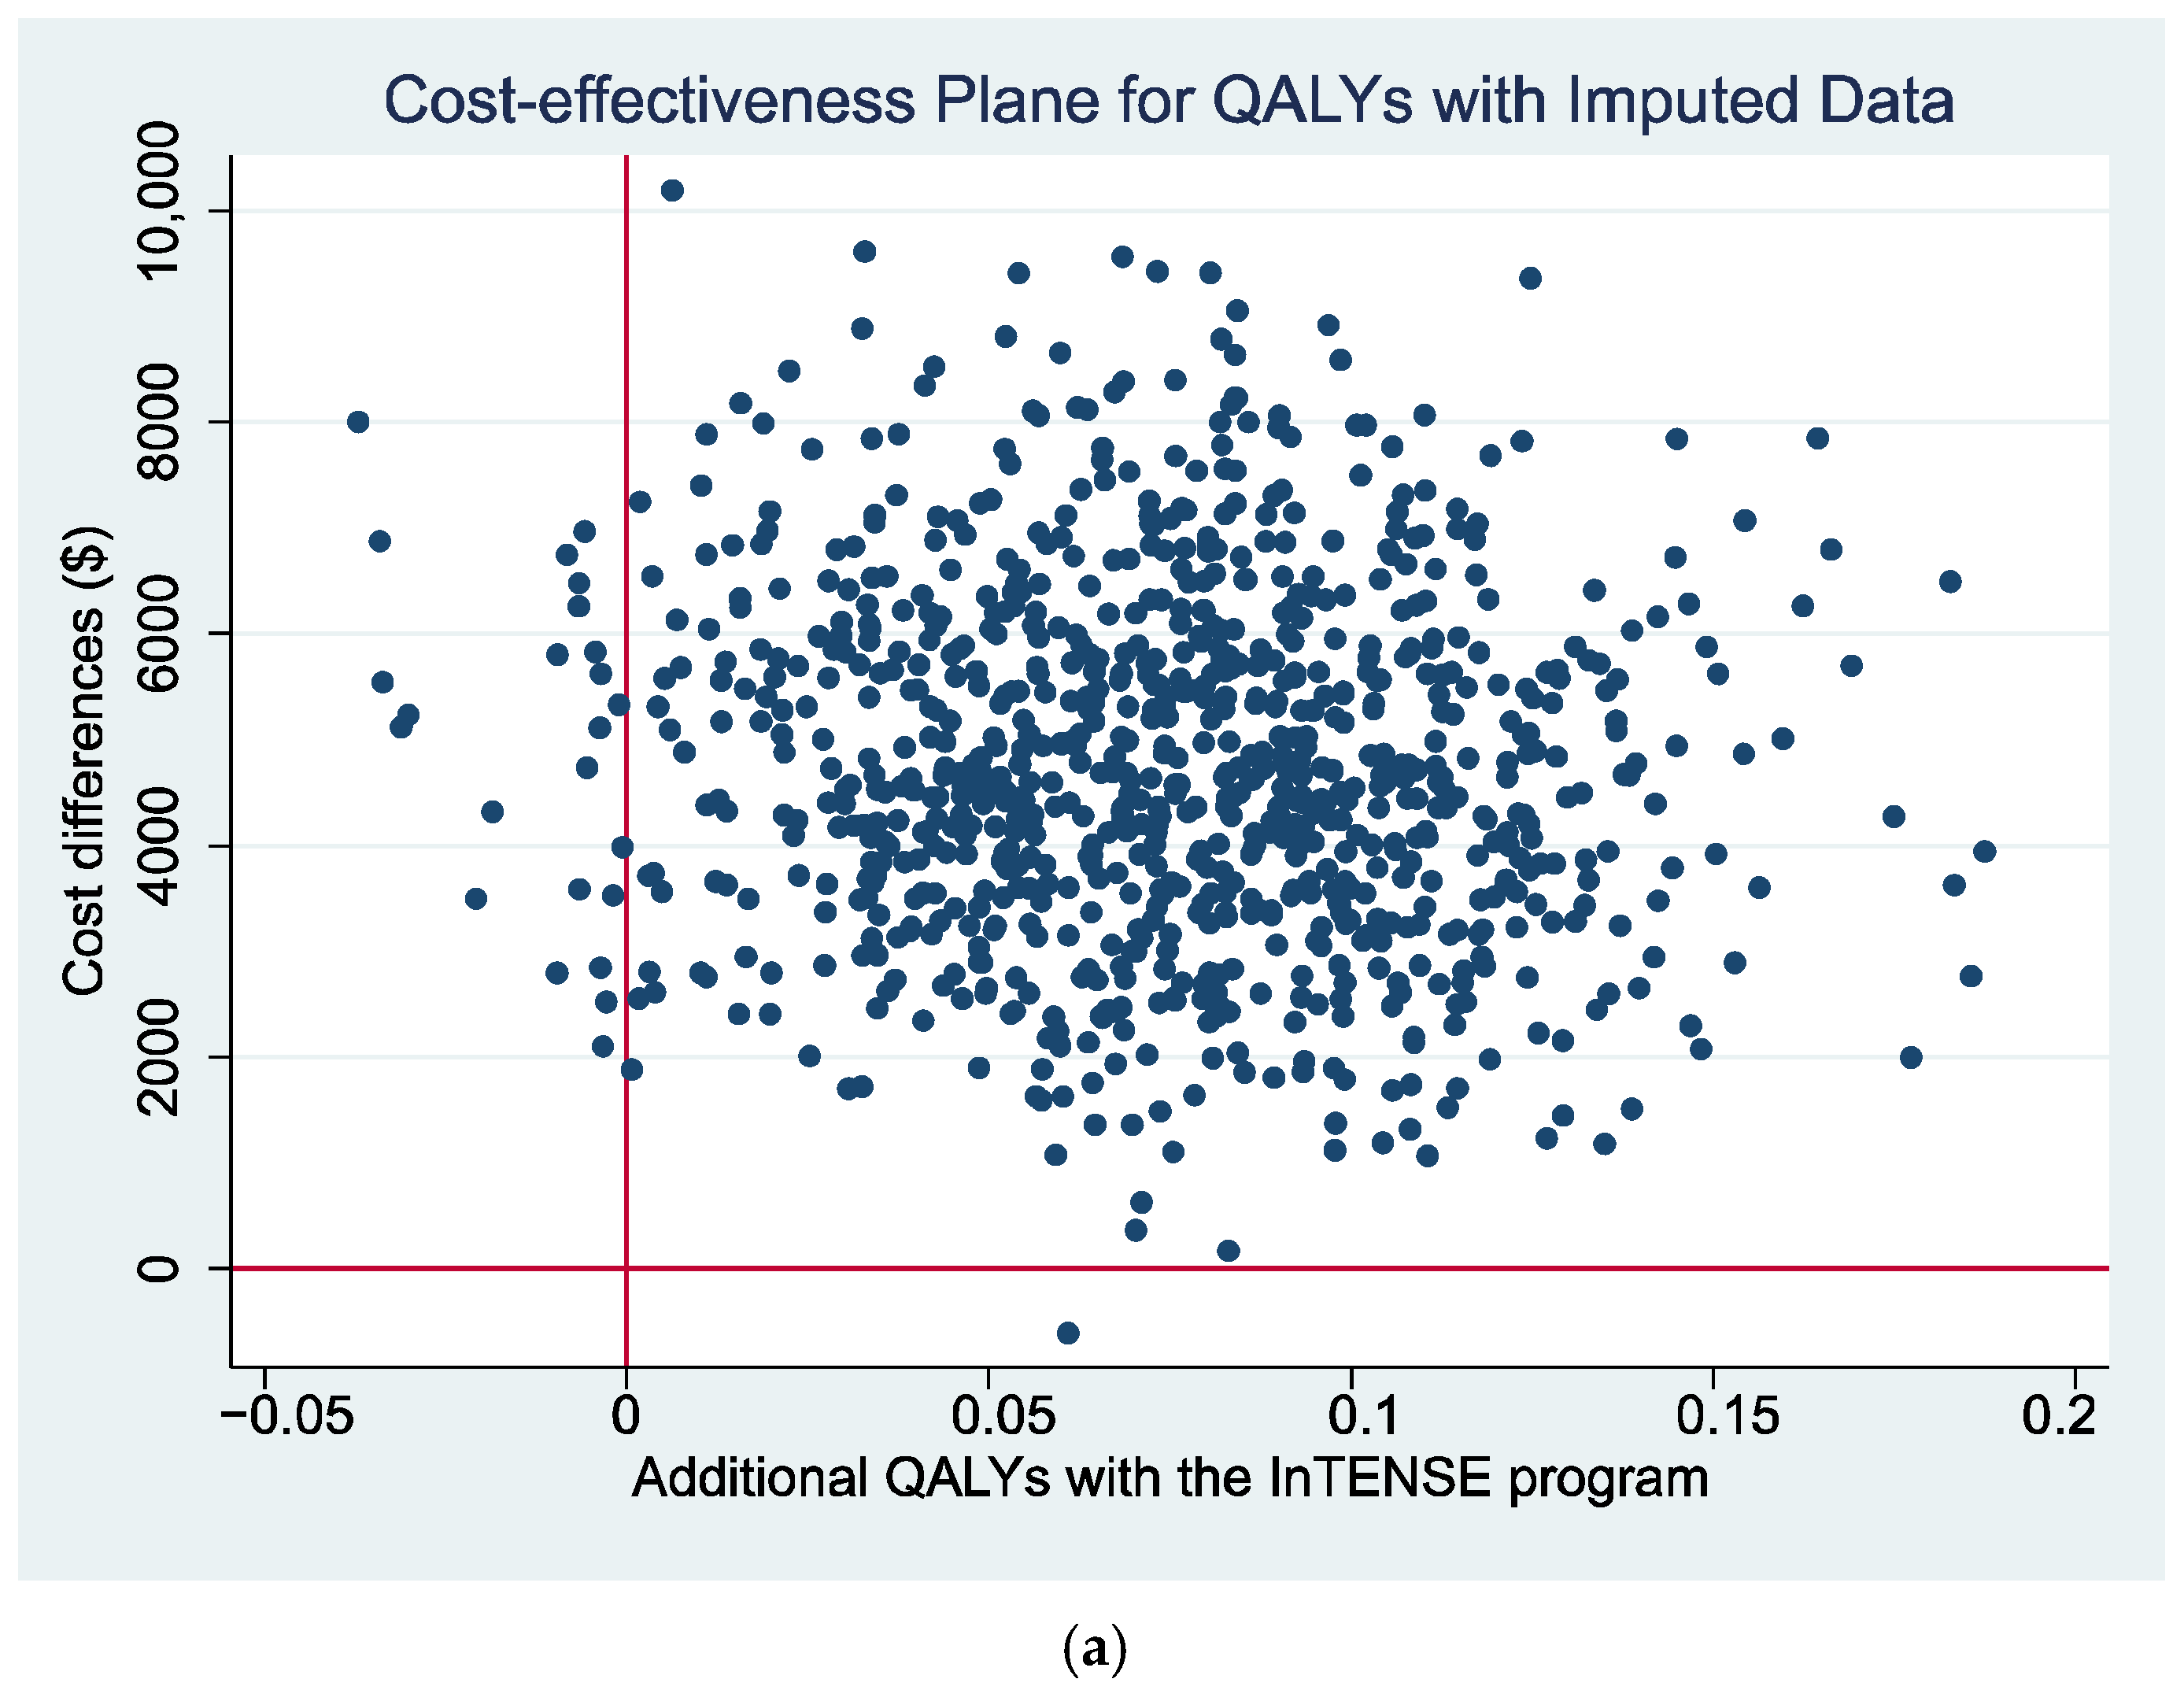
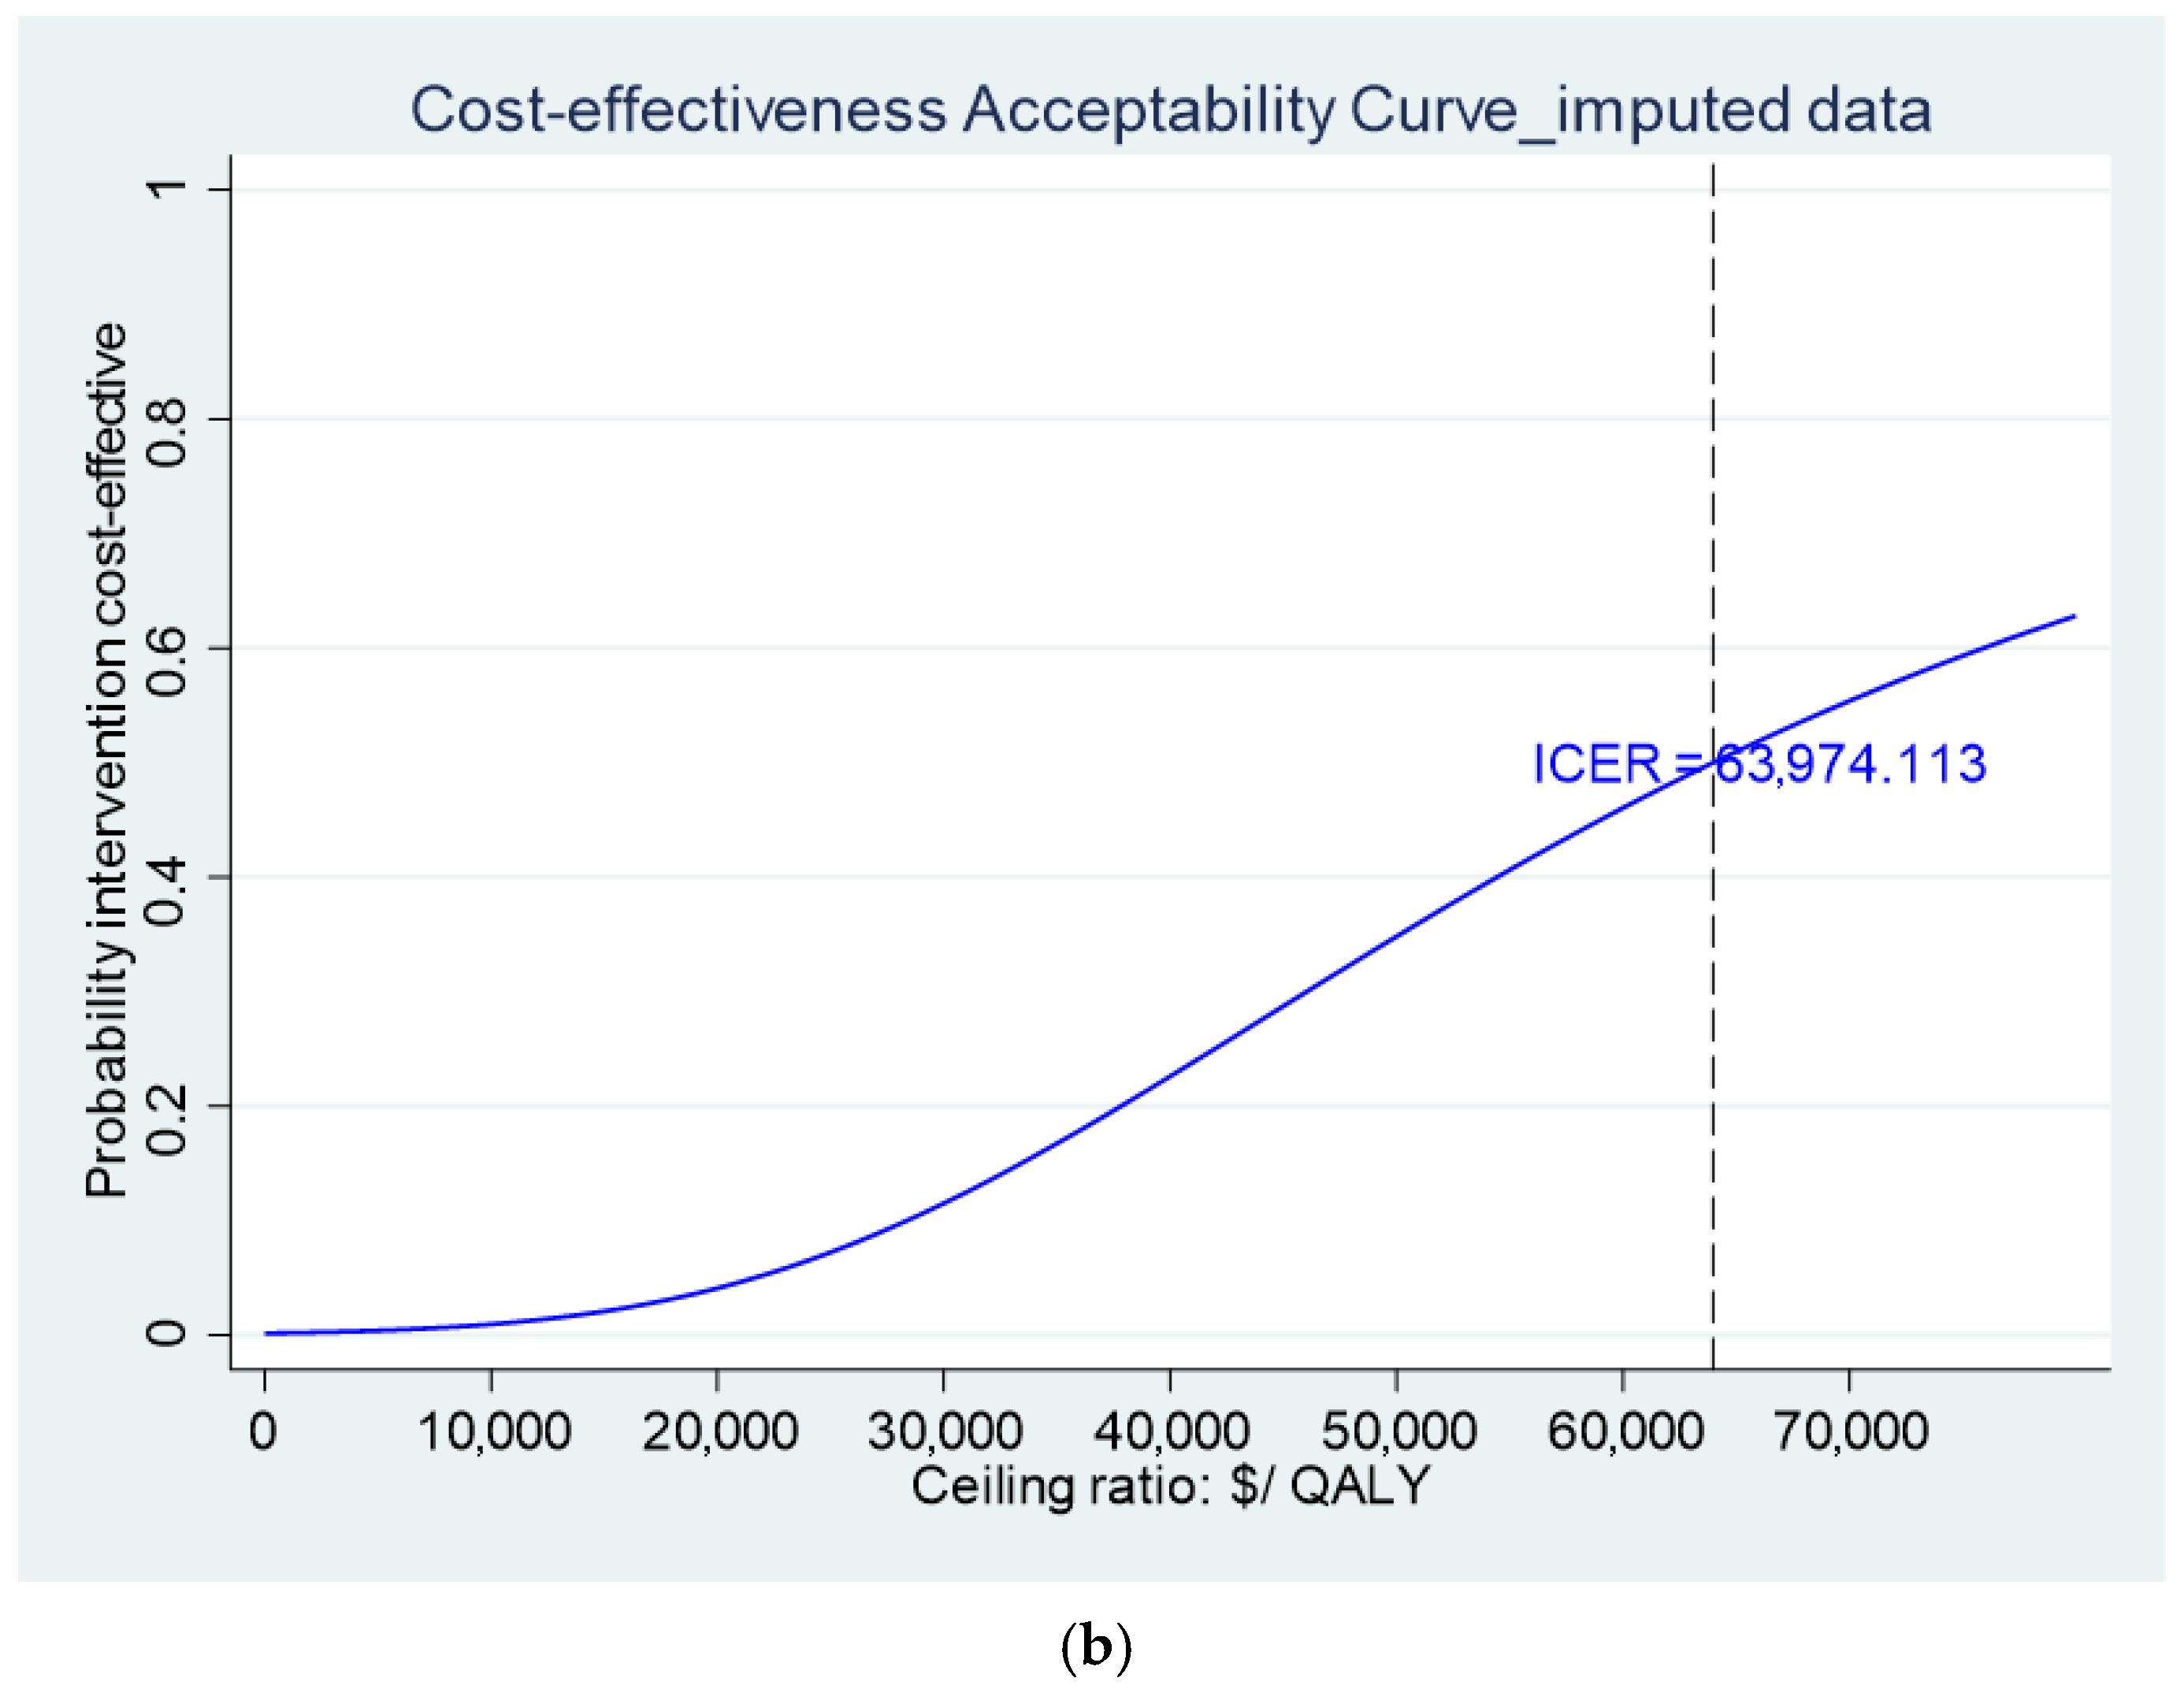
| Costs over 12 months | $12,233.26 | $7122.22 | $5111.04 [$1892.19, $8329.90] p = 0.02 |
| QALY gain over 12 months | 0.58 | 0.54 | 0.04 [−0.03, 0.12] p = 0.266 |
| ICER (AU $/QALY gain) | $63,974.11 | ||
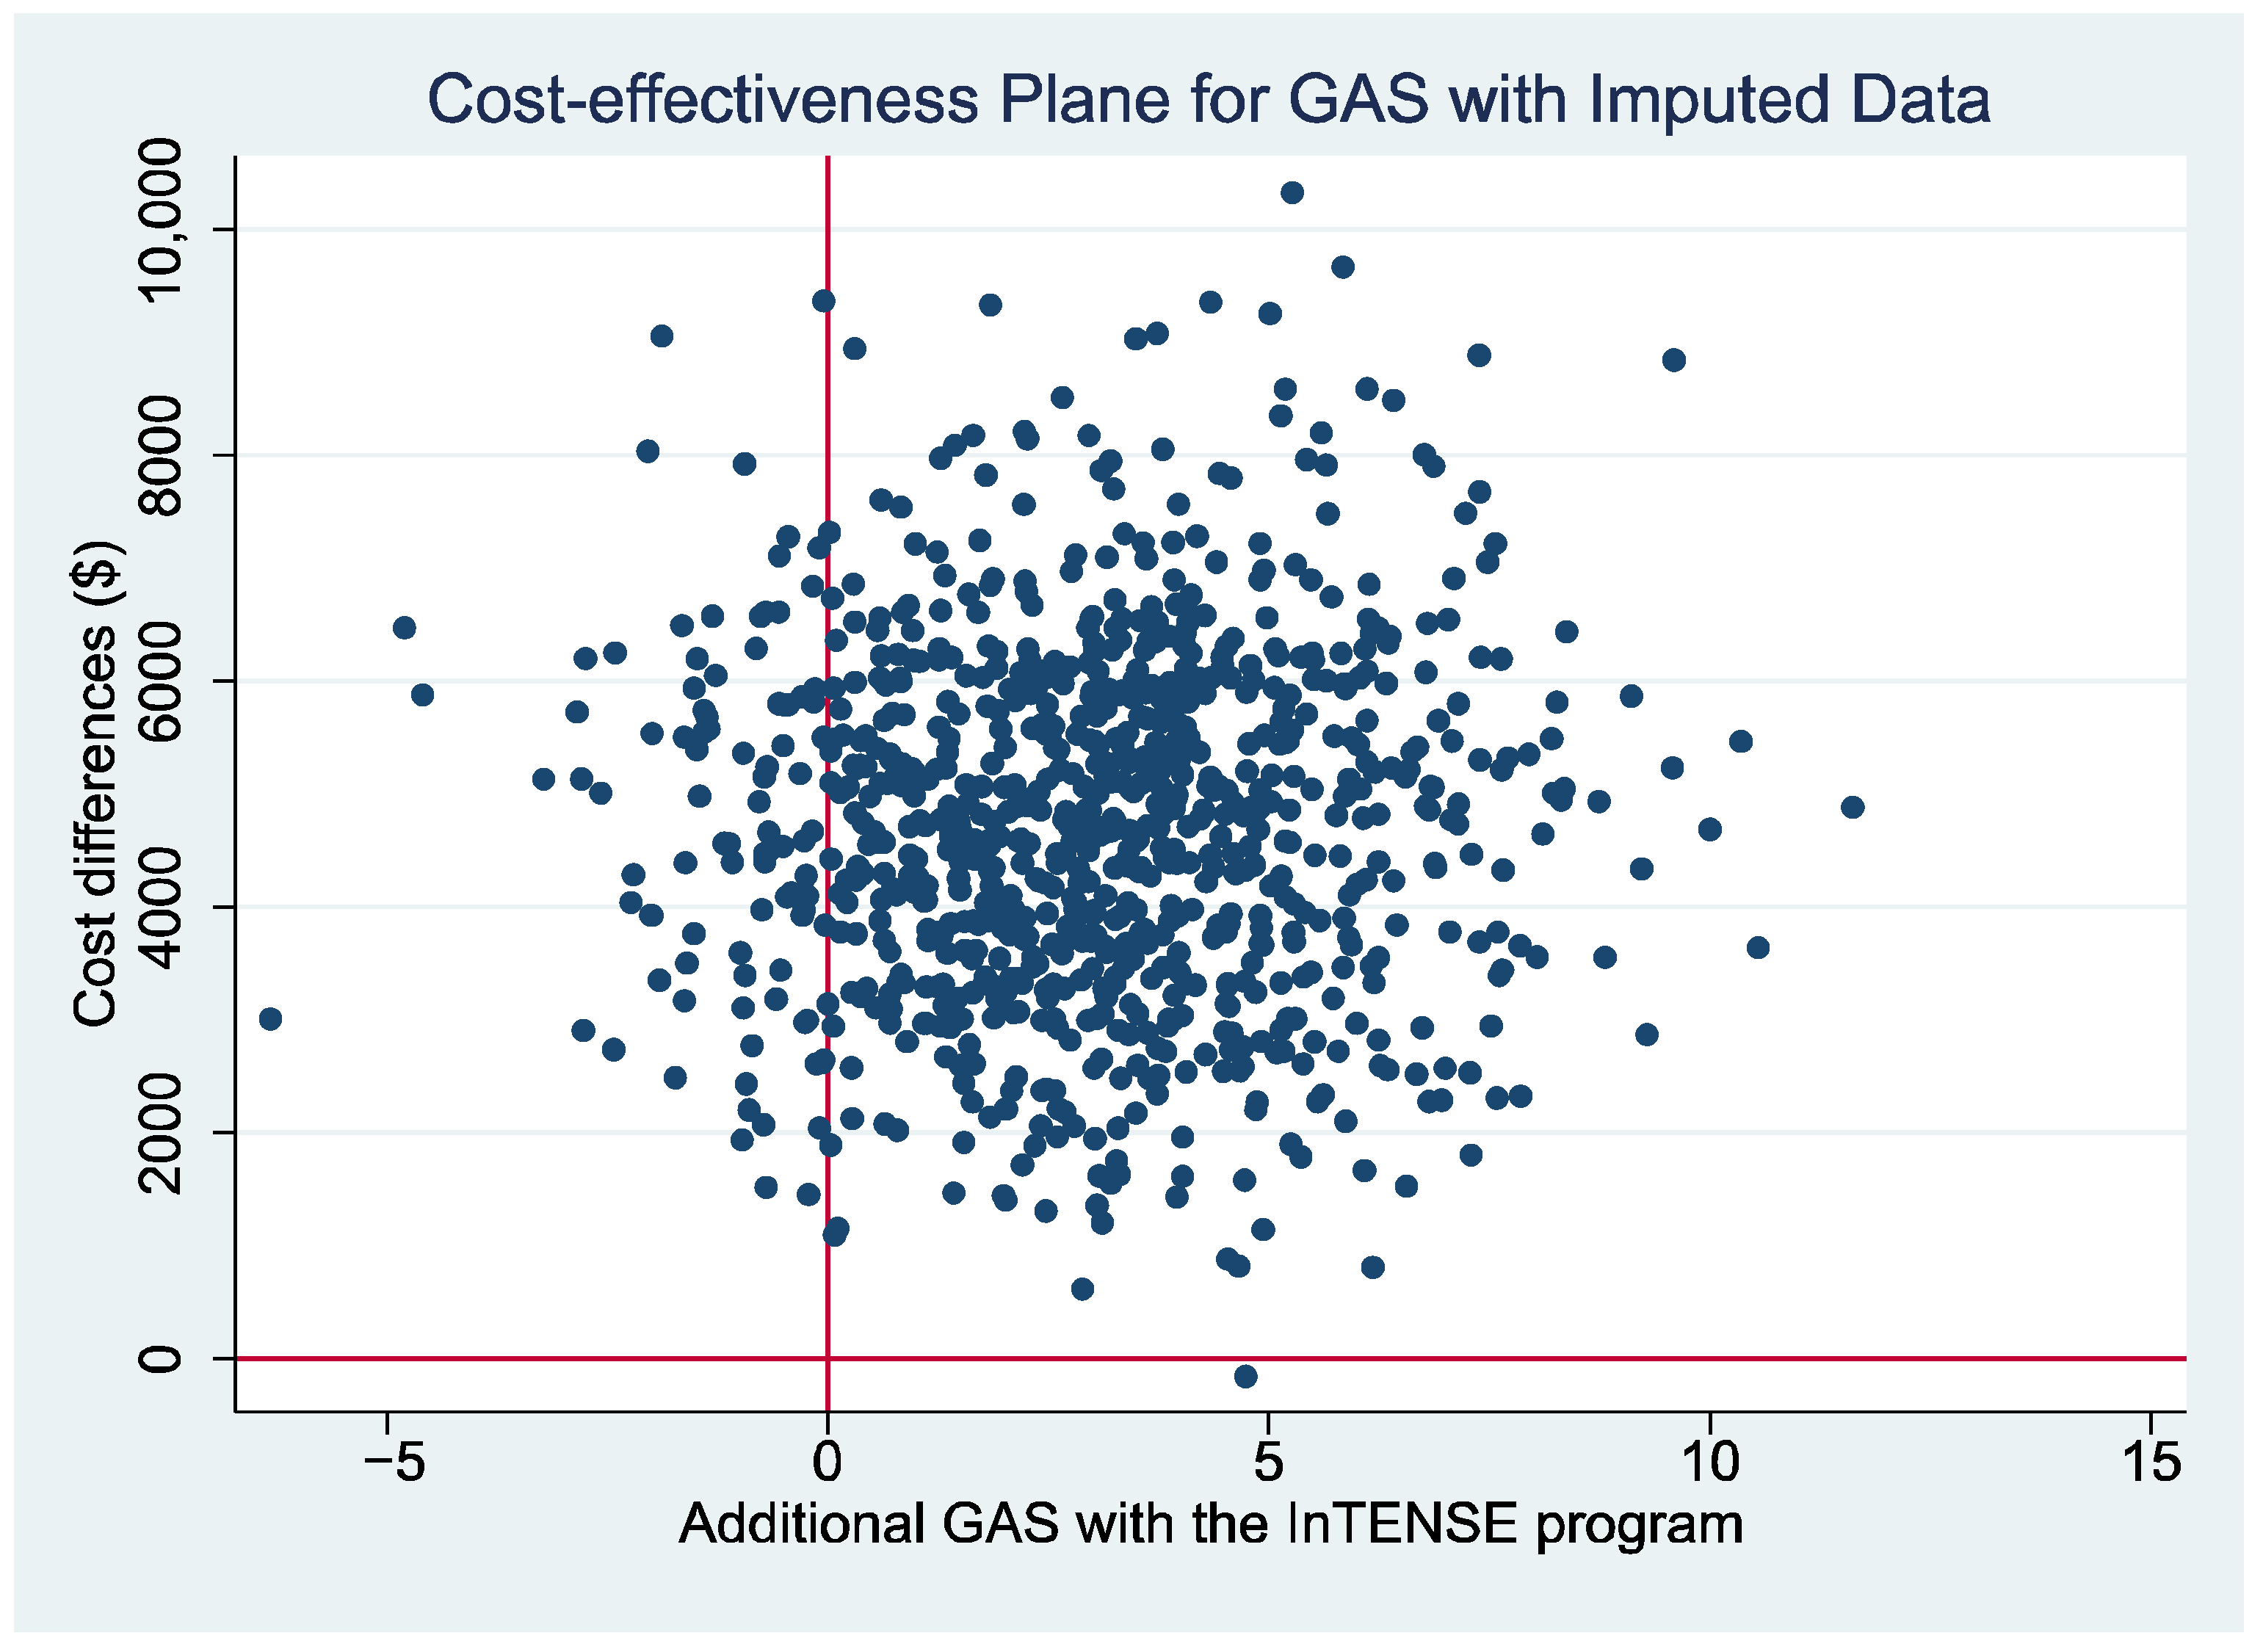
| GAS over 12 months | 41.22 | 41.00 | 0.22 [−4.69, 5.12] p = 0.930 |
| ICER (AU $/GAS) | $1667.51 | ||
| Sensitivity Analysis (complete cases at 12 months, n = 53) | |||
| Costs over 12 months | $13,722.16 | $5,849.12 | $7,873.04 [$1,011.38, $14,734.7] p = 0.025 |
| QALY gain over 12 months | 0.64 | 0.56 | 0.08 [−0.01, 0.18] p = 0.095 |
| ICER (AU $/QALY gain) | $65,792.80 | ||
| GAS over 12 months | 42.21 | 39.45 | 2.75 [−4.69, 10.19] p = 0.468 |
| ICER (AU $/GAS) | $1563.76 | ||
Disclaimer/Publisher’s Note: The statements, opinions and data contained in all publications are solely those of the individual author(s) and contributor(s) and not of MDPI and/or the editor(s). MDPI and/or the editor(s) disclaim responsibility for any injury to people or property resulting from any ideas, methods, instructions or products referred to in the content. |
© 2025 by the authors. Licensee MDPI, Basel, Switzerland. This article is an open access article distributed under the terms and conditions of the Creative Commons Attribution (CC BY) license (https://creativecommons.org/licenses/by/4.0/).
Share and Cite
Milte, R.; Song, J.; Docking, S.; Ratcliffe, J.; Cameron, I.D.; Crotty, M.; Ada, L.; English, C.; Lannin, N.A. Economic Evaluation of the InTENSE Program of Therapy Alongside Botulinum Neurotoxin a for the Rehabilitation of Chronic Upper Limb Spasticity. Toxins 2025, 17, 341. https://doi.org/10.3390/toxins17070341
Milte R, Song J, Docking S, Ratcliffe J, Cameron ID, Crotty M, Ada L, English C, Lannin NA. Economic Evaluation of the InTENSE Program of Therapy Alongside Botulinum Neurotoxin a for the Rehabilitation of Chronic Upper Limb Spasticity. Toxins. 2025; 17(7):341. https://doi.org/10.3390/toxins17070341
Chicago/Turabian StyleMilte, Rachel, Jia Song, Sean Docking, Julie Ratcliffe, Ian D. Cameron, Maria Crotty, Louise Ada, Coralie English, and Natasha A. Lannin. 2025. "Economic Evaluation of the InTENSE Program of Therapy Alongside Botulinum Neurotoxin a for the Rehabilitation of Chronic Upper Limb Spasticity" Toxins 17, no. 7: 341. https://doi.org/10.3390/toxins17070341
APA StyleMilte, R., Song, J., Docking, S., Ratcliffe, J., Cameron, I. D., Crotty, M., Ada, L., English, C., & Lannin, N. A. (2025). Economic Evaluation of the InTENSE Program of Therapy Alongside Botulinum Neurotoxin a for the Rehabilitation of Chronic Upper Limb Spasticity. Toxins, 17(7), 341. https://doi.org/10.3390/toxins17070341