Article

Growth Response and Cell Permeability of the Fish-Killing Phytoflagellate Heterosigma akashiwo Under Projected Climate Conditions

by
Malihe Mehdizadeh Allaf
1 and
Charles G. Trick
2,*
1
Department of Chemical and Biochemical Engineering, Western University, London, ON N6A 5B9, Canada
2
Department of Physical and Environmental Sciences, University of Toronto, Toronto, ON M1C 1A4, Canada
*
Author to whom correspondence should be addressed.
Toxins 2025, 17(5), 259; https://doi.org/10.3390/toxins17050259
Submission received: 28 March 2025 / Revised: 12 May 2025 / Accepted: 18 May 2025 / Published: 21 May 2025
(This article belongs to the Special Issue Mechanisms Underlying Metabolic Regulation by Marine Toxins)

Abstract

:
Climate change and anthropogenic alterations in biogeochemical cycles are intensifying the frequency, duration, and potential toxicity of harmful algal blooms (HABs) in marine ecosystems. However, these effects are highly variable and depend on species identity, strain-specific traits, and local environmental conditions. Key drivers include rising sea surface temperatures, changes in salinity resulting from altered precipitation patterns and runoff, and elevated CO2 levels leading to ocean acidification. Heterosigma akashiwo, a euryhaline raphidophyte responsible for the widespread killing of fish, is particularly responsive to these changes. This study investigated the combined effects of temperature, salinity, and CO2 concentration on the growth, yield, and cell membrane permeability of H. akashiwo using a Design of Experiment (DOE) approach. DOE facilitates a detailed and systematic analysis of multifactorial interactions, enabling a deeper understanding of complex relationships while maximizing efficiency and minimizing the use of experimental resources. The results revealed that growth and yield were maximized at higher temperatures and salinities, whereas cell permeability increased under cooler, less saline, and lower CO2 conditions. These findings suggest that projected future ocean conditions may enhance biomass production while potentially reducing cellular permeability and, by extension, toxicity. This study highlights the value of the DOE framework in identifying key interactions among environmental drivers of HABs, offering a practical foundation for future predictive modeling under climate change scenarios.
Key Contribution: The DOE approach is a powerful tool for predicting future environmental conditions that influence the formation and toxicity of HABs.

1. Introduction

Harmful algal blooms (HABs) have been increasingly reported over recent decades, with evidence linking their frequency and intensity to climate change and accelerated eutrophication driven by domestic, industrial, and agricultural runoff [1,2,3,4,5,6]. These blooms encompass a broad diversity of phytoplankton species that vary in toxicity and geographic range. While HABs are often localized events, many causative species have global distributions. Blooms are characterized by excessive biomass accumulation, frequently in combination with the intracellular production of potent toxins [7]. Given the diversity of HAB-forming species, their responses to environmental change are not always predictable: toxicity can vary within and between species, and climate-driven shifts may favor the rise in novel or invasive taxa.
HABs pose serious ecological and socioeconomic threats, particularly in coastal systems. They can compromise public health via shellfish poisoning and respiratory irritation, disrupt fisheries and aquaculture, and degrade water quality [8,9,10,11,12]. In Canadian coastal waters, historical red tide events on the Pacific and Atlantic coasts suggest that rising atmospheric and oceanic temperatures are the key to bloom dynamics [13]. These temperature increases are extending the growing season [5,6], altering bloom phenology [14,15,16], and influencing phytoplankton traits such as growth [14], motility [17], and life cycle transitions [18].
Climate change also affects salinity through evaporation, precipitation, and freshwater runoff changes, particularly in coastal and estuarine systems [6,19,20,21,22,23,24,25,26,27]. Intensification of the hydrologic cycle [20,21] increases the influx of freshwater into marine systems, leading to significant spatial and temporal variability in salinity, a critical stressor for marine phytoplankton [22,23,28].
One of the most profound changes in marine environments is the rise in atmospheric CO2 concentrations, from pre-industrial levels of 280 ppm to over 426 ppm as of June 2024 [29]. Approximately half of this CO2 is absorbed by oceans [30,31], leading to the acidification of surface waters [32,33]. The resultant decrease in pH can disrupt cellular processes in phytoplankton, including enzyme activity, transmembrane potential, nutrient uptake [34,35,36,37,38,39,40], motility [39], and even ichthyotoxicity [38].
Understanding species-specific impacts is critical, given the complex interplay between climate change and phytoplankton responses. Heterosigma akashiwo, a euryhaline raphidophyte, has emerged as a dominant HAB species in many coastal regions. Its blooms are often associated with mass fish mortality [41,42,43]. The organism transitions between vegetative cells and benthic resting cysts, activated by temperature and light conditions [43,44,45,46]. Previous studies have shown that its growth is stimulated by temperatures exceeding 20 °C and CO2 concentrations above 700 ppm, which are the levels projected for the end of the 21st century [32,46,47,48,49,50,51,52,53].
Moreover, H. akashiwo exhibits a high tolerance to salinity variability, enabling it to thrive under fluctuating estuarine conditions [43,50,54,55,56]. Alteration in membrane permeability in response to salinity may represent a stress mitigation strategy to maintain osmotic balance [50]. For example, major blooms have occurred in English Bay, Vancouver, Canada, at 15 °C and low salinity (15) following snowmelt-driven runoff [57]. Despite the recognized influence of temperature, salinity, and CO2, three major environmental stressors associated with climate change, on H. akashiwo, few studies have assessed the combined effects of these factors. This study addresses this gap using a Design of Experiment (DOE) approach to systematically examine the interactions between temperature, salinity, and CO2 on the growth, yield, and membrane permeability of H. akashiwo [51,58]. Compared to the traditional one-factor-at-a-time (OFAT) approach, DOE provides a more robust statistical framework that simultaneously evaluates multiple factors and their interactions while significantly minimizing the number of experimental runs required [51,58,59,60]. This approach enhances efficiency and improves the reliability and interpretability of the results, particularly when investigating complex, multifactorial environmental stressors such as those associated with climate change. To our knowledge, this is the first study to apply DOE to identify the optimal ecological conditions for H. akashiwo’s performance. The findings enhance our predictive understanding of HAB dynamics in a rapidly changing ocean.

2. Results

2.1. H. akashiwo Growth Rates

Profiles of the specific growth rate (Ke) and doublings per day (k) for H. akashiwo at three different temperatures of 25 °C, 20 °C, and 15 °C under varying salinities and CO2 levels are presented in Figure 1. Growth rate increased with temperature, with the highest values observed at 25 °C. Higher CO2 levels were associated with a decline in both Ke and k at different salinities at this temperature. In contrast, growth rates at 20 °C were relatively stable across CO2 and salinity gradients. Cultures at 15 °C showed the lowest growth and doubling rates, with no statistically significant variation across treatments.
After running a one-way analysis of variance (ANOVA) followed by a Tukey post hoc test, a significant difference was observed between 15 °C and 20 °C, and 15 °C and 25 °C, with p-values of 0.001 and 0.003, respectively, for the specific growth rate and doublings per day. In comparison, no significant difference was observed between 20 and 25 °C (p-value = 0.92).

2.1.1. Response Surface Modeling Validation for Growth Rate

A total of 19 experiments were conducted using a three-factor, two-level, complete factorial design with center points (Table 1).
ANOVA results (Table 2) indicated that the models for both Ke and k were significant (F-value = 31.76 and p-value < 0.0001) and best fit by a two-factor interaction (2FI) model. Temperature, CO2 level, and the interaction between both parameters were significant main effects, with a p-value of <0.0001 and 0.0010 for growth rate and doublings per day, respectively. Salinity and other interactions (X1X2 and X2X3) were not statistically significant.
The model’s goodness of fit was defined by the coefficient of determination R-squared (0.9454) and the adjusted determination coefficient Adj. R-squared (0.9157) [61]. The adequate precision ratio of 17.80 further confirmed the model’s robustness.
After eliminating insignificant parameters, the model for the growth rate and doublings per day of H. akashiwo in terms of actual factors was as follows:
Specific growth rate (Ke) = −1.25 + 0.105 × Temperature + 1.53 × 10⁻³ × CO2 level − 1.26 × 10⁻⁴ × Temperature × CO2 level
Doublings per day (k) = −1.80 + 0.152 × Temperature + 2.208 × 10⁻³ × CO2 level − 1.82 × 10⁻⁴ × Temperature × CO2 level
Based on the mathematical model obtained, temperature and CO2 level significantly positively affected growth rate and doublings per day. In contrast, the interaction between both factors had an adverse effect on similar responses. Figure 2 shows the strong agreement between the predicted and observed values, with residuals randomly distributed around the 1:1 line.

2.1.2. Influence of Environmental Factors and Their Interactions on the Growth Rate

Response surface plots (Figure 3A,B) revealed that temperature had a more substantial influence than CO2 on both Ke and k. However, their interaction significantly shaped the response surfaces, with optimal growth occurring at elevated temperatures and moderate CO2 levels.
Experimental validation confirmed the model predictions (Table 3), and a t-test at 95% confidence found no significant difference between the predicted and observed outcomes.

2.2. H. akashiwo Cell Yield

The highest yield (~23,000 cells mL−1) was observed at 20 °C, a salinity of 20 and a CO2 level of 550 ppm, which was followed by cultures grown at 25 °C; salinities of 10, 10, and 30; and CO2 levels of 400, 700, and 700 ppm, respectively (Figure 4). In contrast, the lowest cell yield occurred at the lowest temperature, salinity, and CO2 conditions (Figure 4). Warmer temperatures consistently supported higher cell yields. One-way ANOVA with Tukey post hoc analysis revealed a significant difference between 15 and 25 °C (p-value = 0.004) and 15 and 20 °C (p-value = 0.025), but not between 20 and 25 °C (p-value = 0.56).

2.2.1. Response Surface Modeling Validation for Yield

A three-factor, two-level, complete factorial design with center points was applied to model cell yield under varying environmental conditions. Table 4 presents the design and results. Temperature significantly affected the yield production of H. akashiwo in this experiment. Increasing the temperature from 15 °C up to 25 °C, when media salinity was 10 and CO2 concentration was at the lowest level in this experiment, improved the biomass production and yielded more than two times the amount.
ANOVA (Table 5) confirmed that temperature was a statistically significant predictor of cell yield (p-value = 0.0005), with the model showing overall significance (F-value = 6.5 and p-value = 0.0093). Other factors (salinity and CO2) were less influential. To validate the adequacy of model fit, lack of fit, which is the variation in the data around the fitted model, was used [61,62]. A non-significant lack of fit (F = 5.18) confirmed model adequacy. The yield model, in terms of actual factors, was expressed by the following equation:
Yield = −61,315.03 + 5652.08 × Temperature
This positive linear relationship suggested that increasing temperature drives higher biomass production under the tested conditions.
Table 5. ANOVA results for the yield production of H. akashiwo.
SourceRemarkSum of SquaresdfMean SquareF-Valuep-Value
ModelSignificant2.842 × 10893.158 × 1076.050.0093
X1Significant1.609 × 10811.609 × 10830.850.0005
X2 2.745 × 10712.745 × 1075.260.0510
X3 1.332 × 10711.322 × 1072.550.1487
X1X2 2.631 × 10712.631 × 1075.040.0549
X1X3 1.032 × 10711.032 × 1071.980.1972
X2X3 1.289 × 10611.289 × 1060.250.6325
X12 1.112 × 10711.112 × 1072.130.1824
X22 1.586 × 10711.5886 × 1073.040.1193
X32 1.874 × 10611.874 × 1060.360.5655
R-squared 0.8720
Adj. R-squared 0.7280
Adeq precision 8.383

2.2.2. Main and Interaction Influence of Factors on Yield

Figure 5 illustrates the interaction effects of temperature with salinity and CO2. The lowest yields were associated with low temperature and salinity. In contrast, the highest yields were observed at 25 °C, a salinity of 20, and a CO2 level of 700 ppm. The model predicted a maximum yield of 24,746.1 ± 2283.81 cells mL−1 with a 95% prediction interval of 2311 to 30,078 cells mL−1. Experimental results (2511 ± 1052 cells mL−1) matched the predictions closely, with no significant difference (t-test, p-value > 0.05).

2.3. H. akashiwo Cell Permeability

Maximum membrane permeability was observed at the lowest temperature (15 °C), salinity (10), and CO2 level (400 ppm) (Figure 6). Salinity had the most decisive influence: decreasing salinity significantly increased membrane permeability. Permeability was lowest at the highest salinity level tested. While temperature had no significant effect (p-value > 0.05), both salinity and CO2 levels showed substantial effects (p-value < 0.05).

2.3.1. Response Surface Modeling Validation for Cellular Permeability

Table 6 and Table 7 provide the design matrix and ANOVA results. The model was significant (F-value indicating only a 0.93% chance due to noise). Adequate precision (9.4) confirmed the model’s reliability. Salinity (p-values = 0.0013) and the interaction between temperature and CO2 (p-values = 0.0089) were significant factors.
The fitted 2FI polynomial model in terms of the significant actual factors is as follows:
Cell permeability = +1.51 × 10⁷ − 2.05 × 10⁵ × Salinity + 819.97 × Temperature × CO2 level
This indicates that salinity negatively impacts the cell permeability of H. akashiwo, while the interaction effect of temperature and CO2 level has a positively impact on the same response.

2.3.2. Influence of Environmental Factors and Their Interactions on Cell Permeability

Three-dimensional response surface graphs (Figure 7) illustrate temperature, salinity, and CO2 interactions. Permeability increased with decreasing salinity (Figure 7A,C) and lower temperature and CO2 levels (Figure 7B). The highest observed permeability (3,790,029 ± 1,226,958 RFU) was at 15 °C, a salinity of 10, and a CO2 of 400 ppm—closely aligning with model predictions.

2.4. Relationship Between Different Responses

The relationships among specific growth rate, yield, and cell permeability were examined to assess potential trade-offs and interdependencies. Most samples with varying growth rates exhibited cell permeability values below 2 ×10⁶ RFU (Figure 8A). Linear regression analyses indicated no significant relationship between growth rate and cell permeability (R2 ≈ 0), and a second-order polynomial regression also failed to reveal a meaningful association. Notably, cultures grown under the lowest temperature, salinity, and CO₂ conditions displayed the lowest growth rates but the highest cell permeability values.
In contrast, a positive linear relationship was observed between specific growth rate and cell yield (R2 = 0.61), indicating that faster growing populations generally achieved higher biomass (Figure 8A). Conversely, a negative relationship was found between yield and cell permeability (R2 = 0.57), suggesting that higher biomass production was associated with more stable, less permeable membranes (Figure 8B). Cultures with the most significant yield exhibited the lowest levels of membrane permeability.
These results highlight a potential trade-off between cellular integrity and productivity under environmental stress. While elevated temperature and salinity support growth and yield, they may suppress membrane permeability responses that are typically elevated under more stressful conditions.

3. Discussion

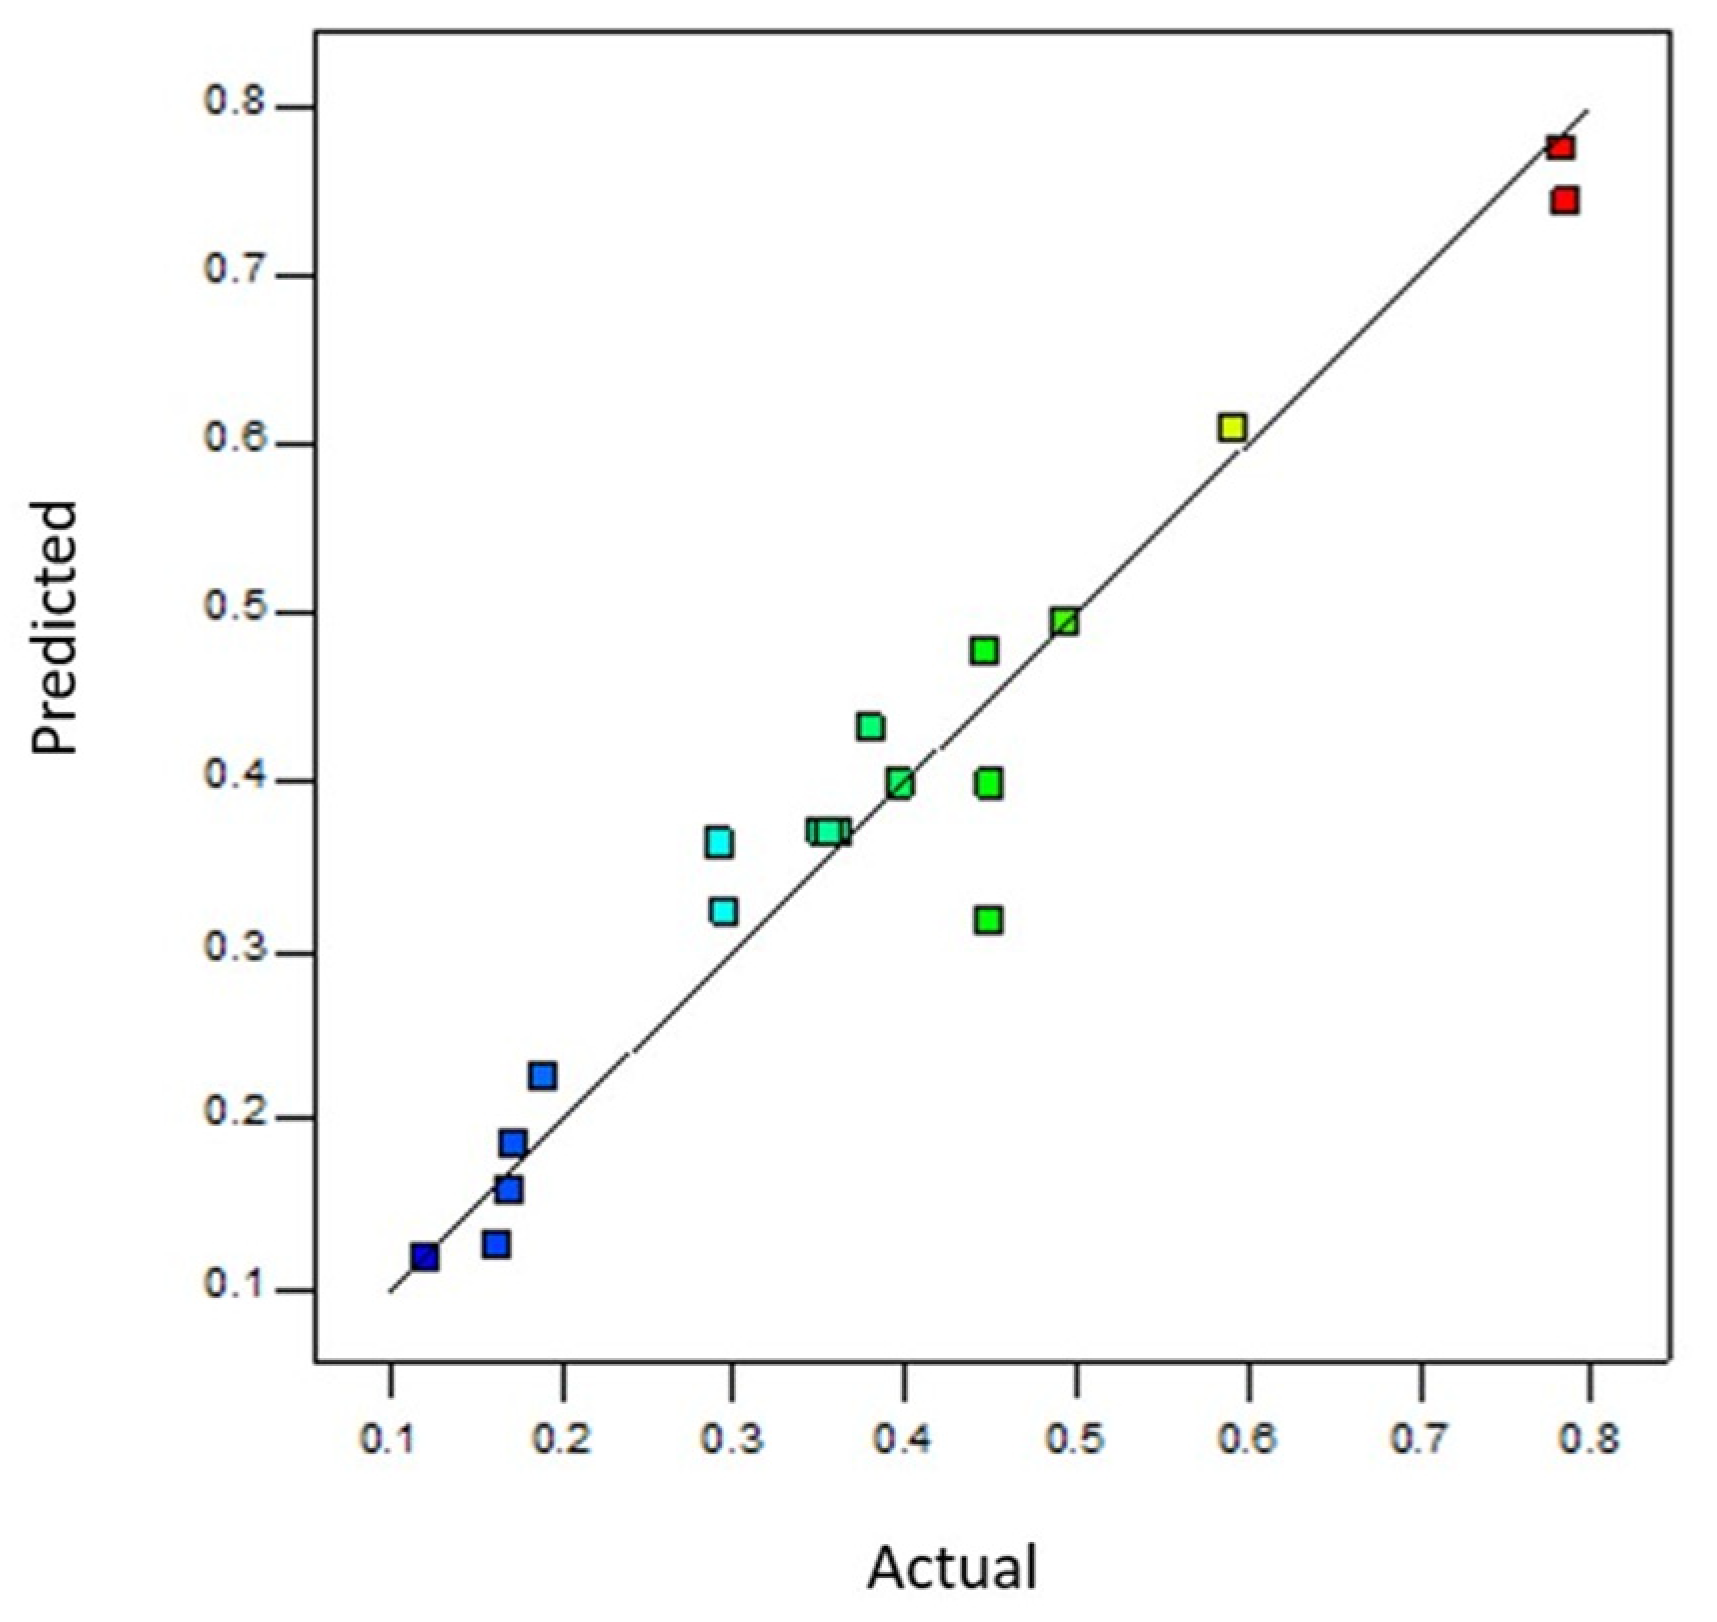
Despite increasing evidence of HABs under changing climate conditions, our understanding of how specific HAB species respond to simultaneous environmental stressors remains limited. Most studies adopt an OFAT approach, which fails to capture the interactive effects of multiple drivers that more accurately reflect natural conditions. In contrast, our study demonstrates the advantages of using a DOE methodology to explore how H. akashiwo responds to combined changes in temperature, salinity, and CO2 concentration [
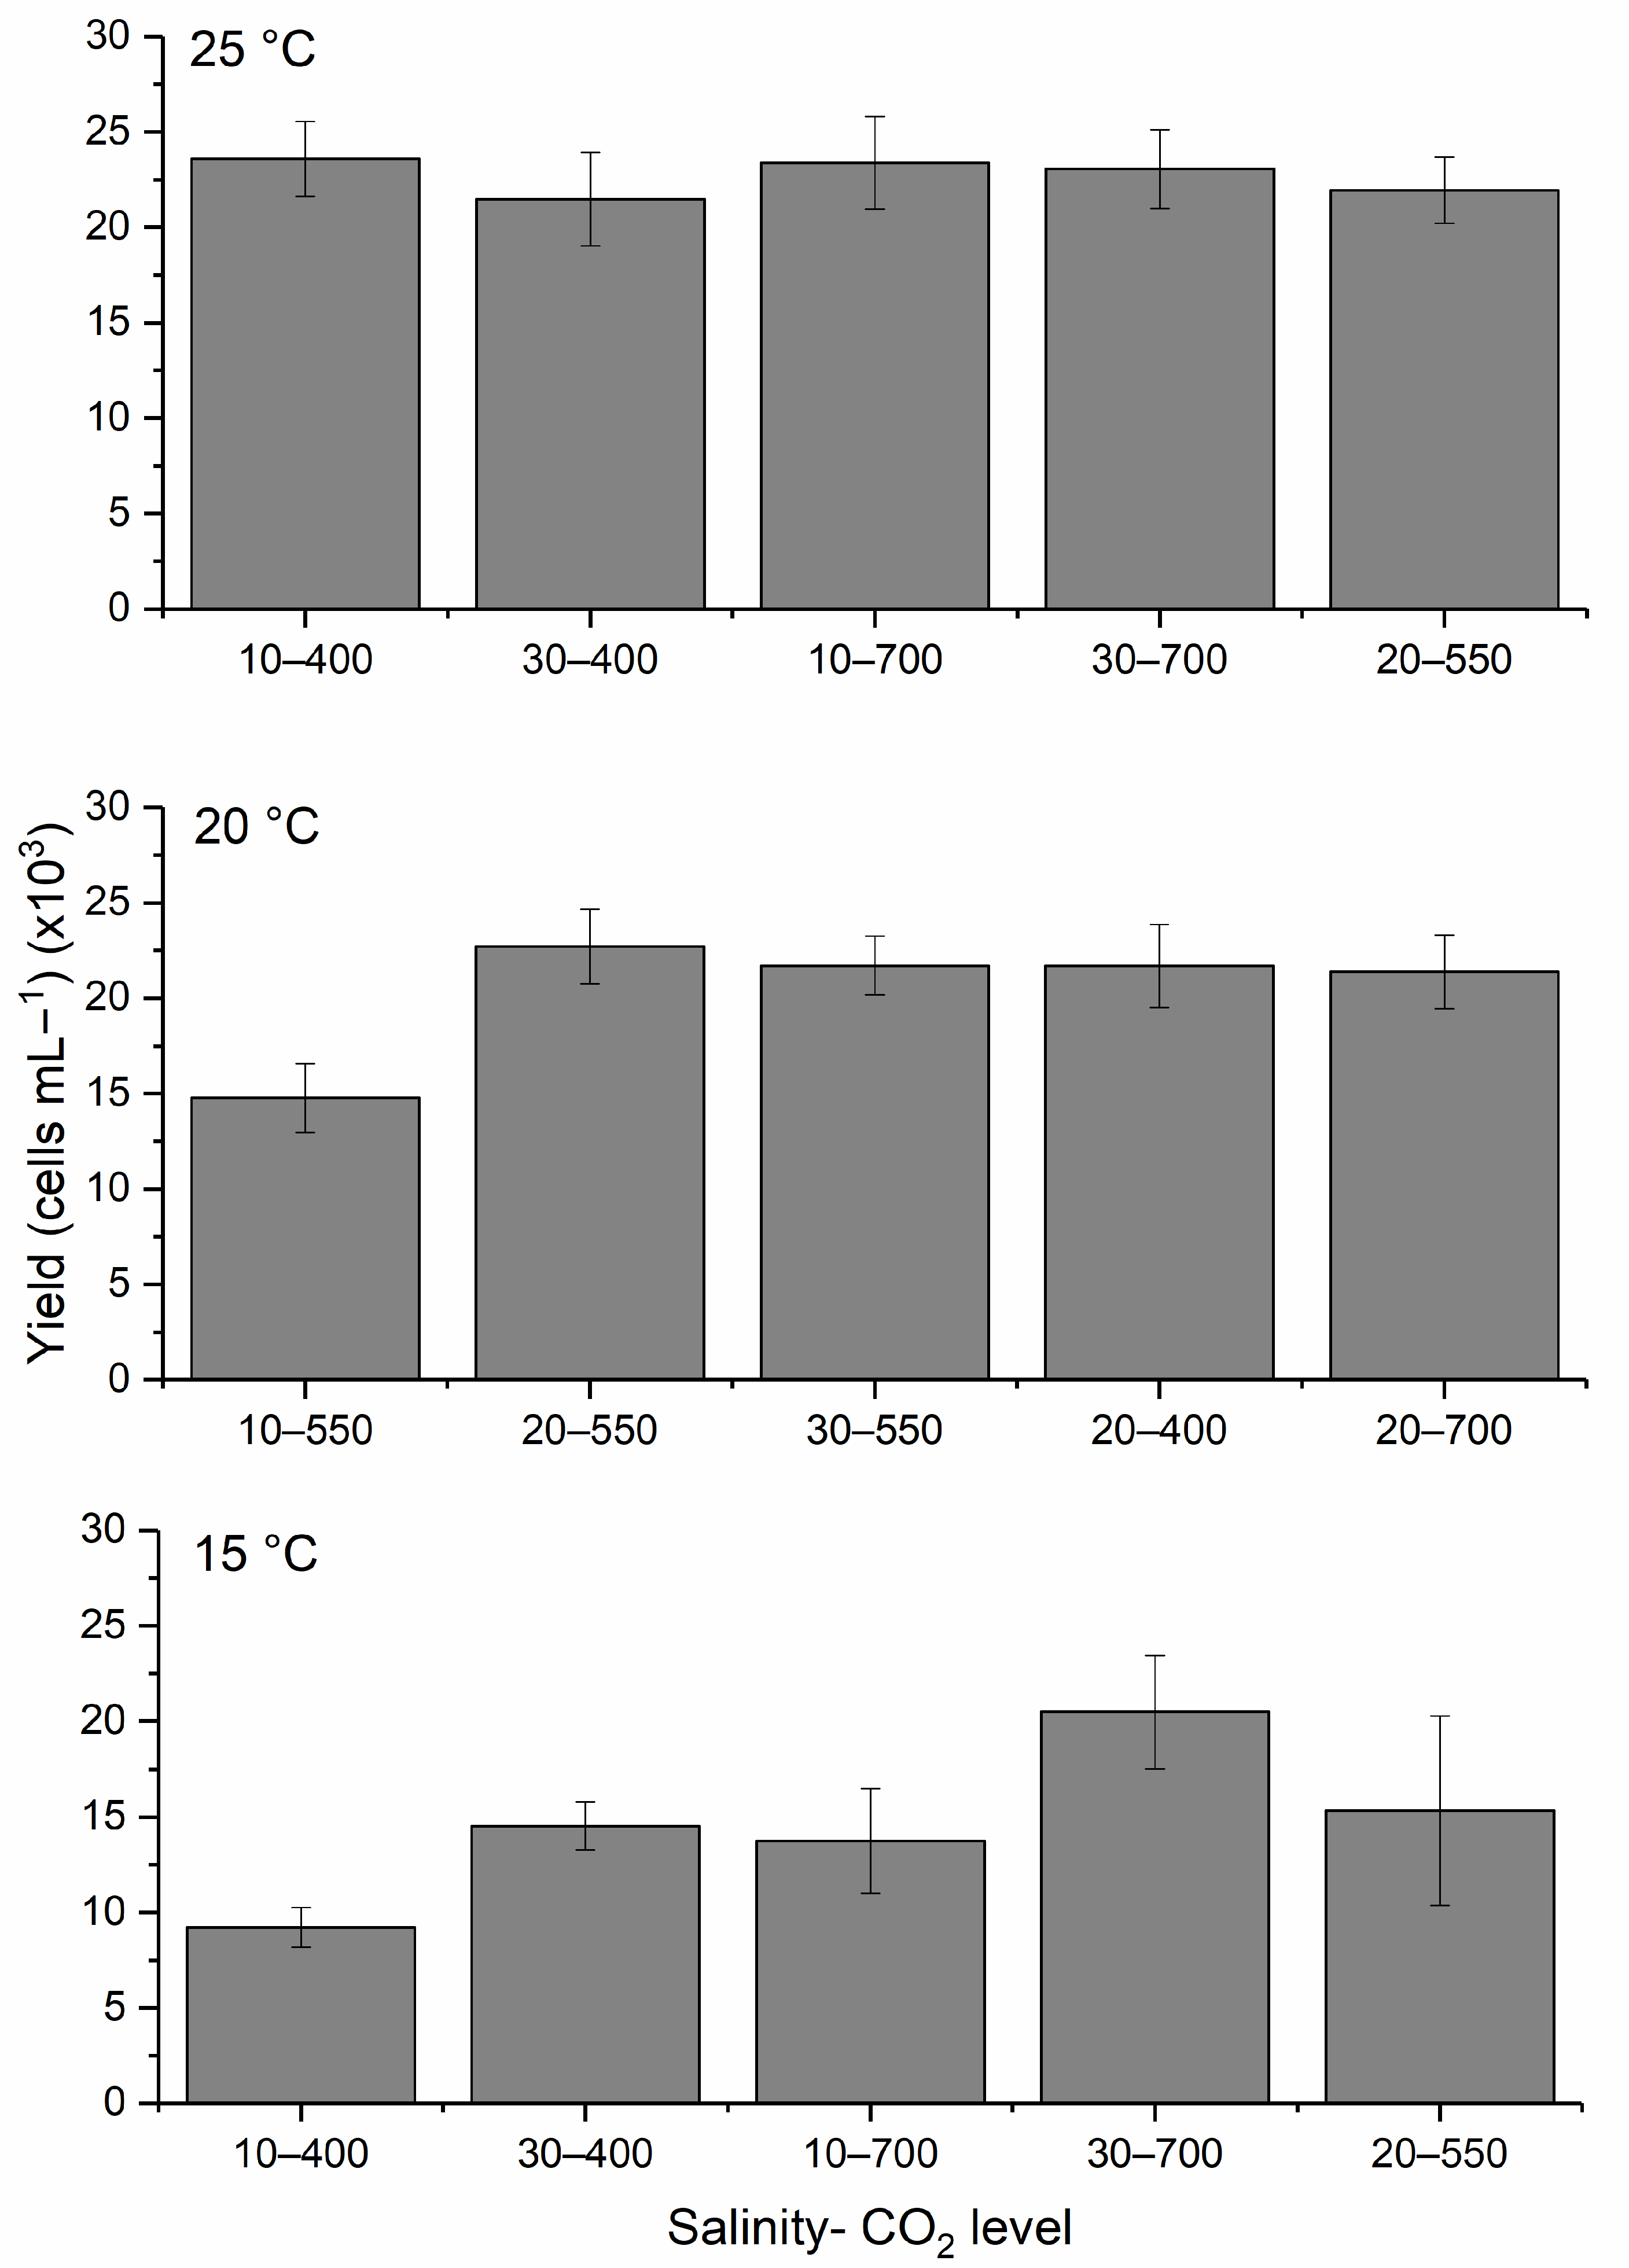
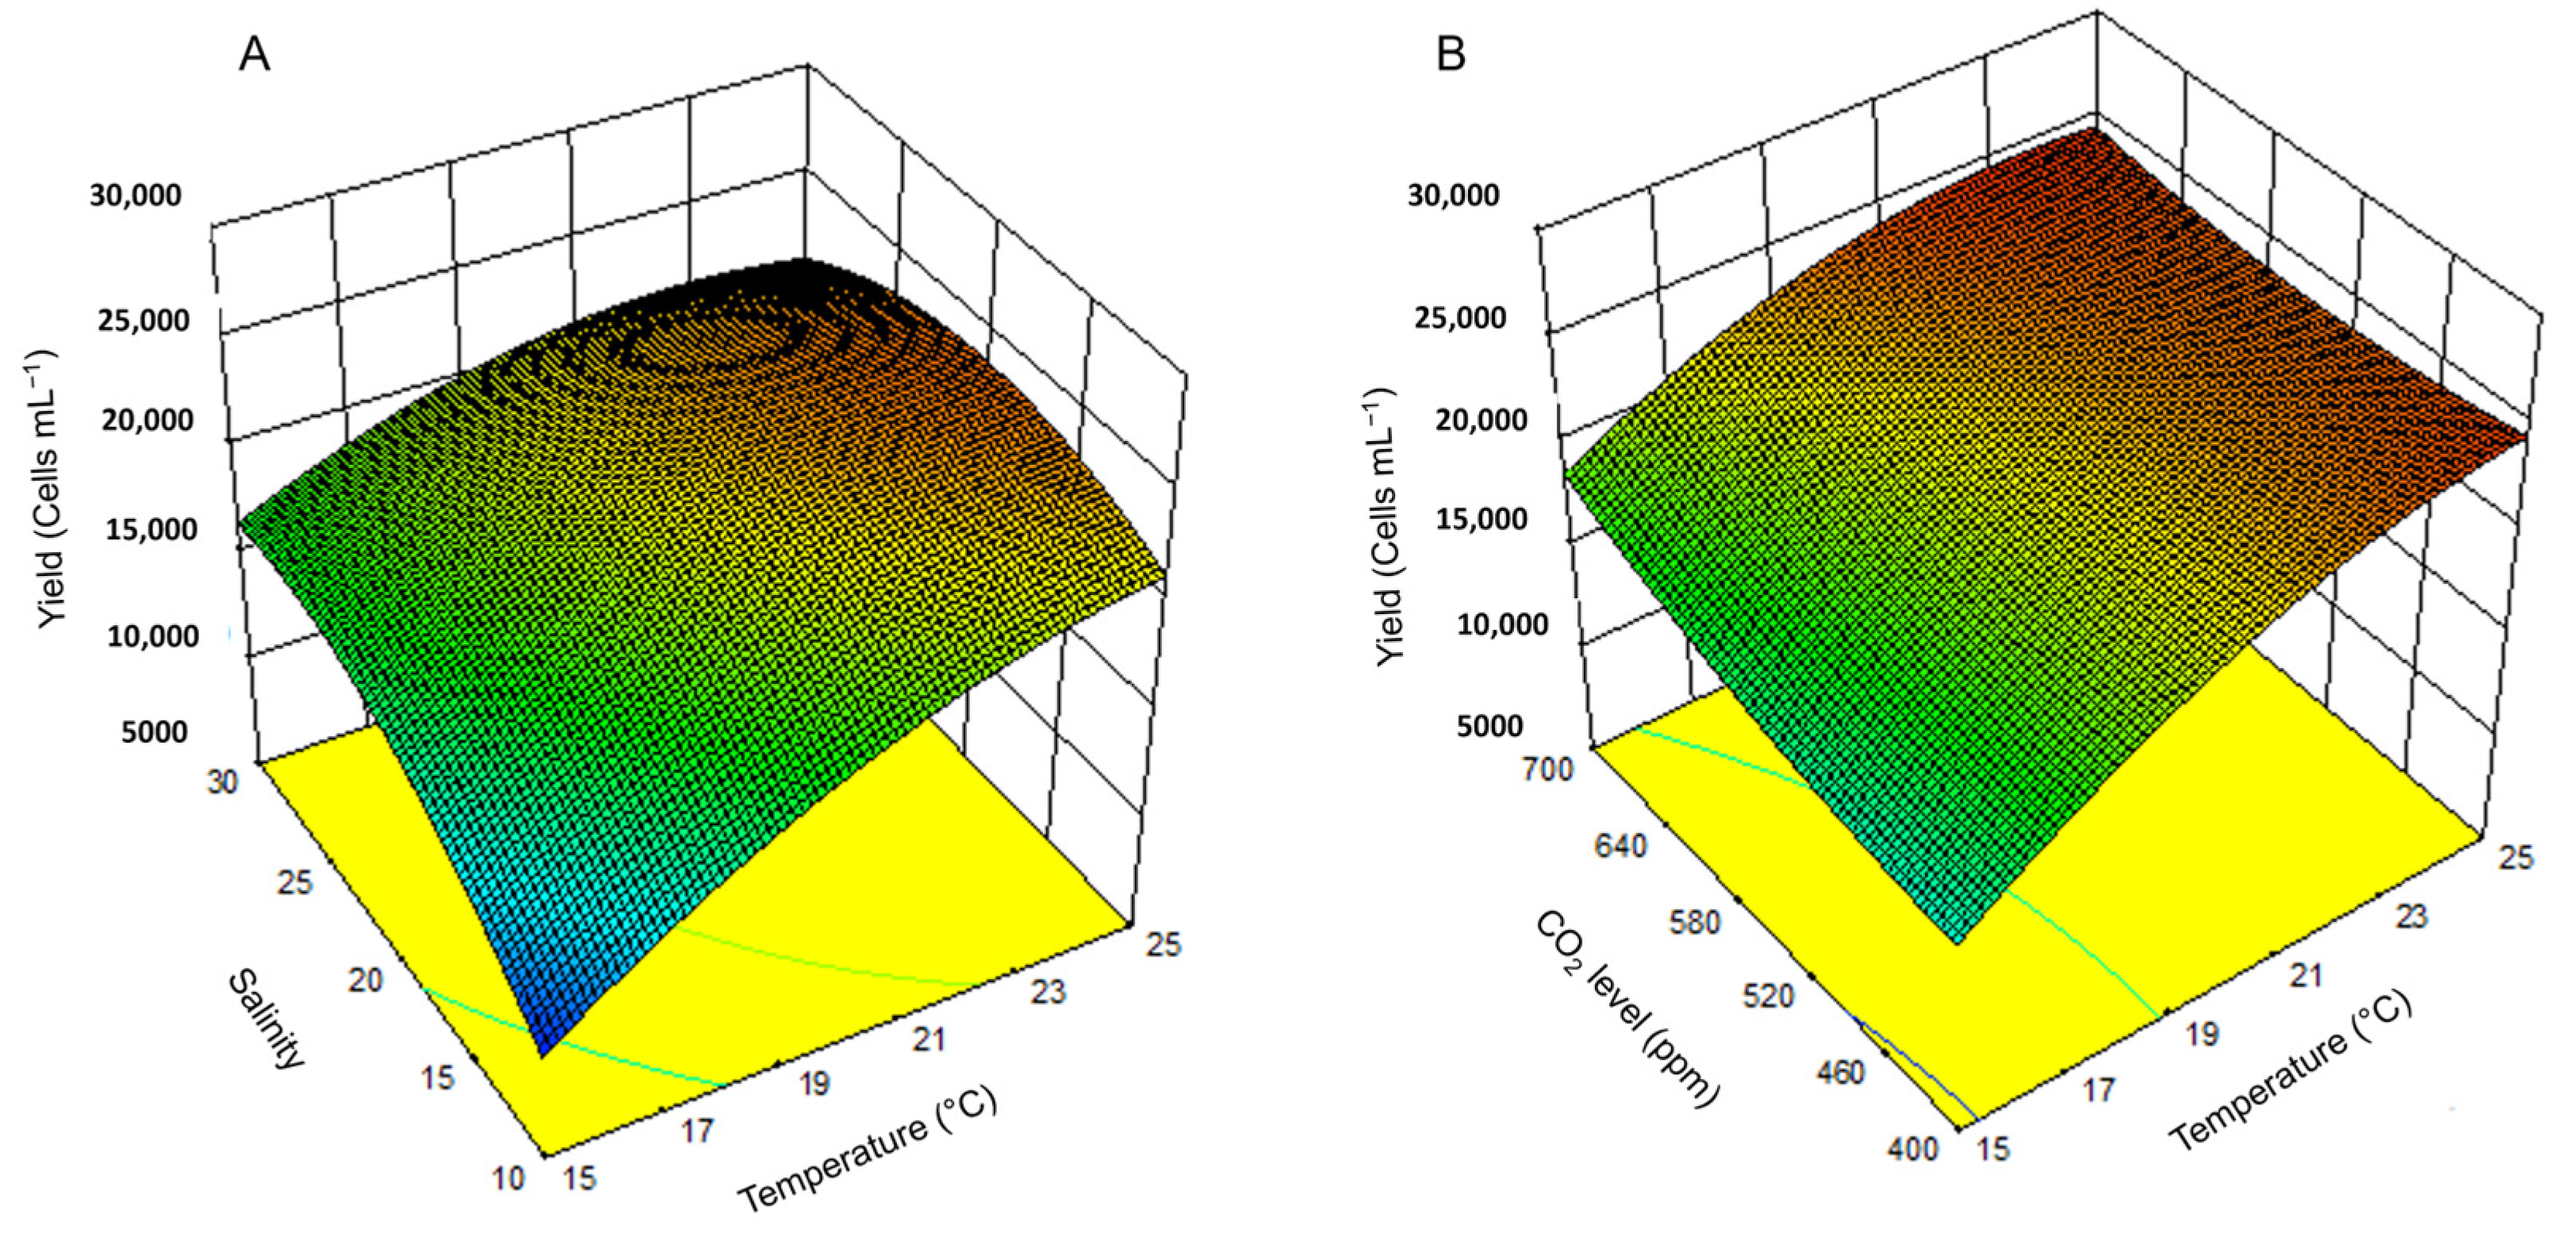
59]. The DOE approach comprehensively evaluated multiple stressors and revealed distinct growth, yield, and cell permeability patterns. The results indicated that warmer temperatures and elevated salinities promote higher growth rates and greater biomass production. This is consistent with earlier findings that H. akashiwo thrives in warm, high-salinity waters [47,48,49,50,51,63,64,65,66]. Moreover, the study confirmed that elevated CO2 levels (up to 700 ppm) enhanced growth when paired with optimal temperature conditions, supporting projections that H. akashiwo may benefit from climate-induced ocean acidification [48,52,53].
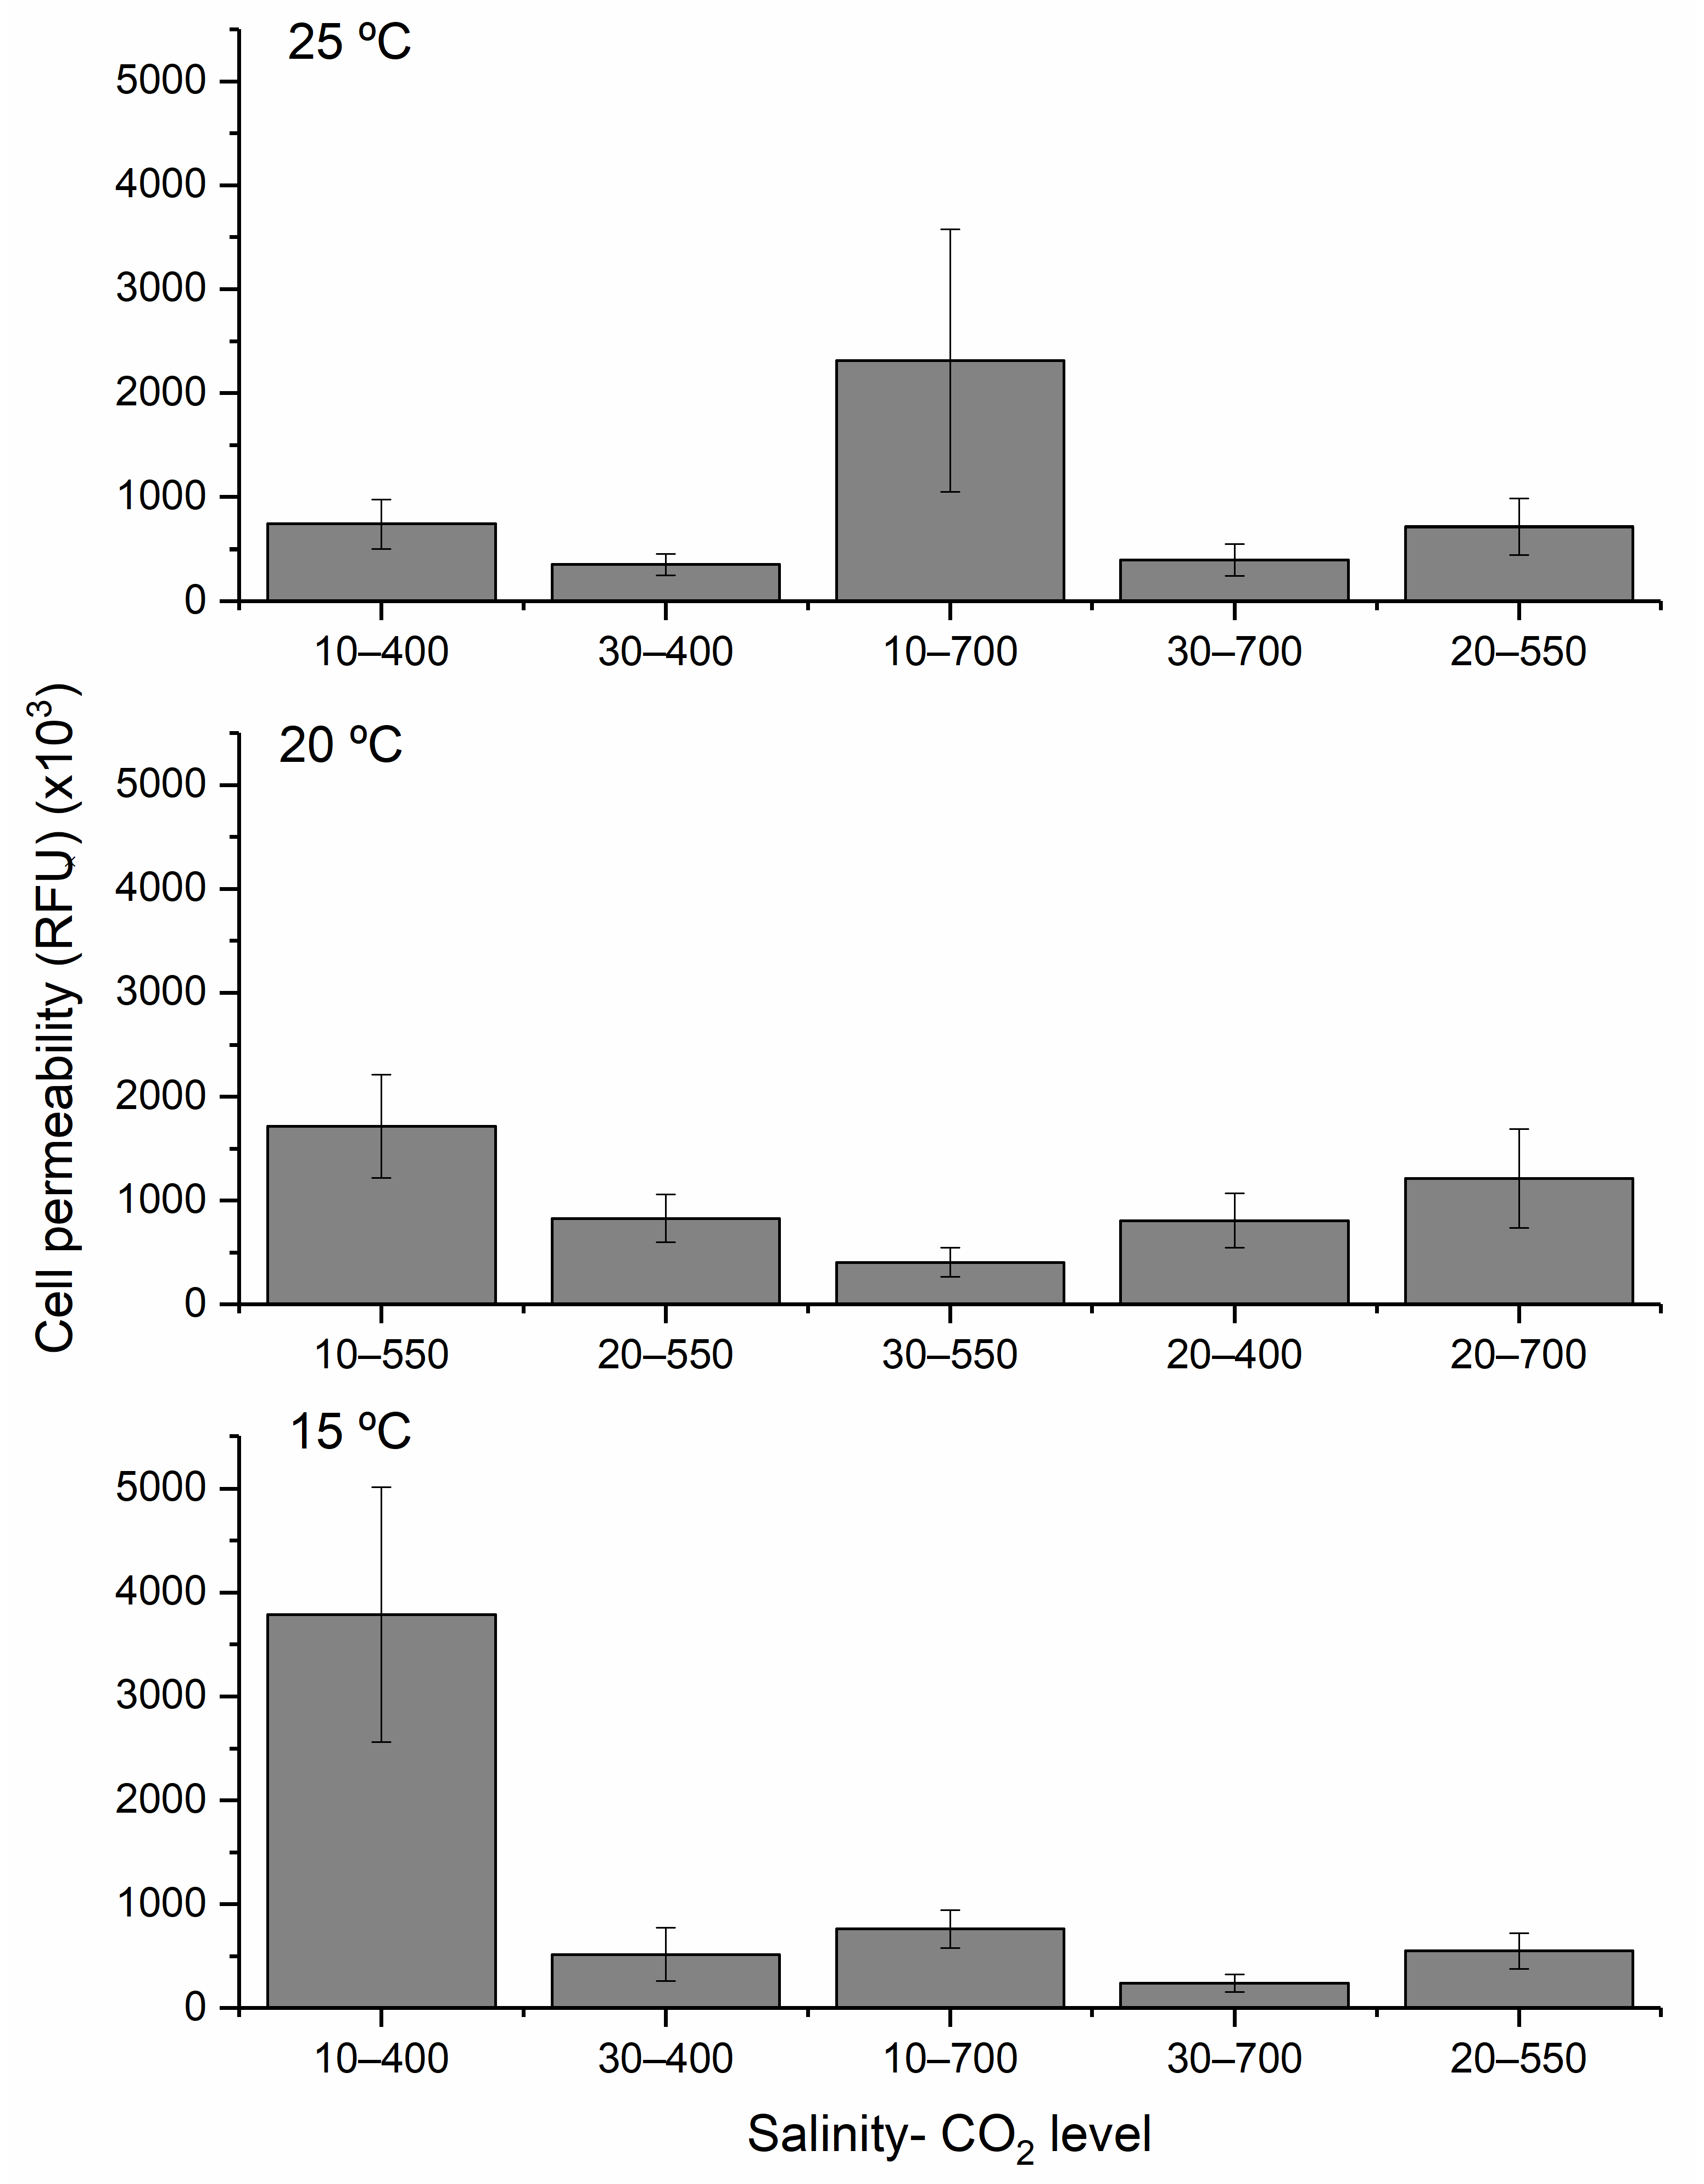
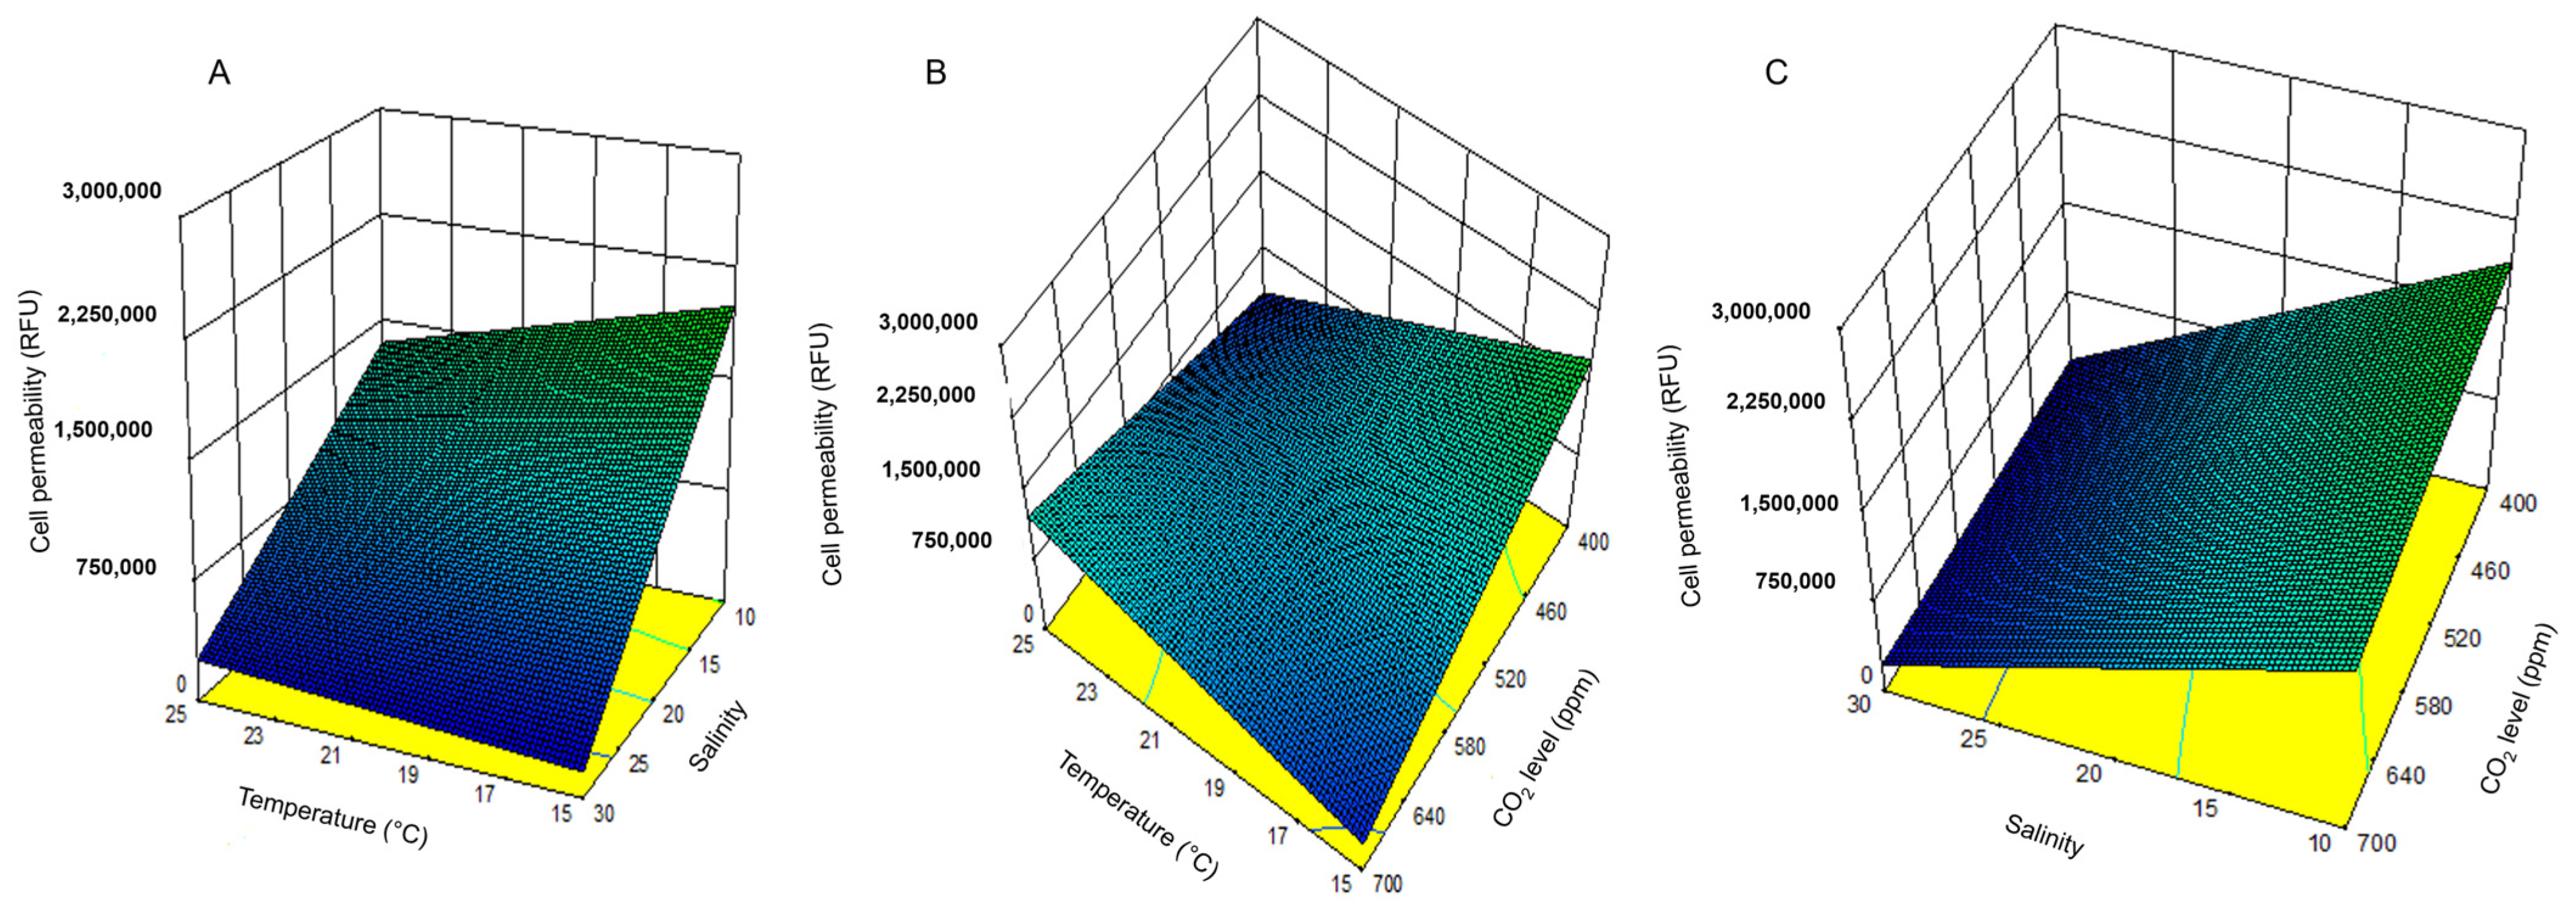
Cell permeability, interpreted here as a proxy for physiological stress, showed an inverse pattern. The highest permeability was recorded under the lowest temperature, salinity, and CO2 conditions, environments that inhibited growth and yield. This suggests that H. akashiwo exhibits stress-related membrane responses under suboptimal conditions, potentially contributing to its ichthyotoxicity in colder, fresher, and less buffered waters. Under stress conditions, in particular, some strains of H. akashiwo are known to release ichthyotoxic metabolites such as reactive oxygen species (ROS), including superoxide and hydrogen peroxide, as well as other bioactive compounds that may disrupt gill function in fish [43].
Notably, this study found no linear relationship between growth rate and cell permeability, implying that physiological stress and productivity are not necessarily coupled traits. However, a negative correlation between yield and cell permeability suggests a trade-off: conditions that promote biomass accumulation may suppress stress-induced permeability responses. This reinforces the idea that HAB toxicity cannot be predicted solely by cell density and must also consider physiological responses to environmental conditions.
By identifying optimal and suboptimal combinations of temperature, salinity, and CO2, this study provides insight into the ecological niche of H. akashiwo. These findings are particularly relevant for aquaculture risk management, bloom forecasting, and ecosystem health assessments.

4. Conclusions

DOE analysis is a powerful tool for predicting bloom dynamics in future oceans. This study demonstrates that the DOE framework can effectively identify the environmental conditions that optimize growth, yield, and cell membrane permeability in H. akashiwo. Key findings include the following: (1) Maximum growth rates occurred at 25 °C, a salinity of 30, and a CO2 of 400 ppm, with temperature being the most influential factor. (2) The highest yield was recorded at 25 °C, a salinity of 20, and at a CO2 of 700 ppm, indicating a synergistic effect of warming and acidification on biomass accumulation. (3) Peak cell permeability, used as a proxy for ichthyotoxicity in the absence of a known analyte, was observed under the most physiologically stressful conditions (15 °C, lower salinity water, and low CO2), highlighting the concern of this species in developing cooler, fresher waters.
While future ocean conditions may enhance the growth and biomass yield of H. akashiwo, they may concurrently reduce cell permeability and the associated ichthyotoxic potential. However, these conclusions are based on a single strain of H. akashiwo, and the species is known to exhibit strain-specific variability in ichthyotoxicity. Therefore, caution is warranted when generalizing these results. Future research should include additional strains and incorporate other stressors, such as nutrient enrichment and light variability.
Overall, this study contributes to our predictive understanding of how climate change may reshape harmful algal species’ distribution, productivity, and ichthyotoxicity in coastal ecosystems.

5. Materials and Methods

5.1. Culture of Microalgae

A unialgal strain of H. akashiwo (NWFSC-513), isolated initially from Clam Bay, WA, USA, in 2010, was cultured in f/2 medium (minus silicate) prepared with artificial seawater (ESAW) [67]. Cultures were maintained in 250 mL Erlenmeyer flasks at 20 ± 1 °C and under continuous illumination (80 ± 5 μmol photons m−2 s−1).

5.2. Experimental Conditions

Glassware was acid-washed in 1% HCl overnight and rinsed with ultrapure water. All experimental conditions were tested in triplicate to ensure reproducibility. Salinity was adjusted to 10, 20, or 30 by dissolving NaCl (Sigma-Aldrich, Oakville, ON, Canada) into ESAW. Before each experiment, H. akashiwo was acclimated to the designated salinity and grown to the mid-exponential phase (at Day 3–4 during the exponential growth phase). Cultures were diluted to 10,000 cells mL⁻1 in 50 mL Pyrex tubes (Corning, Corning, NY, USA), each sealed with a silicone stopper equipped with ports for gas, sampling, and pressure release.
Temperature control was achieved using refrigerated/heating circulators (VWR, Mississauga, ON, Canada), with temperature monitored three times daily using a Traceable™ Waterproof Thermometer (Fisher Scientific™, Ottawa, ON, Canada). Light intensity was maintained at 250 ± 10 μmol photons m⁻2 s⁻1 using a Quantum Scalar Laboratory sensor (Biospherical Instruments Inc., San Diego, CA, USA). CO2 (Praxair Canada Inc., London, ON, Canada) was filtered (0.45 μm) and bubbled into cultures for five minutes daily to maintain target concentrations, minimizing shear stress due to the delicate cell-wall-lacking morphology of H. akashiwo [43].

5.3. Growth Measurements

Cell density was assessed every 24 ± 1 h using a 0.5 mL aliquot, from which a 30 μL subsample was analyzed via flow cytometry (Turner Designs PhytoCyt flow cytometer (Sunnyvale, CA, USA)) using CFlow® Plus software, version 1.0.227.5. Cells were gated using forward scatter and chlorophyll-a fluorescence, and density was calculated as:
c e l l   d e n s i t y = g v × 1000
g is the gated count and v is the sample volume (μL).
The specific growth rate (Ke) during the exponential phase was calculated using [68].
    K e = ln ( N t N 0 ) t t t 0
where N0 and Nt are the cell concentrations (cells mL−1) over the (ttt0) period.
The doublings per day (k) was computed as:
      k = K e 0.6931
The yield was defined as the mean of the three highest cell densities measured at the end of the exponential or early stationary phases.

5.4. Cell Permeability Assay

Membrane permeability was quantified using SYTOX® Green (Life Technologies, Carlsbad, CA, USA), which binds nucleic acids in membrane-compromised cells [69]. A 50 μM stock solution was stored at −20 °C. Background fluorescence was measured using Lugol’s iodine (0.5% v/v), and 30 μL samples were analyzed by flow cytometry (Ex: 488 nm, Em: 523 nm). For the test samples, 0.6 μM SYTOX® Green was added and incubated in the dark for 15 min before measurement. Permeability was expressed as relative fluorescence units (RFU) after background subtraction. This approach offered a reliable proxy for evaluating membrane damage, which is often linked to ichthyotoxin release in H. akashiwo and other harmful algal species.

5.5. Design of Experiments (DOE)

A two-level complete factorial design (FFD) was used to assess the effects of temperature, salinity, and CO2 concentration, three key environmental stressors shaped by climate change, on growth, yield, and permeability. High (+1), low (−1), and center (0) coded values were assigned for each factor (Table 8). The selected ranges reflected values observed in natural aquatic environments as well as projected future conditions, ensuring their ecological relevance and realism.
Following FFD screening, response surface methodology (RSM) was used to explore the optimal conditions using a second-order polynomial model:
Y = β 0 + i = 1 k β i x i + i = 1 k β i i x i 2 + 1 i j k β i j x i x j + ε
where β0 is the constant parameter; k is the number of variables; xi and xj are the design variables in coded values; and βi, βii, and βij are the coefficients of linear parameters, coefficients of quadratic parameters, and interaction parameters, respectively.

5.6. Statistical Analysis

Design Expert software (v10.0.3.1, Stat-Ease, Inc., Minneapolis, MS, USA) was used to create and analyze the experimental data and to conduct analysis of variance (ANOVA) or experimental design and model fitting. Statistical significance was determined at p < 0.05. All samples and experiments were performed in triplicate. The data were presented as a mean value ± standard deviation.

Author Contributions

M.M.A.: Conceptualization, Data Curation, Formal Analysis, Investigation, Methodology, Project Administration, Validation, Visualization, Writing—Original Draft, Writing—Review and Editing. C.G.T.: Conceptualization, Formal Analysis, Funding Acquisition, Methodology, Project Administration, Supervision, Validation, Writing—Review and Editing. All authors have read and agreed to the published version of the manuscript.

Funding

This research was supported by the Natural Sciences and Engineering Research Council of Canada (NSERC) Discovery Grant [4458-2016] and the NSERC CREATE program on Algal Bloom Abatement through Technology and Education (ABATE) [448172-2014] awarded to Charles G. Trick.

Institutional Review Board Statement

Not applicable.

Informed Consent Statement

Not applicable.

Data Availability Statement

There are no supporting data for this paper.

Conflicts of Interest

The authors declare no conflicts of interest.

Abbreviations

The following abbreviations are used in this manuscript:
DOEDesign of Experiment
OFATOne-Factor-at-a-Time
ANOVAAnalysis of Variance
2FITwo-factor interaction
RSMResponse Surface Method
FFDFull Factorial Design
HABsHarmful Algal Blooms
ESAWEnriched Artificial Seawater

References

  1. Hallegraeff, G.M. Review of harmful algal blooms and their apparent global increase. Phycologia 1993, 32, 79–99. [Google Scholar] [CrossRef]
  2. Anderson, D.M.; Glibert, P.M.; Burkholder, J.M. Harmful algal blooms and eutrophication: Nutrient sources, compositions, and consequences. Estuaries 2002, 25, 704–726. [Google Scholar] [CrossRef]
  3. Glibert, P.M.; Seitzinger, S.; Heil, C.A.; Burkholder, J.M.; Parrow, M.W.; Codispoti, L.A.; Kelly, V. The role of eutrophication in the global proliferation of harmful algal blooms: New perspectives and new approaches. Oceanography 2005, 18, 198–209. [Google Scholar] [CrossRef]
  4. Hallegraeff, G.M. Ocean climate change, phytoplankton community responses, and harmful algal blooms: A formidable predictive challenge. J. Phycol. 2010, 46, 220–235. [Google Scholar] [CrossRef]
  5. Wells, M.L.; Trainer, V.L.; Smayda, T.J.; Karlson, B.S.; Trick, C.G.; Kudela, R.M.; Ishikawa, A.; Bernard, S.; Wulff, A.; Anderson, D.M.; et al. Harmful algal blooms and climate change: Learning from the past and present to forecast the future. Harmful Algae 2015, 49, 68–93. [Google Scholar] [CrossRef] [PubMed]
  6. Wells, M.L.; Karlson, B.; Wulff, A.; Kudela, R.; Trick, C.; Asnaghi, V.; Berdalet, E.; Cochlan, W.; Davidson, K.; De Rijcke, M.; et al. Future HAB science: Directions and challenges in a changing climate. Harmful Algae 2020, 91, 101632. [Google Scholar] [CrossRef]
  7. Anderson, D.M.; Cembella, A.D.; Hallegraeff, G.M. Progress in understanding harmful algal blooms: Paradigm shifts and new technologies for research, monitoring, and management. Annu. Rev. Mar. Sci. 2012, 4, 143–176. [Google Scholar] [CrossRef]
  8. Nixon, S.W. Coastal marine eutrophication: A definition, social causes, and future concerns. Ophelia 1995, 41, 199–219. [Google Scholar] [CrossRef]
  9. Camacho, F.G.; Gallardo Rodriguez, J.; Sanchez Miron, A.; Ceron Garcia, M.C.; Belarbi, E.H.; Chisti, Y.; Grima, E.M. Biotechnological significance of toxic marine dinoflagellates. Biotechnol. Adv. 2007, 25, 176–194. [Google Scholar] [CrossRef]
  10. Brading, P.; Warner, M.E.; Davey, P.; Smith, D.J.; Achterberg, E.P.; Suggett, D.J. Differential effects of ocean acidification on growth and photosynthesis among phylotypes of Symbiodinium (Dinophyceae). Limnol. Oceanogr. 2011, 56, 927–938. [Google Scholar] [CrossRef]
  11. Lewitus, A.J.; Horner, R.A.; Caron, D.A.; Garcia-Mendoza, E.; Hickey, B.M.; Hunter, M.; Huppert, D.D.; Kudela, R.M.; Langlois, G.W.; Largier, J.L.; et al. Harmful algal blooms along the North American west coast region: History, trends, causes, and impacts. Harmful Algae 2012, 19, 133–159. [Google Scholar] [CrossRef]
  12. Branco, S.; Menezes, M.; Alves-de-Souza, C.; Domingos, P.; Schramm, M.A.; Proenca, L.A. Recurrent blooms of Heterosigma akashiwo (Raphidophyceae) in the Piraque Channel, Rodrigo de Freitas Lagoon, southeast Brazil. Braz. J. Biol. 2014, 74, 529–537. [Google Scholar] [CrossRef] [PubMed]
  13. Mudie, P.J.; Rochon, A.; Levac, E. Palynological records of red tide-producing species in Canada: Past trends and implications for the future. Palaeogeogr. Palaeoclimatol. Palaeoecol. 2002, 180, 159–186. [Google Scholar] [CrossRef]
  14. Eppley, R.W. Temperature and phytoplankton growth in the sea. Fish. Bull.-NOAA 1972, 70, 1063–1085. [Google Scholar]
  15. Raven, J.A.; Geider, R.J. Temperature and algal growth. New Phytol. 1988, 110, 441–461. [Google Scholar] [CrossRef]
  16. Fernández-González, C.; Tarran, G.A.; Schuback, N.; Woodward, E.; Arístegui, J.; Marañón, E. Phytoplankton responses to changing temperature and nutrient availability are consistent across the tropical and subtropical Atlantic. Commun. Biol. 2022, 5, 1035. [Google Scholar] [CrossRef]
  17. Kamykowski, D.; McCollum, S.A. The temperature acclimatized swimming speed of selected marine dinoflagellates. J. Plankton Res. 1986, 8, 275–287. [Google Scholar] [CrossRef]
  18. Yamochi, S.; Joh, H. Effects of temperature on the vegetative cell liberation of seven species of red-tide algae from the bottom mud in Osaka Bay. J. Oceanogr. Soc. Jpn. 1986, 42, 266–275. [Google Scholar] [CrossRef]
  19. Beardall, J.; Stojkovic, S.; Larsen, S. Living in a high CO2 world: Impacts of global climate change on marine phytoplankton. Plant Ecol. Divers. 2009, 2, 191–205. [Google Scholar] [CrossRef]
  20. Huntington, T.G. Climate warming-induced intensification of the hydrologic cycle: An assessment of the published record and potential impacts on agriculture. Adv. Agron. 2010, 109, 1–53. [Google Scholar] [CrossRef]
  21. Yang, D.; Yang, Y.; Xia, J. Hydrological cycle and water resources in a changing world: A review. Geogr. Sustain. 2021, 2, 115–122. [Google Scholar] [CrossRef]
  22. Skliris, N.; Marsh, R.; Josey, S.A.; Good, S.A.; Liu, C.; Allan, R.P. Salinity changes in the world ocean since 1950 in relation to changing surface freshwater fluxes. Clim. Dyn. 2014, 43, 709–736. [Google Scholar] [CrossRef]
  23. Gu, L.; Yin, J.; Slater, L.J.; Chen, J.; Do, H.X.; Wang, H.M.; Chen, L.; Jiang, Z.; Zhao, T. Intensification of global hydrological droughts under anthropogenic climate warming. Water Resour. Res. 2023, 59, e2022WR032997. [Google Scholar] [CrossRef]
  24. Sugie, K.; Fujiwara, A.; Nishino, S.; Kameyama, S.; Harada, N. Impacts of temperature, CO2, and salinity on phytoplankton community composition in the Western Arctic Ocean. Front. Mar. Sci. 2020, 6, 821. [Google Scholar] [CrossRef]
  25. Thangaraj, S.; Sun, J. Ocean warming and acidification affect the transitional C: N: P ratio and macromolecular accumulation in the harmful raphidophyte Heterosigma akashiwo. Commun. Biol. 2023, 6, 151. [Google Scholar] [CrossRef]
  26. Nilsson, J.; Körnich, H. A conceptual model of the surface salinity distribution in the oceanic Hadley cell. J. Clim. 2008, 21, 6586–6598. [Google Scholar] [CrossRef]
  27. McPhee, M.G.; Proshutinsky, A.; Morison, J.H.; Steele, M.; Alkire, M.B. Rapid change in freshwater content of the Arctic Ocean. Geophys. Res. Lett. 2009, 36, L10602. [Google Scholar] [CrossRef]
  28. Singh, S.P.; Singh, P. Effect of CO2 concentration on algal growth: A review. Renew. Sust. Energy Rev. 2015, 38, 172–179. [Google Scholar] [CrossRef]
  29. NOAA. Trends in Atmospheric Carbon Dioxide—Mauna Loa. US Department of Commerce, National Oceanic and Atmospheric Administration. Available online: www.esrl.noaa.gov/gmd/ccgg/trends/ (accessed on 14 June 2024).
  30. Caldeira, K.; Wickett, M.E. Oceanography: Anthropogenic carbon and ocean pH. Nature 2003, 425, 365. [Google Scholar] [CrossRef]
  31. Raven, J.; Caldeira, K.; Elderfield, H.; Hoegh-Guldberg, O.; Liss, P.; Riebesell, U.; Shepherd, J.; Turley, C.; Watson, A. Ocean Acidification Due to Increasing Atmospheric Carbon Dioxide; The Royal Society Special Report; The Royal Society: London, UK, 2005; 68p. [Google Scholar]
  32. IPCC. Climate Change 2013: The Physical Science Basis; Working Group I Contribution to the Fifth Assessment Report of the Intergovernmental Panel on Climate Change; Stocker, T.F., Qin, D., Plattner, G.K., Tignor, M.M., Allen, S.K., Boschung, J., Nauels, A., Xia, Y., Bex, V., Midgley, P.M., Eds.; Cambridge University Press: Cambridge, UK; New York, NY, USA, 2013; 1535p. [Google Scholar]
  33. Feely, R.A.; Sabine, C.L.; Lee, K.; Berelson, W.; Kleypas, J.; Fabry, V.J.; Millero, F.J. Impact of anthropogenic CO2 on the CaCO3 system in the oceans. Science 2004, 305, 362–366. [Google Scholar] [CrossRef]
  34. Feely, R.A.; Sabine, C.L.; Hernandez-Ayon, M.; Ianson, D.; Hales, B. Evidence for upwelling of corrosive “acidified” water onto the continental shelf. Science 2008, 320, 1490–1492. [Google Scholar] [CrossRef] [PubMed]
  35. Kleypas, J.A.; Feely, R.A.; Fabry, V.J.; Langdon, C.; Sabine, C.L.; Robbins, L.L. Impacts of Ocean Acidification on Coral Reefs and Other Marine Calcifiers: A Guide for Future Research; Report of a Workshop; REEFolution: St. Petersburg, FL, USA, 2006; 88p. [Google Scholar]
  36. Beardall, J.; Raven, J.A. The potential effects of global climate change on microalgal photosynthesis, growth and ecology. Phycologia 2004, 43, 26–40. [Google Scholar] [CrossRef]
  37. Giordano, M.; Beardall, J.; Raven, J.A. CO2 concentrating mechanisms in algae: Mechanisms, environmental modulation, and evolution. Annu. Rev. Plant Biol. 2005, 56, 99–131. [Google Scholar] [CrossRef] [PubMed]
  38. Müller, M.N.; Dorantes-Aranda, J.J.; Seger, A.; Botana, M.T.; Brandini, F.P.; Hallegraeff, G.M. Ichthyotoxicity of the dinoflagellate Karlodinium veneficum in response to changes in seawater pH. Front. Mar. Sci. 2019, 6, 82. [Google Scholar] [CrossRef]
  39. Manson, M.D.; Tedesco, P.; Berg, H.C.; Harold, F.M.; Van der Drift, C. A protonmotive force drives bacterial flagella. Proc. Natl. Acad. Sci. USA 1977, 74, 3060–3064. [Google Scholar] [CrossRef]
  40. Hallegraeff, G.M.; Blackburn, S.I.; Doblin, M.A.; Bolch, C.J.S. Global toxicology, ecophysiology, and population relationships of the chain-forming PST dinoflagellate Gymnodinium catenatum. Harmful Algae 2012, 14, 130–143. [Google Scholar] [CrossRef]
  41. Edvardsen, B.; Imai, I. The ecology of harmful flagellates within Prymnesiophyceae and Raphidophyceae. In Ecology of Harmful Algae. Ecological Studies: Analysis and Synthesis; Granéli, E., Turner, J., Eds.; Springer: Berlin/Heidelberg, Germany, 2006; pp. 67–79. [Google Scholar] [CrossRef]
  42. Mardones, J.I.; Paredes-Mella, J.; Flores-Leñero, A.; Yarimizu, K.; Godoy, M.; Artal, O.; Corredor-Acosta, A.; Marcus, L.; Cascales, E.; Espinoza, J.P.; et al. Extreme harmful algal blooms, climate change, and potential risk of eutrophication in Patagonian fjords: Insights from an exceptional Heterosigma akashiwo fish-killing event. Prog. Oceanogr. 2023, 210, 102921. [Google Scholar] [CrossRef]
  43. Mehdizadeh Allaf, M. Heterosigma akashiwo, a fish-killing flagellate. Microbiol. Res. 2023, 14, 132–147. [Google Scholar] [CrossRef]
  44. Smayda, T.J. Ecophysiology and bloom dynamics of Heterosigma akashiwo (Raphidophyceae). In Physiology Ecology of Harmful Algal Blooms; Anderson, D.M., Cembella, A.D., Hallegraeff, G.M., Eds.; Springer: Berlin/Heidelberg, Germany, 1998; pp. 113–132. [Google Scholar]
  45. Itakura, S.; Nagasaki, K.; Yamaguchi, M.; Imai, I. Cyst formation in the red tide flagellate Heterosigma akashiwo (Raphidophyceae). J. Plankton Res. 1996, 18, 1975–1979. [Google Scholar] [CrossRef]
  46. Tobin, E.D.; Grunbaum, D.; Patterson, J.; Cattolico, R.A. Behavioral and physiological changes during benthic-pelagic transition in the harmful alga, Heterosigma akashiwo: Potential for rapid bloom formation. PLoS ONE 2013, 8, e76663. [Google Scholar] [CrossRef]
  47. Ono, K.; Khan, S.; Onoue, Y. Effects of temperature and light intensity on the growth and toxicity of Heterosigma akashiwo (Raphidophyceae). Aquac. Res. 2000, 31, 427–433. [Google Scholar] [CrossRef]
  48. Fu, F.X.; Zhang, Y.; Warner, M.E.; Feng, Y.; Sun, J.; Hutchins, D.A. A comparison of future increased CO2 and temperature effects on sympatric Heterosigma akashiwo and Prorocentrum minimum. Harmful Algae 2008, 7, 76–90. [Google Scholar] [CrossRef]
  49. Martinez, R.; Orive, E.; Laza-Martinez, A.; Seoane, S. Growth response of six strains of Heterosigma akashiwo to varying temperature, salinity and irradiance conditions. J. Plankton Res. 2010, 32, 529–538. [Google Scholar] [CrossRef]
  50. Ikeda, C.E.; Cochlan, W.P.; Bronicheski, C.M.; Trainer, V.L.; Trick, C.G. The effects of salinity on the cellular permeability and ichthyotoxicity of Heterosigma akashiwo. J. Phycol. 2016, 53, 745–760. [Google Scholar] [CrossRef] [PubMed]
  51. Mehdizadeh Allaf, M.; Trick, C.G. Multiple-stressor design-of-experiment (DOE) and one-factor-at-a-time (OFAT) observations defining Heterosigma akashiwo growth and cell permeability. J. Appl. Phycol. 2019, 31, 3515–3526. [Google Scholar] [CrossRef]
  52. Xu, D.; Zhou, B.; Wang, Y.; Ju, Q.; Yu, Q.; Tang, X. Effect of CO2 enrichment on competition between Skeletonema costatum and Heterosigma akashiwo. Chin. J. Oceanol. Limn. 2010, 28, 933–939. [Google Scholar] [CrossRef]
  53. Kim, H.; Spivack, A.J.; Menden-Deuer, S. pH alters the swimming behaviors of the raphidophyte Heterosigma akashiwo: Implications for bloom formation in an acidified ocean. Harmful Algae 2013, 26, 1–11. [Google Scholar] [CrossRef]
  54. Haque, S.M.; Onoue, Y. Effects of salinity on growth and toxin production of a noxious phytoflagellate, Heterosigma akashiwo (Raphidophyceae). Bot. Mar. 2002, 45, 356–363. [Google Scholar] [CrossRef]
  55. Bearon, R.N.; Grunbaum, D.; Cattolico, R.A. Effects of salinity structure on swimming behavior and harmful algal bloom formation in Heterosigma akashiwo, a toxic raphidophyte. Mar. Ecol. Prog. Ser. 2006, 306, 153–163. [Google Scholar] [CrossRef]
  56. Strom, S.L.; Harvey, E.L.; Fredrickson, K.A.; Menden-Deuer, S. Broad salinity tolerance as a refuge from predation in the harmful raphidophyte alga Heterosigma akashiwo (Raphidophyceae). J. Phycol. 2013, 49, 20–31. [Google Scholar] [CrossRef]
  57. Taylor, F.J.R.; Harrison, P.J. Harmful algal blooms in western Canadian coastal waters. In Harmful Algal Blooms in the PICES Region of the North Pacific; Taylor, F.J.R., Trainer, V.M., Eds.; PICES Rep 23; PICES: Sidney, Australia, 2002; pp. 77–88. [Google Scholar]
  58. Mehdizadeh Allaf, M.; Trick, C.G. Insights into cellular localization and environmental influences on the toxicity of marine fish-killing flagellate, Heterosigma akashiwo. Int. J. Mol. Sci. 2023, 24, 10333. [Google Scholar] [CrossRef] [PubMed]
  59. Czitrom, V. One-factor-at-a-time versus designed experiments. Am. Stat. 1999, 53, 126–131. [Google Scholar] [CrossRef]
  60. Niedz, R.P.; Evens, T.J. Design of experiments (DOE): History, concepts, and relevance to in vitro culture. Vitr. Cell Dev. Biol. Plant 2016, 52, 547–562. [Google Scholar] [CrossRef]
  61. Welham, S.J.; Gezan, S.A.; Clark, S.J.; Mead, A. Models for a single variate: Simple linear regression. In Statistical Methods in Biology: Design and Analysis of Experiments and Regression; Welham, S.J., Gezan, S.A., Clark, S.J., Mead, A., Eds.; CRC Press: Boca Raton, FL, USA, 2015; pp. 287–324. [Google Scholar]
  62. Islam, M.A.; Sakkas, V.; Albanis, T.A. Application of statistical design of experiment with desirability function for the removal of organophosphorus pesticide from aqueous solution by low-cost material. J. Hazard. Mater. 2009, 170, 230–238. [Google Scholar] [CrossRef]
  63. Zhang, Y.; Fu, F.X.; Whereat, E.; Coyne, K.J.; Hutchins, D.A. Bottom-up controls on a mixed-species HAB assemblage: A comparison of sympatric Chattonella subsalsa and Heterosigma akashiwo (Raphidophyceae) isolates from the Delaware Inland Bays, USA. Harmful Algae 2006, 5, 310–320. [Google Scholar] [CrossRef]
  64. Butrón, A.; Madariaga, I.; Orive, E. Tolerance to high irradiance levels as a determinant of the bloom-forming Heterosigma akashiwo success in estuarine waters in summer. Estuar. Coast. Shelf Sci. 2012, 107, 141–149. [Google Scholar] [CrossRef]
  65. Mehdizadeh Allaf, M.; Trick, C.G. Influence of multi-stressor combinations of pCO2, temperature, and salinity on the toxicity of Heterosigma akashiwo (Raphidophyceae), a fish-killing flagellate. J. Phycol. 2024, 60, 1001–1020. [Google Scholar] [CrossRef]
  66. Flores-Leñero, A.; Vargas-Torres, V.; Paredes-Mella, J.; Norambuena, L.; Fuenzalida, G.; Lee-Chang, K.; Mardones, J.I. Heterosigma akashiwo in Patagonian fjords: Genetics, growth, pigment signature, and the role of PUFA and ROS in ichthyotoxicity. Toxins 2022, 14, 577. [Google Scholar] [CrossRef]
  67. Harrison, P.J.; Berges, J.A. Marine culture media. In Algal Culturing Techniques; Anderson, R.A., Ed.; Elsevier Academic Press: San Diego, CA, USA, 2005; pp. 21–33. [Google Scholar]
  68. Guillard, R.R. Division rates. In Handbook of Phycological Methods; Stein, J.R., Ed.; Cambridge University Press: Cambridge, UK, 1973; pp. 290–311. [Google Scholar]
  69. Brussaard, C.P.; Marie, D.; Thyrhaug, R.; Bratbak, G. Flow cytometric analysis of phytoplankton viability following viral infection. Aquat. Microb. Ecol. 2001, 26, 157–166. [Google Scholar] [CrossRef]
Figure 1. Profiles of specific growth rate (Ke) and doublings per day (k) for H. akashiwo at 25 °C, 20 °C, and 15 °C at different salinities and CO2 levels. The bar chart represents the specific growth rate (Ke) (d−1), and the scatter graph (■) illustrates the doublings per day (k) (d−1). The discrete data points are the average of the triplicate measurements ± standard deviation (n = 3).
Toxins 17 00259 g001
Figure 2. Comparison of actual and predicted values of specific growth rates (Ke).
Toxins 17 00259 g002
Figure 3. Surface plot of the combined effect of temperature and CO2 level on H. akashiwo. (A) Specific growth rate (Ke). (B) Doublings per day (k).
Toxins 17 00259 g003
Figure 4. Yield of H. akashiwo grown at 25 °C, 20 °C, and 15 °C with different salinities and CO2 levels. The discrete data points are the average of triplicate measurements ± standard deviation (n = 3).
Toxins 17 00259 g004
Figure 5. Surface plot of the combined effect of temperature and salinity (A) and temperature and CO2 level (B) on the cell yield of H. akashiwo.
Toxins 17 00259 g005
Figure 6. Cell permeability of H. akashiwo grew at 25 °C, 20 °C, and 15 °C with different salinities and CO2 levels. The discrete data points are the average of triplicate measurements ± standard deviation (n = 3).
Toxins 17 00259 g006
Figure 7. The combined effect of temperature and salinity (A), temperature and CO2 level (B), and salinity and CO2 level (C) on the cellular permeability of H. akashiwo.
Toxins 17 00259 g007
Figure 8. Effect of cell permeability and cell yield as a function of specific growth rates (A), and the relationship between cell permeability and cell yield production (B) in H. akashiwo.
Toxins 17 00259 g008
Table 1. Experimental design for temperature, salinity, and CO2 levels and their effects on the growth responses of H. akashiwo isolated from Calm Bay, WA, USA (n = 3 ± standard deviation).
Run OrderCoded Values of FactorsResponses
Temperature (°C) X1Salinity X2CO2 Level (ppm) X3Specific Growth Rate (Ke) (d−1)Doublings per Day (k) (d−1)
1−1−1−10.17 ± 0.050.24 ± 0.08
2+1+1+10.5 ± 0.050.71 ± 0.08
3−1−1+10.12 ± 0.040.17 ± 0.06
4−1+1−10.16 ± 0.040.24 ± 0.05
50000.36 ± 0.050.52 ± 0.08
6−1+1+10.19 ± 0.040.27 ± 0.06
7+1−1+10.3 ± 0.100.43 ± 0.14
80000.35 ± 0.080.51 ± 0.12
9+1+1−10.78 ± 0.231.13 ± 0.33
10+1−1−10.79 ± 0.151.13 ± 0.22
110000.36 ± 0.050.52 ± 0.08
12−1000.17 ± 0.030.25 ± 0.05
130000.4 ± 0.100.57 ± 0.14
140−100.29 ± 0.040.42 ± 0.05
150000.45 ± 0.070.65 ± 0.10
1600−10.45 ± 0.120.64 ± 0.17
1700+10.45 ± 0.100.65 ± 0.14
18+1000.59 ± 0.050.85 ± 0.08
190+100.38 ± 0.050.55 ± 0.08
Table 2. ANOVA results for specific growth rate (Ke) and doublings per day (k) of H. akashiwo.
Source RemarkSum of SquaresdfMean SquareF-Valuep-Value
Prob > F
ModelKeSignificant0.6160.1031.76<0.0001
kSignificant1.2860.2131.76<0.0001
X1KeSignificant0.4610.46141.18<0.0001
kSignificant0.9510.95141.18<0.0001
X2Ke 0.01210.0123.700.0808
k 0.02510.0253.700.0808
X3KeSignificant0.06410.06419.870.0010
kSignificant0.1310.01319.870.0010
X1X2Ke 0.00210.000.0670.430
k 0.00410.0040.670.4304
X1X3KeSignificant0.07210.07222.210.0006
kSignificant0.1510.1522.210.0006
X2X3Ke 0.00910.0092.940.1146
k 0.02010.0202.940.1146
R-squaredKe 0.9454
k 0.9454
Adj. R-squaredKe 0.9157
k 0.9157
Adeq precisionKe 17.800
k 17.80
Table 3. The optimum factor set for the maximum growth rate and doublings per day of H. akashiwo is based on the Design of Experiments using the response surface methodology (DOE–RSM) approach.
FactorsSpecific Growth Rate (Ke) (d−1)Doublings per Day (k) (d−1)
Temperature (°C)SalinityCO2 LevelPredictedExperimentalPredictedExperimental
25304000.79 ± 0.060.78 ± 0.151.14 ± 0.081.13 ± 0.22
Table 4. Experimental design for temperature, salinity, and CO2 levels and their yield production for H. akashiwo isolated from Calm Bay, WA, USA (n = 3 ± standard deviation).
Run OrderCoded Values of FactorsResponse
Temperature (°C)SalinityCO2 Level (ppm)Yield (Cells mL−1) (×103)
1−1−1−19.23 ± 1.03
2+1+1+123.06 ± 2.06
3−1−1+113.74 ± 2.74
4−1+1−114.54 ± 1.25
500020.58 ± 3.37
6−1+1+120.49 ± 2.96
7+1−1+123.39 ± 2.43
800022.41 ± 1.72
9+1+1−121.48 ± 2.46
10+1−1−123.59 ± 1.96
1100021.46 ± 3.27
12−10015.33 ± 4.94
1300025.67 ± 4.80
140−1014.76 ± 1.79
1500023.37 ± 2.78
1600−121.69 ± 2.18
1700+121.39 ± 1.94
18+10021.94 ± 1.74
190+1021.71 ± 1.54
Table 6. Experimental design for temperature, salinity, and CO2 levels and their cell permeability for H. akashiwo isolated from Calm Bay, WA, USA (n = 3 ± standard deviation).
Run OrderCoded Values of FactorsResponse
Temperature (°C)SalinityCO2 Level (ppm)Cell Permeability (RFU) (×103)
1−1−1−13.8 × 10³ ± 1227
2+1+1+1396 ± 153.1
3−1−1+1762 ± 181.8
4−1+1−1516 ± 256.5
5000956 ± 4982.3
6−1+1+1238 ± 83
7+1−1+12.3 × 10³ ± 1263.1
8000850 ± 661.4
9+1+1−1355 ± 103.6
10+1−1−1740 ± 234.9
11000803 ± 509.1
12−100550 ± 172.3
13000459 ± 194.4
140−101.7 × 10³ ± 496.8
150001072 ± 813.7
1600−1806 ± 261.0
1700+11.2 × 10³ ± 475.7
18+100715 ± 267.6
190+10405 ± 141.3
Table 7. ANOVA results for cell permeability of H. akashiwo.
SourceRemarkSum of SquaresdfMean SquareF-Valuep-Value
ModelSignificant9.323 × 101261.554 × 10125.170.0093
X1 1.795 × 101111.795 × 10110.600.4559
X2Significant5.488 × 101215.488 × 101218.270.0013
X3 1.651 × 101111.651 × 10110.550.4740
X1X2 2.797 × 101112.797 × 10110.930.3553
X1X3Significant3.026 × 101213.026 × 101210.070.0089
X2X3 1.857 × 101111.857 × 10110.620.4483
R-squared 0.7383
Adj. R-squared 0.5956
Adeq precision 9.398
Table 8. Experimental ranges and levels of the factors used in the factorial design.
FactorCoded SymbolValues of Coded Levels
−10+1
Temperature (°C)X1152025
SalinityX2102030
CO2 level (ppm)X3400550700
Disclaimer/Publisher’s Note: The statements, opinions and data contained in all publications are solely those of the individual author(s) and contributor(s) and not of MDPI and/or the editor(s). MDPI and/or the editor(s) disclaim responsibility for any injury to people or property resulting from any ideas, methods, instructions or products referred to in the content.

