Article

Fumonisin B1 Exposure Causes Intestinal Tissue Damage by Triggering Oxidative Stress Pathways and Inducing Associated CYP Isoenzymes

1
College of Animal Science and Technology, Foshan University, Foshan 528225, China
2
Foshan University Veterinary Teaching Hospital, Foshan 528231, China
3
Quality Control Technical Center (Foshan) of National Famous and Special Agricultural Products (CAQS—GAP—KZZX043)/South China Food Safety Research Center, Foshan 528231, China
*
Author to whom correspondence should be addressed.
Toxins 2025, 17(5), 239; https://doi.org/10.3390/toxins17050239
Submission received: 24 March 2025 / Revised: 22 April 2025 / Accepted: 30 April 2025 / Published: 12 May 2025

Abstract

Fumonisin B1 (FB1) is considered the most toxic fumonisin produced by fungi and is commonly found in contaminated feed and crops. Fumonisin and its metabolites extensively exist in feed and crops, where FB1-polluted crop ingestion can do harm to livestock and poultry, causing poultry intestinal toxicity in the latter. For investigating FB1-mediated intestinal toxicity, we assessed the function of FB1 exposure in quail intestines and explored its possible molecular mechanisms. In total, 120 quail pups were classified into two groups, where those in the control group were given a typical control diet, and those in the experimental group were given a typical diet that contained 30 mg/kg FB1. We evaluated the histopathological and ultrastructural changes in quails’ intestines on days 14, 28, and 42, and studied the molecular mechanisms by assessing oxidative stress, inflammation, and nuclear xenobiotic receptors (NXRs). Our results suggest that FB1 exposure causes intestinal inflammation by triggering oxidative stress pathways and modulating NXRs to induce Cytochrome P450 proteins (CYP) isoforms, leading to intestinal histopathological damage. The results of this study shed novel light on the molecular mechanism underlying FB1-induced intestinal injury in juvenile quails.
Key Contribution: FB1 induces intestinal injury in juvenile quails, causing histopathological changes like altered villus length and crypt depth, triggers oxidative stress by downregulating antioxidant genes Nrf2, HO-1, and NQO-1, and causes intestinal inflammation by triggering oxidative stress pathways and modulating NXRs to induce Cytochrome P450 proteins isoform, which is key in its enterotoxicity.

Graphical Abstract

1. Introduction

Fumonisins are produced by several Fusarium species, such as F. proliferatum, and are fatal mycotoxins that contaminate feed and cause various animal diseases. Typically, B-type fumonisins are considered the most toxic [1]. They can be toxic to the liver, kidney, and embryo, and induce arterial plaque formation and immunosuppression in experimental animal systems (mice and rats) [2] (pp. 9481−9515). High levels of exposure to Fumonisin B1 (FB1) are toxic to the liver and also cause gastrointestinal injury in mice and rats [3] (pp. 185−206). Although its toxic mechanism is extensively investigated among experimental animals, research on birds is lacking, and the specific effect of FB1 on quail intestines is unclear.
The intestinal barrier plays a crucial role in preventing invasion by enteric pathogens, commensal bacteria, or natural toxins [4,5,6]. When food contaminated with FB1 is consumed, the intestines are the first organ to be exposed and damaged. Once the intestinal barrier is compromised, toxins present in the intestine can enter the bloodstream, leading to toxin translocation and promoting intestinal infections. Moreover, these toxins can directly affect other organs and may even trigger a systemic inflammatory response syndrome [7].
Cellular mechanisms underlying FB1-mediated toxicity are related to inducing cytotoxicity, oxidative stress, and changes in cytokine production in mice, chick, and intestinal antigen-presenting cells in pigs [1,8,9,10]. The functions of FB1 in intestines include interference with homeostasis of nuclear xenobiotic receptors (NXRs), causing inflammation and histopathology (Length of villi, depth of crypts, ratio of villi to crypts, number of goblet cells, neutrophils and lymphocytes; morphology of mitochondria, etc.), and have been long demonstrated in mice [11,12,13]. However, the phenomenon and mechanism of intestinal damage caused by FB1 in poultry are not clear. In this study, we used the toxicological model animal quail as the research object; the effects of FB1 on the intestines of quails were studied from the aspects of oxidative stress, inflammation, and NXRs.

2. Results

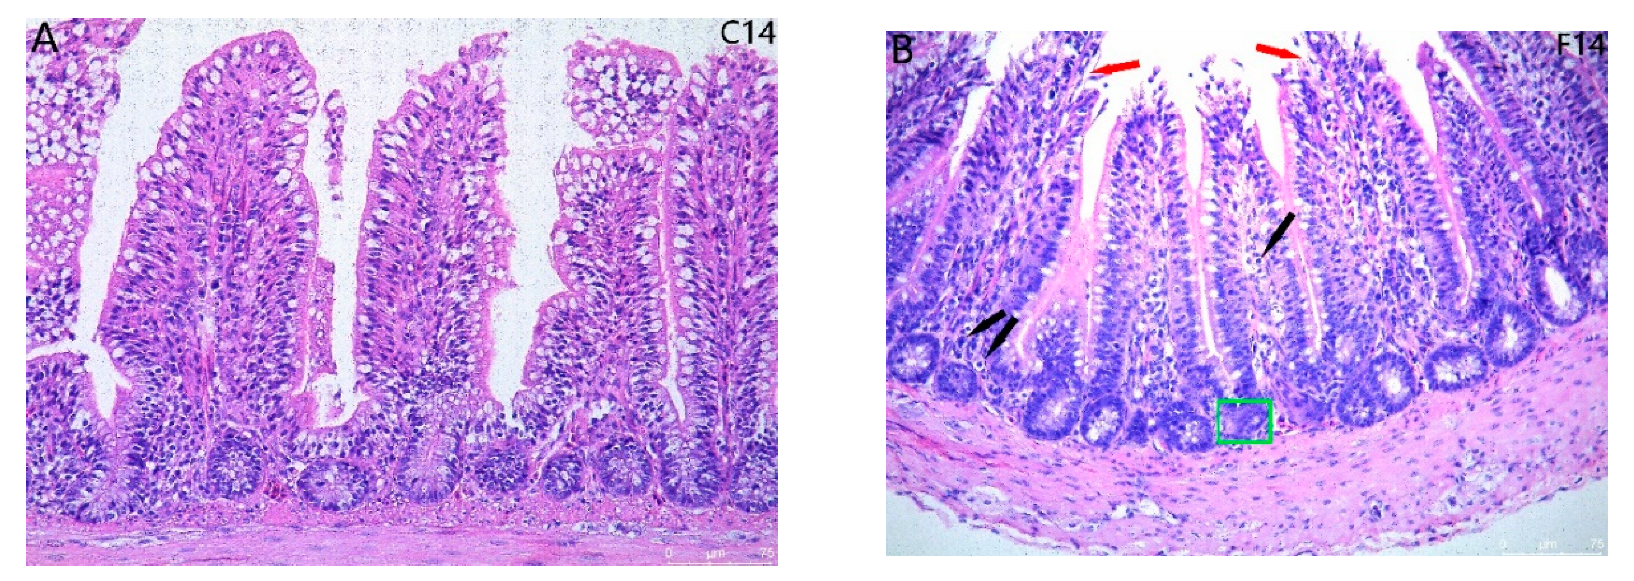
2.1. Histopathological Observation for Ileum Intestinal Tissue

Pathological sections of quail ileum with HE staining are shown in Figure 1. Intestinal villus length was not significantly different in experimental versus control groups at 14 days. At 28 days, villus length increased in the experimental group relative to the control group (p < 0.05). At 42 d, the intestinal villus length of the experimental group remarkably decreased relative to the control group (p < 0.05) due to partial intestinal villous shedding and necrosis. FB1 exposure resulted in an increase in intestinal crypt depth compared to the control group (p < 0.05), leading to a decrease in the V/C ratio in the FB1 group relative to the control group (p < 0.05). Goblet cells, neutrophils, and lymphocytes quantities of the experimental group increased relative to the control group (p < 0.05).

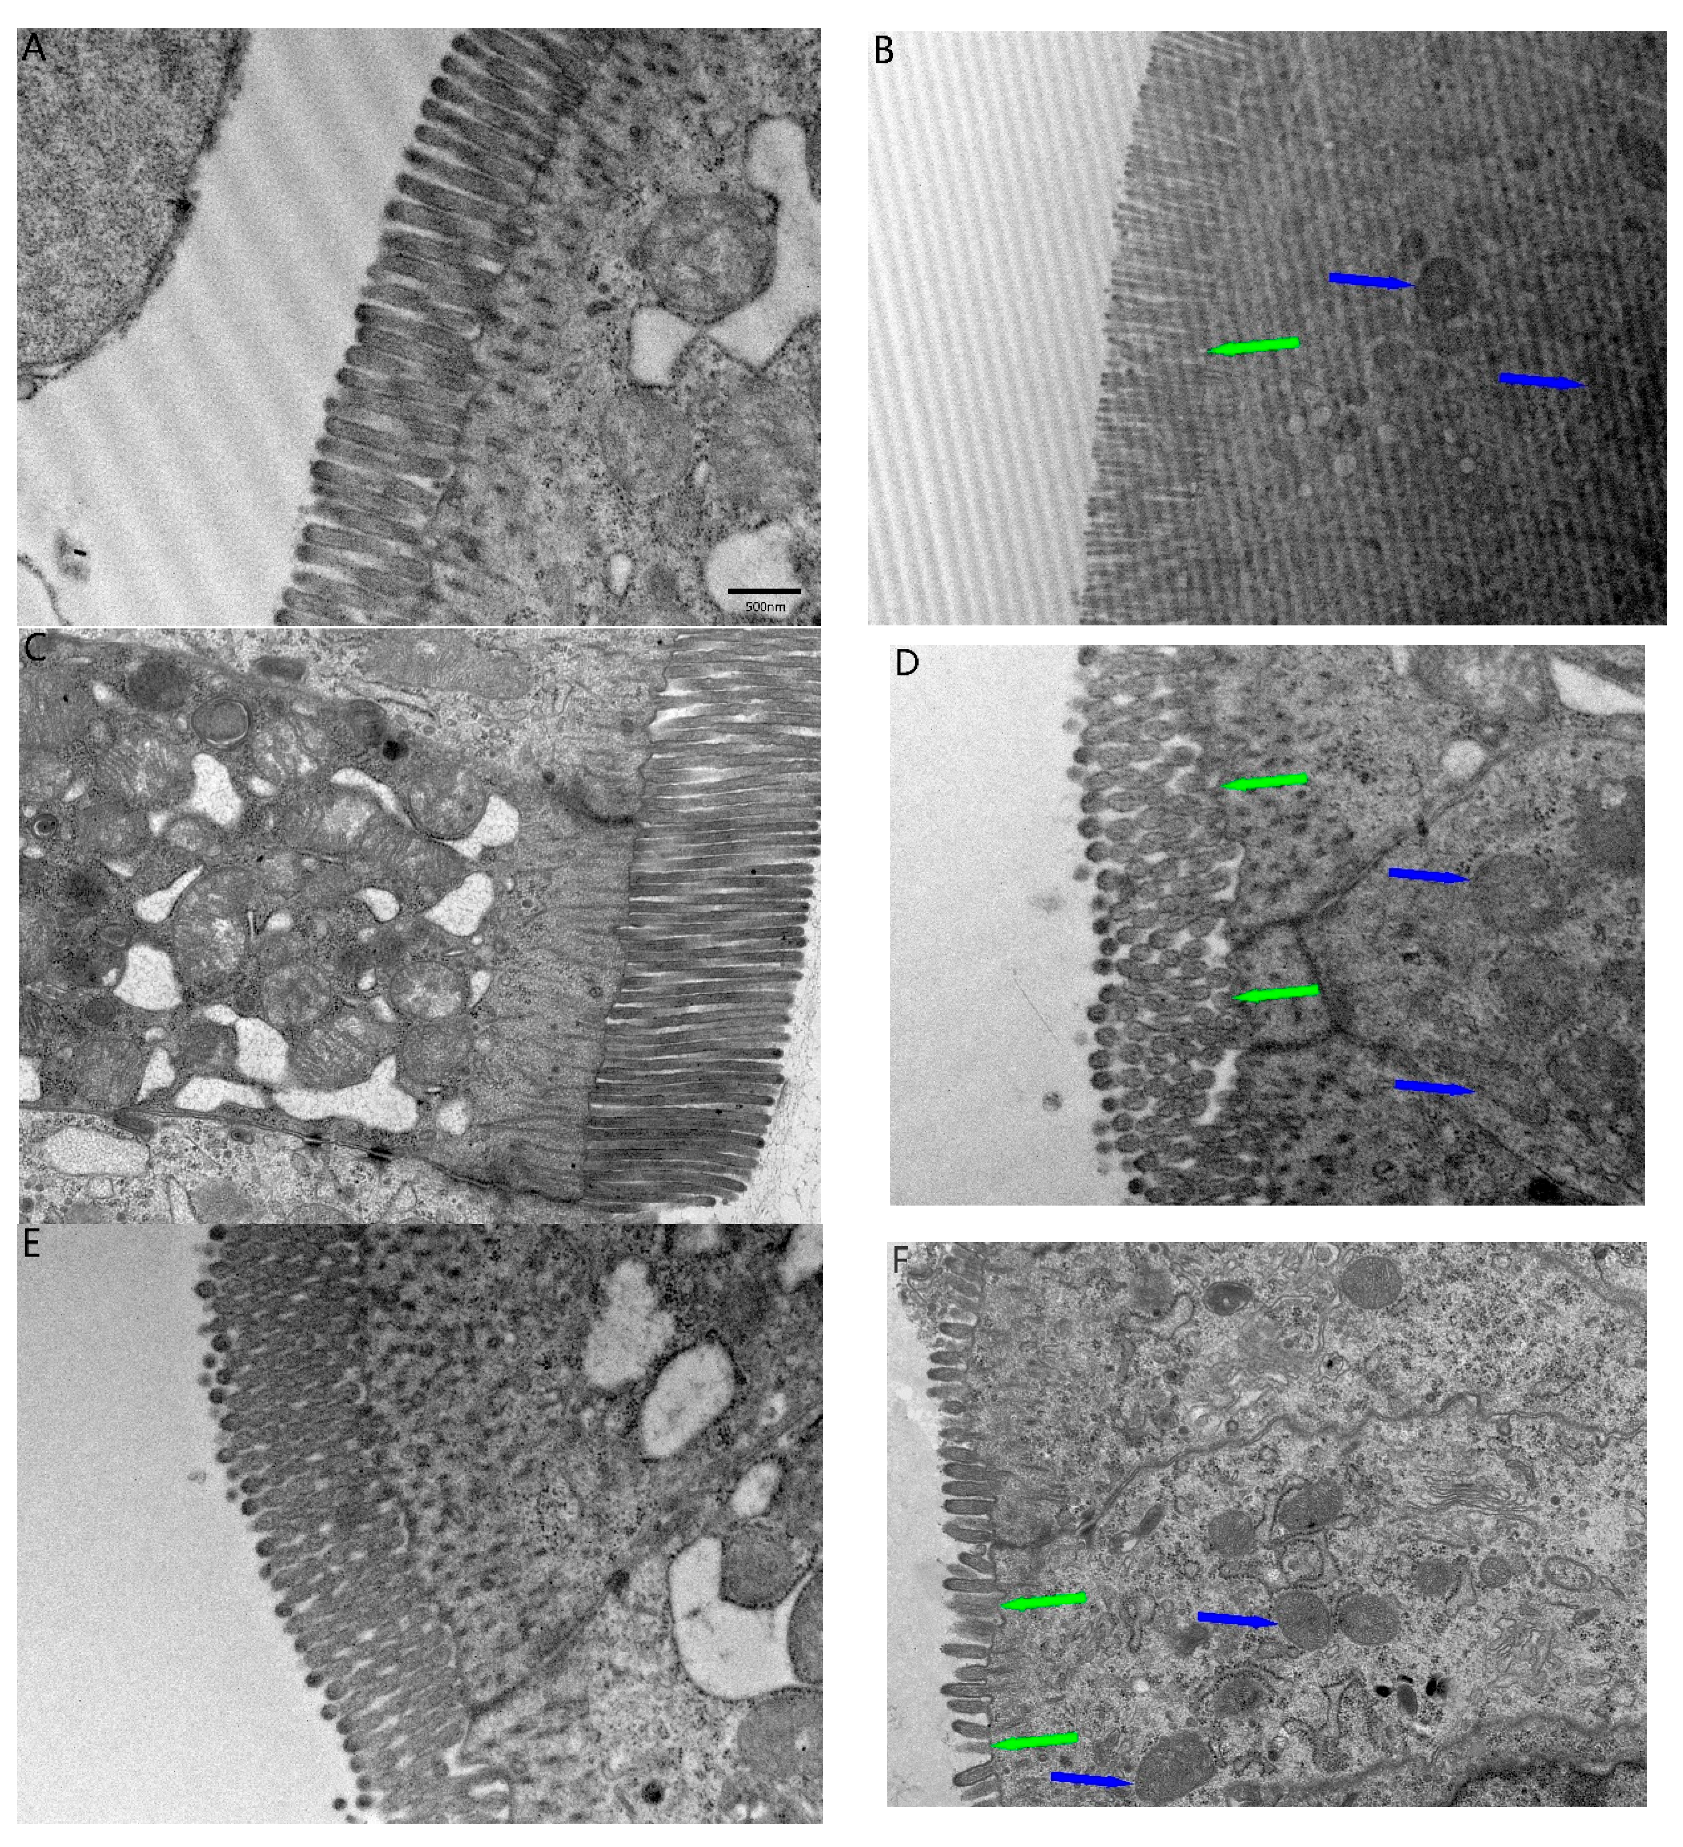
2.2. TEM Ultrastructural and Fibrous Changes in the Ileum

Relative to the control group, microvilli at the top of the basement membrane epithelial cells in the FB1 group sloughed off, with the effect increasing with an increase in days of exposure to FB1 (Figure 2B,D,E). The FB1 group also showed different degrees and numbers of mitochondrial swelling and inner ridge shortening (Figure 2B,D,E). This suggests that FB1 exposure induced ileum injury.

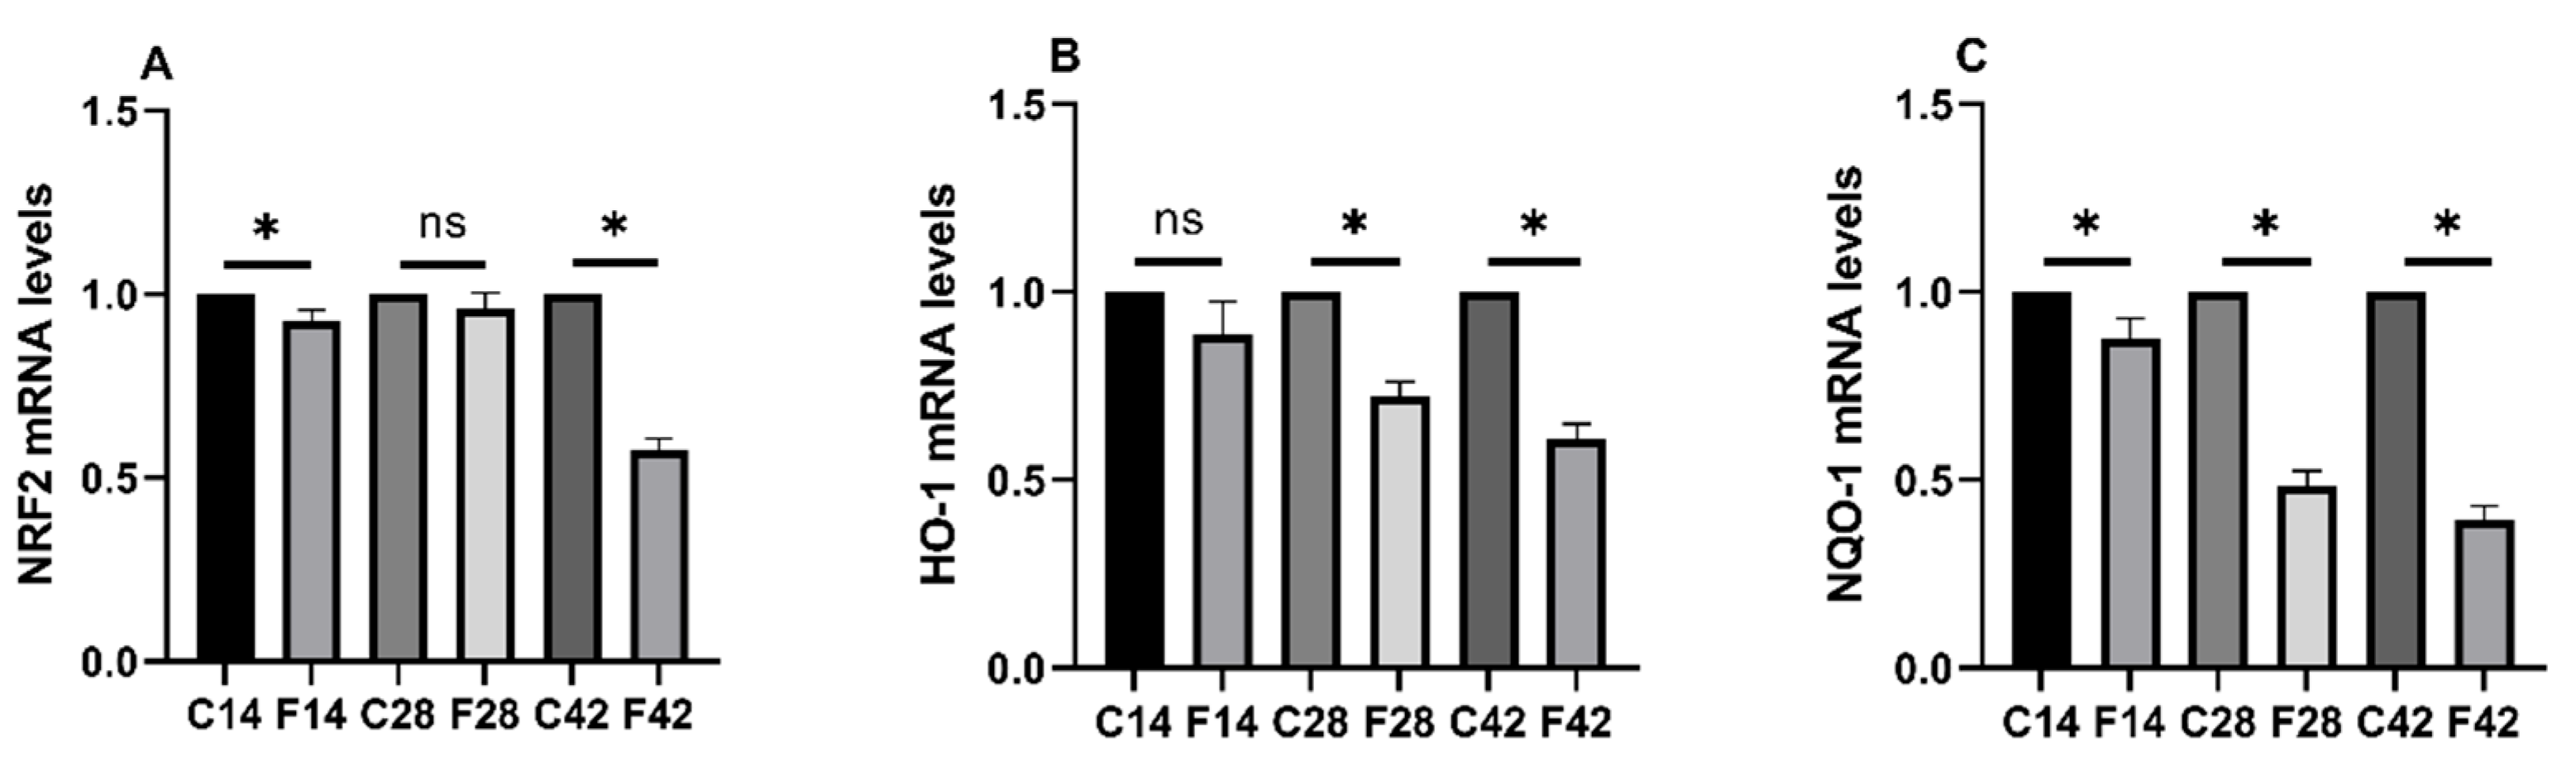
2.3. Functions of FB1 in Oxidative Stress-Associated mRNA Expression

Figure 3 showed that relative to the control group, the Nrf2 and NQO-1 mRNA expression of the 14d group apparently decreased (p > 0.05). The HO-1 and NQO-1 mRNA expression of the 28d group also apparently decreased; likewise, the Nrf2, HO-1, and NQO-1 mRNA expression of the 42d group also decreased (p < 0.05). The HO-1 mRNA expression of the 14d group and Nrf2 mRNA expression of the 28d group did not significantly change (p < 0.05). This suggests that exposure to FB1 induces oxidative stress in the quail intestine.

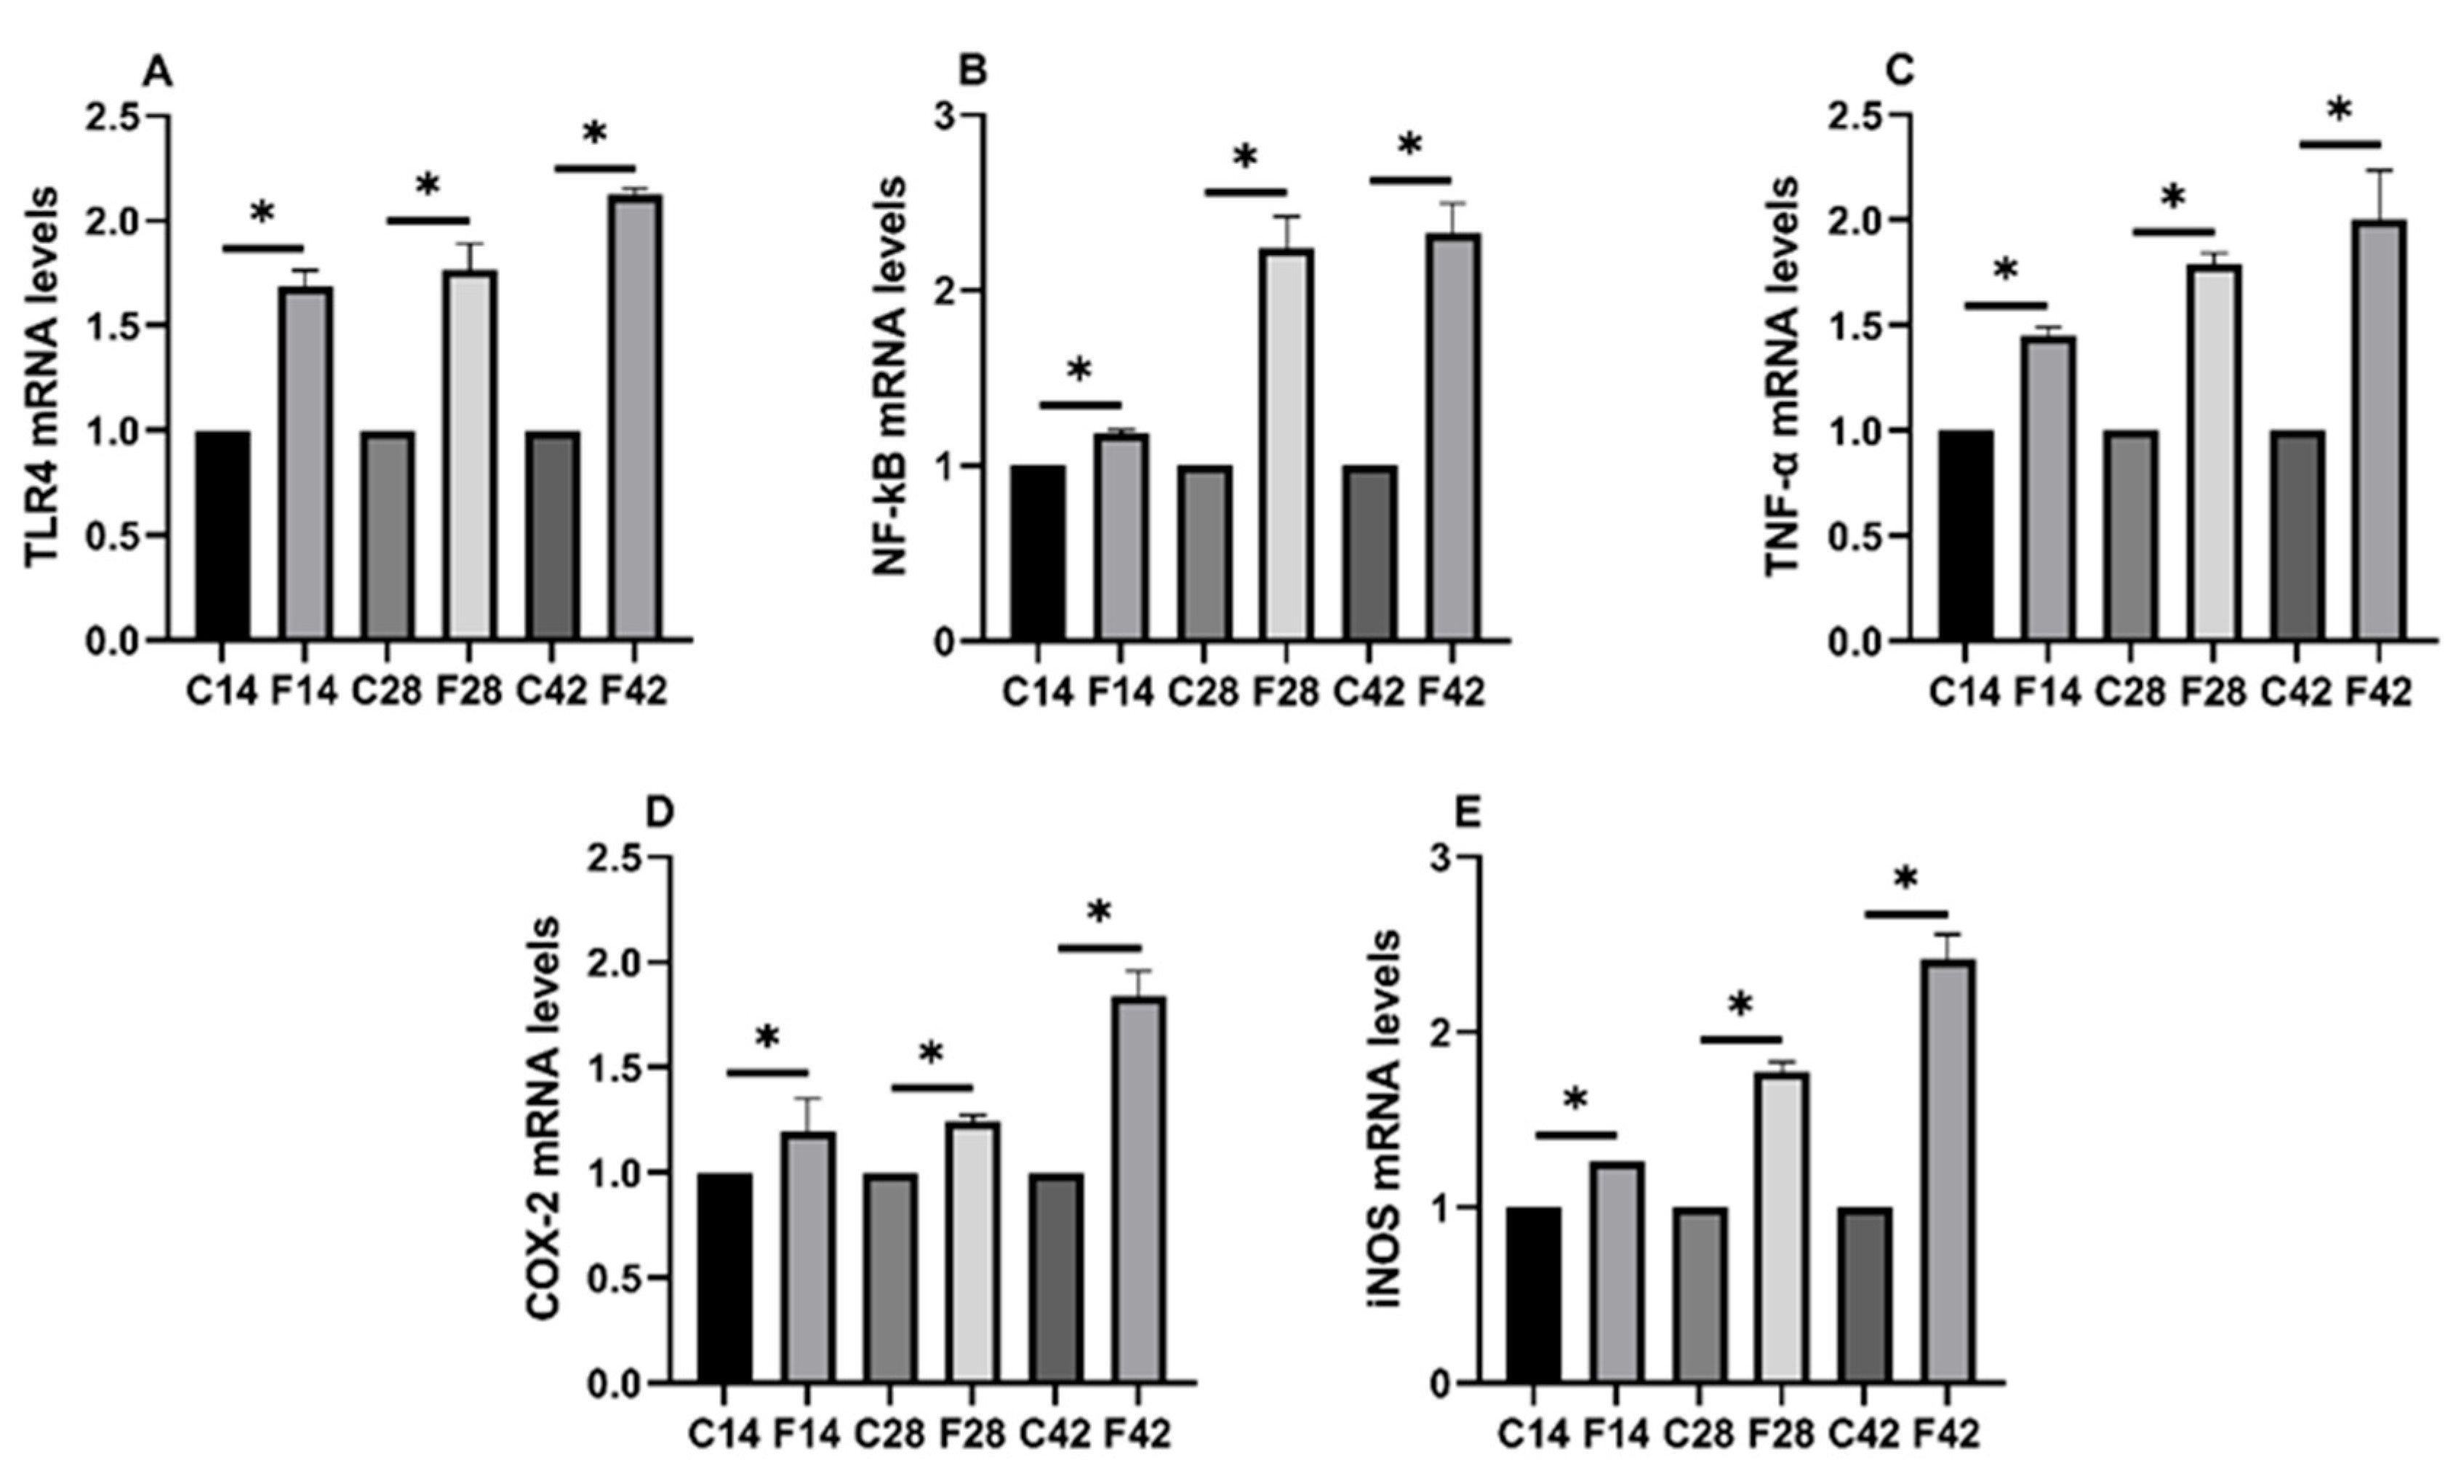
2.4. Functions of FB1 in Oxidative Stress and Inflammatory Signaling Pathways

According to Figure 4, the TLR4, NF-kB, TNF-α, COX-2, and iNOS mRNA expression of experimental groups markedly increased relative to the control group (p < 0.05), indicating FB1-induced intestinal inflammation in quail.

2.5. Functions of FB1 in Heterologous Nuclear Receptors mRNA Expression and Related Subunits

As shown in Figure 5, the AHR mRNA expression of the experimental group markedly increased relative to the control group (p < 0.05). The CYP1A5 and CYP1B1 mRNA expression of the experimental group remarkably increased relative to the control group (p < 0.05), and the CYP1A1 mRNA level evidently decreased. CYP1A4 mRNA expression was not markedly changed in the 14d and 28d groups, but in the 42d group, expression apparently decreased (p < 0.05).
From Figure 6, CAR and PXR, as well as the CYP3A4 and CYP3A9 mRNA levels of the experimental group, were significantly up-regulated relative to the control group (p < 0.05). The CYP2C18 mRNA expression of the 14d group markedly increased relative to the control group (p < 0.05), but no significant change was seen in the 28d group, while it dramatically decreased in the 42d group (p < 0.05).

3. Discussion

Oxidative stress indicates the imbalance between free radical production and antioxidant synthesis [14] (pp. 585−607). Studies have demonstrated FB1 toxicity, oxidative stress, and injury to the vital organs of broilers [12]. Similarly, oxidative stress is associated with a dysfunction of the intestinal barrier and a variety of digestive tract disorders. Its negative impacts on intestinal morphology usually occur together with decreased tight junction protein levels [15]. Similar to our results, FB1 exposure-induced oxidative stress was also found in chickens and mice in experiments by Devriendt et al. [11] (2009) and Frisvad et al. (2018). [2] (pp. 9481–9515) In quail, some redox genes also showed stronger species specificity.
Drawing from existing literature, we deduced that FB1 exposure in quail likely reduces the expression of genes related to intestinal oxidative stress. Nrf2 is a transcription factor essential for activating antioxidant defense mechanisms and maintaining redox homeostasis. When downregulated, as observed in our study, antioxidant responses may be impaired, contributing to oxidative damage. Our findings indicate a significant downregulation of Nrf2 along with its target gene products HO-1 and NQO1, particularly in the 42-day exposure group. This implies that FB1 may perturb redox equilibrium, leading to intestinal oxidative stress by inhibiting the Nrf2 pathway, a mechanism consistent with prior research.
FB1 is known to impact the CYP450 enzyme system in animals, leading to various damages [16,17,18] (pp. 47−53; pp. 50−55; pp. 185−194; pp. 104−111). Our study aimed to clarify how FB1 affects the intestinal CYP450 system in quail. Nuclear receptors (NXRs), including AHR, PXR, and CAR, are known to regulate the CYP enzyme system, which is integral to several metabolic pathways [19]. The CYP450 enzymes, key players in phase-I metabolism, are categorized based on their roles in endogenous substance metabolism and biosynthesis, with CYP1-CYP4 families being activated by heterologous substances through NXR-dependent mechanisms. AHR, upon activation by ligands such as polycyclic aromatic hydrocarbons and certain clinical agents, enters the nucleus and binds to the Xenobiotic response element (XRE), inducing CYP1A1, CYP1A4, CYP1A5, and CYP1B1 expression [20] (pp. 38−54). PXR and CAR also regulate CYP3 and CYP2 subunits upon activation by their respective ligands [21] (pp. 326−333). Our examination of genes related to the CYP450 enzyme lineage, in conjunction with our prior research on NXRs, revealed that FB1 significantly affected CYP450 enzyme mRNA levels in quail intestine. This impact was associated with the activity of the NXRs AHR, CAR, and PXR, aligning with existing studies.
Inflammation in the intestine often involves Toll-like receptors (TLRs), which are targeted by regulatory mechanisms to control inflammation [22] (pp. 972-978). Activation of TLR4, a complex process, triggers the transcription of inflammatory genes and is regulated by pathways including JNK, MAPK, and NFĸB [23] (pp. 725−733). Our study of gene expression related to FB1 revealed a significant upregulation of TLR4 and inflammatory factors like NF-kB, TNF-, COX-2, and iNOS in experimental groups, with increased expression with longer exposure times. This indicates that FB1 may induce intestinal inflammation via the TLR4 pathway and other inflammatory mediators.
Given the intestinal inflammation caused by FB1 exposure in quail, we investigated the presence of pathological and ultramicroscopic damage in intestinal tissues using light and electron microscopy. The intestinal wall consists of four layers: mucosa, submucosa, muscularis, and serosa. The mucosa, critical for absorption, immunity, and barrier function, is divided into the epithelial and intrinsic layers and contains various cell types, including goblet, columnar, immune, endocrine, and stem cells, which form the intestinal glands. The muscularis, with its two smooth muscle layers, aids gland secretion. The villus length to gland depth ratio (V:C) indicates the small intestine’s digestive and absorptive capacity; a decrease suggests mucosal damage and reduced function due to FB1 exposure. The control group’s ileum showed a complete gland structure with orderly epithelial cells and well-developed villi. In contrast, the experimental group exhibited disordered epithelial cells, incomplete glands, and signs of necrosis and inflammation. The 28-day group displayed heightened villus hyperplasia and inflammation, while the 42-day group showed sparser villi with necrosis and inflammatory cell infiltration. These findings indicate that FB1 induces pathological damage in quail intestines, with severity increasing with exposure duration.

4. Conclusions

Collectively, this work demonstrates the functions of FB1 in the intestines of quails, including oxidative stress, the activation of NXRs and the CYP450 enzyme lineage, as well as inflammation and histopathological changes in Figure 7. Results showed that FB1 enters the quail and causes pathological damage to the intestinal tract, and the damage becomes more severe over time. These results suggest that FB1-induced enterotoxicity in quails involves the disruption of antioxidant defenses (via Nrf2 pathway inhibition), activation of nuclear receptors (AHR, PXR, CAR), and induction of intestinal inflammation (via TLR4-NFκB pathway), with severity increasing over time. Future research should focus on understanding the functions of FB1 in mucosal barrier function at a molecular level.

5. Materials and Methods

5.1. Animals and Treatments

The Animal Protection and Ethics Committee of Foshan University approved the experimental protocols. A total of 120 healthy, 1-day-old quail chicks were obtained from a commercial hatchery and raised under controlled conditions. Altogether 120 normal 1-day-old quails were obtained from hatching eggs bought from a hatchery farm and placed under the constant environment (original temperature at 36 ± 1 °C, later decreased as the days increased, and maintained at 29 ± 1 °C following 14 days; humidity 50 ± 15%; 12-h/12-h light/dark cycle). FB1 was purchased from Shanghai Yuanye Biotechnology Co., Ltd. (Shanghai, China) (purity ≥ 98%). The FB1 diet (30 mg/kg) was prepared by Guangdong Laboratory Animal Center (Feed information provided in the Supplementary material). After seven days of acclimation, they were randomized into two groups, as follows: control, which received uncontaminated feed, and FB1, which received feed contaminated with 30 mg/kg FB1. On days 14, 28, and 42, quail were anesthetized, blood samples were obtained using a needle, and thereafter, the animals were humanely euthanized. After opening the abdominal cavity, the intestines were carefully dissected and cleaned with a pre-chilled saline solution, and then the small intestine was removed and placed in an EP tube, followed by immediate freezing with liquid nitrogen prior to subsequent analyses. Experimental datasets were classified as follows, 14d control group (C14, n = 20); Group 14d FB1 (F14, n = 20); 28d control group (C28, n = 20); 28d FB1 exposure group (F28, n = 20); Control group at 42 days (C42, n = 20); FB1 exposure group at 42 days (42 F, n = 20).

5.2. Light Microscope Examination

For microscopic observation, ileal tissue samples were subjected to fixation with 10% formalin solution, paraffin embedding, and cutting into 5 μm sections. Two sections were taken from each group of ileal tissues. After hematoxylin and eosin (H&E) staining, the pathological sections prepared were monitored with the microscope (China, mshot, ML31). The length V (villus height, V) of each villus and crypt depth C (Crypt depth, C) of each intestinal gland were measured digitally at 200× magnification, and the V:C ratio was calculated. In addition, the numbers of goblet cells, neutrophils, and lymphocytes were calculated from 3 visual fields at 400× magnification.

5.3. Transmission Electron Microscope Examination

Intestinal tissues (about 1 mm3 each) were quickly subjected to 3-h fixation using 2.5% glutaraldehyde contained within 0.1 M sodium phosphate buffer (pH 7.2), cleaning at 4 °C, then an additional 1-h fixation using 1% osmium tetroxide contained within sodium phosphate buffer. After dehydration for 10 min through 50% ethanol grading steps, with two changes of propylene oxide, the tissue was treated through aragonite embedding, then magnesium uranyl acetate and lead citrate were added to stain ultrathin sections, followed by observation by transmission electron microscopy (TEM, HITACHI HT7700 80 kv, USA).

5.4. Real-Time Fluorescence Quantitative PCR Assay

Through adopting TransZol Up Plus RNA Kit ®(TransGen Biotech, China), total RNA extraction (1) grinding tissue samples in liquid nitrogen; (2) adding TransZol Up Plus reagent; (3) centrifuging to separate RNA; (4) washing with 75% ethanol; (5) dissolving in water free of RNase. Total RNA was later subjected to resuspension in 30 μL RNase-free water. RNA content and quality were analyzed by spectrophotometry at 260/280 nm. Moreover, first-strand cDNA was synthesized based on total RNA with a reverse transcription kit® preserved at −80 °C prior to subsequent analysis. Primers are shown in Table 1. The ABI 7500 system was used for qPCR analysis. The delta-delta Ct (2−∆∆Ct) approach was adopted to analyze the data (GraphPad Prism 8.0).

5.5. Statistical Analysis

The functions of different treatments in the ileal enterotoxicity rate among FB1-exposed quails were statistically analyzed by GraphPad Prism 8.0 and Microsoft Excel. Results were represented by mean ± standard deviation (S.D.). T-test and Tukey’s post hoc test were used for comparisons, with * p < 0.05 indicating statistical significance relative to the control group.

Supplementary Materials

The following supporting information can be downloaded at: https://www.mdpi.com/article/10.3390/toxins17050239/s1, Table S1. The composition of the basic diet fed to quail was experimentally evaluated for optimal allicin supplementation; Table S2. Nutritional levels of the basal diet fed to quail in the FB1-allicin diet experiment.

Author Contributions

C.C. was responsible for administering the project, conceptualization, and writing—original draft. W.H. was in charge of resources. R.X. contributed to writing—reviewing and editing. C.C., Y.L. and W.H. were responsible for formal analysis and visualization. C.C. and R.X. took charge of the software and methodology. The authors worked together to complete the validation part. All authors have read and agreed to the published version of the manuscript.

Funding

The present study was funded by the National Key Research and Development Program of China (No. 2022YFE0139500).

Institutional Review Board Statement

The Institutional Animal Care and Use Ethics Committee of Foshan University (FOSU2022023) approved our experimental protocols and animal studies.

Informed Consent Statement

Not applicable.

Data Availability Statement

The original contributions presented in this study are included in the article/supplementary material. Further inquiries can be directed to the corresponding author.

Conflicts of Interest

The authors declare no conflict of interest. The funders had no role in the design of the study; in the collection, analyses, or interpretation of data; in the writing of the manuscript; or in the decision to publish the results.

References

  1. Li, T.; Jian, Q.; Chen, F.; Wang, Y.; Gong, L.; Duan, X.; Yang, B.; Jiang, Y. Influence of Butylated Hydroxyanisole on the Growth, Hyphal Morphology, and the Biosynthesis of Fumonisins in Fusarium proliferaturn. Front. Microbiol. 2016, 7, 1038. [Google Scholar]
  2. Frisvad, J.C.; Moller, L.L.H.; Larsen, T.O.; Kumar, R.; Arnau, J. Safety of the fungal workhorses of industrial biotechnology: Update on the mycotoxin and secondary metabolite potential of Aspergillus niger, Aspergillus oryzae, and Trichoderma reesei. Appl. Microbiol. Biotechnol. 2018, 102, 9481–9515. [Google Scholar] [CrossRef] [PubMed]
  3. Escriva, L.; Font, G.; Manyes, L. In vivo toxicity studies of fusarium mycotoxins in the last decade: A review. Food Chem. Toxicol. 2015, 78, 185–206. [Google Scholar] [CrossRef] [PubMed]
  4. Wang, W.C.; Zhai, S.S.; Xia, Y.Y.; Wang, H.; Ruan, D.; Zhou, T.; Zhu, Y.W.; Zhang, H.F.; Zhang, M.H.; Ye, H.; et al. Ochratoxin A induces liver inflammation: Involvement of intestinal microbiota. Microbiome 2019, 7, 151. [Google Scholar] [CrossRef]
  5. Proietti, M.; Perruzza, L.; Scribano, D.; Pellegrini, G.; D’Antuono, R.; Strati, F.; Raffaelli, M.; Gonzalez, S.F.; Thelen, M.; Hardt, W.D.; et al. ATP released by intestinal bacteria limits the generation of protective IgA against enteropathogens. Nat. Commun. 2019, 10, 250. [Google Scholar] [CrossRef]
  6. Worley, M.J. Immune evasion and persistence in enteric bacterial pathogens. Gut Microbes 2023, 15, 2163839. [Google Scholar] [CrossRef]
  7. Dong, P.; Zhang, Y.; Yan, D.Y.; Wang, Y.; Xu, X.; Zhao, Y.C.; Xiao, T.T. Protective Effects of Human Milk-Derived Exosomes on Intestinal Stem Cells Damaged by Oxidative Stress. Cell Transplant. 2020, 29, 963689720912690. [Google Scholar] [CrossRef]
  8. Kamle, M.; Mahato, D.K.; Devi, S.; Lee, K.E.; Kang, S.G.; Kumar, P. Fumonisins: Impact on Agriculture, Food, and Human Health and their Management Strategies. Toxins 2019, 11, 328. [Google Scholar] [CrossRef]
  9. Dopavogui, L.; Polizzi, A.; Fougerat, A.; Gourbeyre, P.; Terciolo, C.; Klement, W.; Pinton, P.; Laffite, J.; Cossalter, A.M.; Bailly, J.D.; et al. Tissular Genomic Responses to Oral FB1 Exposure in Pigs. Toxins 2022, 14, 83. [Google Scholar] [CrossRef]
  10. Chen, J.; Wen, J.; Tang, Y.; Shi, J.; Mu, G.; Yan, R.; Cai, J.; Long, M. Research Progress on Fumonisin B1 Contamination and Toxicity: A Review. Molecules 2021, 26, 5238. [Google Scholar] [CrossRef]
  11. Devriendt, B.; Gallois, M.; Verdonck, F.; Wache, Y.; Bimczok, D.; Oswald, I.P.; Goddeeris, B.M.; Cox, E. The food contaminant fumonisin B-1 reduces the maturation of porcine CD11R1(+) intestinal antigen presenting cells and antigen-specific immune responses, leading to a prolonged intestinal ETEC infection. Vet. Res. 2009, 40, 40. [Google Scholar] [CrossRef] [PubMed]
  12. Deepthi, B.V.; Somashekaraiah, R.; Poornachandra Rao, K.; Deepa, N.; Dharanesha, N.K.; Girish, K.S.; Sreenivasa, M.Y. Lactobacillus plantarum MYS6 Ameliorates Fumonisin B1-Induced Hepatorenal Damage in Broilers. Front. Microbiol. 2017, 8, 2317. [Google Scholar] [CrossRef]
  13. Zou, Y.; Du, X.; Zheng, X.; Mao, S.; Xu, X.; Zhang, S.; Chen, X. Fumonisin B1 induces oxidative stress, inflammation and necroptosis in IPEC-J2 cells. Vet. Res. Commun. 2025, 49, 161. [Google Scholar] [CrossRef]
  14. Tan, Y.; Zhang, Z.G.; Zheng, C.; Wintergerst, K.A.; Keller, B.B.; Cai, L. Mechanisms of diabetic cardiomyopathy and potential therapeutic strategies: Preclinical and clinical evidence. Nat. Rev. Cardiol. 2020, 17, 585–607. [Google Scholar] [CrossRef] [PubMed]
  15. Chen, F.M.; Wang, H.J.; Chen, J.Y.; Liu, Y.; Wen, W.; Li, Y.H.; Huang, X.G. Lactobacillus delbrueckii Ameliorates Intestinal Integrity and Antioxidant Ability in Weaned Piglets after a Lipopolysaccharide Challenge. Oxidative Med. Cell. Longev. 2020, 2020, 6028606. [Google Scholar] [CrossRef]
  16. Albonico, M.; Schatz, L.F.; Caloni, F.; Cortinovis, C.; Spicer, L.J. Toxicological effects of fumonisin B-1 alone and in combination with other fusariotoxins on bovine granulosa cells. Toxicon 2016, 118, 47–53. [Google Scholar] [CrossRef]
  17. Chuturgoon, A.A.; Phulukdaree, A.; Moodley, D. Fumonisin B-1 modulates expression of human cytochrome P450 1b1 in human hepatoma (Hepg2) cells by repressing Mir-27b. Toxicol. Lett. 2014, 227, 50–55. [Google Scholar] [CrossRef] [PubMed]
  18. MartinezLarranaga, M.R.; Anadon, A.; Diaz, M.J.; Fernandez, R.; Sevil, B.; FernandezCruz, M.L.; Fernandez, M.C.; Martinez, M.A.; Anton, R. Induction of cytochrome P4501A1 and P4504A1 activities and peroxisomal proliferation by fumonisin B-1. Toxicol. Appl. Pharmacol. 1996, 141, 185–194. [Google Scholar] [CrossRef]
  19. Mary, V.S.; Valdehita, A.; Navas, J.M.; Rubinstein, H.R.; Fernandez-Cruz, M.L. Effects of aflatoxin B-1, fumonisin B-1 and their mixture on the aryl hydrocarbon receptor and cytochrome P450 1A induction. Food Chem. Toxicol. 2015, 75, 104–111. [Google Scholar] [CrossRef]
  20. Manikandan, P.; Nagini, S. Cytochrome P450 Structure, Function and Clinical Significance: A Review. Curr. Drug Targets 2018, 19, 38–54. [Google Scholar] [CrossRef]
  21. Elshenawy, O.H.; Anwar-Mohamed, A.; Abdelhamid, G.; El-Kadi, A.O.S. Murine atrial HL-1 cell line is a reliable model to study drug metabolizing enzymes in the heart. Vasc. Pharmacol. 2013, 58, 326–333. [Google Scholar] [CrossRef] [PubMed]
  22. Foster, S.L.; Hargreaves, D.C.; Medzhitov, R. Gene-specific control of inflammation by TLR-induced chromatin modifications. Nature 2007, 447, 972–978. [Google Scholar] [CrossRef] [PubMed]
  23. Lager, S.; Gaccioli, F.; Ramirez, V.I.; Jones, H.N.; Jansson, T.; Powell, T.L. Oleic acid stimulates system A amino acid transport in primary human trophoblast cells mediated by toll-like receptor 4. J. Lipid Res. 2013, 54, 725–733. [Google Scholar] [CrossRef] [PubMed]
Figure 1. Pathological section observation results of quail ileum with HE staining. (AF) HE staining pathological section (200×); Notes: red arrow indicates villous epithelial cell proliferation or villous shedding, black arrow indicates inflammatory cells, green box indicates necrotic intestinal gland; (G) Villus length V; (H) Intestinal gland depth C; (I) V:C; (J) The number of goblet cells; (K) Neutrophil count; (L) Number of lymphocytes. “*” indicates a significant difference between the experimental group and the control group, while “ns” indicates no statistical significance.
Toxins 17 00239 g001aToxins 17 00239 g001b
Figure 2. TEM observation of the ileum of quail exposed to FB1; Notes: Microvilli (green arrow) and mitochondria (blue arrow) were significantly negatively affected. (A) C14; (B) F14; (C) C28; (D) F28; (E) C42; (F) F42.
Toxins 17 00239 g002
Figure 3. Ileum oxidative stress-related cytokine mRNA expression test results. (A) Nrf2; (B) HO-1; (C) NQO-1. Notes: “*” indicates a significant difference between the experimental group and the control group, while “ns” indicates no statistical significance.
Toxins 17 00239 g003
Figure 4. Inflammation-related cytokine mRNA expression levels in the ileum of quail exposed to FB1. (A) TLR4; (B) NF-kB; (C) TNF-α; (D) COX-2; (E) iNOS. Note: “*” indicates a significant difference between the experimental group and the control group.
Toxins 17 00239 g004
Figure 5. AHR and AHR-related CYP1 subunit mRNA expression test results. (A) AHR; (B) CYP1A1; (C) CYP1A4; (D) CYP1A5; (E) CYP1B1. Notes: “*” indicates a significant difference between the experimental group and the control group, while “ns” indicates no statistical significance.
Toxins 17 00239 g005
Figure 6. The mRNA expression assay results of CAR, PXR, and CAR, PXR-related CYP2 subunit, and CYP3 subunit within quail intestine after FB1 exposure. (A) CAR; (B) PXR; (C) CYP2C18; (D) CYP3A4; (E) CYP3A9. Notes: “*” indicates a significant difference between the experimental group and the control group, while “ns” indicates no statistical significance.
Toxins 17 00239 g006
Figure 7. The pathway of FB1 in quail intestine and the resultant intestinal injury.
Toxins 17 00239 g007
Table 1. Primer sequences in qRT-PCR.
GeneForward Primer (5′ to 3′)Reverse Primer (5′ to 3′)
TLR4CATCCCAACCCAACCACAGTAGCATGAGCAGCACCAACGAGTAGTATAGC
NF-κBAGCAGAACTGAGAATTTGCCCTGAACACTATTGCGACCTG
TNF-αGTGTTCTATGACCGCCCAGTTGTTCCACGTCTTTCAGAGC
COX-2CCTATTACACAAGAAGCCTTCCACCAATCGCAGCAAGAATTTCTCCACAATCA
iNOSTGTTATTAAGAACCAGCCCTCCATCGGTATCTGCTTCTTGCT
Nrf2CTCGCTCCAGTCCCGCTCGTAGTGACTTCCCAGCCCTTGTCC
HO-1ATGGAAACTTCGCAGCCACACCGTGACCAGCTTGAACTCGT
NQO-1TATGAGATGGAGACGGCGCAGAAAACGCGGTCAAACCAGC
JNK3GCGAATGTCCTACCTGCTGTATCAACGAGTCACTACATAAGGCGTCATCAT
AHRTTCAGGAAAGCAGAACAGCAATCACAACTAATACGAAGCCAT
CYP1A1TTGCGTGTTTATCAACCAGTCTTTGTTCACTTCGGTCCCTT
CYP1A4ATGCTCGTTTCAGTGCCTTCGTGTGTCAAAGCCTGCCCCAA
CYP1A5CTATGACAAGAACAGCATCCGAGACTCCCCAAAGATGTCATTCACC
CARACTTCACCTGCCCCTTTGCCCCTTCCTCATCCCCACGTCCA
PXRCCCTCAAGAGCTACATCGACCATGTTCTCCATCTTCAGCGTCT
CYP2C18AACCTCCATACGAAGCTGCAATGTGCCTTTGAAGACTTTCTCA
CYP3A4TCATAGTGTTGTTCCCCTTGGTATCCTTCTTCCCGTTC
CYP3A9ATGCTCGTTTCAGTGCCTTCGTGTGTCAAAGCCTGCCCCAA
Disclaimer/Publisher’s Note: The statements, opinions and data contained in all publications are solely those of the individual author(s) and contributor(s) and not of MDPI and/or the editor(s). MDPI and/or the editor(s) disclaim responsibility for any injury to people or property resulting from any ideas, methods, instructions or products referred to in the content.

