2.1. Ear Rot Data Visual Scores
The artificial inoculation data for the maize hybrids (
Table 1) show large differences between pathogen species, but the mean aggressiveness levels are close for the three isolates of the same species. The highest stability (lowest variance) against all toxigenic species and their isolates was found in Cadixxio Duo. The P9415 showed only a slightly worse performance. In spite of the close genotype means, Fg3 presented a threefold higher number than Fg4, and the opposite situation was observed for SY Zephyr, which produced double the infection severity of Fg3. Fornad, however, presented the same numbers. Such inconsequent behavior was also found for
Aspergillus in Cadixxio Duo and Korimbos. This means that one set of data for one isolate for two years may not fit with the genetic background, and false positive and negative results may occur, indicating problems in evaluating resistance level for resistance or QTL mapping tests in which different QTLs might be identified for different isolates. The correlations (
Table 1) show significant relations between responses in Fg3/Fg4 and Fg4/Fg6, but the correlation for Fg3/Fg6 is not significant. The situation is similar for
F. verticillioides. Here, Fv1/Fv5 was not significant. The responses to the other two isolates show more similar data, and these correlations are significant. For the least aggressive,
A. flavus, no significant correlation between responses to different isolates was found. We think, therefore, that a higher number of isolates leads to more reliable results for resistance levels than for any isolate alone. Regarding the correlations between isolates of the three toxigenic species, out of the 36 correlations, only 4 were significant: Fg6/Fv5 and Fg6/Fv8. No significant correlations were found between the control ear rot and artificial inoculation data.
The ANOVA table (
Table 1) shows significant main effects, except for isolates. Their sums were nearly the same, so a significant influence was not probable. The genotype differences across the three species and control were significant., so the artificial inoculation significantly increased the disease severity compared to the natural infection. The two years showed different disease severities.
F. graminearum had a much higher aggressiveness than
F. verticillioides, and
A. flavus was significantly less aggressive than
F. verticillioides. This confirmed the earlier findings. Of the two-way interactions, those including the isolating effect were not significant, but the others showed different responses in different years. The three toxigenic species reacted differently between the two years (AxB), and their infection severity also differed between the two years (BxD). At the same time, the hybrid ranking was also different for the different toxigenic species (AxD). Also, the ANOVA supported the significant interaction between fungal species, so we had to analyze the data separately according to toxigenic species.
The
F. graminearum data (
Table 2) show fourfold significant genotype differences. According to the means, the differences between genotypes are more than fourfold. The variance shows the stability of performance. Cadixxio Duo shows very low infection severities in all situations, and it has the lowest variance, i.e., the highest stability. The second P9415 also results in low numbers for infection severity; its stability is slightly weaker. We observed high stability for Fornad at a significantly higher susceptibility level, indicating a stable higher-than-medium infection severity every year. Korimbos was used as the resistant control, as was the case in the last nine years, and this year, it had a medium performance. In two cases, however, it behaved as highly susceptible. Therefore, its adaptation ability is problematic. In terms of adaptation, P0725 was the weakest; thus, it has the highest variance and highest instability in response. The susceptible control DK4541 was the most susceptible, but it was more stable than the less susceptible, and it was badly adapting P0725. The maximum and minimum stability differed 15fold. The variety differences are highly significant (
Table 2), but the column means they do not show significant differences, and the interaction between genotypes and year/isolate effect is not significant again, showing rather good stability in responses. The inconsequent correlations (
Table 2) are due to the mixture of unstable and stable performance (adaptation) hybrid responses to the isolates themselves. The correlations are seldom significant (3 out of 15). In three cases out of six, the individual isolates correlate significantly with the mean. With a larger database, the rate of significant correlations would probably increase as the limit for correlation decreased. This is one reason why we should have as large a database as possible.
The
F. verticillioides ear rot data (
Table 3) also show significant genotype differences. Sy Zephyr had the lowest infection severity and the highest stability. Five of our other hybrids did not differ significantly from Sy Zephyr. The infection severity was significantly lower in 2021 than in 2022. The differences between isolates were also significant. The variety ranks were not the same; in all cases, we observed variations, from no difference to double difference. Four hybrids had a higher infection rate, and the instability of responses was high. Among the medium- or high-infected hybrids, no one had good stability; this differed from the finding found in
F. graminearum. The difference between the stability of the most stable hybrid and the least stable hybrid was 50-fold. The year/severity interaction might be different for the different pathogens (
Table 3). The correlations between the responses to the six epidemic situations were mostly not significant (
Table 3). In 2021, only the F5/F8 correlation was significant and non-correlated with the means. In 2022, the correlations were closer, and the relations with the mean became highly significant for the same isolates.
Aspergillus flavus shows a similar pattern (
Table 4); 2021 was not an
Aspergillus year, but 2022 had the highest numbers compared to the data for the preceding years [
10]. The highest mean for the most susceptible hybrid was close to one percent of ear coverage. The lowest was 0.2, meaning that a fivefold difference was recognized with significance at
p = 0.05. Four genotypes had a variance lower than half the experimental mean (bold print), accompanied by a low infection severity across all epidemic situations. For stability (variance), the difference between the maximum and minimum hybrid values was 26-fold. As the isolates for the two years were the same, the highly different infection levels cannot be explained by genetic differences between the isolates of pathogens used. This is due to the ecological sensitivity of
A. flavus disease development. In spite of this, the hybrid differences were significant, but the genotype/isolate x year interaction was significant, indicating different rankings in the years and isolates (
Table 4). When we examine the correlations between the six AER datasets, in most cases, the data for the same isolates for the two years do not correlate (
Table 4). However, in three cases, the data correlate significantly with the means of the six columns.
The general means for the three toxigenic species, together with the controls (
Table 5), show the ranking and resistance risk classification of the hybrids. The hybrids are ranked according to the mean reaction. As resistance is mostly not connected, and the correlations also show this clearly (
Table 5), independent ANOVAs were conducted for each toxigenic fungus. This type of general analysis is not without value, as it helps identify hybrids with low infection values and good resistance to all toxigenic fungi. This is shown by the LSD 5% value for the means; the individual LSD 5% values, are at the column means. This analysis was also necessary because the mean pathogenicity of the toxigenic fungi largely differed. Therefore, the ranking will be determined by the most aggressive species (
F. graminearum).
We have three hybrids that fall into the low and low-to-medium classes, shown with dark- and light-green highlighting and their names printed in bold. Fornad raises a question: for
F. graminearum, the infection severity is above average, but for the others, it is in the best category. The resistant control is Korimbos, based on its behavior over the past six years, was good for
F. graminearum and
F. verticillioides, much less for
A. flavus, and its high natural infection is also a risk factor. The correlations among levels of resistance to the different toxigenic fungi are not significant. The main reason for this is due to the different resistance backgrounds in most hybrids. The resistance to different fungal species is mostly not connected, and the correlations show this clearly (
Table 5). Therefore, independent ANOVAs were conducted for each toxigenic fungus. The LSD 5% values are shown in each column. The most aggressive species,
F. graminearum, determines the means; therefore, the less aggressive toxigenic cannot provide significant differences, even if we have them.
We have three hybrids that are in the low and low to medium class with dark and light green highlighting; their names are printed in bold. Fornad is a question. For F. graminearum, its infection severity is above average. However, this is for the others in the best category. Here, the toxin contamination will be decided. The resistant control Korimbos behaved mostly, so in the past six years, it has had good resistance to the two Fusarium spp. But not to Aspergillus ear rot. The not-treated control had higher infection than we would prefer. P9978 is an exception. It has only yellow ranking across data, and the last three hybrids show a mixed ranking for the different toxigenic fungi.
The natural infection severities (which appeared to be independent of the directly toothpick-infected area) of
Fusarium and
Aspergillus showed very similar results to the control. The column means for the control were between 0.26 and 0.29 ear rot %. For the artificially inoculated versions of the three toxigenic species, the means varied between 0.18 and 0.40 (
Table 6); only one column showed a significant difference from the control mean (0.275) for Asp. 3. Fg3 differed significantly from Fg4. There were four hybrids with low infection severity and low variance, which are valuable traits for the future (bold printed), and P9405 is probably connected to this group. The variance is generally very similar, except for P9978. This means that in these years, the background infection was very similar to that in the control. So, the independent infection beyond the toothpick-inoculated area was not significant. All species showed significant variety differences. ANOVA was performed for all toxigenic species separately. Here, only the LSD 5% data are given. This means that the column data are in the same range without significant differences. Among the correlations (
Table 6), a larger number are significant. Out of 55 cases, 18 correlations are highly significant. This also shows how unreliable it is to determine resistance based on the natural infection (
Table 7).
The natural ear rot infection, according to toxigenic spp. shows sixfold significant differences (
Table 7). The stability ranges between 0 and 0.02 for the hybrids, showing rather uniform performances, much better than the individual isolates, as shown in
Table 6. The additional natural infection of the inoculated ears was also on the same level as the artificially inoculated ears, not only at the isolate level but also at the species level. The variance, except for Korimbos, was very high, except for one, where the natural infection showed good agreement. The correlations between the
Fusarium spp. inoculated, and the control was very high, but the natural infection in the
Aspergillus-inoculated ears presented no significant correlation with any other toxigenic species. (
Table 7). This means that, in this case, the artificially inoculated ears did not amass more infection than the naturally infected control ears. This means that no antagonistic responses between species and their isolates could be detected. Of course, this does not mean that the toxin data would behave the same way.
The natural
Aspergillus ear rots on the check, and the artificially inoculated ears (
Table 8) present significant genotype differences with threefold differences. The control had 0.13% severity, the
F. graminearum and
F. verticillioides ears somewhat more (without significance). However, the
Aspergillus infection on the
Aspergillus artificially infected ears was three-fold larger than we had in the control. The reason is not known, but the seemingly independent infections might not be fully independent of the artificial inoculation as was found in
Fusarium. This will require further research to find an answer. Having the toxin data, we might have more support for a possible explanation.
2.2. Toxin Contamination
The presentation of mean toxin data across years (
Table 9) shows the artificial and natural contamination data together. As the weather conditions were different, Table 15 also shows the yearly data in detail.
When we compare the hybrid performance of the three isolates in response to the same toxin (
Table 9, for
F. graminearum, five hybrids gave similar responses to the three isolates, five contradicted. In
F. verticillioides, 4 hybrids were stable; six gave different values. For
Aspergillus, two were stable, and 8 not. The phenomenon is the same as that found for ear rots; the hybrids often provide contradictory results to the different isolates of the same toxigenic species we have found for the ear rot data. The hybrids showed fourfold differences across all data; P9415 showed the lowest mean and the lowest variance, e.g., the highest stability. Except for one fumonisin data, the others were good or acceptable. DKC 4541 and Cadixxio Duo had mostly good data; in many cases, the diversity within species was considerable. For the other hybrids, especially the aflatoxin data, it caused mostly anxiety, but in several hybrids also, DON and fumonisins were considerable. In mean performance, the best hybrids gave below 2.0, the worst 6.7 with a variance between 2.7 and 68, more than a twentyfold difference; the year 2022 was an aflatoxin year. The year effect for all toxins will be separately shown in Table 15.
ANOVA (
Table 9) showed that all effects (main and their interactions) were significant at
p = 0.001 or higher when tested against the Within. As the four-way interaction was significant, the F values were also tested to the A x B x C x D interaction. The hybrid differences, years, isolates, and toxins differed significantly. However, at this level, the interactions containing hybrid effects (A x B, A x C, and A x D) were not significant between the variety and other traits, even if their F value compared to the Within value was significant. The interactions between years, isolates, and toxigenic species were significant, showing that the data strongly differed in their combinations, but the hybrid effect was relatively stable. As the correlations were generally not significant among toxin levels between isolates and toxigenic species, for all toxins, a different analysis was performed to determine the LSD values for the individual toxins. Of the three-way interactions, only the B x C x D interaction was significant; the other interactions did not significantly differ from the four-way interaction.
From the correlations (
Table 9), we see that of the 66 correlations counted, only five were significant. There is no generally valid correlation matrix that would be suitable to help forecast toxin contamination, even based on one result set to an isolate for the other.
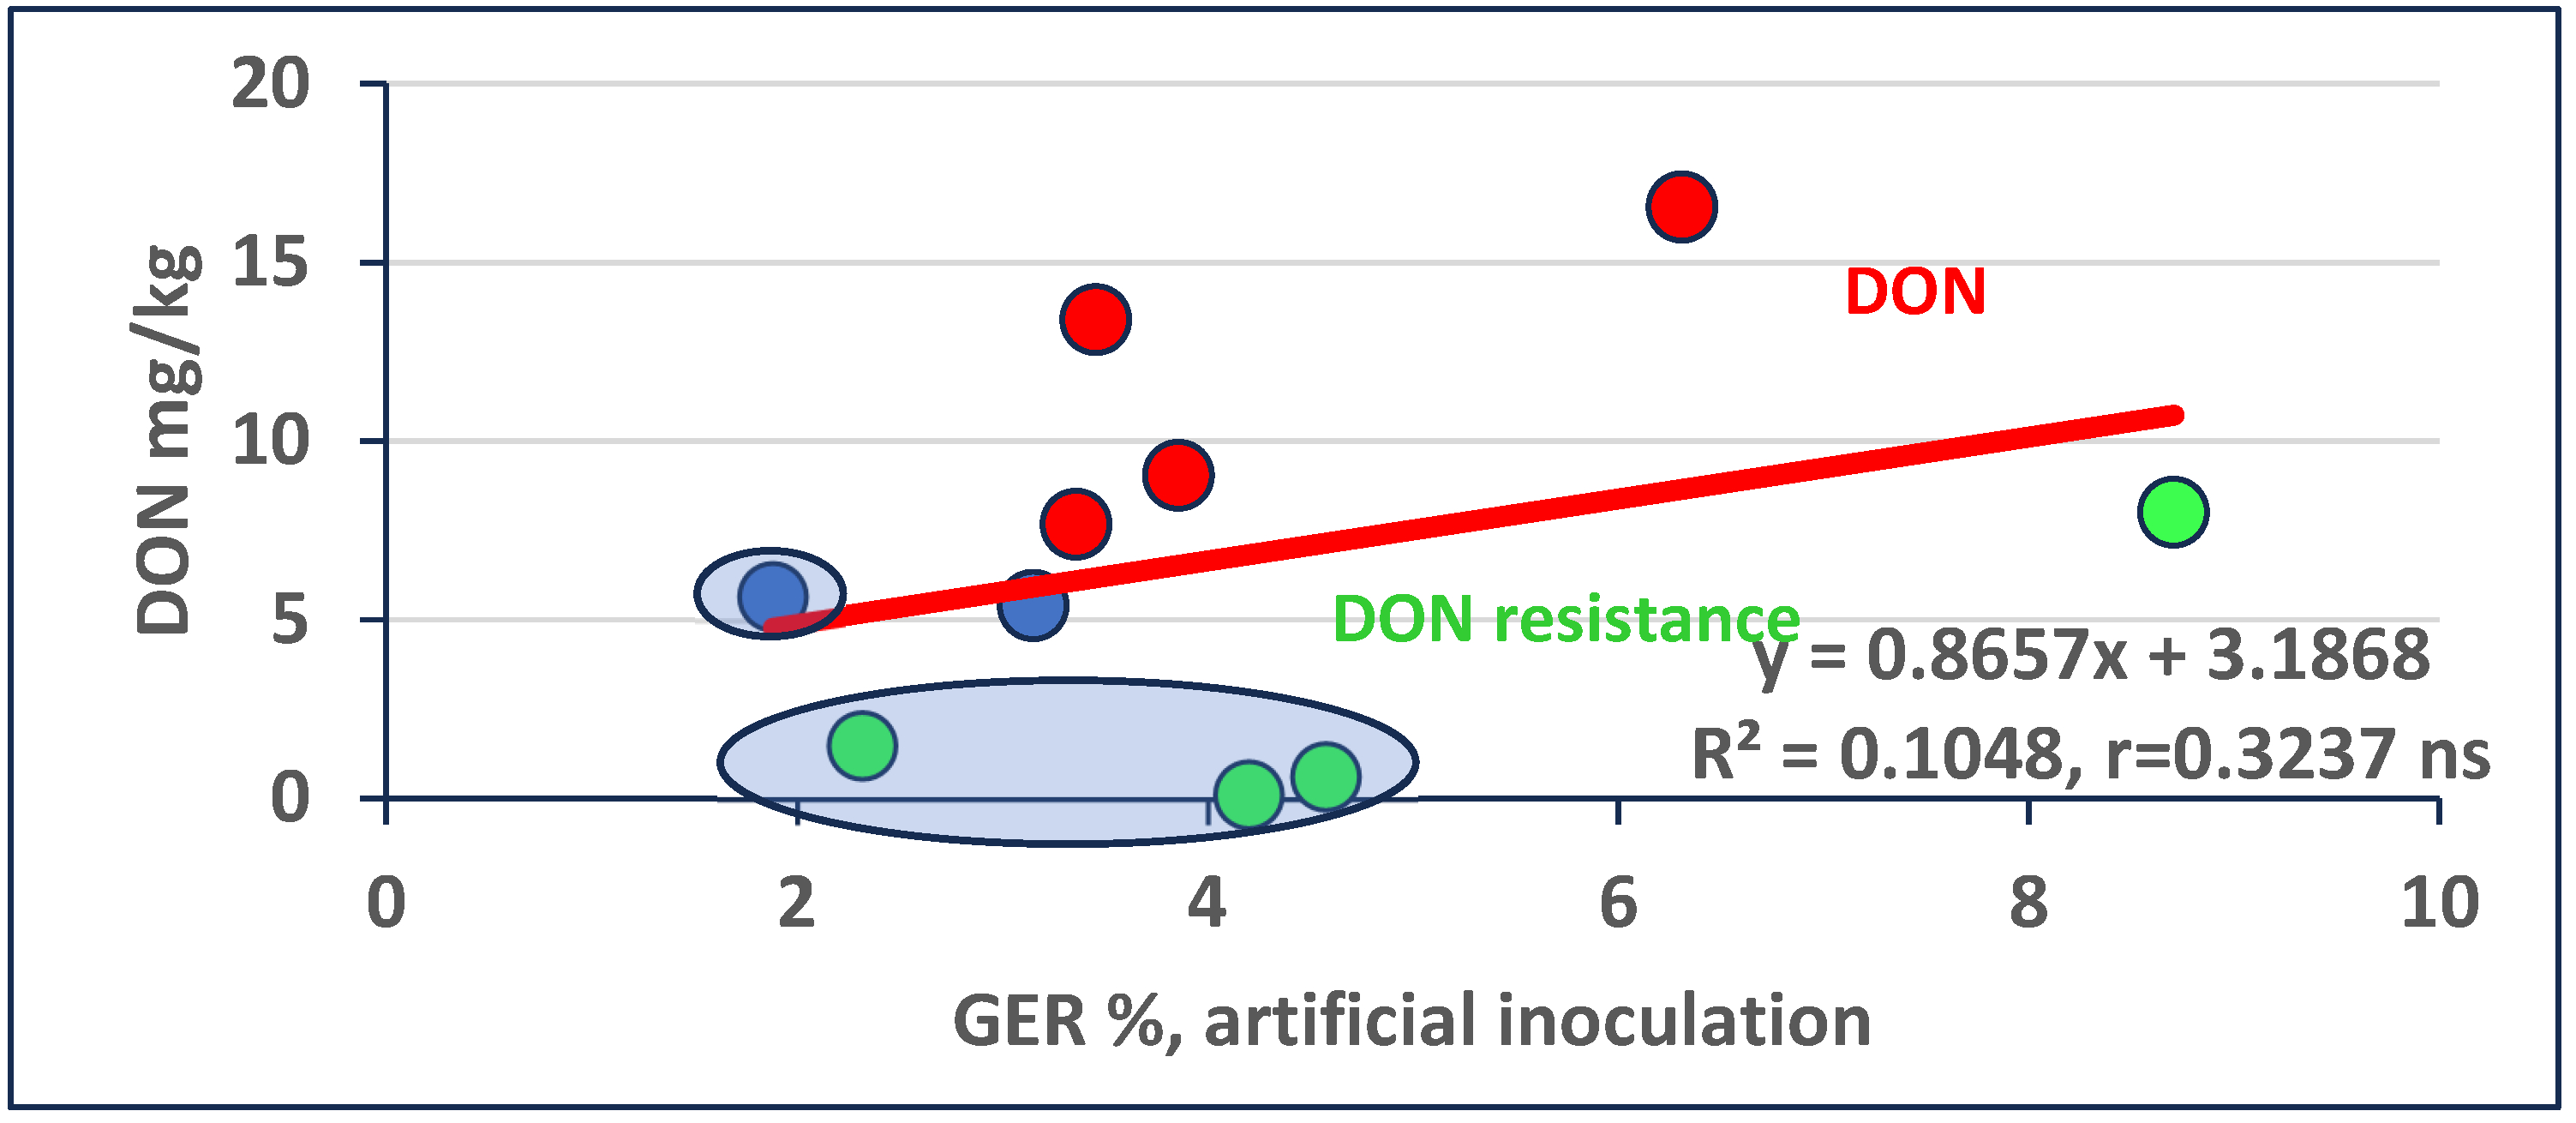
For the stability test, we included data from the two years, both from artificial and natural origins; for the risk analysis, both are important. These tests were made for all three toxins separately. The DON data show very large differences; 0.11 mg/kg is the minimum, and the most susceptible hybrid had 12.41 mg/kg (
Table 10) with an LSD 5% value of 0.20 mg/kg. Two hybrids have a lower mean than 1, and one just above it (1.13 mg/kg). For them, the ear rot is low, stability is good, and the variance is lower than 10, but the highest values are close to 3000 or higher. The correlations (
Table 10) are mostly not significant, indicating that if any of the isolates is selected, its forecasting power for response to the other isolates and other ecological situations is problematic.
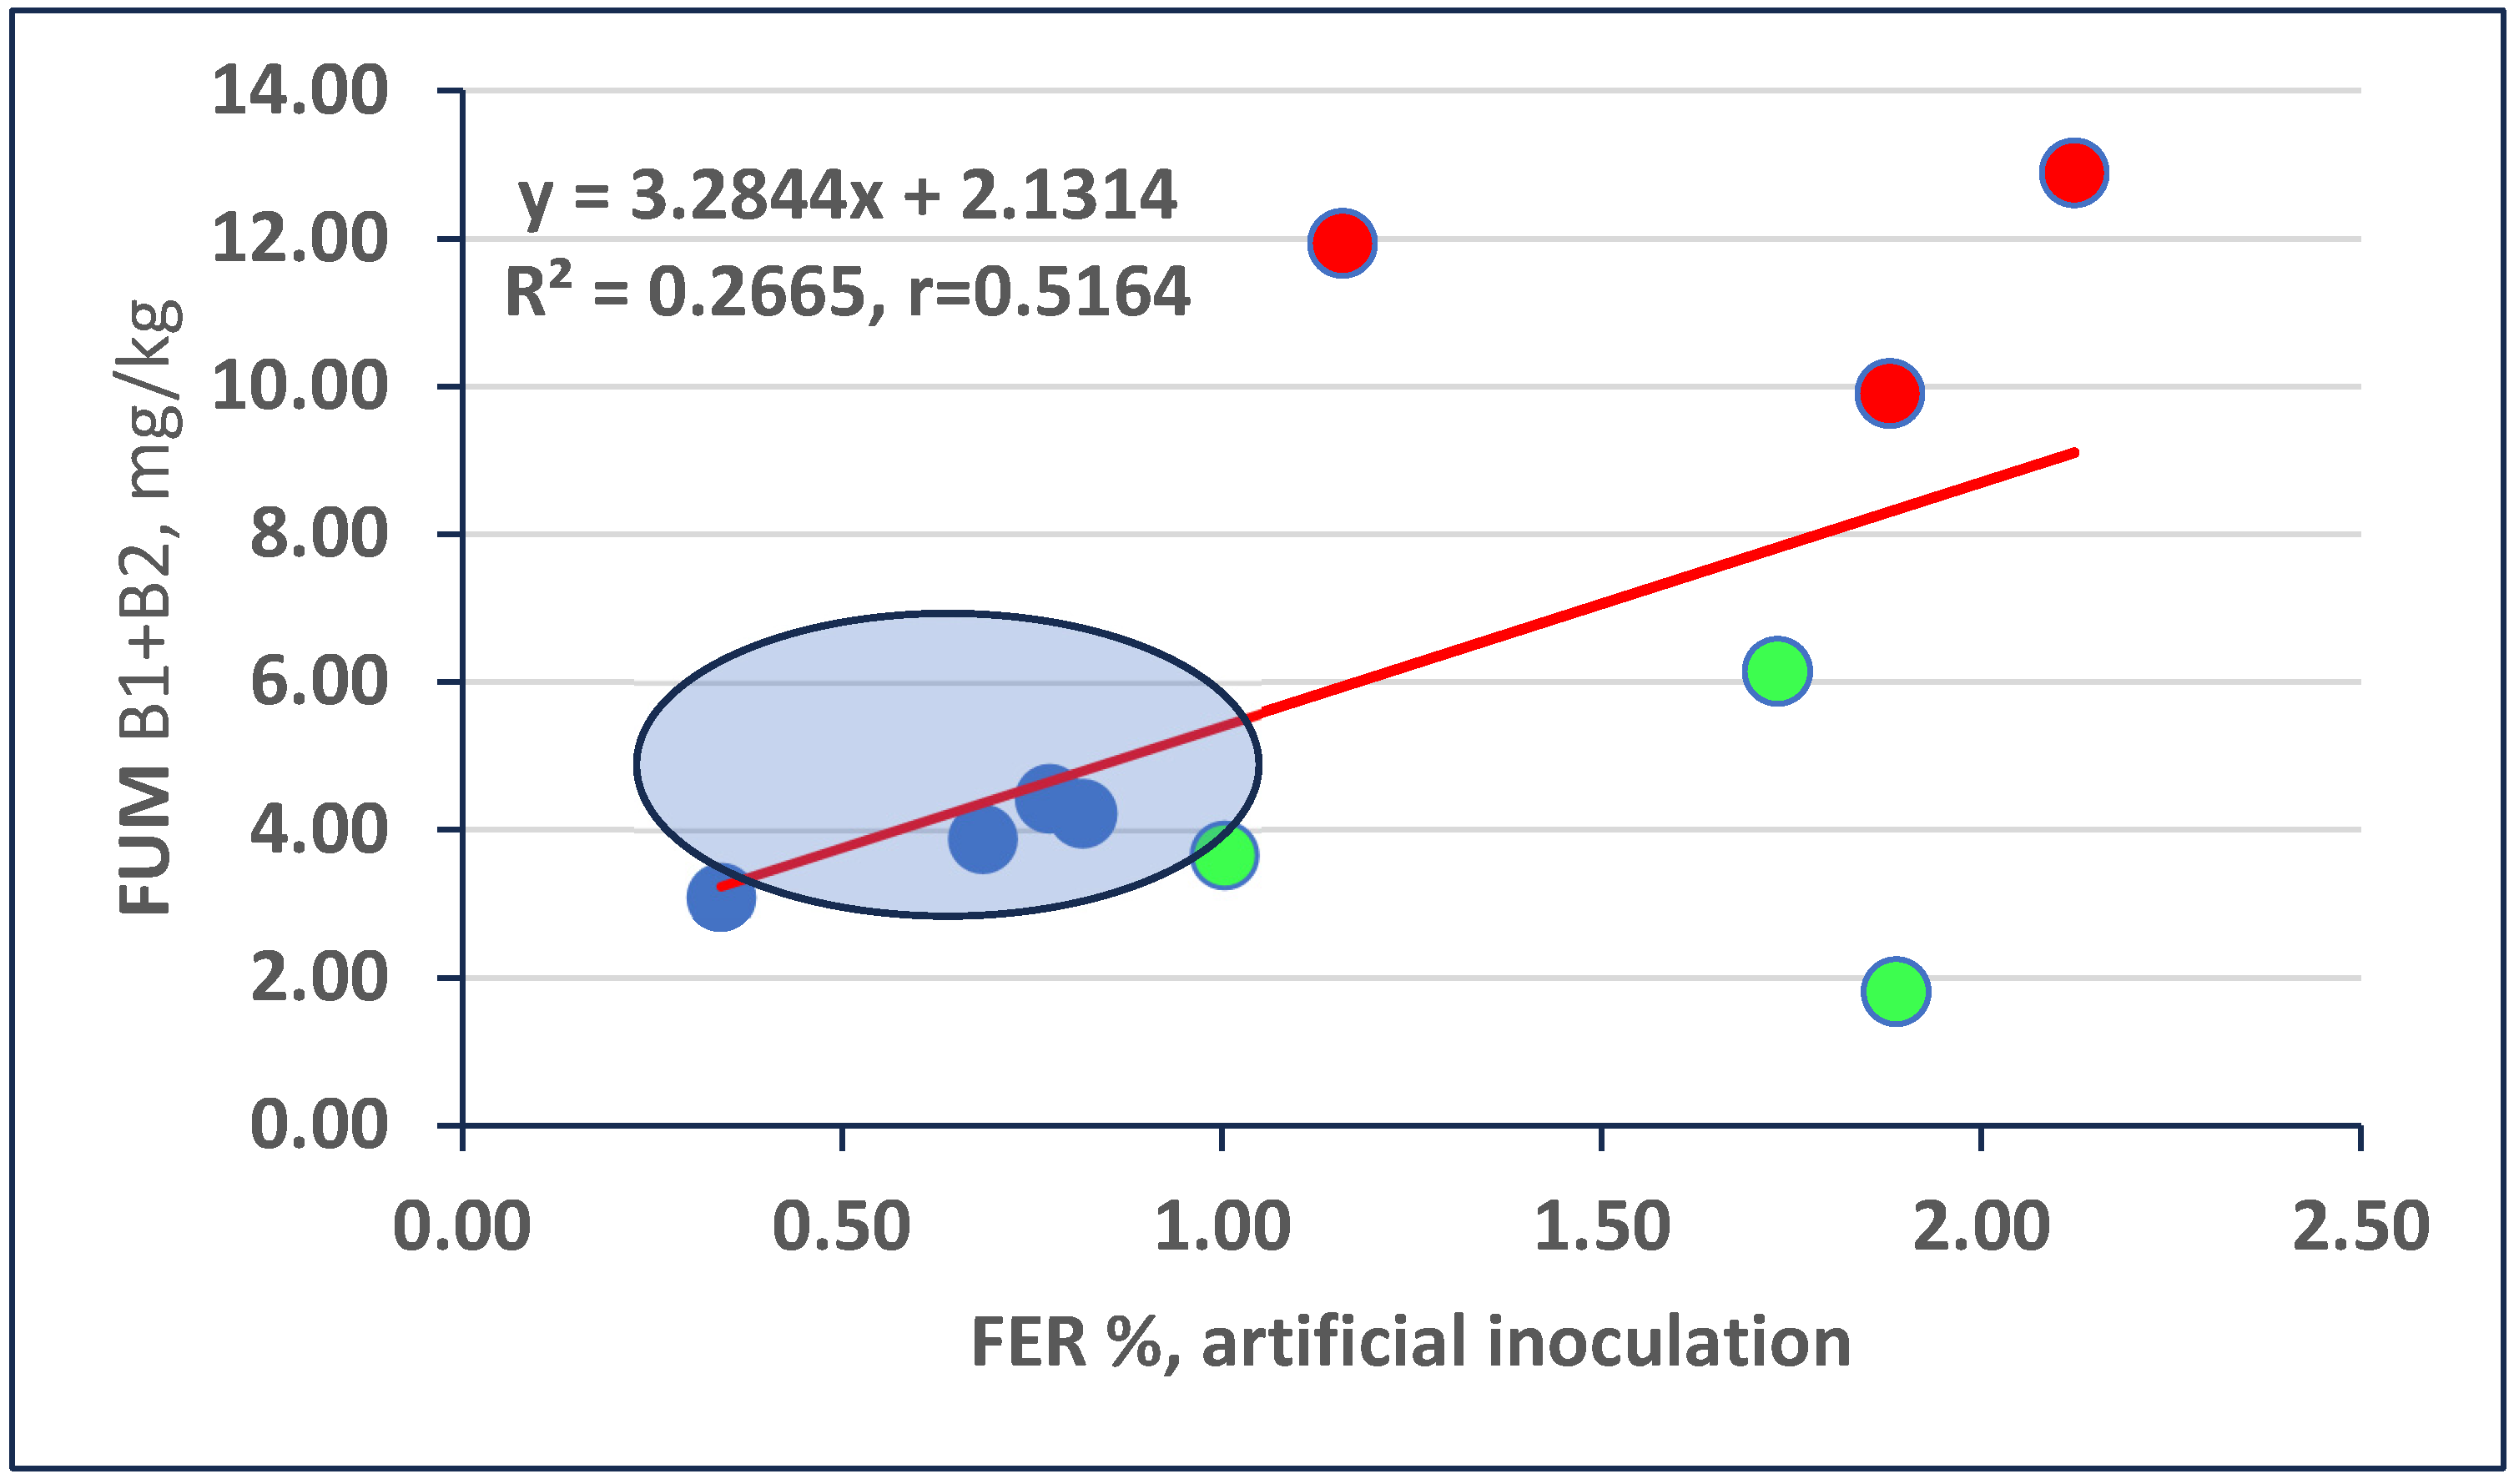
The fumonisin contamination (
Table 11) in the artificial inoculation results shows rather good similarity between the two years; the mean data show sixfold differences between hybrids with an LSD 5% 0.11 (
Table 11). The hybrid differences were significant across the eight epidemic situations, and the stability of the data varied between 1.8 and 137. It could be proven that there are hybrids with stable low infection severity and low variance, e.g., high stability, besides the badly adapted hybrids without valid forecast chance. We prefer the first group. The correlations except four of 28 are not significant; this is in agreement with earlier findings.
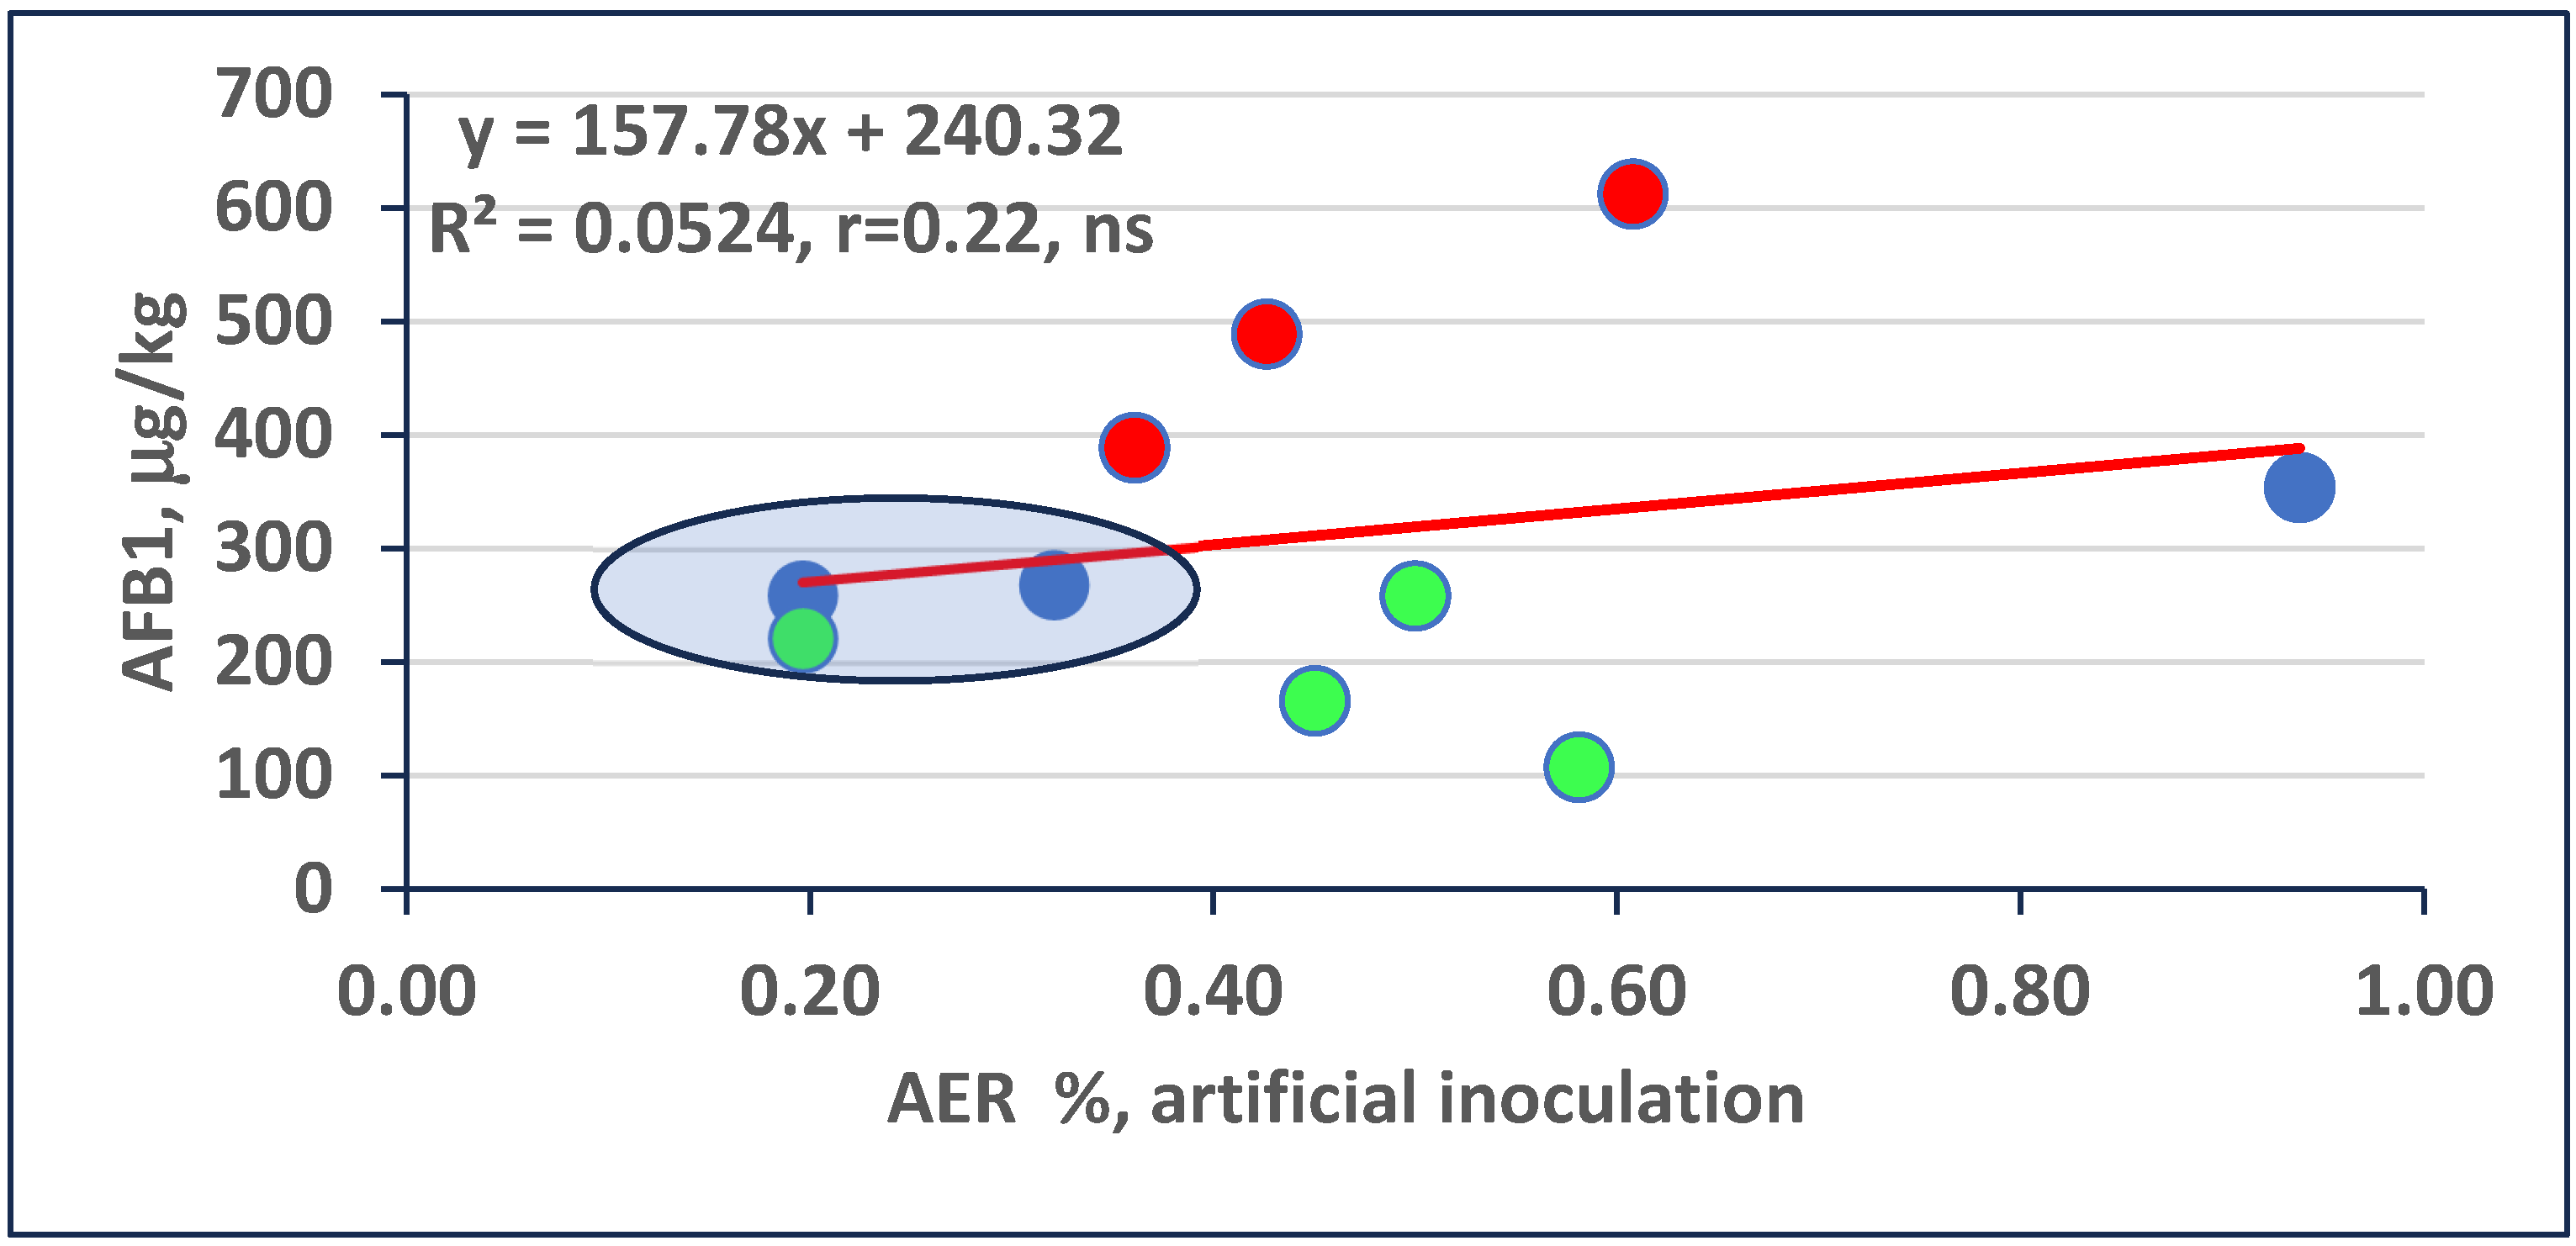
The aflatoxin data for the two years show the behavior of the varieties in eight epidemic situations (
Table 12). The years 2021 and 2022 differ significantly. Here, the three isolates presented significant differences, but Isolate 3 and the controls were close to zero or zero. The other two isolates caused variable amounts of AFB1 contamination; only one hybrid was free of contamination (lower than the detection limit or zero). The year 2022 was very different; the AFB1 contamination was very high, with significant differences between isolates. For 2020, we see higher numbers [
30], but this year was the first where all the hybrids showed a naturally higher contamination than the EU limit value. It is clear that, based on one isolate, no correct resistance estimate can be made. However, when we see the variance in the responses in the hybrids, we can identify about four hybrids that have low variance and a low AFB1 level. DKC5542 is clear; except for one data, all are in the lowest quarter and have low-to-medium exposition. P9415 has one critical data; the rest are fine. Cadixxio Duo does not have an orange ranking; it also has a low mean, and the natural contamination value is the second best. The correlations (
Table 12) show that in 2021, Af1 and Af3 correlate with r = 0.91, but by plotting the data, the same correlation was not significant the next year. As Af3 caused no contamination, no correlation could be counted. Only two of the 28 correlations are significant, so it is not possible to predict future behavior based on the correlations for the hybrids calculated based on any single isolate or dataset. However, it was possible to identify hybrids with low mean performance and low variance; even 1–2 higher data might occur.
We mentioned that in earlier tests, the toxin contamination for a percentage of visible infection showed large differences, and this is also the case in this test (
Table 13). In DON, the difference between the maximum and minimum rates was 28-fold, for FUM 18-fold, and for AFB1 15.23. This high variability is likely one source of the low correlations.
It does not seem to be resistance-related. One of the most resistant Cadixxio Duo variants produces a fivefold higher DON value for a % of infection than the second most resistant hybrid, P9415, which is a better DON producer. As the phenomenon significantly influences the toxin contaminations and lowers correlations, its understanding needs more research work. We should mention that there are two ZD (zero divider) designations instead of numbers. In these two cases, no visual infection was detected; therefore, this number is zero; hence, the ZD designation, as dividing by zero, is not possible.
2.4. Summary of Traits
In the summary table (
Table 14), the data means for isolates are presented for ear rots, toxigenic species, artificial (regular font), and natural infection and toxin contamination (
italic) data. The colored highlights make it easier to interpret the data. Only P9415 showed a lower performance for all traits under the column mean (dark and light green, meaning that the stability was high (4739). Cadixxio DUO showed one case with a higher amount than the column means, but for aflatoxin, which had the lowest natural AFB1 contamination, its stability was good. Out of all the hybrids, these two can be grouped into the low–medium risk category, again with good stability (6416). As for the others, the highest susceptibility and best resistance occur in every hybrid for different traits. The variance also shows this. Fornad and Sy Zephyr could be discussed, and earlier data could be looked for, or another test could be included. Armagnac represents an especially alarming case; all toxin data are in the dangerous group, and for ear infections, only the value for Fg ear rot is lower than the mean for the column. Its instability is the worst (45,602).
The resistance (ear rot response) and resistance to toxins disagree in most cases (13A). We should mention that we have the mean responses to three isolates; therefore, the reliability of the data is significantly higher than that of data obtained from tests using only one inoculum. Of the 66 correlations, only 8 were significant. The AER correlated significantly with the FAO numbers; i.e., the later hybrids were more infected in this set. However, the AFB1 showed no correlation with FAO numbers (r = 0.025 and r = 0.259); i.e., there were other factors influencing AFB1 contamination. We never assumed that only one trait could explain the very complicated symptom/toxin relations, and now, this seems to be the correct version. In F. graminearum, we can see a significant correlation between disease symptoms and toxin contamination (r = 0.730). This is a tendency. For example, Cadixxio DUO is an FAO 470 hybrid with one of the lowest GER contaminations (1.88%), but its DON value is 5.68 mg/kg. The hybrid Armagnac, with nearly the same FAO number, showed a slightly higher GER with 9 mg/kg DON and 9 mg/kg FUM at a high FER severity. Our conclusion is that risk levels should be assessed for all traits separately, and, in the end, we should combine the results to make a suitable decision.
We also checked how the ear rot and toxin data relate to the rates of toxin contamination for one percentage of ear rot. For the 11 traits, 33 correlations were counted, of which only 1 was significant with r = 0.788 and
p = 5%, between DON production at artificial inoculation and DON%/1% ear rot. There seem to be quite different regulations concerning DON production for 1% ear rot. Based on the correlation between traits shown in
Table 12, it would have been a surprise to see a different result. However, this finding has significant implications for risk analysis in maize hybrids and also in inbred lines. This also has significance for the forecast of toxin contamination. When we know this phenomenon, we can work with it, even if the background is not clear.


 ,
, 
