Abstract
Harmful cyanobacterial blooms (HCBs) are of growing global concern due to their production of toxic compounds, which threaten ecosystems and human health. Saxitoxins (STXs), commonly known as paralytic shellfish poison, are a neurotoxic alkaloid produced by some cyanobacteria. Although many field studies indicate a widespread distribution of STX, it is understudied relative to other cyanotoxins such as microcystins (MCs). In this study, we assessed eleven U.S. urban lakes using qPCR, sxtA gene-targeting sequencing, and 16S rRNA gene sequencing to understand the spatio-temporal variations in cyanobacteria and their potential role in STX production. During the blooms, qPCR analysis confirmed the presence of the STX-encoding gene sxtA at all lakes. In particular, the abundance of the sxtA gene had a strong positive correlation with STX concentrations in Big 11 Lake in Kansas City, which was also the site with the highest quantified STX concentration. Sequencing analysis revealed that potential STX producers, such as Aphanizomenon, Dolichospermum, and Raphidiopsis, were present. Further analysis targeting amplicons of the sxtA gene identified that Aphanizomenon and/or Dolichospermum are the primary STX producer, showing a significant correlation with sxtA gene abundances and STX concentrations. In addition, Aphanizomenon was associated with environmental factors, such as conductivity, sulfate, and orthophosphate, whereas Dolichospermum was correlated with temperature and pH. Overall, the results herein enhance our understanding of the STX-producing cyanobacteria and aid in developing strategies to control HCBs.
Keywords:
paralytic shellfish toxins; saxitoxin; sxtA; harmful cyanobacterial blooms; cyanobacteria; qPCR Key Contribution:
This study confirmed the presence of the STX-encoding gene sxtA in all surveyed urban lakes during the blooms; it also identified Aphanizomenon and/or Dolichospermum as the primary STX producers, showing a significant correlation with sxtA gene abundances and STX concentrations.
1. Introduction
In the past few decades, harmful cyanobacterial blooms (HCBs) have become an increasing global threat to human and environmental health. HCBs can lead to the deterioration of aquatic environments, such as lakes and rivers, by depleting dissolved oxygen and producing cyanotoxins [1,2]. HCB events involving the production of cyanotoxins, such as microcystins (MCs), cylindrospermopsins (CYNs), and saxitoxins (STXs), can induce acute and chronic toxicity in fish, marine mammals, wild terrestrial animals, and humans [1,2].
Paralytic shellfish poisoning (PSP) by consuming paralytic shellfish toxins is considered to be a significant poisoning syndrome [3]. The poisoning effects (e.g., vomiting, burning sensation in the oral cavity, and facial numbness) can occur quickly after ingestion, and if proper measures are not taken in time, intoxicated individuals may lose their lives due to respiratory arrest or cardiovascular shock [4,5]. The category of toxins that triggers PSP comprises STXs and an array of over 50 structurally related analogues [6]. These toxins are produced by some marine dinoflagellates such as Alexandrium spp. and Pyrodinium bahamense [7]. In 1995, it was found that the freshwater cyanobacterium Dolichospermum circinalis (formerly Anabaena circinale) produced the toxin and, since then, other freshwater genera such as Raphidiopsis and Aphanizomenon have been reported to produce STX, including the variants [8,9].
A qPCR technique targeting genes associated with cyanotoxin synthesis is a promising approach to cost-effectively monitor the potential for cyanotoxin production. This technique could offer the detection and quantification of STX producers for the characterization and prediction of HCBs in environments, particularly in aquatic ecosystems. In a previous study, the sxt gene cluster from a filamentous cyanobacterial strain Raphidiopsis raciborskii T3 was first identified to be closely involved in the biosynthetic pathway of STXs [10]. Since the size of the sxt gene cluster varies among different species, ranging from 25.7 kb to 35 kb, specific sxt genes, such as sxtA, sxtB, and sxtG, have been targeted to identify and estimate the abundance of STX-producing microorganisms [11,12]. For instance, a study reported that 8 out of 29 strains of Dolichospermum from 12 regions of Australia detected the sxtA, sxtL, sxtN, and sxtSUL genes through qPCR, whereas the sxtX gene was not detected in the strains [13]. In addition, a newly designed primer set targeting the sxt gene was tested with water samples from five Danish lakes potentially containing dominant STX producers, such as Aphanizomenon, Dolichospermum, and Planktolyngbya [14]. The authors observed a significant positive correlation (regression R2 = 0.64, p-values < 0.01) between sxtA copy number and total STXs. Despite recent progress in this area, most of the cyanobacterial qPCR research focuses on genes related to MC producers or STX producers of eukaryotic marine dinoflagellates. For this reason, freshwater cyanobacteria are still underrepresented in this area.
Urban lakes play a crucial role in providing essential services such as storm water retention to prevent flooding and pollutant load mitigation [15,16]. They frequently serve as a source of potable water and are used for recreational activities [17]. However, the urban lakes typically characterized by their small size, shallow depth, and limited water circulation are prone to eutrophication. Conditions such as high temperatures and alkalinity further enhance this susceptibility, providing an ideal environment for the occurrence of HCBs [18,19]. Given the potential exposure to water contaminated with cyanobacteria, it becomes imperative to assess the associated risks.
In this study, we aimed to enhance the understanding of STX-producing cyanobacteria dynamics in urban lakes and, specifically, to determine whether the existence of the sxtA gene is indicative of STX production and if there is a correlation between the copy number of the sxtA gene and toxin concentration. Moreover, we examined the relationships between STX concentrations, the abundance of identified STX producers, and important environmental parameters.
2. Results
2.1. Microbial Community Structures and Potential STX Producers
To understand the biological environment, the community structures of cyanobacteria and their associated bacteria were characterized. In 2021, samples were collected from 11 urban lakes in various locations and dates in three cities (Figure 1A, Table S1). Upon examining the bacterial taxa present in the lake dataset, it was found that the community structure primarily consisted of five different phyla: Bacteroidota (30.6 ± 11.4%), Proteobacteria (29.5 ± 9.2%), cyanobacteria (20.7 ± 17.0%), Actinobacteriota (12.5 ± 7.8%), Verrucomicrobiota (5.3 ± 5.1%), and Planctomycetota (3.0 ± 2.5%) (Figure 1A). The relative abundance of Cyanobacteria varied across different sites, showing an increasing trend from July to August in most lakes. For Big 11 Lake and Tomahawk Creek Lake, their relative abundance continued to increase in November. Cyanobacteria exhibited a high relative abundance in July at South Lake and Sloans Lake, decreased in August, and peaked again in November at South Lake. In Figure 1B, alpha diversity indices (Faith and Pilou), reflecting microbial community diversity and evenness, were calculated. The results showed that the communities of the lakes in Cincinnati were more diverse and evenly distributed than those in Kansas City and Denver. It is worth mentioning that there was no significant difference in alpha diversity between the lakes in Denver and Kansas City. However, the lakes in Cincinnati exhibited a significantly higher alpha diversity than the lakes in the other two cities (Kruskal Wallis, p < 0.05). In Kansas City, the samples from Big 11 Lake, South Lake, and Tomahawk Creek Lake had relatively low alpha diversity indices. To evaluate dissimilarities in the overall microbial community composition across the various lakes, PERMANOVA, clustering analysis, and NMDS ordination were employed. The results of the PERMANOVA revealed notable differences in microbial communities among the lakes, depending on the city in which they were located (F = 8.2, p < 0.001). Additionally, the NMDS plot exhibited that lake samples collected from Cincinnati were predominantly grouped on the left (Figure 1C). In contrast, samples in Kansas City and Denver were scattered horizontally, while some of them in Kansas City and Denver exhibiting a significant abundance of Cyanobacteria (e.g., Big 11, Tomahawk Creek, and Sloans Lakes) were grouped on the upper- and lower-right sides, forming dispersed clusters.
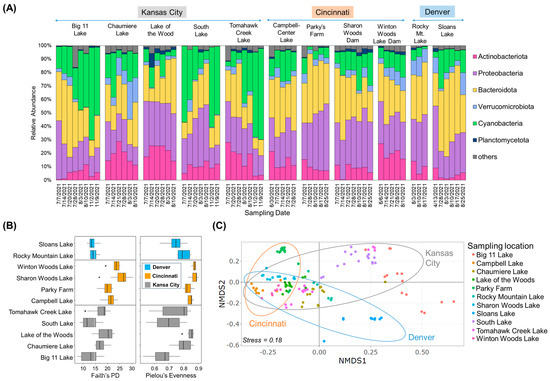
Figure 1.
Community composition and structure by 16S rRNA gene amplicon analysis. (A) Taxonomic classification (at phylum level) of collected samples from the studied urban lakes, (B) Analysis of alpha diversity based on Faith’s PD and Pielou’s Evenness, (C) NMDS ordination plot for bacterial community composition (stress = 0.18). Points represent the NMDS scores of each sample in the lakes and ellipses indicate the 95% confidence interval of the group centroids.
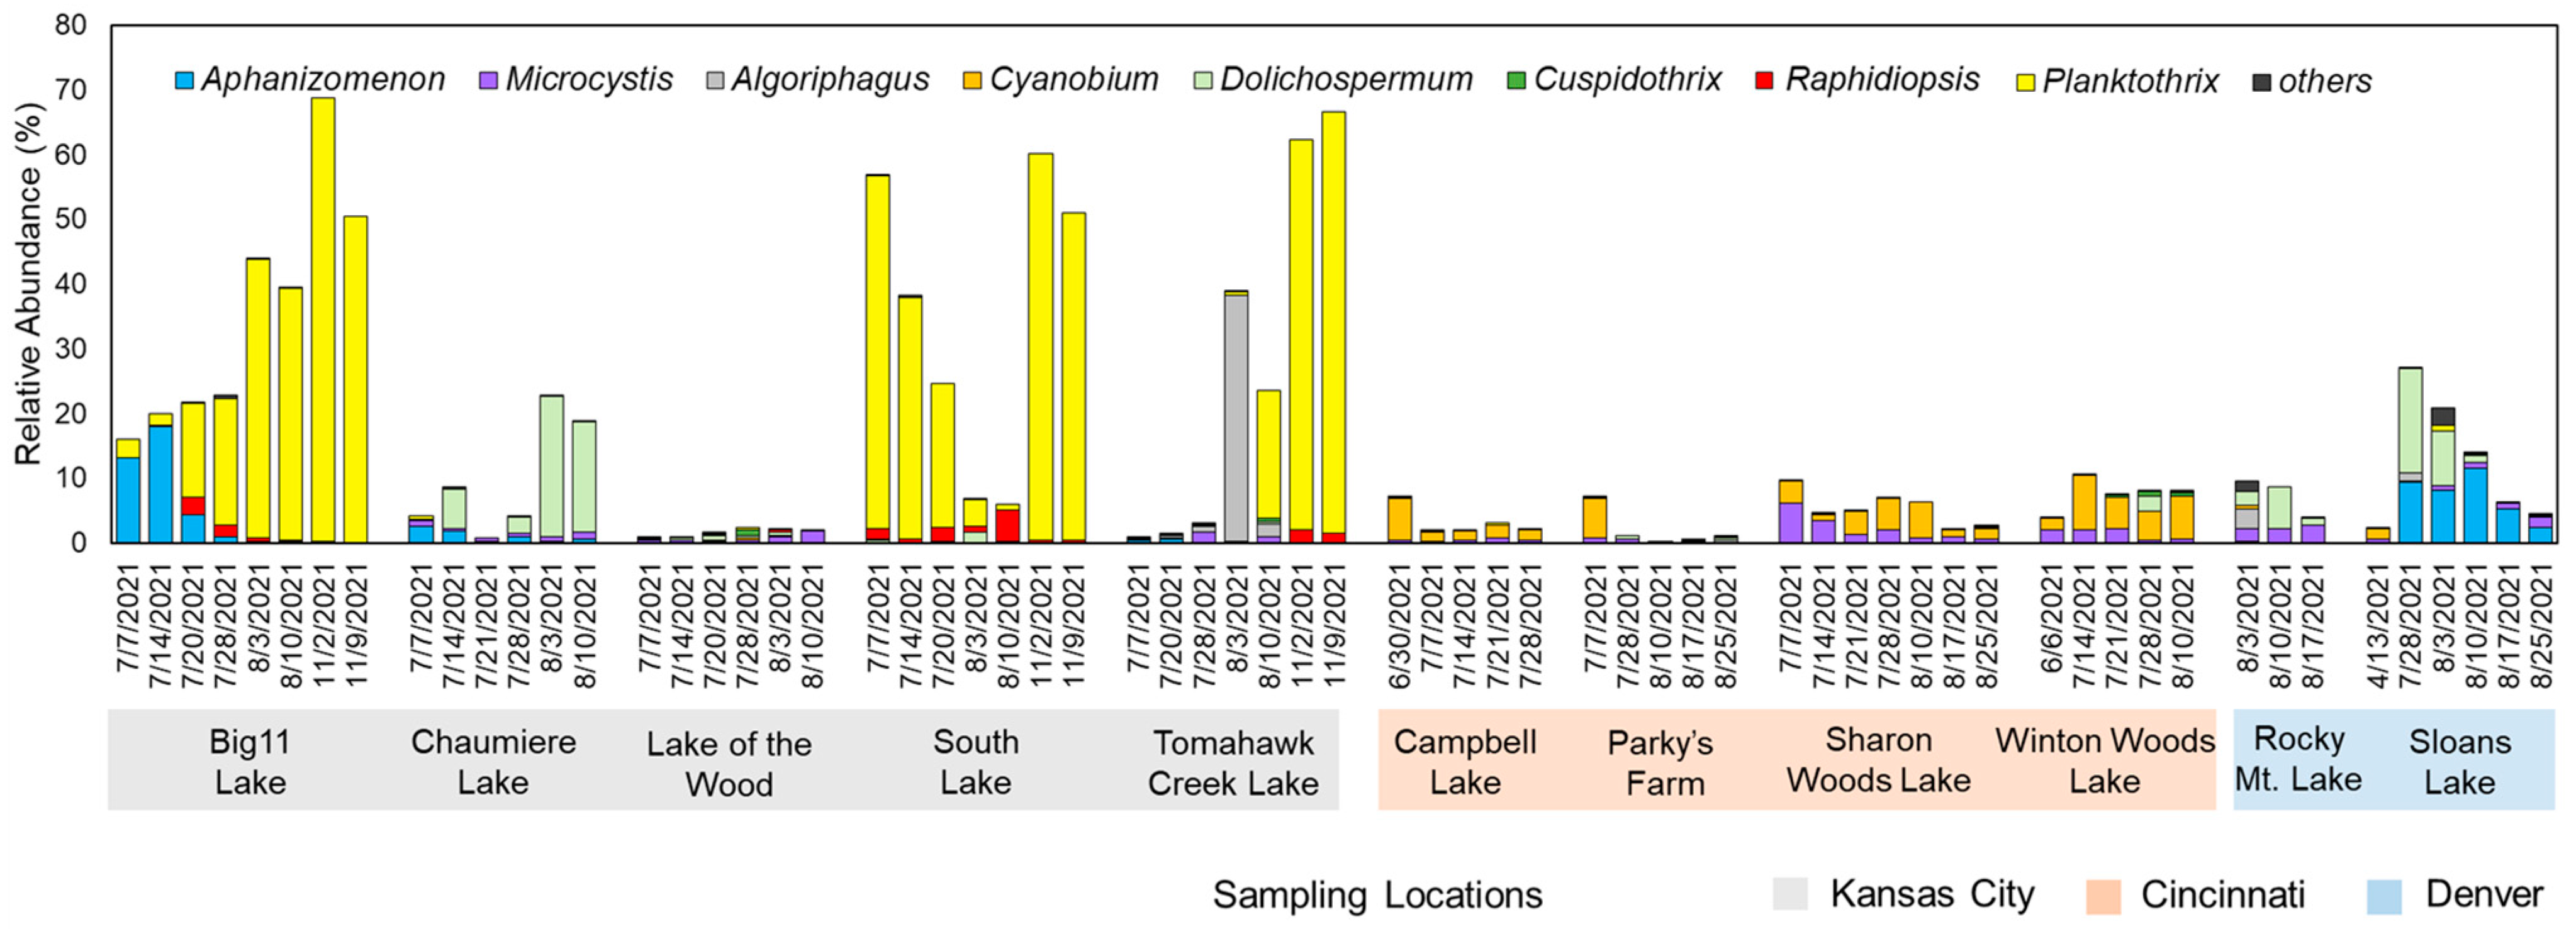
At the genus level, the community composition results displayed distinct bloom characteristics that were unique to each region (Figure 2). In Kansas City samples, Aphanizomenon and Planktothrix were dominant, with Planktothrix being the overwhelmingly dominant genus at peak in Big 11 Lake (68.4%), South Lake (59.6%), and Tomahawk Creek Lake (65.2%). In Chaumiere Lake, Dolichospermum was the dominant cyanobacterial species, with a relative abundance peak of 21.7%. For Lake of the Wood, Cyanobacteria accounted for only 2.5% of the total abundance at the peak in July. Meanwhile, samples from the lakes in Cincinnati were mainly composed of Cyanobium and Microcystis, but their overall relative abundance was low, with 10% at peak. Similarly, samples from the lakes in Denver also showed similar taxa compositions, with low relative abundances of Cyanobacteria, but Sloans Lake was mainly composed of Dolichospermum and Aphanizomenon and showed a decreasing trend over time.
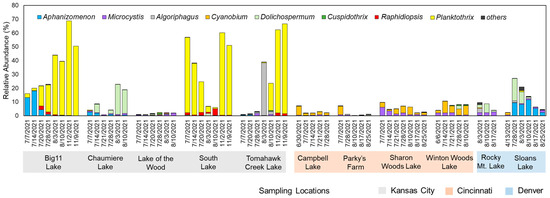
Figure 2.
Relative abundances (%) of cyanobacterial genera identified at the studied urban lakes.
2.2. Temporal Variations in sxtA Gene and STX Production
The qPCR analysis showed that sxtA genotypes were present in all lakes (Figure 3). Compared to the other lakes, Tomahawk Creek Lake exhibited a significantly higher mean abundance of the sxtA gene (3.38 log10GCN∙mL−1). In addition, the highest level of the sxtA gene was observed at Chaumiere Lake in early July (4.27 log10GCN∙mL−1). The average abundance of the sxtA gene detected in the Kansas City (2.84 log10GCN∙mL−1) and Denver areas (2.41 log10GCN∙mL−1) was significantly higher than that detected in the Cincinnati area (1.69 log10GCN∙mL−1).
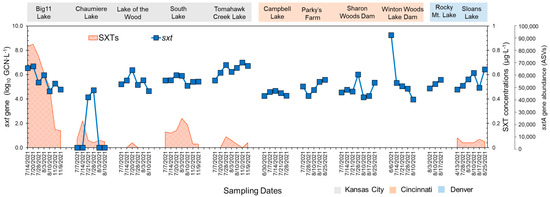
Figure 3.
Analysis results of STX concentrations STX concentrations (shaded red area), sxtA gene copy numbers by qPCR (blue square), and sxtA gene abundances based on sxtA target sequencing (red circle) in the lakes of Kansas City, Cincinnati, and Denver. sxtA gene abundances were calculated by summing the counts of ASVs identified through the target sequencing. While the primers employed in the qPCR assay for the sxtA gene differ from those used in target sequencing, both sets of primers primarily target the sxtA gene in Aphanizomenon and Dolichospermum.
The temporal trends in STX production, which were similar to the trends for the abundances of the sxtA genes, varied from 0 to 0.913 μg∙L−1 at the sampling sites (Figure 3). The highest concentration of STX was detected in Big 11 Lake in Kansas City. STXs were also found in the other four lakes in Kansas City, with concentrations ranging from 0 to 0.236 μg∙L−1. In Sloans Lake near Denver, STXs were observed in the range of 0 to 0.067 μg∙L−1. Despite the presence of the sxtA gene in all of the lakes in Cincinnati, STXs were undetectable (less than 0.05 μg∙L−1).
To better understand the potential for STX production in urban lakes, high-depth sequencing on amplicons from the sxtA gene was performed. These data can help confirm various taxa to produce STX and provide insight into the distribution and diversity of the sxtA gene. It is important to note that the primers used for the qPCR assay of the sxtA gene are different from the one used for target sequencing (Table S2), but both primers mainly target the sxtA gene in Aphanizomenon and Dolichospermum [20,21]. The analysis revealed that a single ASV was dominantly present in the urban lakes, and the BLAST search against the NCBI database (cut-off at 80%, identity at 70% E-value at 10−7) confirmed that it was associated with Aphanizomenon, Dolichospermum, Heteroscytonema, and Lyngbya (Table 1). These genera were also detected in our 16S rRNA amplicon sequencing analysis. Kansas City lakes showed more ASVs than Denver and Cincinnati, with Big 11 Lake having the most from sxtA gene sequencing (Figure 3). The distributions of the ASV showed a similarity to the trend observed in the abundances of the sxtA genes obtained by qPCR.

Table 1.
Identified ASVs by BLAST from sxtA target sequencing (cut-off: 80% identity, 70% coverage, and 10−7 E-value).
2.3. Correlation between sxtA Abundance and PCR Measurements to STX Production
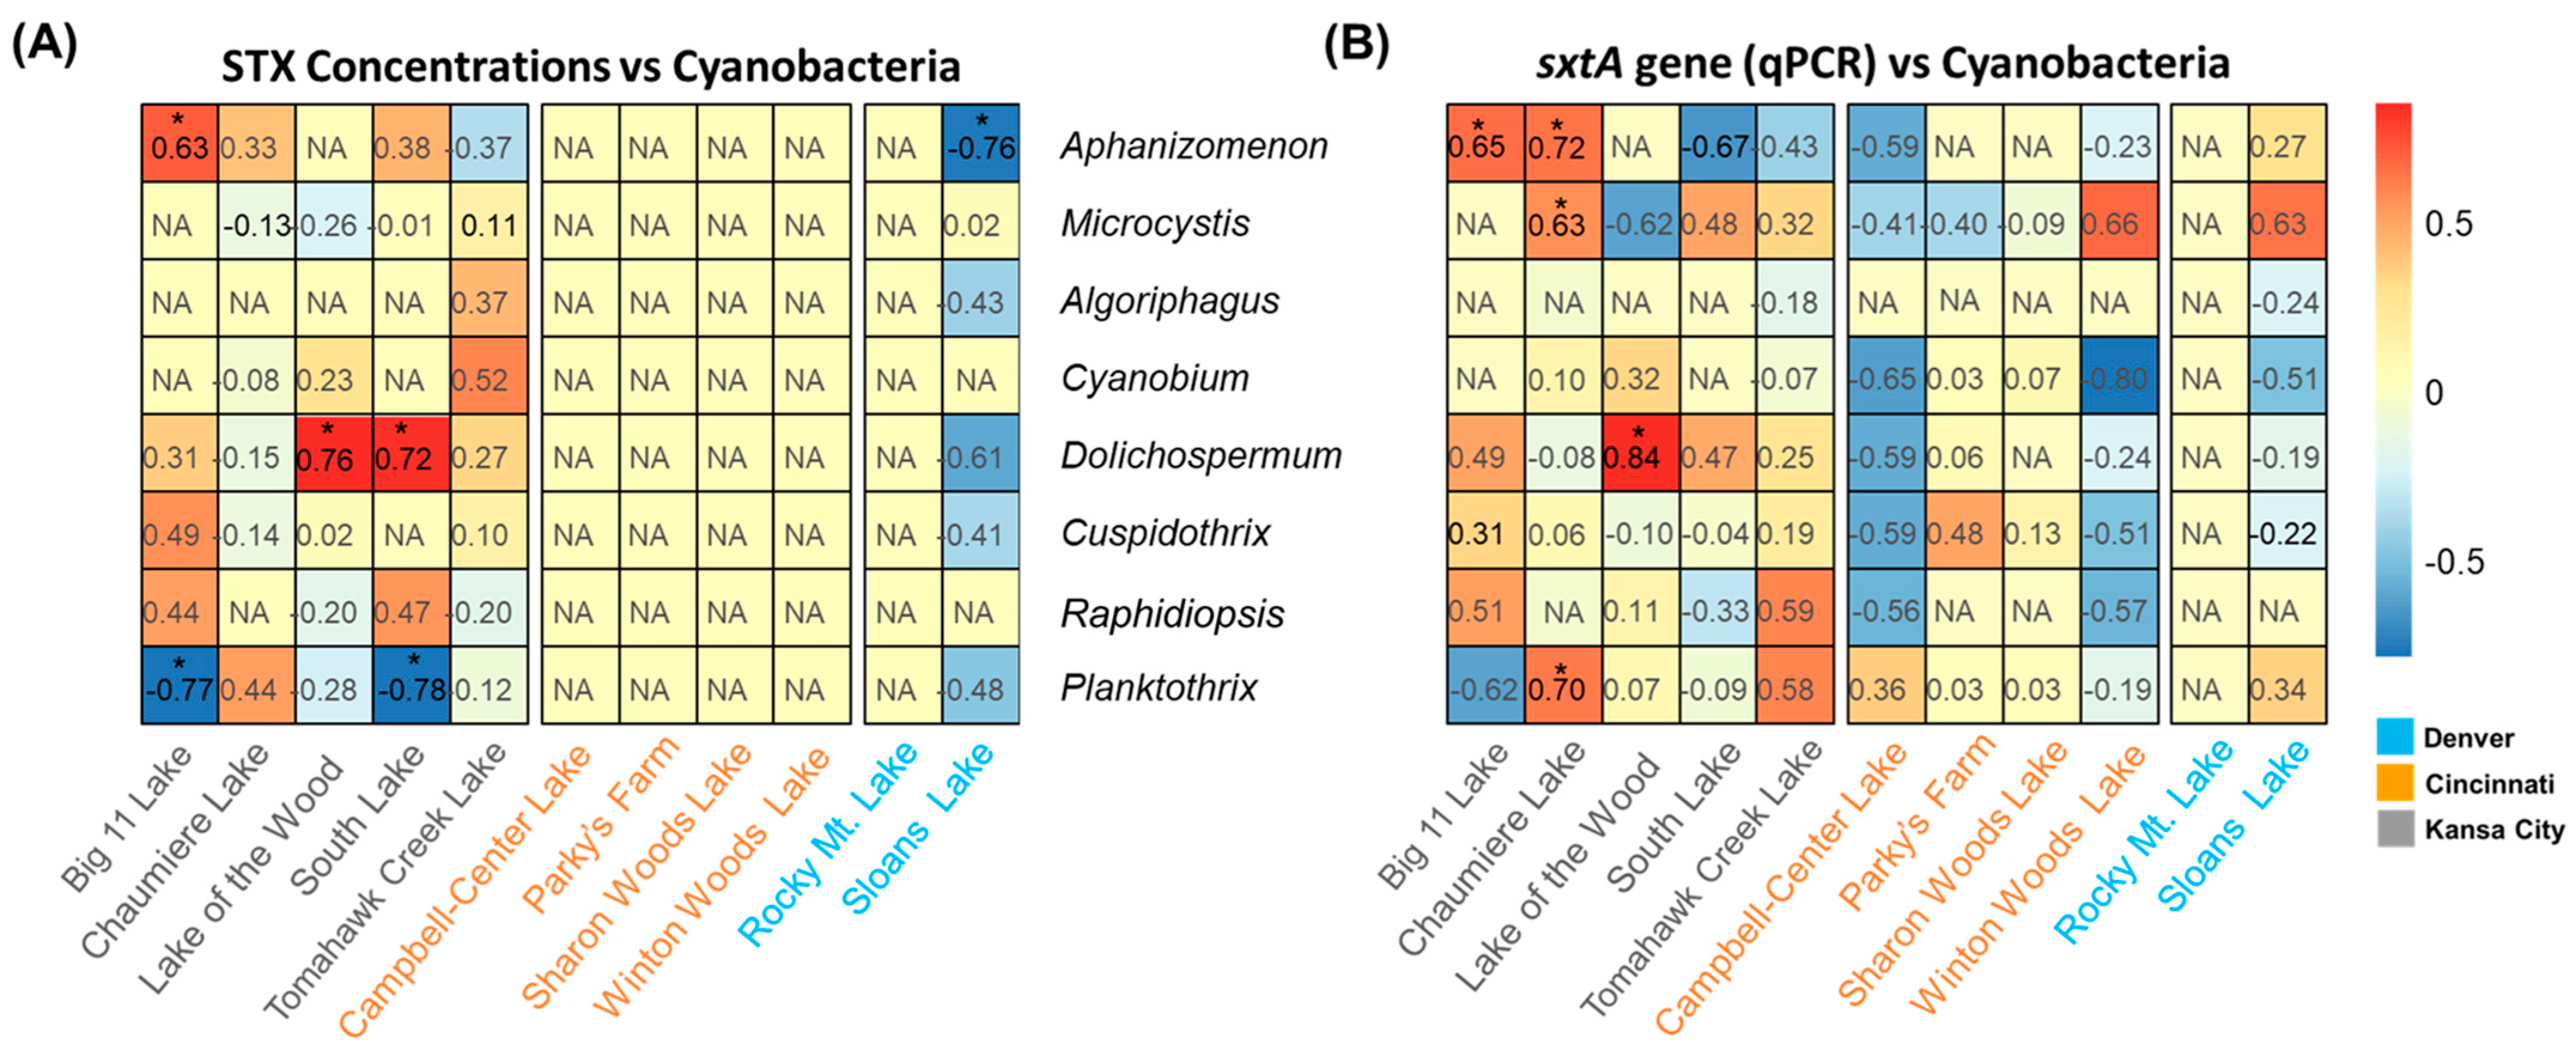
Based on the qPCR and sequencing results in this study, Pearson correlation tests were performed, and potential STX producers in the lakes were examined (Table 2 and Figure 4). The correlation between sxtA gene abundances by qPCR and STX concentrations was significant only in the Big 11 Lake, where STXs were detected, with a correlation coefficient of 0.69 (p-values < 0.05). In Chaumiere Lake and Sloans Lake, the sxtA gene abundances negatively correlated with the STX concentration (Rpearson −0.42 and Rpearson −0.61, p-values > 0.05). The correlations between the abundances of the sxtA gene and the toxin level in South Lake and Tomahawk Creek Lake were positive. However, their significance was low (Rpearson 0.3 and Rpearson 0.36, p-values > 0.05). Similarly, when comparing the qPCR-based abundances of the sxtA gene to the abundances of the amplified ASV obtained through deep sequencing, no significant correlation was observed in the lakes, except for Sloans Lake in Denver (Rpearson 0.9, p-values < 0.05). South Lake and Campbell Lake exhibited high correlation coefficients, but the results were not statistically significant (Rpearson 0.69 and Rpearson 0.62, p-values > 0.05). In Figure 4, correlation coefficients were calculated to further explore the role of the cyanobacterial community in STX production by analyzing the relative abundance of each genus and qPCR results. The results showed that among the potential STX producers, the relative abundances of Aphanizomenon in Big 11 Lake were significantly correlated with sxtA gene abundances and STX concentrations (Rpearson 0.63 and Rpearson 0.65, p-values < 0.05). In Chaumiere Lake, Aphanizomenon was strongly correlated with sxtA gene abundances (Rpearson 0.72, p-values < 0.05). In contrast, Dolichospermum was found to be positively correlated with both parameters in Lake of the Wood (Rpearson 0.76 and Rpearson 0.84, p-values < 0.05).
Table 2.
Pearson correlation testing comparing sxtA gene abundance (qPCR) to STX concentrations and sxtA gene abundances (ASV counts) in the studied lakes. NA denotes information that is not available. The * indicates p-value < 0.05.
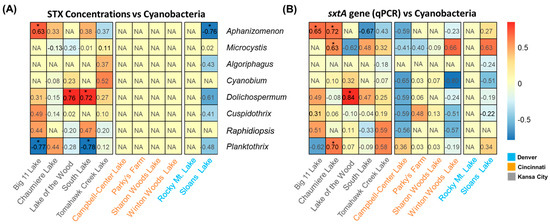
Figure 4.
Heatmap showing Pearson correlation coefficients between STX concentrations and abundances of cyanobacteria (A), sxtA gene (qPCR) and the abundances of cyanobacteria (B) in the lakes. NA represents not available. The * indicates 0.01 < p-value < 0.05.and South Lake (Rpearson 0.72, p-values < 0.05). Planktothrix negatively correlated with the sxtA gene and STX in Big 11 Lake (Rpearson −0.77, p-values < 0.05), whereas a positive correlation was observed at Chaumiere lake (Rpearson 0.70, p-values < 0.05). The negative correlation was observed between the relative abundance of Planktothrix and the presence of the sxtA gene and STXs.
2.4. Effects of Physicochemical Water Quality Parameters on STX Production
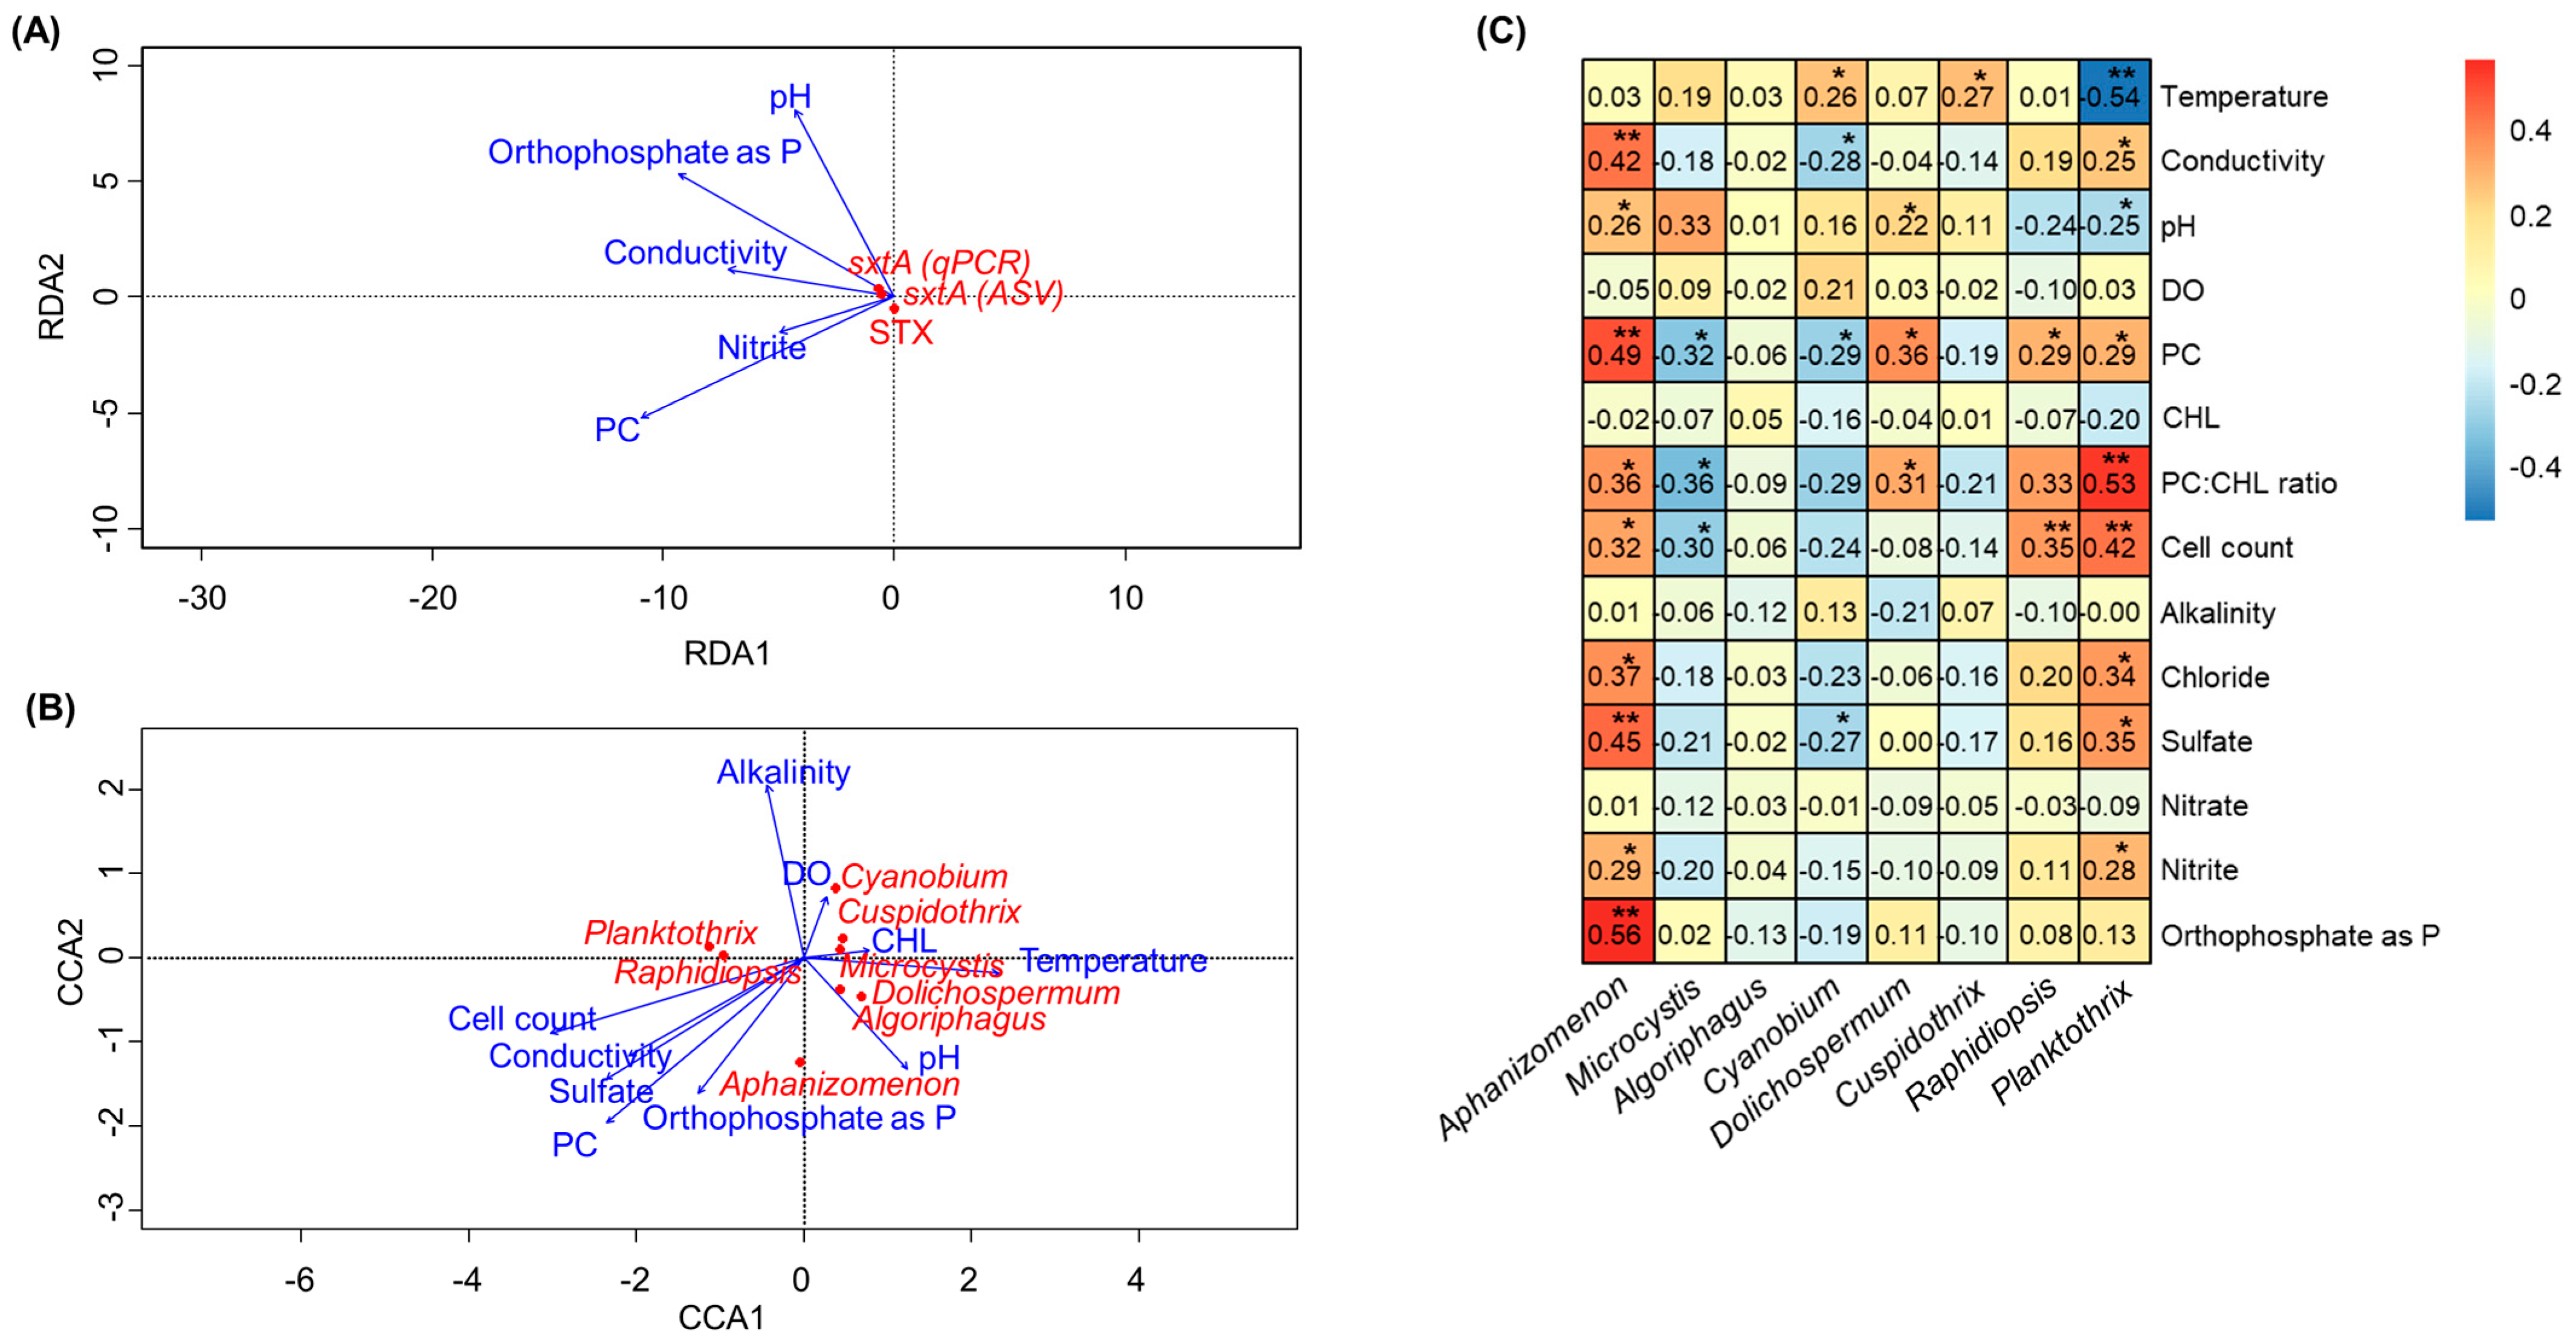
Previous studies have shown the relationship between physicochemical water parameters (e.g., nutrient levels, pH, and temperature) and factors relating to cyanotoxin production [22,23]. In this study, correlation analyses were conducted to investigate whether there was a relationship between environmental variables and either STX production or STX producers (Figure 5, Table S3). The results revealed that there was no clear correlation between the environmental variables and STX production in our study (Figure 5A). Canonical correspondence analysis (CCA) was performed to assess the impact of various environmental and physiochemical variables from each lake on the differences in cyanobacterial taxa abundance. CCA showed that Aphanizomenon and Raphidiopsis corresponded with increasing cell count, conductivity, sulfate concentrations, PC, and orthophosphate as phosphorus (P) (Figure 5B). In the case of Dolichospermum, it showed correspondence with PC, PC:CHL, and pH. In addition, the relationships between environmental variables and the composition of cyanobacteria, specifically potential STX-producing genera, were evaluated by Pearson correlation testing (Figure 5C). Aphanizomenon strongly correlates with orthophosphate as p, sulfate, PC, and conductivity (Rpearson 0.42 to 0.56, p-values < 0.01) among the factors shown in the CCA results. Dolichospermum and Cylindrospermopsis also showed a significant relationship between PC (Rpearson 0.29 and 0.36, p-values < 0.05) and the PC:CL ratio (Rpearson 0.31 and 0.33, p-value < 0.05). On the other hand, Planktothrix was strongly correlated with the PC:CH ratio and cell count (Rpearson 0.42 to 0.53, p-values < 0.01) but had a negative correlation with temperature (Rpearson −0.54, p-value < 0.01).
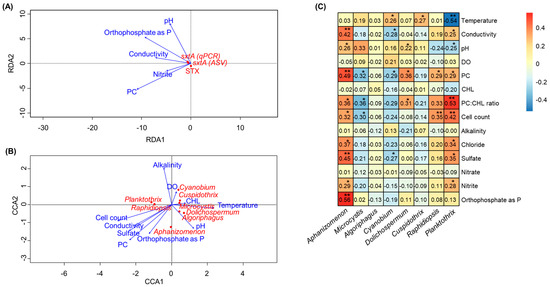
Figure 5.
RDA plot linking the qPCR measurements and cyanotoxin concentrations with environmental variables (A), CCA plot linking the cyanobacteria species with environment variables (B), and heatmap showing Pearson correlation coefficients between the relative abundances of major cyanotoxin producers and environmental variables (C). The * and ** represent 0.01 < p < 0.05 and 0.0001 < p < 0.01, respectively.
3. Discussion
In this study, samples collected from eleven urban lakes showed that the relative abundances of cyanobacteria varied temporally and spatially. Aphanizomenon and Planktothrix mostly dominated five lakes in Kansas City (Figure 2). In comparison, four lakes in Cincinnati were dominant with Cyanobium, and Microcystis and two in Denver were composed of Dolichospermum and Aphanizomenon. In the lakes of Kansas City, the dominance of Planktothrix may be due to its efficient utilization of light at similar intensities, a key factor driving phytoplankton growth, and its adaptability to a wider range of temperatures compared to other cyanobacteria, especially Dolichospermum and Aphanizomenon [24,25,26]. In addition, it was found that the growth of Aphanizomenon is inhibited due to the allelopathic effect produced by Microcystis [27]. Recently, a study found that the growth inhibition of Aphanizomenon by Microcystis is unlikely to result from a single metabolite [28]. Instead, multiple metabolites, such as sphingolipids, glycerolipids, and succinylacetone, are involved in inducing the adverse phenotype. Similarly, it is speculated that the potential suppressive effect of Planktothrix could contribute to its dominance in lakes by inhibiting the growth of coexisting competitors [29]. To fully understand the competitive dynamics of Planktothrix, particularly at the onset of HCBs, further research focusing on the inhibitory influence exerted by Planktothrix, as well as the interplay of light and temperature conditions, is needed.
While the qPCR target, sxtA, covers cyanobacteria-producing STXs (e.g., Raphidiopsis and Aphanizomenon), the identified ASV has shown close relationships with Aphanizomenon and Dolichospermum (Table 1). The lakes in Kansas City exhibited a higher presence of the ASV compared to the lakes in Denver and Cincinnati. Notably, Big 11 Lake in July exhibited the highest number of ASVs from the sxtA gene-targeting sequencing. Considering that Aphanizomenon has a strong correlation with STX concentrations and the sxtA gene, as depicted in Figure 4, all evidence suggests that Aphanizomenon plays a significant role in the production of STXs in the lake. However, this correlation was not observed in the other lakes. Despite the increased prevalence of cyanobacteria genera other than Aphanizomenon and Dolichospermum, their correlations with the sxtA gene and STX concentration were not significant. For example, in South Lake and Tomahawk Creek Lake, Raphidiopsis was more prevalent compared to Aphanizomenon and Dolichospermum, but its correlation with STX concentration and the abundance of the sxtA gene was not significant. Consequently, it raises the possibility that Raphidiopsis might contribute to STX production through an alternative pathway not involving sxt-related genes, or it might be present without actively contributing, possibly due to some crucial steps missing within the sxt gene cluster [30,31].
Previously, qPCR signals from cyanotoxin genes, such as mcy, were used to forecast cyanotoxin levels and characterize the dynamics of toxin-producing cyanobacteria during HCBs. For instance, in the 2015 HCB at William H. Harsha Lake (Clermont County, OH, USA), qPCR and RT-qPCR signals of mcy were successfully established to predict whether total MC would exceed health advisory limits [32]. In this study, HCBs caused by STX-producing cyanobacteria in urban lakes, employing the qPCR assay based on the sxtA gene, were assessed. It is important to highlight that concentrations of MC observed during HCB are generally high, ranging from 1 µg/L to over 100 µg/L, in contrast to the comparatively lower concentrations of STX [33,34]. Despite this discrepancy, a strong correlation between qPCR and STX concentration was observed in Big 11 Lake, which recorded the highest concentration of 0.85 µg/L. However, results from lakes other than Big 11 Lake showed negative or low correlation coefficients (Table 2). This can be attributed to several factors. Firstly, the low concentration of STX and the lack of significant changes during HCBs make it difficult to observe a strong relationship with the abundance of the sxtA gene. Additionally, the weak qPCR signals from the assay, particularly when the abundances of the sxtA gene are low, can also interfere with the correlation between them. For instance, in most lake samples from Cincinnati, PCR amplification of the sxtA gene failed or was not high enough to be sequenced, even though most samples were positive with qPCR signals. Since the major genera of cyanobacteria identified in the Cincinnati samples were mainly Cyanobium and Microcystis, which are not known to produce STXs, it is plausible that the amplified ASV originated from certain non-STX-producing species harboring the sxtA gene. In addition, the absence of STXs in the lakes suggests that the gene is either not transcribed into mRNA or serves a different function unrelated to STX production, such as regulating cellular metabolism or synthesizing secondary metabolites [35,36]. For example, the Scrippsiella trochoidea dinoflagellate, which does not produce STX, was found to have 113 transcripts identified as homologous to sxt genes. These transcripts encompass 17 of the 34 genes present in the sxt genes of Raphidiopsis raciborskii, including the short isoform of sxtA1–A3. Hence, even when cyanotoxin-producing genes are present in abundance, their expression may be low, resulting in limited cyanotoxin production [37]. In order to obtain a more comprehensive understanding of STX production during a bloom, future monitoring efforts should incorporate the evaluation of transcript levels associated with the sxtA gene.
The presumption in this study is that the production of STX and the presence of the sxtA gene are not influenced by a singular environmental variable. Rather, it is likely that they are impacted by an intricate interplay of various factors. STXs can be continuously degraded by natural elements such as bacterioplankton or sunlight in the lake, while several factors, including nutrient input and temperature, can promote the production of cyanotoxins during HCBs. A recent study highlighted the ability of these natural factors to degrade STXs in eutrophic lakes [38,39]. The study found that lake bacterioplankton could decrease STX concentrations by 41–59%, a reduction also observed for four saxitoxin analogs. Furthermore, exposure to natural sunlight for 4–8 h reduced intracellular STXs by 38–52% while simultaneously increasing extracellular dissolved STXs by 7–29%. In line with our initial hypothesis, our findings revealed no substantial correlation between STX or the sxtA gene and any individual parameter (Figure 5). Instead, we did identify several abiotic parameters that exhibited a close association with Aphanizomenon, which is recognized as a potential producer of STX. However, it is important to note that biotic parameters, such as algicidal bacteria and cyanophages, also significantly influence the activity and population dynamics of cyanobacteria [40,41]. Among these parameters, orthophosphate as a P source stood out, demonstrating the highest correlation coefficient. In freshwater systems, P has traditionally limited primary production [42,43]. Under oligotrophic conditions, a scarcity of P tends to enhance STX production, potentially as an adaptive survival strategy in low-P environments [30,44]. However, the exact mechanisms involved are yet to be identified. A previous study demonstrated that elevated P levels, resulting from nutrient loading in Sandusky and Maumee Bays within western Lake Erie (OH, USA), lead to an increase in the relative abundance of Aphanizomenon [45]. This aligns with observations from Big Eleven Lake and Sloans Lake, where orthophosphate concentrations exhibited an upward trend. Specifically, concentrations ranged from 131 µg/L to 194 µg/L in Big Eleven Lake and from 157 µg/L to 303 µg/L in Sloans Lake, respectively (Figure S1). This abundance may be because communities shift towards being dominated by cyanobacteria, especially diazotrophs that can fix N, to meet their N needs when P loads increase.
4. Conclusions
Temporal and spatial variations in cyanobacteria abundances were monitored across eleven urban lakes. The qPCR analysis revealed that the sxtA gene targeting STX producers occurred at all lakes, even though STXs were only detected in the lakes from Kansas City and Denver. Big 11 Lake in Kansas City, where the highest concentration of STX was detected, had a significant correlation with the abundance of the sxtA gene (Rpearson 0.69). Amplicon-based sequencing targeting the sxtA gene showed that a single ASV was dominant across the lake sample, and it was taxonomically assigned to the genera Aphanizomenon and Dolichospermum. Given that, our results showed strong positive correlations between the relative abundances of Aphanizomenon and both sxtA gene abundances and STXs.
Due to the variability in samples along with lake types, the correlation analysis had limitations in revealing significant associations. Nevertheless, the analysis results suggest that the environmental factors, such as orthophosphate, sulfate, PC, and conductivity, corresponded with identified STX-producing taxa. Notably, Aphanizomenon has a strong correlation with orthophosphate. As the occurrence of STX-producing species continues to expand geographically, the insights gained from this study can be valuable in understanding STX production and accurately quantifying STX producers for more effective monitoring of HCB-associated adverse effects.
5. Materials and Methods
5.1. Study Sites and Sample Collection
Sampling sites at eleven lakes near three U.S. metropolitan areas (Kansas City, MO, USA; Cincinnati, OH, USA; and Denver, CO, USA) were chosen based upon having greater than 50% of urban land use in the surrounding area. Sites with the potential for water contact through recreational and angling activities were also considered. The sampling focused on the summer bloom period from June to September in 2021, with additional sampling events prior to bloom development in the spring and following bloom die-off in the fall. The names of the lakes and geographic coordinates of the sampling sites are shown in Table S1 and Figure S1.
5.2. Sample Collection and Measurements of Physicochemical Water Quality Parameters
Sampling was conducted weekly at the same location for each water body. Each sampling event consisted of in situ monitoring, passive sampler deployment, and grab sampling. Teams in each metropolitan area sampled within one day of each other. Samples were taken from shore or from fishing platforms in the top 0.5 m (photic zone) of the water column via stainless-steel pitchers. At each sampling event, a sample of approximately 3.5 L of water was collected using a stainless-steel cup attached to the end of a sampling pole. Several cups of water were used to fill a pitcher with the sample, which was then mixed and distributed into sample containers. Each cup was collected from approximately the same location and within 0.5 m of the lake’s surface. After collection, samples were split among coolers with ice and shipped on the same day to ensure that they arrived at the destination laboratory the following day. Filtration (pore size 0.45 μm; MilliPore; Foster City, CA, USA) occurred in the field for dissolved orthophosphate and in the laboratory for qPCR analysis.
Water quality meters (EXO1 Multiparameter Sonde or ProDSS Multiparameter, YSI Inc., USA) were utilized to measure physicochemical water quality parameters in situ. These parameters included temperature, dissolved oxygen, pH, conductivity, turbidity, and phycocyanin (PC). Meters were calibrated locally prior to each event according to in-house SOPs and manufacturer’s directions.
Chlorophyll a (CHL) was determined using EPA Method 445.0. Cell count was determined along with cyanobacterial identification utilizing FlowCam 8400 (Yokogawa Fluid Imaging Technologies, Scarborough, ME, USA). In addition, the counting chamber and light microscopy were utilized to count filamentous cells. Alkalinity was determined via Standard Method 2320B-1997. Anions, including chloride and sulfate, were analyzed according to EPA Method 300.0. Nitrate and nitrite were frozen upon arrival and analyzed according to EPA Method 353.2 and EPA Method 353.4, respectively. Dissolved orthophosphate as P was also frozen, then analyzed per EPA Method 365.5. For these analyses, a Lachat QC-8500 Flow Injection Autoanlyzer (Lachat Instruments, Loveland, CO, USA) and a Formacs TOC/TN analyzer (Skalar, Breda, The Netherlands) were used. For STXs, total toxin concentrations were determined following a triple freeze–thaw cycle to lyse cells, and an enzyme-linked immunosorbent assay (ELISA) was utilized by following the manufacturer’s procedure. Briefly, 50 µL of each standard (0.15 to 5 μg/L) and 50 µL of sample were dispensed into the ELISA wells, along with 50 µL of the antibody solution. The plate was then covered, gently swirled for 30 s, and allowed to incubate in the dark for 90 min. The contents were then poured out, and the plate was washed three times with 250 µL of wash buffer. Each well was filled with 100 µL of enzyme conjugate solution and left to incubate for 30 min. The plate was washed again with the wash buffer. Then, 100 µL of substrate color solution was added to each well. The plate was swirled for 30 s, incubated in the dark for 25 min, and, finally, 50 µL of stop solution was added. The plate was read at a wavelength of 450 nm using a Synergy H1 microplate reader, and the data were analyzed using a 4-parameter standard curve [46].
5.3. DNA Extraction and qPCR
Collected samples were filtered using a 0.45 polycarbonate µm membrane filter (Pall Corporation, Port Washington, NY, USA). The filters with captured biomass were stored in Lysing Matrix A tubes (MP Biomedicals, Irvine, CA, USA) with a cell lysis buffer (600 µL) and RNase inhibitor (QIAGEN, San Diego, CA, USA). The mixtures were stored at −80 °C before DNA extraction. Cell lysis was conducted for 1 min using a Mini-Beadbeater-16 (BioSpec Products, Inc., Bartlesville, OK, USA). After shaking, the tubes were centrifuged at 10,000× g for 3 min at room temperature, and the supernatant was transferred to a new tube. DNA in the supernatant was purified using the AllPrep DNA/RNA Mini Kit (QIAGEN). The concentration of purified DNA was measured by a Qubit® 2.0 Fluorometer (Thermofisher, Waltham, MA, USA) and stored at −20 °C for future analysis.
To determine the abundances in the lake samples of the sxtA gene that encodes STXs, SYBR® Green was used to perform qPCR on a QuantStudio™ 6 Flex System (Life Technologies Co., Carlsbad, CA, USA) [20,32,47,48]. It should be noted that general cyanobacterial STX producers with sxtA gene were targeted (Table S2). Each reaction was composed of 10 μL of 2X SYBR® Green Master Mix (Life Technologies Co.), 0.25 μM of primers (Integrated DNA Technologies, Inc., Coralville, IA, USA), 2 µL of 1 mg/mL BSA, and 2 μL of template DNA in a total reaction volume of 20 μL. The following thermal cycling conditions were applied: 40 cycles of 95 °C for 15 s, annealing temperatures of 60 °C for 1 min, and a hold step at 72 °C for 5 min, followed by melt curve analysis. The DNA was quantified against the series of standards constructed in-house [20]. The standard series of sxtA were generated from DNA isolated from water samples from Harsha Lake using conventional PCR and cloned into Invitrogen’s PCR4 vector using the TOPO TA cloning kit. Each quantification was performed in triplicate on a qPCR plate, which included a six-point standard curve with target gene concentrations ranging from 106 to 101 GCN·μL−1 (GCN: genome or gene copy number), using a tenfold serial dilution. PCR inhibition was manually checked by measuring 10-fold diluted DNA extracts using qPCR, and data points where significant PCR inhibition was detected were removed following an established protocol [48].
5.4. sxtA Target Sequencing, 16S rRNA Amplicon Sequencing, and Analysis
Each sxtA target sequencing, including sxtA PCR, library preparation, and sequencing, was conducted as described previously with some modifications [49]. First, primers were designed using gene-specific sequences for the cyanobacteria sxtA gene (Table S2). After that, PCR was performed using 17 μL of Accuprime pfx supermix (Thermofisher, Waltham, MA, USA), 0.5 µL of primers at 10 µM concentration, and 2 μL of prepared DNA. Positive (plasmid clone of sxtA isolated from Harsha Lake, described above) and negative (blank water) controls were included. Samples that failed to amplify (as examined by gel electrophoresis) were removed from further analysis. Successfully amplified samples were then cleaned using 14 µL of AMPure XP beads (Beckman Coulter, Brea, CA, USA) with 17 µL of PCR products and eluted in 40 µL of 10 mM Tris (pH 8.5). The cleaned PCR products were normalized at 10 ng/µL, and index PCR was carried out using Accuprime pfx supermix. Further, 17 µL of each PCR product was cleaned with 19 µL of AMPure XP and eluted in 27 µL of 10 mM Tris (pH 8.5). Normalized Libraries (2 nM) were pooled for sequencing using a V3 MiSeq sequencing kit with a 2 × 300, 600 cycle according to the manufacturer’s protocol (Illumina, San Diego, CA, USA).
High-throughput 16S rRNA gene sequencing was also performed to assess changes in microbial communities during the bloom events in the urban lakes in 2021. The sequencing procedure followed the same protocol described for the sxtA target sequencing and the primer set targeting the 16S V3-V4 was used.
The raw FASTQ data generated from both sequencings were de-multiplexed using default parameters within the MiSeq Illumina workflow. After removing primers and adaptors, Quantitative Insights Into Microbial Ecology (QIIME2 v2022.02) was used to analyze and de-multiplex paired sequences [50]. Sequences were denoised via the DADA2 plugin, and representative amplicon sequence variants (ASVs) were created with a feature table [51]. The ASVs from 16s rRNA amplicon sequencing were taxonomically assigned using a 16S V4 region-specific classifier based on the SILVA database version 138. For ASVs from sxtA target sequencing, MUSCLE and MEGAX [52] were employed to translate and align each ASV, removing those that did not code for the sxtA protein or contained stop codons. ASVs that passed quality checks were assessed by using BLAST of NCBI (www.blast.ncbi.nlm.nih.gov/Blast.cgi, accessed on 13 March 2023), and their taxonomic origin was identified.
5.5. Data Analysis and Visualization
R version 4.1.3 was used to analyze the final dataset with the help of packages, such as “phyloseq”, “vegan”, “pheatmap”, and “ggplot2” [53,54,55,56]. Different estimates of alpha diversity, such as Chao1 and Shannon Index, were computed, and beta diversity, which denotes the similarities between different bacterial community samples, was analyzed using weighted and unweighted UniFrac metrics. To test for statistically significant differences in community composition and structure between groups, permutational multivariate analysis of variance (PERMANOVA) and non-metric multidimensional scaling (NMDS) were used with the adonis function from the “vegan” package, “ade4”, and “ggplot2” in R. The ‘vegan’ package is recognized for its use in ecological studies and community ecology analyses, particularly through its adonis function for PERMANOVA, which considers the permutation of data points to obtain robust results. NMDS is a dimensionality reduction technique used for visualizing and exploring patterns in multivariate data. Generally, as a rule of thumb, stress values of <0.1 are considered a very good fit, values <0.2 are considered a good fit, and those approaching 0.3 are a poor fit. In addition, eclipses covering 95% of the population were applied to the area of each city. ‘ade4′ provides various methods for multivariate analysis, while ‘ggplot2′ was utilized for data visualizations. Canonical correspondence analysis (CCA) was used to establish the correlation between the abundances of toxin-producing genes and physicochemical water quality parameters via the vegan package, and redundancy analysis (RDA) was employed to explore the relationships between bacterial community structure and the water quality parameters [56].
Supplementary Materials
The following supporting information can be downloaded at: https://www.mdpi.com/article/10.3390/toxins16020070/s1. Figure S1: Sampling sites in the urban lakes of Cincinnati (A), Kansas City (B), and Denver (C); Figure S2: Nitrite (blue), nitrate (red), orthophosphate (gray), and concentrations in the lakes of Kansas City, Cincinnati, and Denver; Table S1: Sampling sites information; Table S2: Parameters for SYBR® Green qPCR assays; Table S3: Physicochemical water parameters in the lakes of Kansas City, Cincinnati, and Denver.
Author Contributions
Y.J.: Conceptualization, formal analysis, visualization writing—original draft, writing—review and editing; H.M.: data curation, investigation, validation; L.W.: data curation, investigation, validation; M.T.: data curation, investigation, validation; K.M.: data curation, investigation; I.S.: methodology, data curation, investigation, validation, writing—review and editing; H.R.: writing—review and editing; J.L.: conceptualization, project administration, funding acquisition, writing—review and editing. All authors have read and agreed to the published version of the manuscript.
Funding
This research was supported by the Office of Research and Development, U.S. EPA under its research program: Safe and Sustainable Water Resources (SSWR) 404.1.3 and U.S. EPA Regional Applied Research Effort Project (U.S. EPA ROAR FY21).
Institutional Review Board Statement
Not applicable.
Informed Consent Statement
Not applicable.
Data Availability Statement
All data have been deposited in the NCBI sequence read archive at accession number: PRJNA991726 and PRJNA992779.
Conflicts of Interest
The authors declare no conflicts of interest.
Disclaimer
The views expressed in this manuscript are those of the authors and do not necessarily represent the views or policies of the U.S. EPA. It has been subjected to Agency review and approved for publication. Any use of trade, firm, or product names is for descriptive purposes only and does not imply endorsement by the U.S. Government.
References
- Munoz, M.; Nieto-Sandoval, J.; Cirés, S.; de Pedro, Z.M.; Quesada, A.; Casas, J.A. Degradation of widespread cyanotoxins with high impact in drinking water (microcystins, cylindrospermopsin, anatoxin-a and saxitoxin) by CWPO. Water Res. 2019, 163, 114853. [Google Scholar] [CrossRef]
- Pearson, L.; Mihali, T.; Moffitt, M.; Kellmann, R.; Neilan, B. On the chemistry, toxicology and genetics of the cyanobacterial toxins, microcystin, nodularin, saxitoxin and cylindrospermopsin. Mar. Drugs 2010, 8, 1650–1680. [Google Scholar] [CrossRef]
- Oshima, Y.; Blackburn, S.; Hallegraeff, G. Comparative study on paralytic shellfish toxin profiles of the dinoflagellate Gymnodinium catenatum from three different countries. Mar. Biol. 1993, 116, 471–476. [Google Scholar] [CrossRef]
- Garcıa, C.; del Carmen Bravo, M.; Lagos, M.; Lagos, N. Paralytic shellfish poisoning: Post-mortem analysis of tissue and body fluid samples from human victims in the Patagonia fjords. Toxicon 2004, 43, 149–158. [Google Scholar] [CrossRef]
- Gessner, B.D.; Bell, P.; Doucette, G.J.; Moczydlowski, E.; Poli, M.A.; Van Dolah, F.; Hall, S. Hypertension and identification of toxin in human urine and serum following a cluster of mussel-associated paralytic shellfish poisoning outbreaks. Toxicon 1997, 35, 711–722. [Google Scholar] [CrossRef]
- Wiese, M.; D’Agostino, P.M.; Mihali, T.K.; Moffitt, M.C.; Neilan, B.A. Neurotoxic alkaloids: Saxitoxin and its analogs. Mar. Drugs 2010, 8, 2185–2211. [Google Scholar] [CrossRef]
- Llewellyn, L.E. Saxitoxin, a toxic marine natural product that targets a multitude of receptors. Nat. Prod. Rep. 2006, 23, 200–222. [Google Scholar] [CrossRef] [PubMed]
- Aguilera, A.; Gómez, E.B.; Kaštovský, J.; Echenique, R.O.; Salerno, G.L. The polyphasic analysis of two native Raphidiopsis isolates supports the unification of the genera Raphidiopsis and Cylindrospermopsis (Nostocales, Cyanobacteria). Phycologia 2018, 57, 130–146. [Google Scholar] [CrossRef]
- Negri, A.P.; Jones, G.J.; Hindmarsh, M. Sheep mortality associated with paralytic shellfish poisons from the cyanobacterium Anabaena circinalis. Toxicon 1995, 33, 1321–1329. [Google Scholar] [CrossRef] [PubMed]
- Kellmann, R.; Mihali, T.K.; Jeon, Y.J.; Pickford, R.; Pomati, F.; Neilan, B.A. Biosynthetic intermediate analysis and functional homology reveal a saxitoxin gene cluster in cyanobacteria. Appl. Environ. Microbiol. 2008, 74, 4044–4053. [Google Scholar] [CrossRef]
- Mihali, T.K.; Kellmann, R.; Neilan, B.A. Characterisation of the paralytic shellfish toxin biosynthesis gene clusters in Anabaena circinalis AWQC131C and Aphanizomenon sp. NH-5. BMC Biochem. 2009, 10, 8. [Google Scholar] [CrossRef]
- Mihali, T.K.; Carmichael, W.W.; Neilan, B.A. A putative gene cluster from a Lyngbya wollei bloom that encodes paralytic shellfish toxin biosynthesis. PLoS ONE 2011, 6, e14657. [Google Scholar] [CrossRef]
- Pereyra, J.P.; D’Agostino, P.M.; Mazmouz, R.; Woodhouse, J.N.; Pickford, R.; Jameson, I.; Neilan, B.A. Molecular and morphological survey of saxitoxin-producing cyanobacterium Dolichospermum circinale (Anabaena circinalis) isolated from geographically distinct regions of Australia. Toxicon 2017, 138, 68–77. [Google Scholar] [CrossRef] [PubMed]
- Podduturi, R.; Schlüter, L.; Liu, T.; Osti, J.A.S.; Moraes, M.d.A.B.; Jørgensen, N.O. Monitoring of saxitoxin production in lakes in Denmark by molecular, chromatographic and microscopic approaches. Harmful Algae 2021, 101, 101966. [Google Scholar] [CrossRef] [PubMed]
- Goel, P. Water Pollution: Causes, Effects and Control; New Age International: New Delhi, India, 2006. [Google Scholar]
- Dallas, H.F.; Day, J.A. The Effect of Water Quality Variables on Aquatic Ecosystems: A Review; Water Research Commission Pretoria: Pretoria, South Africa, 2004. [Google Scholar]
- Beversdorf, L.J.; Rude, K.; Weirich, C.A.; Bartlett, S.L.; Seaman, M.; Kozik, C.; Biese, P.; Gosz, T.; Suha, M.; Stempa, C. Analysis of cyanobacterial metabolites in surface and raw drinking waters reveals more than microcystin. Water Res. 2018, 140, 280–290. [Google Scholar] [CrossRef] [PubMed]
- Rastogi, R.P.; Madamwar, D.; Incharoensakdi, A. Bloom dynamics of cyanobacteria and their toxins: Environmental health impacts and mitigation strategies. Front. Microbiol. 2015, 6, 1254. [Google Scholar] [CrossRef] [PubMed]
- Preece, E.P.; Hardy, F.J.; Moore, B.C.; Bryan, M. A review of microcystin detections in Estuarine and Marine waters: Environmental implications and human health risk. Harmful Algae 2017, 61, 31–45. [Google Scholar] [CrossRef]
- Lu, J.; Struewing, I.; Wymer, L.; Tettenhorst, D.R.; Shoemaker, J.; Allen, J. Use of qPCR and RT-qPCR for monitoring variations of microcystin producers and as an early warning system to predict toxin production in an Ohio inland lake. Water Res. 2020, 170, 115262. [Google Scholar] [CrossRef] [PubMed]
- Duan, X.; Zhang, C.; Struewing, I.; Li, X.; Allen, J.; Lu, J. Cyanotoxin-encoding genes as powerful predictors of cyanotoxin production during harmful cyanobacterial blooms in an inland freshwater Lake: Evaluating a novel early-warning system. Sci. Total Environ. 2022, 830, 154568. [Google Scholar] [CrossRef]
- Paerl, H.W.; Gardner, W.S.; Havens, K.E.; Joyner, A.R.; McCarthy, M.J.; Newell, S.E.; Qin, B.; Scott, J.T. Mitigating cyanobacterial harmful algal blooms in aquatic ecosystems impacted by climate change and anthropogenic nutrients. Harmful Algae 2016, 54, 213–222. [Google Scholar] [CrossRef]
- Jing, Y.S.; Jing, Z.H.; Hu, J.Y.; Chen, F. Meteorological conditions influences on the variability of algae bloom in Taihu Lake and its risk prediction. Appl. Mech. Mater. 2013, 253, 935–938. [Google Scholar] [CrossRef]
- Paerl, H.W.; Huisman, J. Blooms like it hot. Science 2008, 320, 57–58. [Google Scholar] [CrossRef]
- Torres, C.d.A.; Lürling, M.; Marinho, M.M. Assessment of the effects of light availability on growth and competition between strains of Planktothrix agardhii and Microcystis aeruginosa. Microb. Ecol. 2016, 71, 802–813. [Google Scholar] [CrossRef] [PubMed]
- Paerl, H.W.; Otten, T.G. Duelling ‘CyanoHABs’: Unravelling the environmental drivers controlling dominance and succession among diazotrophic and non-N2-fixing harmful cyanobacteria. Environ. Microbiol. 2016, 18, 316–324. [Google Scholar] [CrossRef] [PubMed]
- Ma, H.; Wu, Y.; Gan, N.; Zheng, L.; Li, T.; Song, L. Growth inhibitory effect of Microcystis on Aphanizomenon flos-aquae isolated from cyanobacteria bloom in Lake Dianchi, China. Harmful Algae 2015, 42, 43–51. [Google Scholar] [CrossRef]
- Jin, H.; Ma, H.; Gan, N.; Wang, H.; Li, Y.; Wang, L.; Song, L. Non-targeted metabolomic profiling of filamentous cyanobacteria Aphanizomenon flos-aquae exposed to a concentrated culture filtrate of Microcystis aeruginosa. Harmful Algae 2022, 111, 102170. [Google Scholar] [CrossRef] [PubMed]
- Oberhaus, L.; Briand, J.-F.; Humbert, J.-F. Allelopathic growth inhibition by the toxic, bloom-forming cyanobacterium Planktothrix rubescens. FEMS Microbiol. Ecol. 2008, 66, 243–249. [Google Scholar] [CrossRef] [PubMed]
- Moraes, M.A.; Rodrigues, R.A.; Schlüter, L.; Podduturi, R.; Jørgensen, N.O.; Calijuri, M.C. Influence of environmental factors on occurrence of cyanobacteria and abundance of saxitoxin-producing cyanobacteria in a subtropical drinking water reservoir in Brazil. Water 2021, 13, 1716. [Google Scholar] [CrossRef]
- Hoff-Risseti, C.; Doerr, F.A.; Schaker, P.D.C.; Pinto, E.; Werner, V.R.; Fiore, M.F. Cylindrospermopsin and saxitoxin synthetase genes in Cylindrospermopsis raciborskii strains from Brazilian freshwater. PLoS ONE 2013, 8, e74238. [Google Scholar] [CrossRef]
- Chen, K.; Allen, J.; Lu, J. Community structures of phytoplankton with emphasis on toxic cyanobacteria in an Ohio inland lake during bloom season. J. Water Resour. Prot. 2017, 9, 1. [Google Scholar] [CrossRef]
- Harke, M.J.; Steffen, M.M.; Gobler, C.J.; Otten, T.G.; Wilhelm, S.W.; Wood, S.A.; Paerl, H.W. A review of the global ecology, genomics, and biogeography of the toxic cyanobacterium, Microcystis spp. Harmful Algae 2016, 54, 4–20. [Google Scholar] [CrossRef]
- Patiño, R.; Christensen, V.G.; Graham, J.L.; Rogosch, J.S.; Rosen, B.H. Toxic algae in inland waters of the conterminous United States—A review and synthesis. Water 2023, 15, 2808. [Google Scholar] [CrossRef]
- Akbar, M.A.; Mohd Yusof, N.Y.; Tahir, N.I.; Ahmad, A.; Usup, G.; Sahrani, F.K.; Bunawan, H. Biosynthesis of saxitoxin in marine dinoflagellates: An omics perspective. Mar. Drugs 2020, 18, 103. [Google Scholar] [CrossRef] [PubMed]
- Biecker, A.L.; Liu, X.; Thorson, J.S.; Yang, Z.; Van Lanen, S.G. Biosynthetic and synthetic strategies for assembling capuramycin-type antituberculosis antibiotics. Molecules 2019, 24, 433. [Google Scholar] [CrossRef] [PubMed]
- Duan, Y.; Zeng, S.; Lu, Z.; Dan, X.; Mo, Z.; Xing, Y.; Zhang, J.; Li, Y. Responses of lipid metabolism and lipidomics in the hepatopancreas of Pacific white shrimp Litopenaeus vannamei to microcystin-LR exposure. Sci. Total Environ. 2022, 820, 153245. [Google Scholar] [CrossRef] [PubMed]
- Jørgensen, N.O.; Podduturi, R.; Michelsen, C.F.; Jepsen, T.; Moraes, M.d.A.B. Fate of Saxitoxins in Lake Water: Preliminary Testing of Degradation by Microbes and Sunlight. Water 2022, 14, 3556. [Google Scholar] [CrossRef]
- de Figueiredo, D.R.; Lopes, A.R.; Pereira, M.J.; Polónia, A.R.; Castro, B.B.; Gonçalves, F.; Gomes, N.C.; Cleary, D.F. Bacterioplankton Community Shifts during a Spring Bloom of Aphanizomenon gracile and Sphaerospermopsis aphanizomenoides at a Temperate Shallow Lake. Hydrobiology 2022, 1, 499–517. [Google Scholar] [CrossRef]
- Morón-López, J.; Serwecińska, L.; Balcerzak, Ł.; Glińska, S.; Mankiewicz-Boczek, J. Algicidal bacteria against cyanobacteria: Practical knowledge from laboratory to application. Crit. Rev. Environ. Sci. Technol. 2024, 54, 239–266. [Google Scholar] [CrossRef]
- Antosiak, A.; Šulčius, S.; Malec, P.; Tokodi, N.; Łobodzińska, A.; Dziga, D. Cyanophage infections reduce photosynthetic activity and expression of CO2 fixation genes in the freshwater bloom-forming cyanobacterium Aphanizomenon flos-aquae. Harmful Algae 2022, 116, 102215. [Google Scholar] [CrossRef]
- Edmondson, W. Phosphorus, nitrogen, and algae in Lake Washington after diversion of sewage. Science 1970, 169, 690–691. [Google Scholar] [CrossRef]
- Ziegler, L.; Lange, J.; Smolka, U.; Muskulus, M. The decision on the time to switch from lifetime extension to repowering. In Proceedings of the Wind Europe Summit 2016, Hamburg, Germany, 27–29 September 2016. [Google Scholar]
- Vargas, S.R.; dos Santos, P.V.; Bottino, F.; Calijuri, M.d.C. Effect of nutrient concentration on growth and saxitoxin production of Raphidiopsis raciborskii (Cyanophyta) interacting with Monoraphidium contortum (Chlorophyceae). J. Appl. Phycol. 2020, 32, 421–430. [Google Scholar] [CrossRef]
- Jankowiak, J.; Hattenrath-Lehmann, T.; Kramer, B.J.; Ladds, M.; Gobler, C.J. Deciphering the effects of nitrogen, phosphorus, and temperature on cyanobacterial bloom intensification, diversity, and toxicity in western Lake Erie. Limnol. Oceanogr. 2019, 64, 1347–1370. [Google Scholar] [CrossRef]
- Birbeck, J.A.; Westrick, J.A.; O’Neill, G.M.; Spies, B.; Szlag, D.C. Comparative analysis of microcystin prevalence in Michigan lakes by online concentration LC/MS/MS and ELISA. Toxins 2019, 11, 13. [Google Scholar] [CrossRef]
- Lu, J.; Zhu, B.; Struewing, I.; Xu, N.; Duan, S. Nitrogen–phosphorus-associated metabolic activities during the development of a cyanobacterial bloom revealed by metatranscriptomics. Sci. Rep. 2019, 9, 2480. [Google Scholar] [CrossRef] [PubMed]
- Zhang, C.; Struewing, I.; Mistry, J.H.; Wahman, D.G.; Pressman, J.; Lu, J. Legionella and other opportunistic pathogens in full-scale chloraminated municipal drinking water distribution systems. Water Res. 2021, 205, 117571. [Google Scholar] [CrossRef] [PubMed]
- Bagley, M.; Pilgrim, E.; Knapp, M.; Yoder, C.; Santo Domingo, J.; Banerji, A. High-throughput environmental DNA analysis informs a biological assessment of an urban stream. Ecol. Indic. 2019, 104, 378–389. [Google Scholar] [CrossRef] [PubMed]
- Bolyen, E.; Rideout, J.R.; Dillon, M.R.; Bokulich, N.A.; Abnet, C.C.; Al-Ghalith, G.A.; Alexander, H.; Alm, E.J.; Arumugam, M.; Asnicar, F. Reproducible, interactive, scalable and extensible microbiome data science using QIIME 2. Nat. Biotechnol. 2019, 37, 852–857. [Google Scholar] [CrossRef]
- Callahan, B.J.; McMurdie, P.J.; Rosen, M.J.; Han, A.W.; Johnson, A.J.A.; Holmes, S.P. DADA2: High-resolution sample inference from Illumina amplicon data. Nat. Methods 2016, 13, 581–583. [Google Scholar] [CrossRef]
- Kumar, S.; Stecher, G.; Li, M.; Knyaz, C.; Tamura, K. MEGA X: Molecular evolutionary genetics analysis across computing platforms. Mol. Biol. Evol. 2018, 35, 1547. [Google Scholar] [CrossRef]
- R Core Team. R: A Language and Environment for Statistical Computing. 2009. Available online: http://www.R-project.org (accessed on 13 March 2023).
- Abdi, H.; Williams, L.J. ggplot2. Computational statistics. Wiley Interdiscip. Rev. 2011, 3, 180–185. [Google Scholar]
- McMurdie, P.J.; Holmes, S. phyloseq: An R package for reproducible interactive analysis and graphics of microbiome census data. PLoS ONE 2013, 8, e61217. [Google Scholar] [CrossRef]
- Dixon, P. VEGAN, a package of R functions for community ecology. J. Veg. Sci. 2003, 14, 927–930. [Google Scholar] [CrossRef]


Disclaimer/Publisher’s Note: The statements, opinions and data contained in all publications are solely those of the individual author(s) and contributor(s) and not of MDPI and/or the editor(s). MDPI and/or the editor(s) disclaim responsibility for any injury to people or property resulting from any ideas, methods, instructions or products referred to in the content. |
© 2024 by the authors. Licensee MDPI, Basel, Switzerland. This article is an open access article distributed under the terms and conditions of the Creative Commons Attribution (CC BY) license (https://creativecommons.org/licenses/by/4.0/).