Occurrence and Exposure Assessment of Major Mycotoxins in Foodstuffs from Algeria


Abstract
1. Introduction
2. Materials and Methods
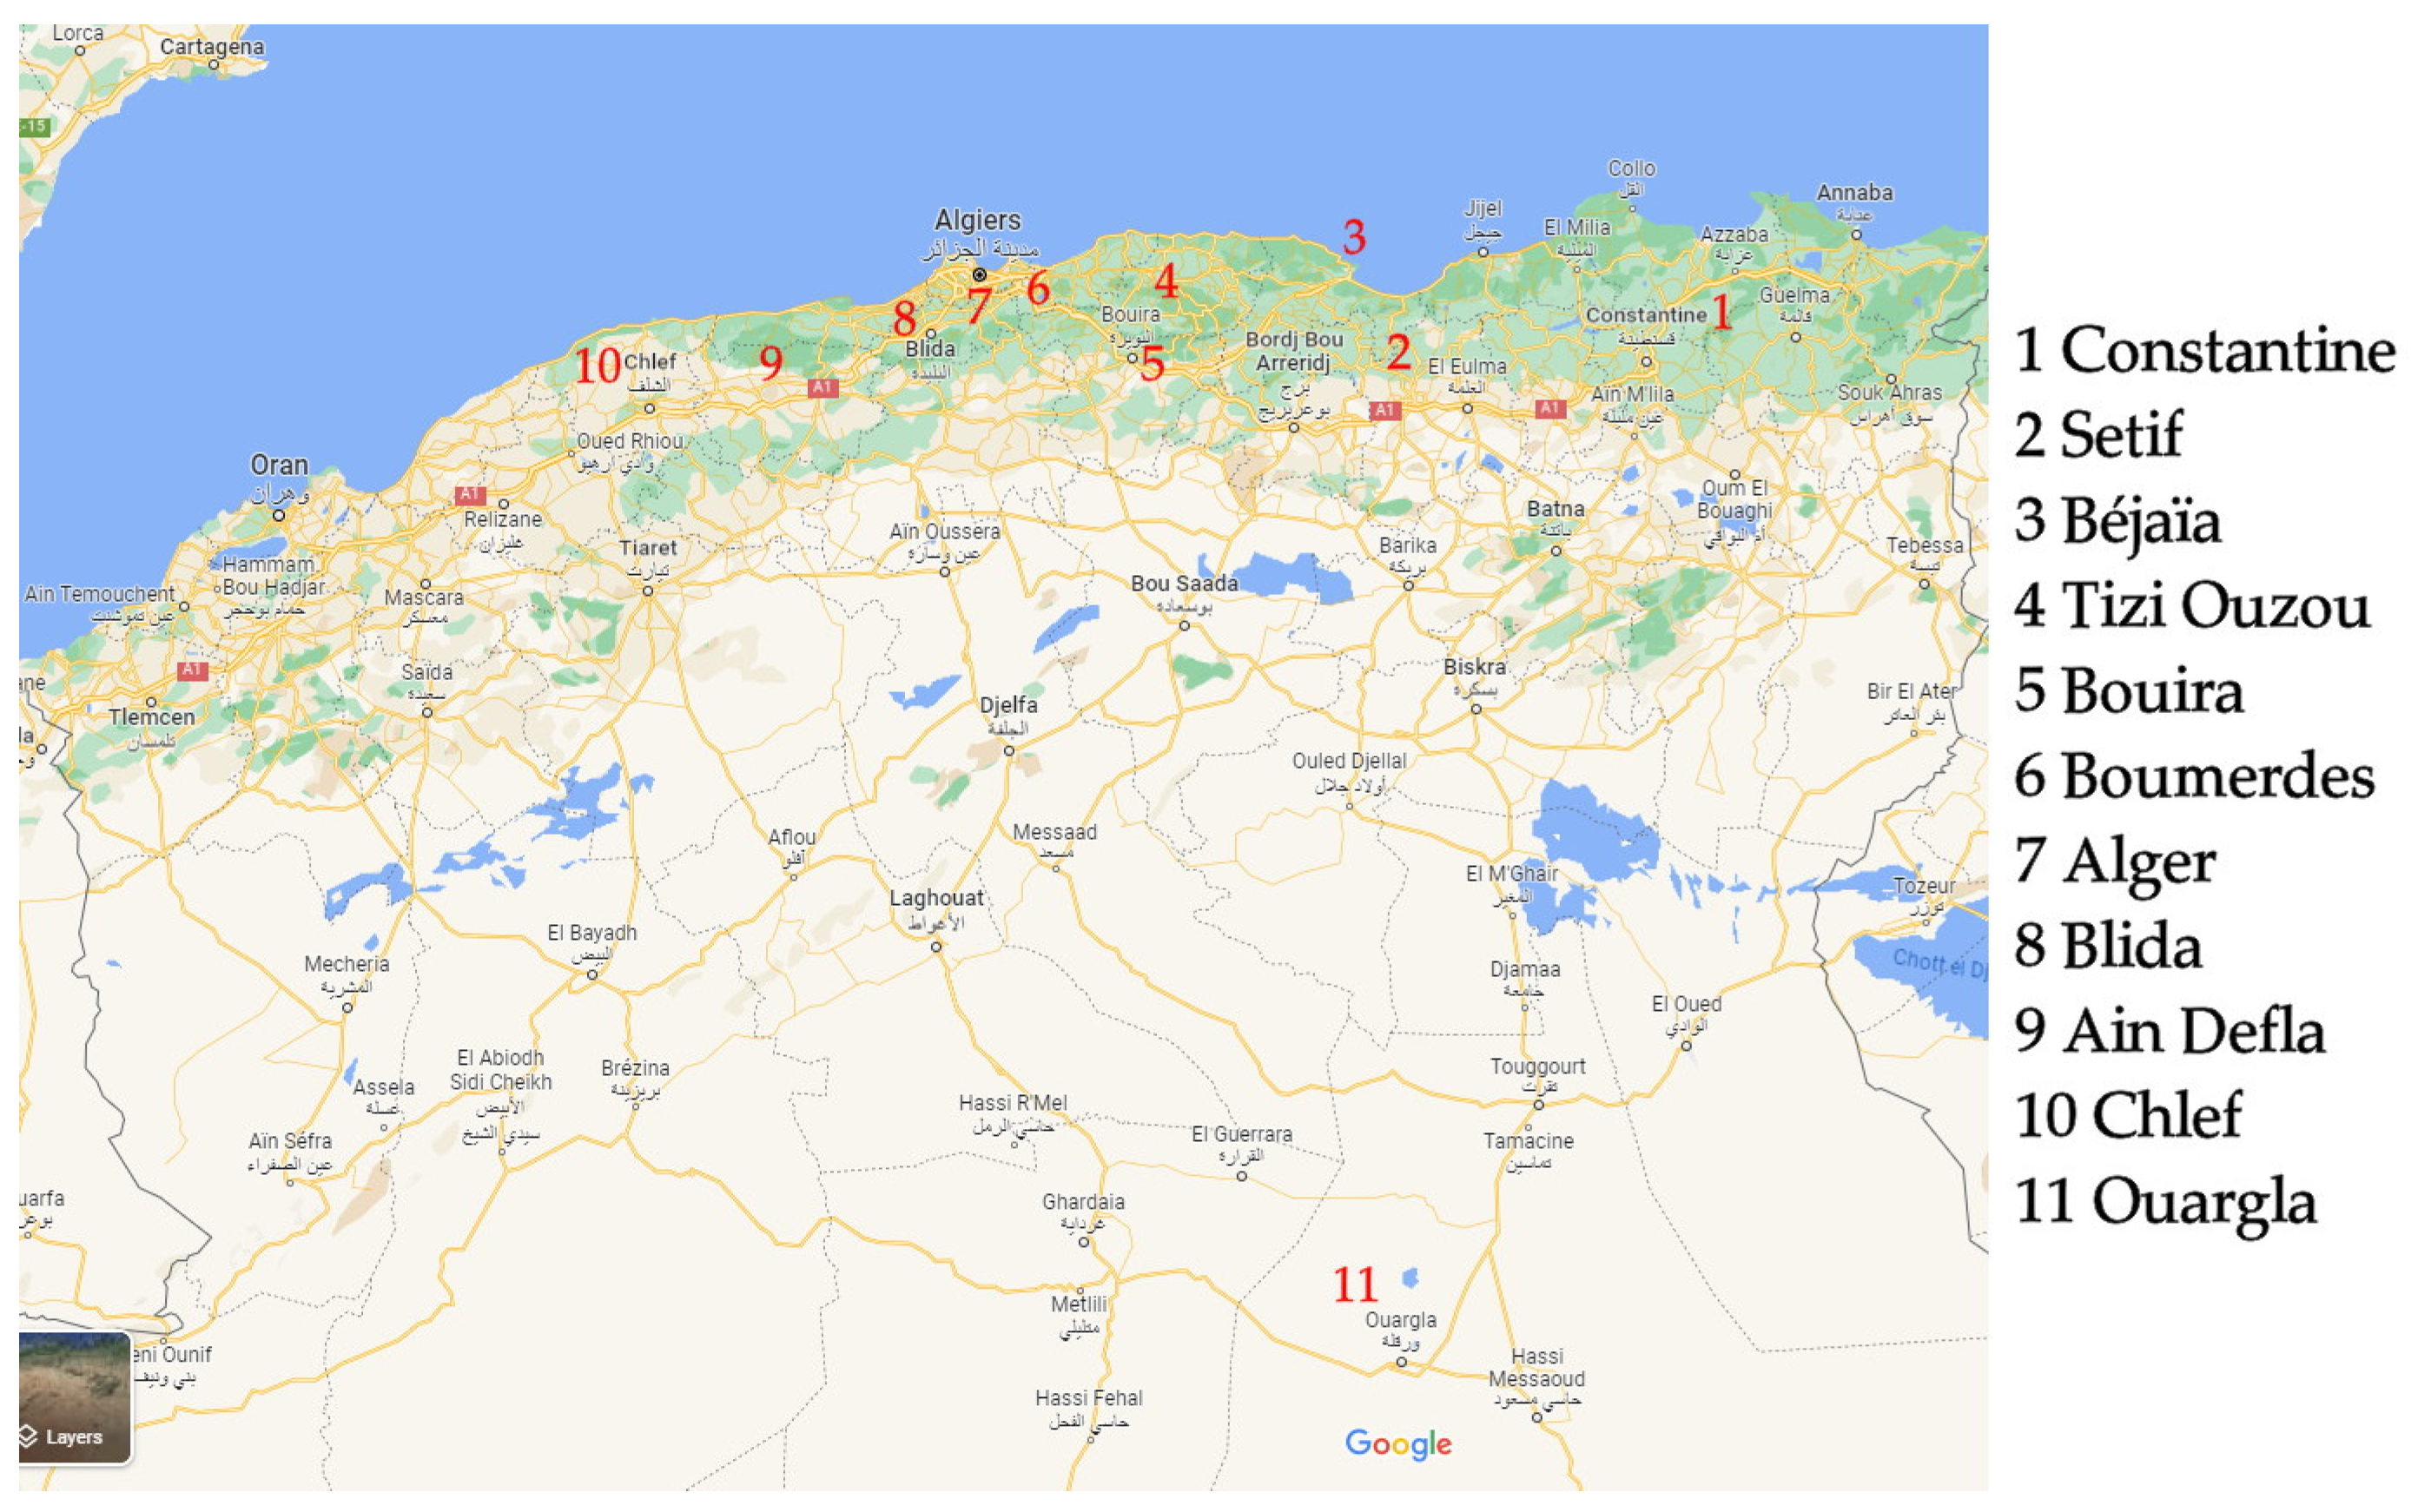
2.1. Study Area and Sample Collection
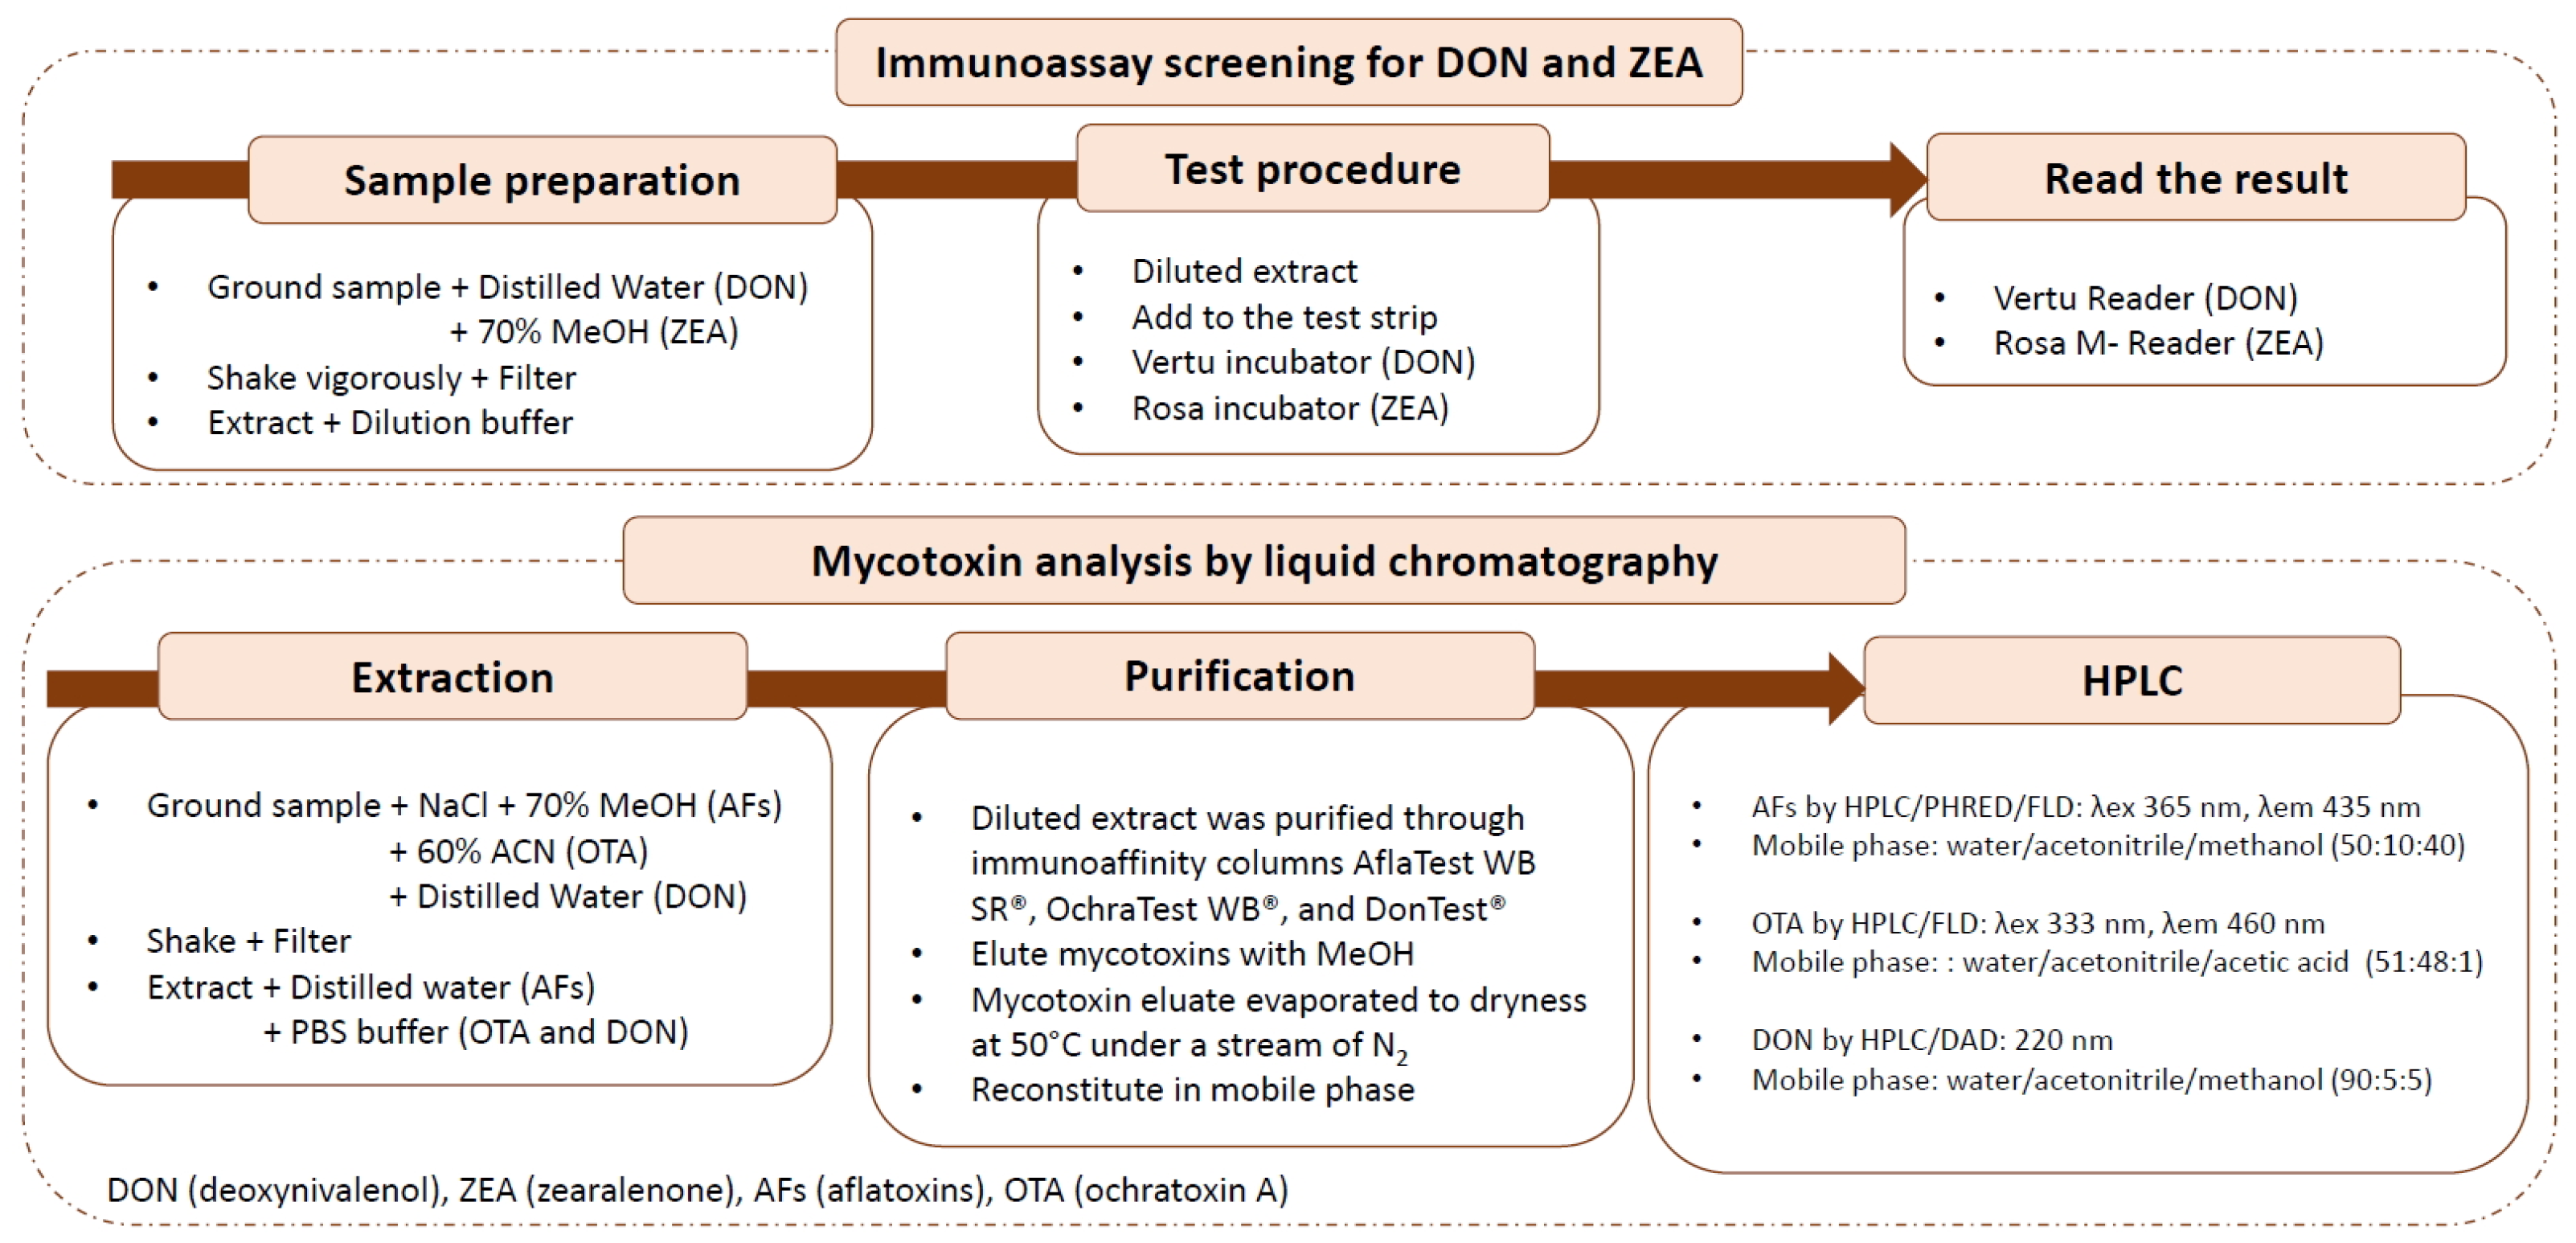
2.2. Preliminary Screening Procedure for Deoxynivalenol and Zearalenone
2.3. Chemicals and Reagents for Chromatographic Analysis
2.4. HPLC Equipment and Chromatographic Conditions
2.5. Mycotoxin Analysis by HPLC
2.6. Data Analysis
3. Results and Discussion
3.1. Mycotoxin Occurrence Data
3.1.1. Occurrences of Aflatoxins and Ochratoxin A in Nuts
3.1.2. Occurrences of Aflatoxins and Ochratoxin A in Dried Fruits
3.1.3. Occurrences of Major Mycotoxins in Cereal-Based Products
3.2. Exposure Assessment and Risk Characterization
4. Conclusions
Supplementary Materials
Author Contributions
Funding
Institutional Review Board Statement
Informed Consent Statement
Data Availability Statement
Conflicts of Interest
References
- Cimbalo, A.; Alonso-Garrido, M.; Font, G.; Manyes, L. Toxicity of mycotoxins in vivo on vertebrate organisms: A review. Food Chem. Toxicol. 2020, 137, 111161. [Google Scholar] [CrossRef]
- Eskola, M.; Kos, G.; Elliott, C.T.; Hajšlová, J.; Mayar, S.; Krska, R. Worldwide contamination of food-crops with mycotoxins: Validity of the widely cited ‘FAO estimate’of 25%. Crit. Rev. Food Sci. Nutr. 2020, 60, 2773–2789. [Google Scholar] [CrossRef]
- Ünüsan, N. Systematic review of mycotoxins in food and feeds in Turkey. Food Control 2019, 97, 1–14. [Google Scholar] [CrossRef]
- Köppen, R.; Koch, M.; Siegel, D.; Merkel, S.; Maul, R.; Nehls, I. Determination of mycotoxins in foods: Current state of analytical methods and limitations. Appl. Microbiol. Biotechnol. 2010, 86, 1595–1612. [Google Scholar] [CrossRef] [PubMed]
- Riba, A.; Bouras, N.; Mokrane, S.; Mathieu, F.; Lebrihi, A.; Sabaou, N. Aspergillus section Flavi and aflatoxins in Algerian wheat and derived products. Food Chem. Toxicol. 2010, 48, 2772–2777. [Google Scholar] [CrossRef] [PubMed]
- Ait Mimoune, N.; Arroyo-Manzanares, N.; Gámiz-Gracia, L.; García-Campaña, A.M.; Bouti, K.; Sabaou, N.; Riba, A. Aspergillus section Flavi and aflatoxins in dried figs and nuts in Algeria. Food Addit. Contam. Part B-Surveill. 2018, 11, 119–125. [Google Scholar] [CrossRef]
- Tantaoui-Elaraki, A.; Riba, A.; Oueslati, S.; Zinedine, A. Toxigenic fungi and mycotoxin occurrence and prevention in food and feed in northern Africa—A review. World Mycotoxin J. 2018, 11, 385–400. [Google Scholar] [CrossRef]
- Chilaka, C.A.; Obidiegwu, J.E.; Chilaka, A.C.; Atanda, O.O.; Mally, A. Mycotoxin regulatory status in Africa: A decade of weak institutional efforts. Toxins 2022, 14, 442. [Google Scholar] [CrossRef] [PubMed]
- Van Egmond, H.P.; Jonker, M.A. Worldwide Regulations for Mycotoxins in Food and Feed in 2003; Food and Agriculture Organization of the United Nations, FAO: Rome, Italy, 2004. [Google Scholar]
- Codex Alimentarius Commission (CAC). Codex General Standard for Contaminants and Toxins in Food and Feed, (CODEX STAN 193-1995). General Standard for Contaminants and Toxins in Food and Feed. Available online: https://www.fao.org/fileadmin/user_upload/livestockgov/documents/1_CXS_193e.pdf (accessed on 31 May 2023).
- EFSA Contam Panel (EFSA Panel on Contaminants in the Food Chain). Scientific opinion—Risk assessment of aflatoxins in food. EFSA J. 2020, 18, 6040. [Google Scholar]
- EFSA Contam Panel (EFSA Panel on Contaminants in the Food Chain). Scientific Opinion on the risk assessment of ochratoxin A in food. EFSA J. 2020, 18, 6113. [Google Scholar]
- EFSA Contam Panel (EFSA Panel on Contaminants in the Food Chain). Scientific Opinion on the risks to human and animal health related to the presence of deoxynivalenol and its acetylated and modified forms in food and feed. EFSA J. 2017, 15, 4718. [Google Scholar]
- EFSA (European Food Safety Authority). European Food Safety Authority Scientific opinion on the risks for public health related to the presence of zearalenone in food. EFSA J. 2011, 9, 2197. [Google Scholar] [CrossRef]
- Riba, A.; Matmoura, A.; Mokrane, S.; Mathieu, F.; Sabaou, N. Investigations on aflatoxigenic fungi and aflatoxins contamination in some nuts sampled in Algeria. Afr. J. Microbiol. Res. 2013, 7, 4974–4980. [Google Scholar]
- Mahdjoubi, C.K.; Arroyo-Manzanares, N.; Hamini-Kadar, N.; García-Campaña, A.M.; Mebrouk, K.; Gámiz-Gracia, L. Multi-mycotoxin occurrence and exposure assessment approach in foodstuffs from Algeria. Toxins 2020, 12, 194. [Google Scholar] [CrossRef]
- AMS-USDA (Agricultural Marketing Service—United Stated Department of Agriculture). FGSIS Performance Verified Mycotoxin Test Kits. Available online: https://www.ams.usda.gov/sites/default/files/media/FGISApprovedMycotoxinRapidTestKits.pdf (accessed on 31 May 2023).
- Commission Regulation (EC) No 401/2006 of 23 February 2006 laying down the methods of sampling and analysis for the official control of the levels of mycotoxins in foodstuffs. Off. J. Eur. Union 2006, L 70, 1–42.
- Imperato, R.; Campone, L.; Piccinelli, A.L.; Veneziano, A.; Rastrelli, L. Survey of aflatoxins and ochratoxin A contamination in food products imported in Italy. Food Control 2011, 22, 1905–1910. [Google Scholar] [CrossRef]
- Method EN 16050:2011; Determination of Aflatoxin B1, and the Total Content of Aflatoxins B1, B2, G1 and G2 in Cereals, Nuts and Derived Products. ISO (International Standard Organization): Geneva, Switzerland, 2011.
- Method EN 14132:2009; Determination of Ochratoxin A in Barley and Roasted Coffee. High-Performance Liquid Chromatographic Method with Immunoaffinity Column Cleanup. ISO (International Standard Organization): Geneva, Switzerland, 2009.
- Method EN 15891:2010; Determination of Deoxynivalenol in Cereals, Cereal Products and Cereal Based Foods for Infants and Young Children—HPLC Method with Immunoaffinity Column Cleanup and UV Detection. ISO (International Standard Organization): Geneva, Switzerland, 2010.
- WHO (World Health Organization). Principles and methods for the risk assessment of chemicals in Food. Environ Health Criteria 240. Chapter 6: Dietary Exposure Assessment of Chemicals in Food. In IPCS (International Program on Chemical Safety). Dietary Exposure Assessment of Chemicals in Food; WHO Press: Geneva, Switzerland, 2009. [Google Scholar]
- SANTE/11312/2021; Guidance Document on Analytical Quality Control and Method Validation Procedures for Pesticides Residues Analysis in Food and Feed. DG SANTE, European Commission: Brussels, Belgium, 2021.
- Commission Regulation (EU) 2023/91 of 25 April 2023 on maximum levels for certain contaminants in food and repealing Regulation (EC) No 1881/2006. Off. J. Eur. Union 2023, L 119, 103–157.
- Wu, L.X.; Ding, X.X.; Li, P.W.; Du, X.H.; Zhou, H.Y.; Bai, Y.Z.; Zhang, L.X. Aflatoxin contamination of peanuts at harvest in China from 2010 to 2013 and its relationship with climatic conditions. Food Control 2016, 60, 117–123. [Google Scholar] [CrossRef]
- Bumbangi, N.F.; Muma, J.B.; Choongo, K.; Mukanga, M.; Velu, M.R.; Veldman, F.; Hatloy, A.; Mapatano, M.A. Occurrence and factors associated with aflatoxin contamination of raw peanuts from Lusaka district’s markets, Zambia. Food Control 2016, 68, 291–296. [Google Scholar] [CrossRef]
- Huang, B.; Han, H.; Cai, Z.; Wu, Y.; Ren, Y. Simultaneous determination of aflatoxins B1, B2, G1, G2, M1 and M2 in peanuts and their derivative products by ultra-high-performance liquid chromatography–tandem mass spectrometry. Anal. Chim. Acta 2010, 662, 62–68. [Google Scholar] [CrossRef]
- Asare Bediako, K.; Dzidzienyo, D.; Ofori, K.; Offei, S.K.; Asibuo, J.Y.; Adu Amoah, R.; Obeng, J. Prevalence of fungi and aflatoxin contamination in stored groundnut in Ghana. Food Control 2019, 104, 152–156. [Google Scholar] [CrossRef]
- Masood, M.; Iqbal, S.Z.; Asi, M.R.; Malik, N. Natural occurrence of aflatoxins in dry fruits and edible nuts. Food Control 2015, 55, 62–65. [Google Scholar] [CrossRef]
- FAOSTAT. Food and Agriculture Data. Available online: https://www.fao.org/faostat (accessed on 31 May 2023).
- Azaiez, I.; Font, G.; Mañes, J.; Fernández-Franzón, M. Survey of mycotoxins in dates and dried fruits from Tunisian and Spanish markets. Food Control 2015, 51, 340–346. [Google Scholar] [CrossRef]
- Juan, C.; Zinedine, A.; Moltó, J.C.; Idrissi, L.; Mañes, J. Aflatoxins levels in dried fruits and nuts from Rabat-Salé area, Morocco. Food Control 2008, 19, 849–853. [Google Scholar] [CrossRef]
- Cano-Sancho, G.; Sanchis, V.; Marín, S.; Ramos, A.J. Occurrence and exposure assessment of aflatoxins in Catalonia (Spain). Food Chem. Toxicol. 2013, 51, 188–193. [Google Scholar] [CrossRef]
- Iqbal, S.Z.; Asi, M.R.; Jinap, S. Aflatoxins in dates and dates products. Food Control 2014, 43, 163–166. [Google Scholar] [CrossRef]
- Abdallah, M.F.; Krska, R.; Sulyok, M. Occurrence of ochratoxins, fumonisin B2, aflatoxins (B1 and B2), and other secondary fungal metabolites in dried date palm fruits from Egypt: A mini-survey. J. Food Sci. 2018, 83, 559–564. [Google Scholar] [CrossRef]
- Luttfullah, G.; Hussain, A. Studies on contamination level of aflatoxins in some dried fruits and nuts of Pakistan. Food Control 2011, 22, 426–429. [Google Scholar] [CrossRef]
- Zinedine, A.; Fernandez-Franzon, M.; Mañes, J.; Manyes, L. Multi-mycotoxin contamination of couscous semolina commercialized in Morocco. Food Chem. 2017, 214, 440–446. [Google Scholar] [CrossRef]
- Bouafifssa, Y.; Manyes, L.; Rahouti, M.; Mañes, J.; Berrada, H.; Zinedine, A.; Fernández-Franzón, M. Multi-occurrence of twenty mycotoxins in pasta and a risk assessment in the Moroccan population. Toxins 2018, 10, 432. [Google Scholar] [CrossRef]
- Hathout, A.S.; Abel-Fattah, S.M.; Abou-Sree, Y.H.; Fouzy, A.S. Incidence and exposure assessment of aflatoxins and ochratoxin A in Egyptian wheat. Toxicol. Rep. 2020, 7, 867–873. [Google Scholar] [CrossRef]
- Tabarini, A.; Zinedine, A.; Bouchriti, N.; Abdennebi, E.H. Exposure assessment to ochratoxin A through the intake of three cereal derivatives from the Moroccan market. Food Res. Int. 2020, 137, 109464. [Google Scholar] [CrossRef]
- Zebiri, S.; Mokranea, S.; Verheecke-Vaessen, C.; Choque, E.; Reghiouia, H.; Sabaoua, N.; Mathieub, F.; Riba, A. Occurrence of ochratoxin A in Algerian wheat and its milling derivatives. Toxin Rev. 2018, 38, 206–211. [Google Scholar] [CrossRef]
- Ghali, R.; Hmaissia-Khlifa, K.; Ghorbel, H.; Maaroufi, K.; Hedili, A. Incidence of aflatoxins, ochratoxin A and zearalenone in Tunisian foods. Food Control 2008, 19, 921–924. [Google Scholar] [CrossRef]
- Badji, T.; Durand, N.; Bendali, F.; Piro-Metayer, I.; Zinedine, A.; Salah-Abbès, J.B.; Abbès, S.; Montet, D.; Riba, A.; Brabet, C. In vitro detoxification of aflatoxin B1 and ochratoxin A by lactic acid bacteria isolated from Algerian fermented foods. Biol. Control 2023, 179, 105181. [Google Scholar] [CrossRef]
- Tolosa, J.; Graziani, G.; Gaspari, A.; Chianese, D.; Ferrer, E.; Mañes, J.; Ritieni, A. Multi-mycotoxin analysis in durum wheat pasta by liquid chromatography coupled to quadrupole orbitrap mass spectrometry. Toxins 2017, 9, 59. [Google Scholar] [CrossRef] [PubMed]
- González-Osnaya, L.; Cortés, C.; Soriano, J.M.; Moltó, J.C.; Mañes, J. Occurrence of deoxynivalenol and T-2 toxin in bread and pasta commercialized in Spain. Food Chem. 2011, 124, 156–161. [Google Scholar] [CrossRef]
- Heshmati, A.; Zohrevand, T.; Khaneghah, A.M.; Nejad, A.S.M.; Sant’Ana, S.A. Co-occurrence of aflatoxins and ochratoxin A in dried fruits in Iran: Dietary exposure risk assessment. Food Chem. Toxicol. 2017, 106, 202–208. [Google Scholar] [CrossRef]
- Meerpoel, C.; Vidal, A.; Andjelkovic, M.; De Boevre, M.; Tangni, E.; Huybrechts, B.; Devreese, M.; Croubels, S.; De Saeger, S. Dietary exposure assessment and risk characterization of citrinin and ochratoxin A in Belgium. Food Chem. Toxicol. 2021, 147, 111914. [Google Scholar] [CrossRef]
- EFSA (European Food Safety Authority). Opinion of the scientific committee on a request from EFSA related to A harmonised approach for risk assessment of substances which are both genotoxic and carcinogenic. EFSA J. 2005, 282, 1–31. [Google Scholar]
- Kabak, B. Aflatoxins in foodstuffs: Occurrence and risk assessment in Turkey. J. Food Compos. Anal. 2021, 96, 103734. [Google Scholar] [CrossRef]
- Bhardwaj, K.; Meneely, J.P.; Haughey, S.A.; Dean, M.; Wall, P.; Zhang, G.; Baker, B.; Elliot, C.T. Risk assessments for the dietary intake aflatoxins in food: A systematic review (2016–2022). Food Control 2023, 149, 109687. [Google Scholar] [CrossRef]
- Kortei, N.K.; Annan, T.; Akonor, P.T.; Richard, S.A.; Annan, H.A.; Wiafe-Kwagyan, M.; Ayim-Akonor, M.; Akpaloo, P.G. Aflatoxins in randomly selected groundnuts (Arachis hypogaea) and its products from some local markets across Ghana: Human risk assessment and monitoring. Toxicol. Rep. 2021, 8, 186–195. [Google Scholar] [CrossRef]
- Kabak, B. Aflatoxins in hazelnuts and dried figs: Occurrence and exposure assessment. Food Chem. 2016, 211, 8–16. [Google Scholar] [CrossRef]
- Kooprasertying, P.; Maneeboon, T.; Hongprayoon, R.; Mahakarnchanakul, W. Exposure assessment of aflatoxins in Thai peanut consumption. Cogent Food Agric. 2016, 2, 1204683. [Google Scholar] [CrossRef]
- Alim, M.; Iqbal, S.Z.; Mehmood, Z.; Asi, M.R.; Zikar, H.; Chanda, H.; Malik, N. Survey of mycotoxins in retail market cereals, derived products and evaluation of their dietary intake. Food Control 2018, 84, 471–477. [Google Scholar] [CrossRef]
- Sirot, V.; Fremy, J.M.; Leblanc, J.C. Dietary exposure to mycotoxins and health risk assessment in the second French total diet study. Food Chem. Toxicol. 2013, 52, 1–11. [Google Scholar] [CrossRef]
- FSAI (Food Safety Authority of Ireland). Report on a Total Diet Study Carried Out by the Food Safety Authority of Ireland in the Period 2012–2014; Food Safety Authority of Ireland: Dublin, Ireland, 2016. [Google Scholar]
- IARC (International Agency for Research on Cancer). Some Naturally Occurring Substances: Food Items and Constituents, Heterocyclic Aromatic Amines and Mycotoxins; IARC Monographs on the Evaluation of Carcinogenic Risks to Humans, No. 56; International Agency for Research on Cancer: Lyon, France, 1993.
- Brera, C.; Bertazzoni, V.; Debegnach, F.; Gregori, E.; Prantera, E.; De Santis, B. Exposure assessment for Italian population groups to deoxynivalenol deriving from pasta consumption. Toxins 2013, 5, 2293–2309. [Google Scholar] [CrossRef]
- Dos Santos, J.S.; Souza, T.M.; Ono, E.Y.S.; Hashimoto, E.H.; Bassoi, M.C.; de Miranda, M.Z.; Hirooka, E.Y. Natural occurrence of deoxynivalenol in wheat from Parana State, Brazil and estimated daily intake by wheat products. Food Chem. 2013, 138, 90–95. [Google Scholar] [CrossRef]


| Food | Descriptive | AFB1 | AFB2 | AFG1 | AFG2 | Sum AFs | OTA |
|---|---|---|---|---|---|---|---|
| Peanuts (n = 24) | % Positive | 62.5% | 62.5% | 45.8% | 29.2% | 62.5% | 0.0% |
| Mean ± SD | 0.92 ± 1.34 | 0.16 ± 0.23 | 0.17 ± 0.37 | 0.08 ± 0.19 | 1.31 ± 1.89 | <LD 1 | |
| Maximum | 5.25 | 0.83 | 1.42 | 0.74 | 6.21 | -- | |
| Almonds (n = 21) | % Positive | 9.5% | 9.5% | 0.0% | 0.0% | 9.5% | 0.0% |
| Mean ± SD | 0.01 ± 0.01 | 0.01 ± 0.01 | <LD | <LD | 0.02 ± 0.02 | <LD | |
| Maximum | 0.05 | 0.02 | -- | -- | 0.07 | -- | |
| Walnuts (n = 20) | % Positive | 0.0% | 0.0% | 0.0% | 0.0% | 0.0% | 0.0% |
| Mean ± SD | <LD | <LD | <LD | <LD | <LD | <LD | |
| Maximum | -- | -- | -- | -- | -- | -- | |
| Total nuts (n = 65) | % Positive | 26.2% | 26.2% | 16.9% | 10.8% | 26.2% | 0.0% |
| Mean ± SD | 0.35 ± 0.92 | 0.06 ± 0.16 | 0.07 ± 0.24 | 0.04 ± 0.12 | 0.49 ± 1.30 | <LD |
| Food | Descriptive | AFB1 | AFB2 | AFG1 | AFG2 | Sum AFs | OTA |
|---|---|---|---|---|---|---|---|
| Dried figs (n = 29) | % Positive | 17.2% | 0.0% | 24.1% | 10.3% | 34.5% | 0.0% |
| Mean ± SD | 0.01 ± 0.01 | <LD 1 | 0.03 ± 0.06 | 0.02 ± 0.03 | 0.04 ± 0.07 | <LD | |
| Maximum | 0.05 | -- | 0.30 | 0.17 | 0.32 | -- | |
| Dates (n = 20) | % Positive | 5.0% | 5.0% | 0.0% | 0.0% | 5.0% | 0.0% |
| Mean ± SD | 0.02 ± 0.05 | 0.01 ± 0.02 | <LD | <LD | 0.03 ± 0.07 | <LD | |
| Maximum | 0.23 | 0.10 | -- | -- | 0.33 | -- | |
| Bradj pastries (n = 13) | % Positive | 100.0% | 100.0% | 100.0% | 0.0% | 100.0% | 0.0% |
| Mean ± SD | 0.72 ± 0.58 | 0.09 ± 0.06 | 0.06 ± 0.01 | <LD | 0.87 ± 0.64 | <LD | |
| Maximum | 1.97 | 0.20 | 0.07 | -- | 2.24 | -- | |
| Total dried fruits (n = 62) | % Positive | 30.6% | 22.6% | 32.3% | 4.8% | 38.7% | 0.0% |
| Mean ± SD | 0.16 ± 0.39 | 0.03 ± 0.04 | 0.03 ± 0.04 | 0.01 ± 0.02 | 0.21 ± 0.45 | <LD |
| Food | Descriptive | AFB1 | AFB2 | AFG1 | AFG2 | Sum AFs | OTA | DON |
|---|---|---|---|---|---|---|---|---|
| Couscous (n = 27) | % Positive | 0.0% | 0.0% | 0.0% | 0.0% | 0.0% | 14.8% | 77.8% |
| Mean ± SD | <LD 1 | <LD | <LD | <LD | <LD | 0.20 ± 0.56 | 117 ± 97 | |
| Maximum | -- | -- | -- | -- | -- | 2.79 | 470 | |
| Rechta noodles (n = 26) | % Positive | 3.8% | 0.0% | 57.7% | 0.0% | 61.5% | 26.9% | 96.2% |
| Mean ± SD | 0.01 ± 0.01 | <LD | 0.03 ± 0.03 | <LD | 0.03 ± 0.03 | 0.17 ± 0.44 | 123 ± 63 | |
| Maximum | 0.02 | -- | 0.09 | <LD | 0.09 | 2.28 | 280 | |
| Metlou bread (n = 18) | % Positive | 0.0% | 0.0% | 100.0% | 5.6% | 100.0% | 5.6% | 83.3% |
| Mean ± SD | <LD | <LD | 0.07 ± 0.03 | 0.01 ± 0.01 | 0.07 ± 0.03 | 0.06 ± 0.02 | 90 ± 60 | |
| Maximum | -- | -- | 0.15 | 0.03 | 0.15 | 0.15 | 190 | |
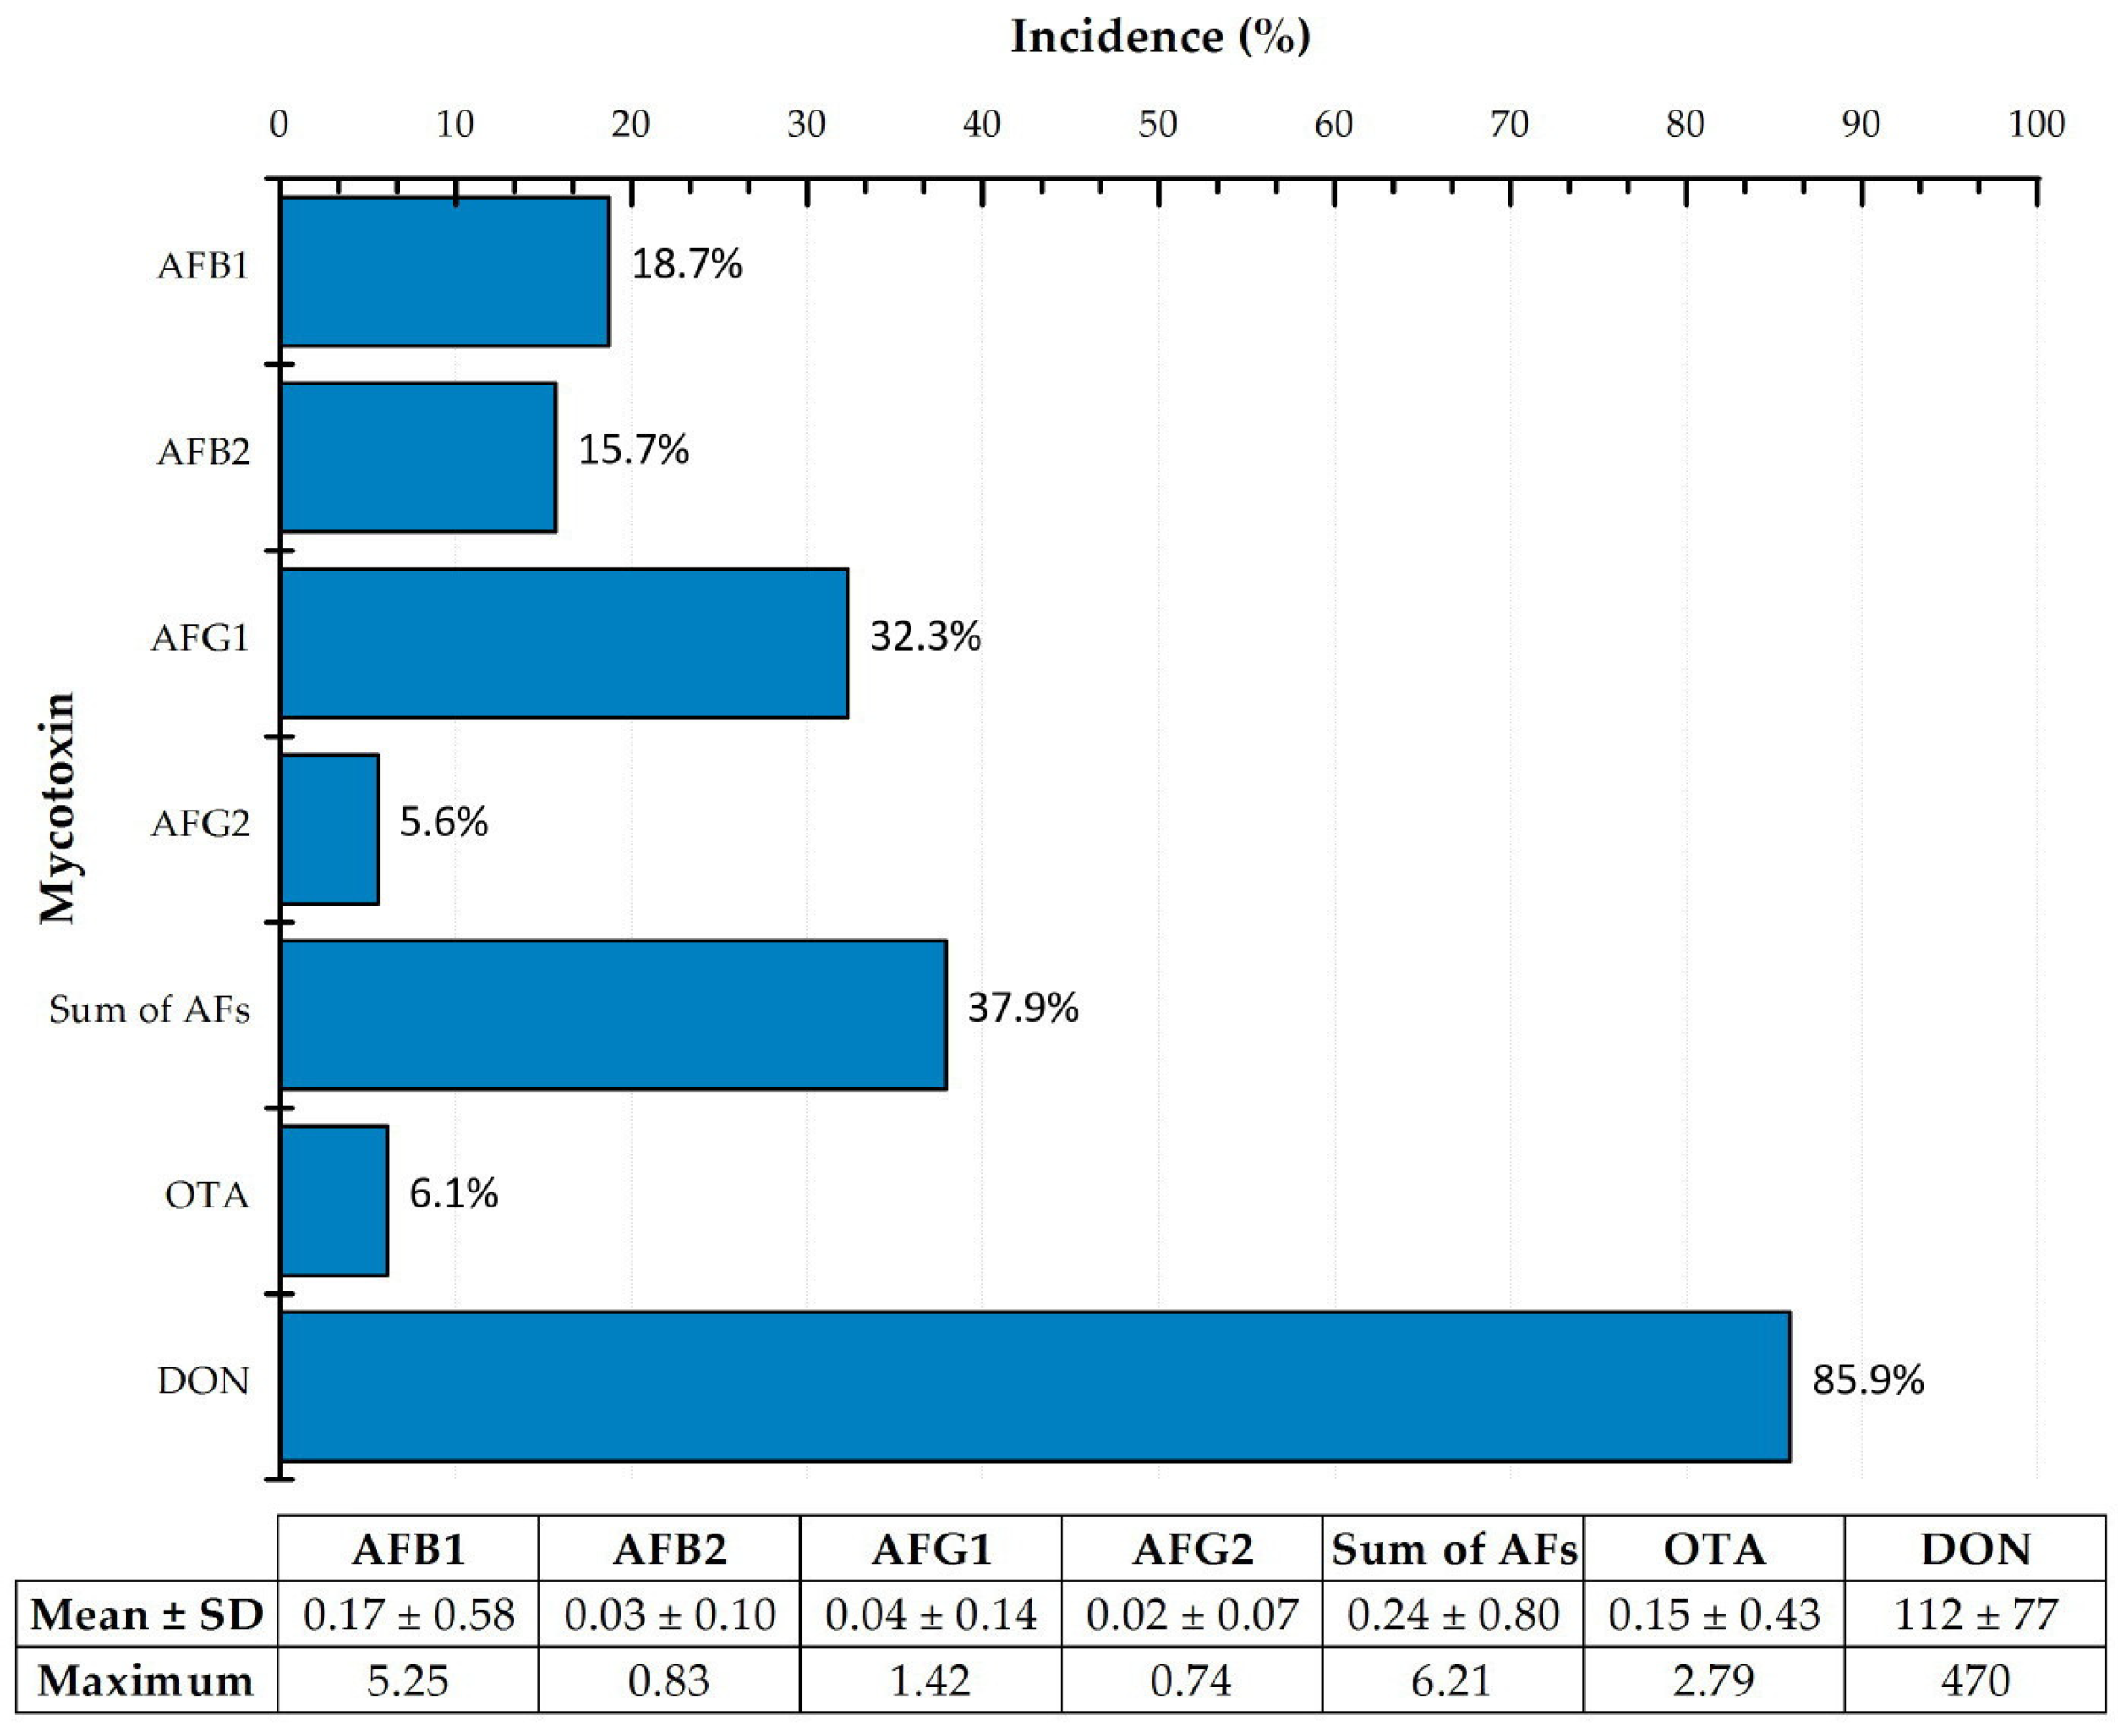
| Total cereal-based (n = 71) | % Positive | 1.4% | 0.0% | 46.5% | 1.4% | 47.9% | 16.9% | 85.9% |
| Mean ± SD | 0.01 ± 0.01 | <LD | 0.03 ± 0.03 | 0.01 ± 0.01 | 0.03 ± 0.03 | 0.15 ± 0.43 | 112 ± 77 |
| Food | Parameter | AFB1 | AFB2 | AFG1 | AFG2 | OTA |
|---|---|---|---|---|---|---|
| Peanuts | EDI | 0.026 | 0.005 | 0.005 | 0.002 | LC 1 |
| MOE | 15,217 | 87,500 | 82,353 | 175,000 | - | |
| Almonds | EDI | 0.001 | 0.001 | LC | LC | LC |
| MOE | 560,000 | 560,000 | - | - | - | |
| Walnuts | EDI | LC | LC | LC | LC | LC |
| MOE | - | - | - | - | - | |
| Dried figs | EDI | 0.001 | LC | 0.004 | 0.003 | LC |
| MOE | 280,000 | - | 93,333 | 140,000 | - | |
| Dates | EDI | 0.017 | 0.009 | LC | LC | LC |
| MOE | 23,333 | 46,667 | - | - | - | |
| Bradj pastries | EDI | 0.617 | 0.076 | 0.051 | LC | LC |
| MOE | 648 2 | 5185 | 7778 | - | - | |
| Couscous | EDI | LC | LC | LC | LC | 0.286 |
| MOE | - | - | - | - | 50,750 | |
| Rechta noodles | EDI | 0.014 | LC | 0.043 | LC | 0.243 |
| MOE | 28,000 | - | 9333 | - | 59,706 | |
| Metlou bread | EDI | LC | LC | 0.100 | 0.014 | 0.086 |
| MOE | - | - | 4000 | 28,000 | 169,167 |
Disclaimer/Publisher’s Note: The statements, opinions and data contained in all publications are solely those of the individual author(s) and contributor(s) and not of MDPI and/or the editor(s). MDPI and/or the editor(s) disclaim responsibility for any injury to people or property resulting from any ideas, methods, instructions or products referred to in the content. |
© 2023 by the authors. Licensee MDPI, Basel, Switzerland. This article is an open access article distributed under the terms and conditions of the Creative Commons Attribution (CC BY) license (https://creativecommons.org/licenses/by/4.0/).
Share and Cite
Belasli, A.; Herrera, M.; Ariño, A.; Djenane, D. Occurrence and Exposure Assessment of Major Mycotoxins in Foodstuffs from Algeria. Toxins 2023, 15, 449. https://doi.org/10.3390/toxins15070449
Belasli A, Herrera M, Ariño A, Djenane D. Occurrence and Exposure Assessment of Major Mycotoxins in Foodstuffs from Algeria. Toxins. 2023; 15(7):449. https://doi.org/10.3390/toxins15070449
Chicago/Turabian StyleBelasli, Azem, Marta Herrera, Agustín Ariño, and Djamel Djenane. 2023. "Occurrence and Exposure Assessment of Major Mycotoxins in Foodstuffs from Algeria" Toxins 15, no. 7: 449. https://doi.org/10.3390/toxins15070449
APA StyleBelasli, A., Herrera, M., Ariño, A., & Djenane, D. (2023). Occurrence and Exposure Assessment of Major Mycotoxins in Foodstuffs from Algeria. Toxins, 15(7), 449. https://doi.org/10.3390/toxins15070449