Article

The AwHog1 Transcription Factor Influences the Osmotic Stress Response, Mycelium Growth, OTA Production, and Pathogenicity in Aspergillus westerdijkiae fc-1

1
College of Food Science and Technology, Zhejiang University of Technology, No. 18 Chaowang Road, Gongshu District, Hangzhou 310014, China
2
Institute of Food Science and Technology, Chinese Academy of Agricultural Sciences, No. 2 Yuanmingyuan West Road, Haidian District, Beijing 100193, China
3
Zhejiang Provincial Center for Disease Control and Prevention, No. 3399 Binsheng Road, Binjiang District, Hangzhou 310051, China
*
Authors to whom correspondence should be addressed.
Toxins 2023, 15(7), 432; https://doi.org/10.3390/toxins15070432
Submission received: 22 May 2023 / Revised: 21 June 2023 / Accepted: 23 June 2023 / Published: 30 June 2023
(This article belongs to the Special Issue Toxicity Mechanisms and Management Strategies of Mycotoxin)

Abstract

:
Aspergillus westerdijkiae, known as the major ochratoxin A (OTA) producer, usually occurs on agricultural crops, fruits, and dry-cured meats. Microorganisms produce OTA to adapt to the high osmotic pressure environment that is generated during food processing and storage. To investigate the relationship between OTA biosynthesis and the high osmolarity glycerol (HOG) pathway, the transcription factor AwHog1 gene in A. westerdijkiae was functionally characterised by means of a loss-of-function mutant. Our findings demonstrated that the growth and OTA production of a mutant lacking AwHog1 decreased significantly and was more sensitive to high osmotic media. The ΔAwHog1 mutant displayed a lower growth rate and a 73.16% reduction in OTA production in the wheat medium compared to the wild type. After three days of culture, the growth rate of the ΔAwHog1 mutant in medium with 60 g/L NaCl and 150 g/L glucose was slowed down 19.57% and 13.21%, respectively. Additionally, the expression of OTA biosynthesis genes was significantly reduced by the deletion of the AwHog1 gene. The infection ability of the ΔAwHog1 mutant was decreased, and the scab diameter of the pear was 6% smaller than that of the wild type. These data revealed that transcription factor AwHog1 plays a key role in the osmotic response, growth, OTA production, and pathogenicity in A. westerdijkiae.
Key Contribution: The transcription factor AwHog1 gene in A. westerdijkiae was functionally characterized by means of a loss-of-function mutant. The growth, OTA production, and infection ability of mutants lacking AwHog1 decreased significantly and was more sensitive to high osmotic media containing NaCl or glucose. These data revealed that transcription factor AwHog1 plays a key role in the osmotic response, growth, OTA production and pathogenicity regulation in A. westerdijkiae.

1. Introduction

Ochratoxin A (OTA), a widespread nephrotoxic mycotoxin, is frequently detected in many grains such as corn, soybeans, and wheat, as well as in products such as coffee, tea, wine, and bacon [1,2,3]. It has been shown that OTA has abundant toxicological effects, such as nephrotoxicity, hepatotoxicity, genotoxicity, teratogenicity, immunotoxicity, and carcinogenicity [4,5,6]. The International Agency for Research on Cancer has categorized OTA as a Group 2B carcinogen due to its substantial toxicity to both people and animals [6].
OTA is produced by filamentous fungi including Aspergillus and Penicillium spp. [1,7]. Aspergillus westerdijkiae, known as the major OTA-producing species, is a filamentous fungus derived from the A. westerdijkiae taxon. About approximately 70% of these strains are capable of producing OTA and are commonly found in foods such as coffee, milk, wine, beer, grapes, oranges, fruit juices, and dry-cured meats [7,8].
It has been discovered that the high osmotic glycerol (HOG) pathway regulates OTA production in Penicillium and Aspergillus in response to high osmotic conditions [9]. The biosynthesis of OTA plays an adaptive role in this habitat, as it has been shown previously that P. nordicum is adapted to NaCl-rich environments, such as dry-cured foods or even saline environments [10,11]. In P. nordicum, elevated concentrations of NaCl lead to high osmotic stress and subsequently promote the biosynthesis of ochratoxin A. The growth rates of A. westerdijkiae were probably higher in media supplemented with specific NaCl concentrations (0–80 g/L), and the maximum colony diameter was recorded when the concentration of NaCl was 40 g/L. The ability to produce OTA was inhibited at salinities of 40 g/L and 60 g/L in A. westerdijkiae. A. westerdijkiae’s ability to produce mycelium and spores significantly increased at a glucose concentration of 250 g/L. The production of OTA did not change between 20 and 100 g/L glucose concentration but decreased when the concentration reached 150 g/L [12].
Fungi have many metabolic pathways that help overcome extreme stress [13,14,15]. The HOG pathway is activated by increasing the ambient osmotic pressure and leads to an increase in cell glycerine concentrations to adapt to intracellular osmotic pressure [13,16]. The hog1 gene is the primary gene in the high-osmolarity glycerol response pathway, which enables fungi to survive osmolarity and oxidative stress [17]. HOG is a mitogen-activated protein kinase (MAPK). The phosphorylation of Hog1 stimulates the expression of downstream genes, thus enabling fungi to resist various environmental pressures [18]. The HOG pathway is implicated in the regulation of growth, development, pathogenicity, fungicidal susceptibility, and responses to osmotic stress in various kinds of filamentous fungi [19]. Through the HOG signalling cascade, the high osmolarity of the environment is normally transmitted to the transcription level of downstream regulatory genes [18,20].
The same point of view found that the HOG pathway has an important role in maintaining fungal growth and that activation of the HOG pathway could be involved in regulating growth defects due to disruption of complex sphingolipid biosynthesis [21]. A recent report indicated that mutants lacking PtcB and CDC14, which were constructed in Hog1 phosphatases, exhibited slow growth, altered sporulation, and decreased virulence [22]. It has been shown that liamocin biosynthesis in the gene deletion strains was reduced by 98.09% when the key gene in the Hog1 signalling pathway, hog1, was deleted [23]. The previous study has shown that the correlation between NaCl concentration and ochratoxin A biosynthesis is associated with the HOG MAP kinase signalling cascade pathway [11]. The changing levels of the Hog1 signalling pathway have been studied in mycotoxin-producing fungi, such as P.verrucosum [24], Fusarium proliferatum [25], F. graminearum [26], A. flavus [27], and Alternaria alternate [7].
Based on the aforementioned circumstances, the topic of whether HOG transcription factors can help control the virulence and capacity for OTA biosynthesis of A. westerdijkiae was brought up. We concentrate on AwHog1, a possible transcription factor in A. westerdijkiae, in order to better comprehend the function of the HOG pathway. This study constructed a mutant with a Hog1 homologs gene deleted to show whether the AwHog1 transcription factor could influence mycelium growth, spore production, OTA biosynthesis, responsiveness to high osmotic stress, and the infection ability of A. westerdijkiae.

2. Results

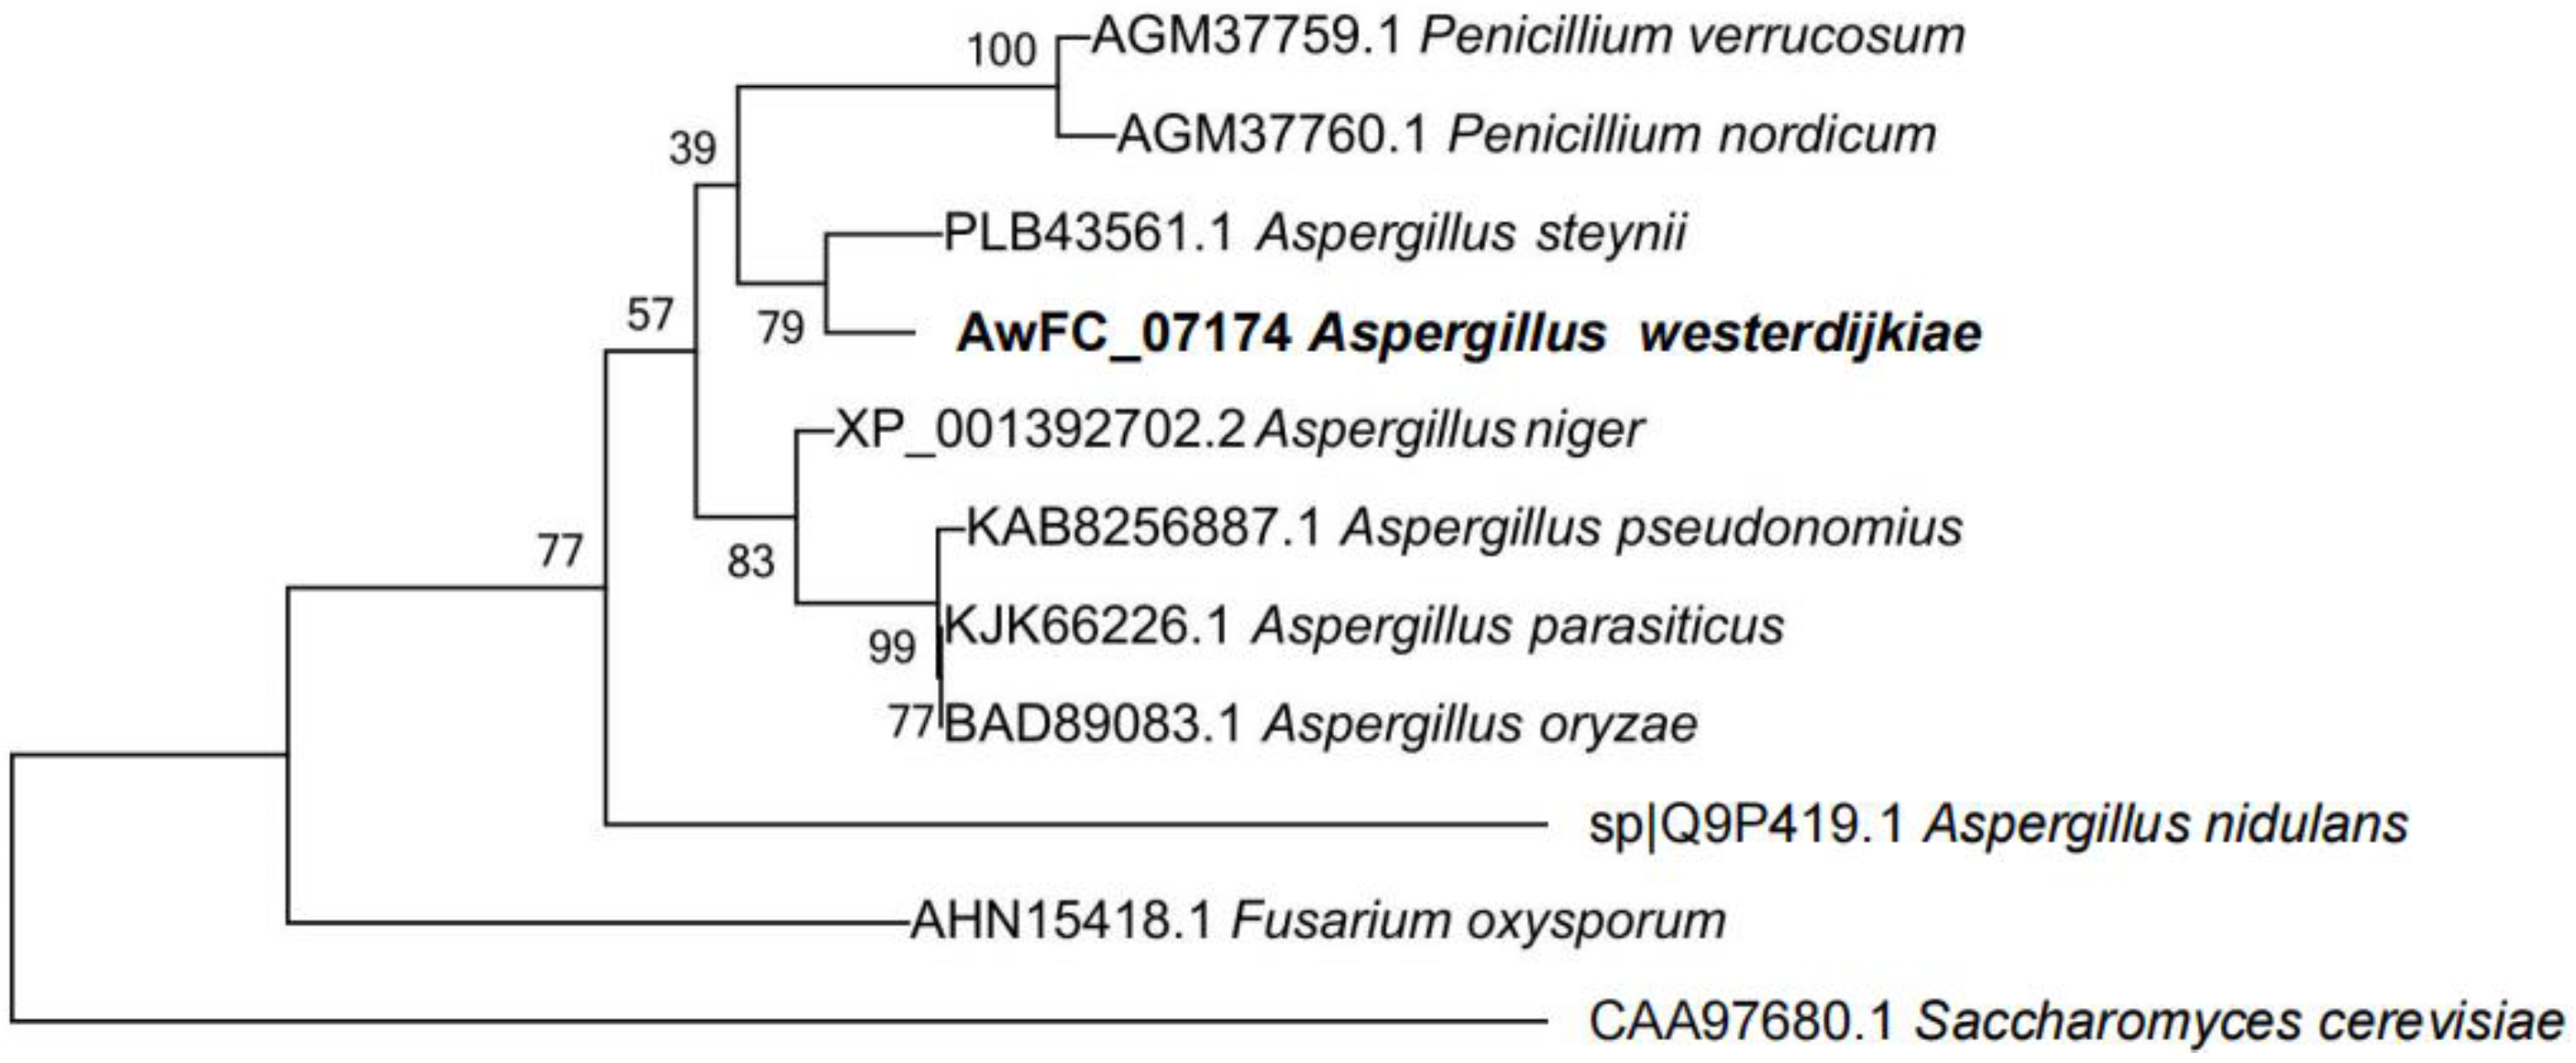
2.1. Characterization of a Hog1 Homology

MEGA6.0 software was used to construct a phylogenetic tree of Hog1 homologs based on sequences from 11 fungal species (Figure 1). As shown, Hog1 of Aspergillus spp. And Penicillium spp. Were highly homologous on the phylogenetic tree. The predicted amino acid sequence of AwHog1 showed 79% homology with that of Hog1 (protein identification accession No. PLB43561.1) from A. steynii. However, the AwHog1 protein exhibited larger differences compared with Hog1 from Fusarium spp. and Saccharomyces spp.

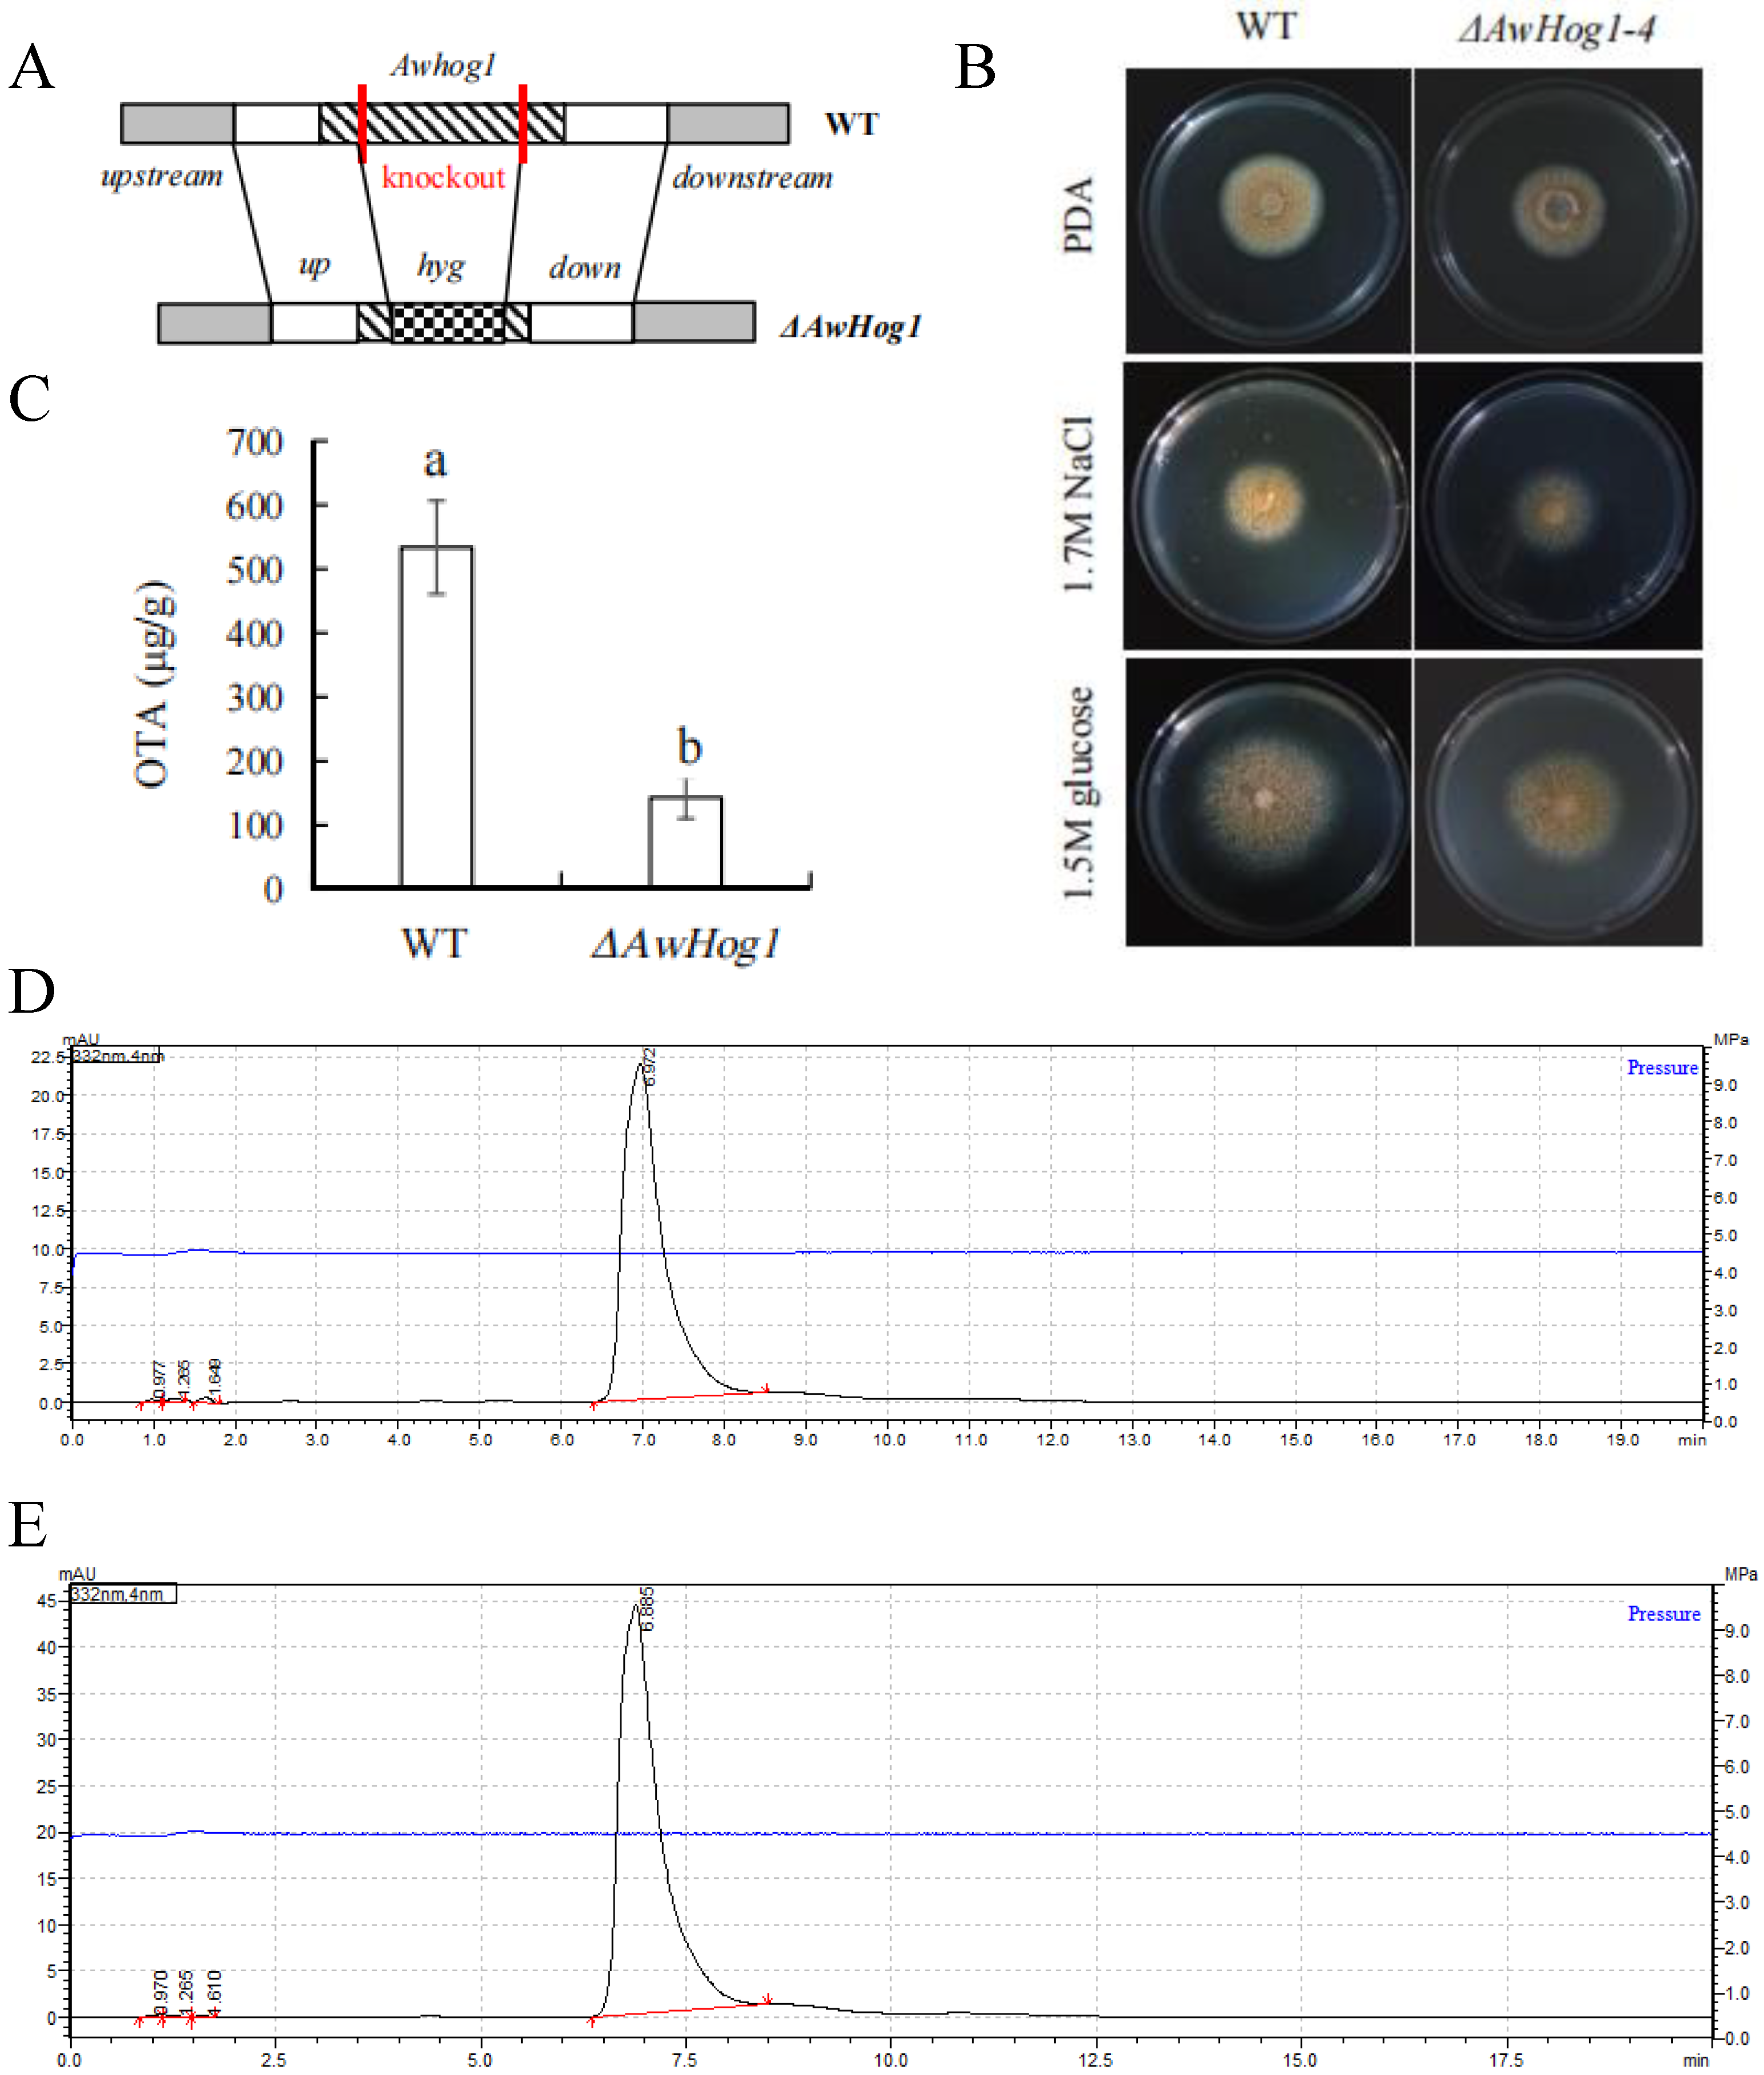
2.2. Construction of ΔAwHog1 Deletion Mutant

To examine AwHog1’s role within A. westerdijkiae, AwHog1 deletion mutants were generated through homologous recombination (Figure 2A). Fusion fragments of upstream, downstream, and hygromycin-resistant fragments were obtained and their composition was validated. A null fragment of the AwHog1 gene was detected in ΔAwHog1 mutant strains, indicating that the AwHog1 gene has been replaced by a fusion fragment.
In order to examine how OTA production and colony expansion are affected by high osmotic circumstances, 1.7 M NaCl or 1.5 M glucose was added to the medium. The morphology of the colonies was observed for 84 h after incubation (Figure 2B). It was clear that the strain growing rates were obviously influenced by high osmotic conditions. A certain concentration of glucose promoted the growth of A. westerdijkiae fc-1. With the addition of 1.5 M glucose, colonies were larger in diameter than those in a non-glucose PDA medium. Conversely, the growth of A. westerdijkiae fc-1 was weakened when a certain concentration of NaCl was added into the medium. When 1.7 M NaCl was added, the diameter of the colony decreased compared to the control without NaCl. The OTA content of the ΔAwHog1 mutant grown on the wheat medium was determined to assess whether ΔAwHog1 deletion affects the production of OTA (Figure 2C). For the production of large amounts of OTA in A. westerdijkiae fc-1, the wheat medium is suitable. Three replicate experiments were carried out and toxin production rates of 533.5 ± 72.95 μg/g and 143.16 ± 33.01 μg/g were obtained for the wild type and ΔAwHog1 mutant, respectively. The characteristic peaks of the liquid chromatogram can determine that the substance is OTA (Figure 2D,E). It was obvious that the deletion mutant strain ΔAwHog1 produced lower toxin rates compared to that of the wild type, and OTA production decreased by 73.16% in the ΔAwHog1 mutant.

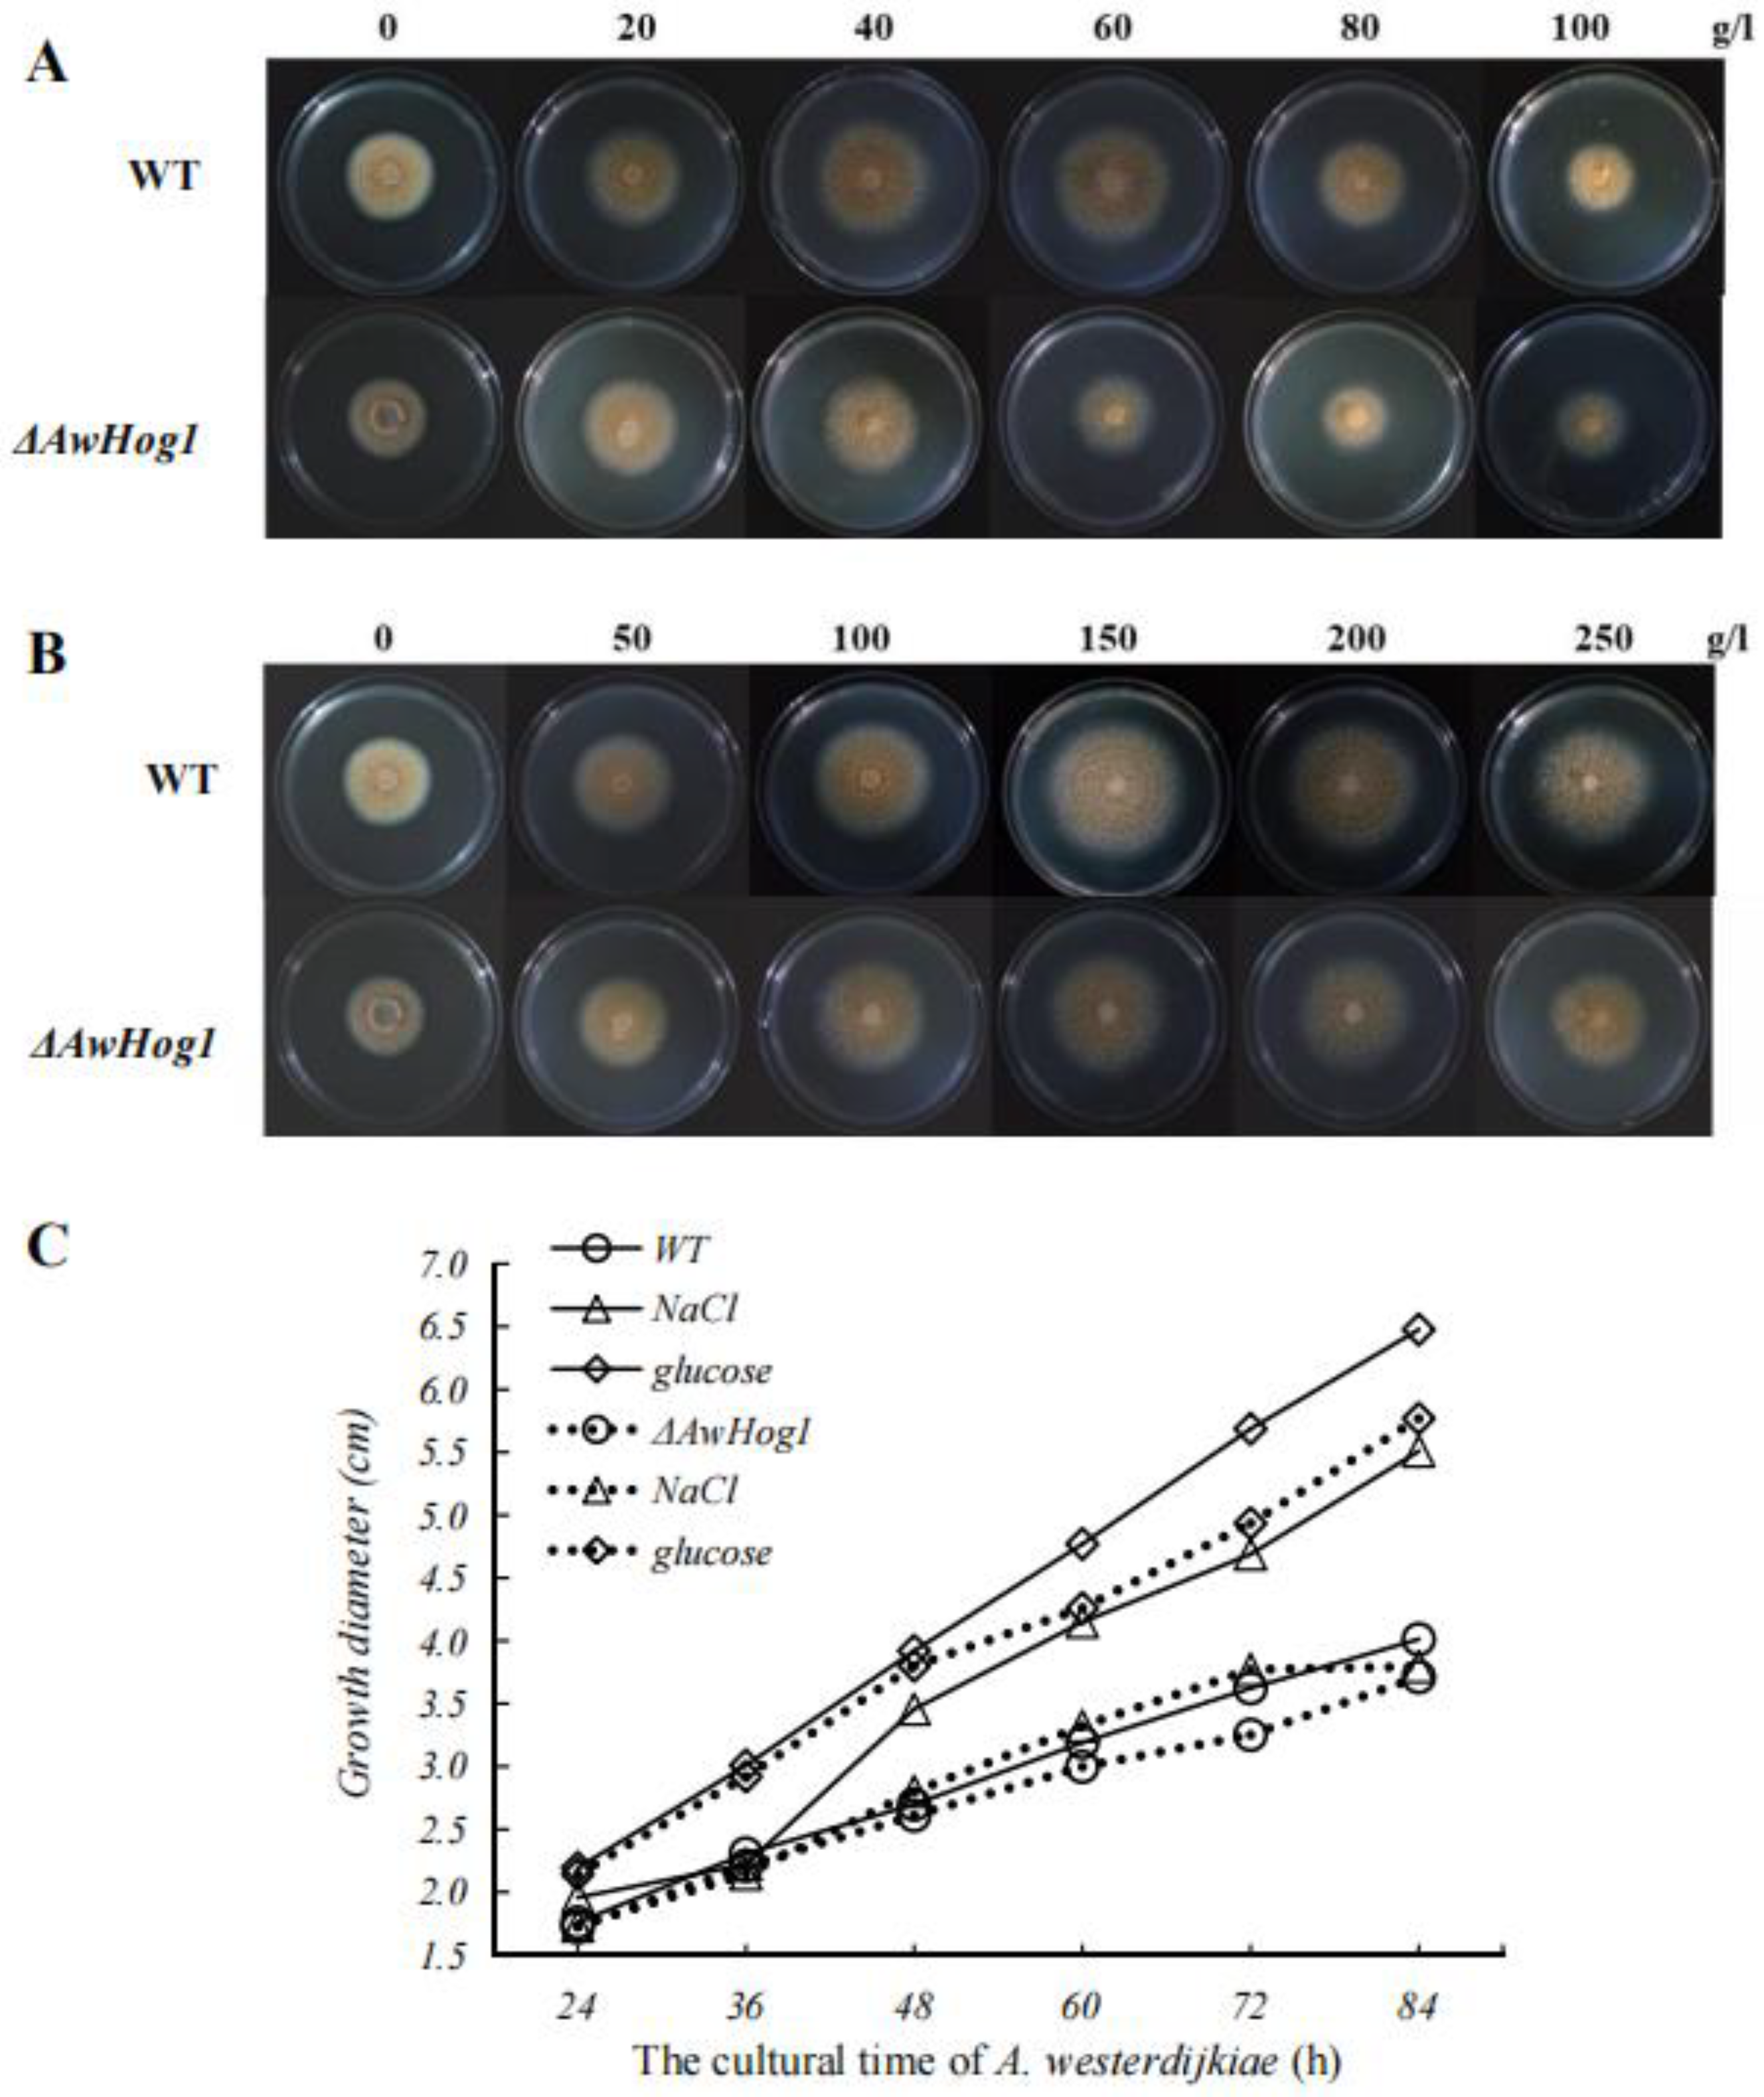
2.3. High Concentrations of NaCl or Glucose Affect Colony Morphology

In order to examine the effects of high permeability conditions on A. westerdijkiae, Add 0, 20, 30, 60, 80, 100 g/L NaCl or 0, 50, 100, 150, 200, 250 g/L glucose to the medium. After 24 to 48 h incubation, observe the colony morphology. No significant changes in colony morphology or colour were found under high osmotic conditions (Figure 3).
The growth rate of mycelium is obviously affected by high permeability conditions, and the tendency of mycelium growth is similar between the ΔAwHog1 mutant and the wild type. As the concentration of NaCl and glucose increases, the growth of mycelium tends to strengthen first and then weaken. Low concentrations of NaCl (20–80 g/L) promoted the growth of A. westerdijkiae fc-1. High concentrations of NaCl (more than 80 g/L) decreased the growth of A. westerdijkiae fc-1 (Figure 3A). When the concentration of NaCl is less than 60 g/L, the colony diameter of the wild type was 37% larger than that without NaCl, and the colony diameter of ΔAwHog1 was only 16% larger than that without NaCl (Figure 3C). Glucose could promote the growth of A. westerdijkiae fc-1, and the growth of A. westerdijkiae fc-1 was slightly weakened due to the deletion of the gene AwHog1 (Figure 3B). The diameter of the colonies was 61.4% and 55.4% larger than that without 150 g/L glucose in the wild type and ΔAwHog1, respectively (Figure 3C).

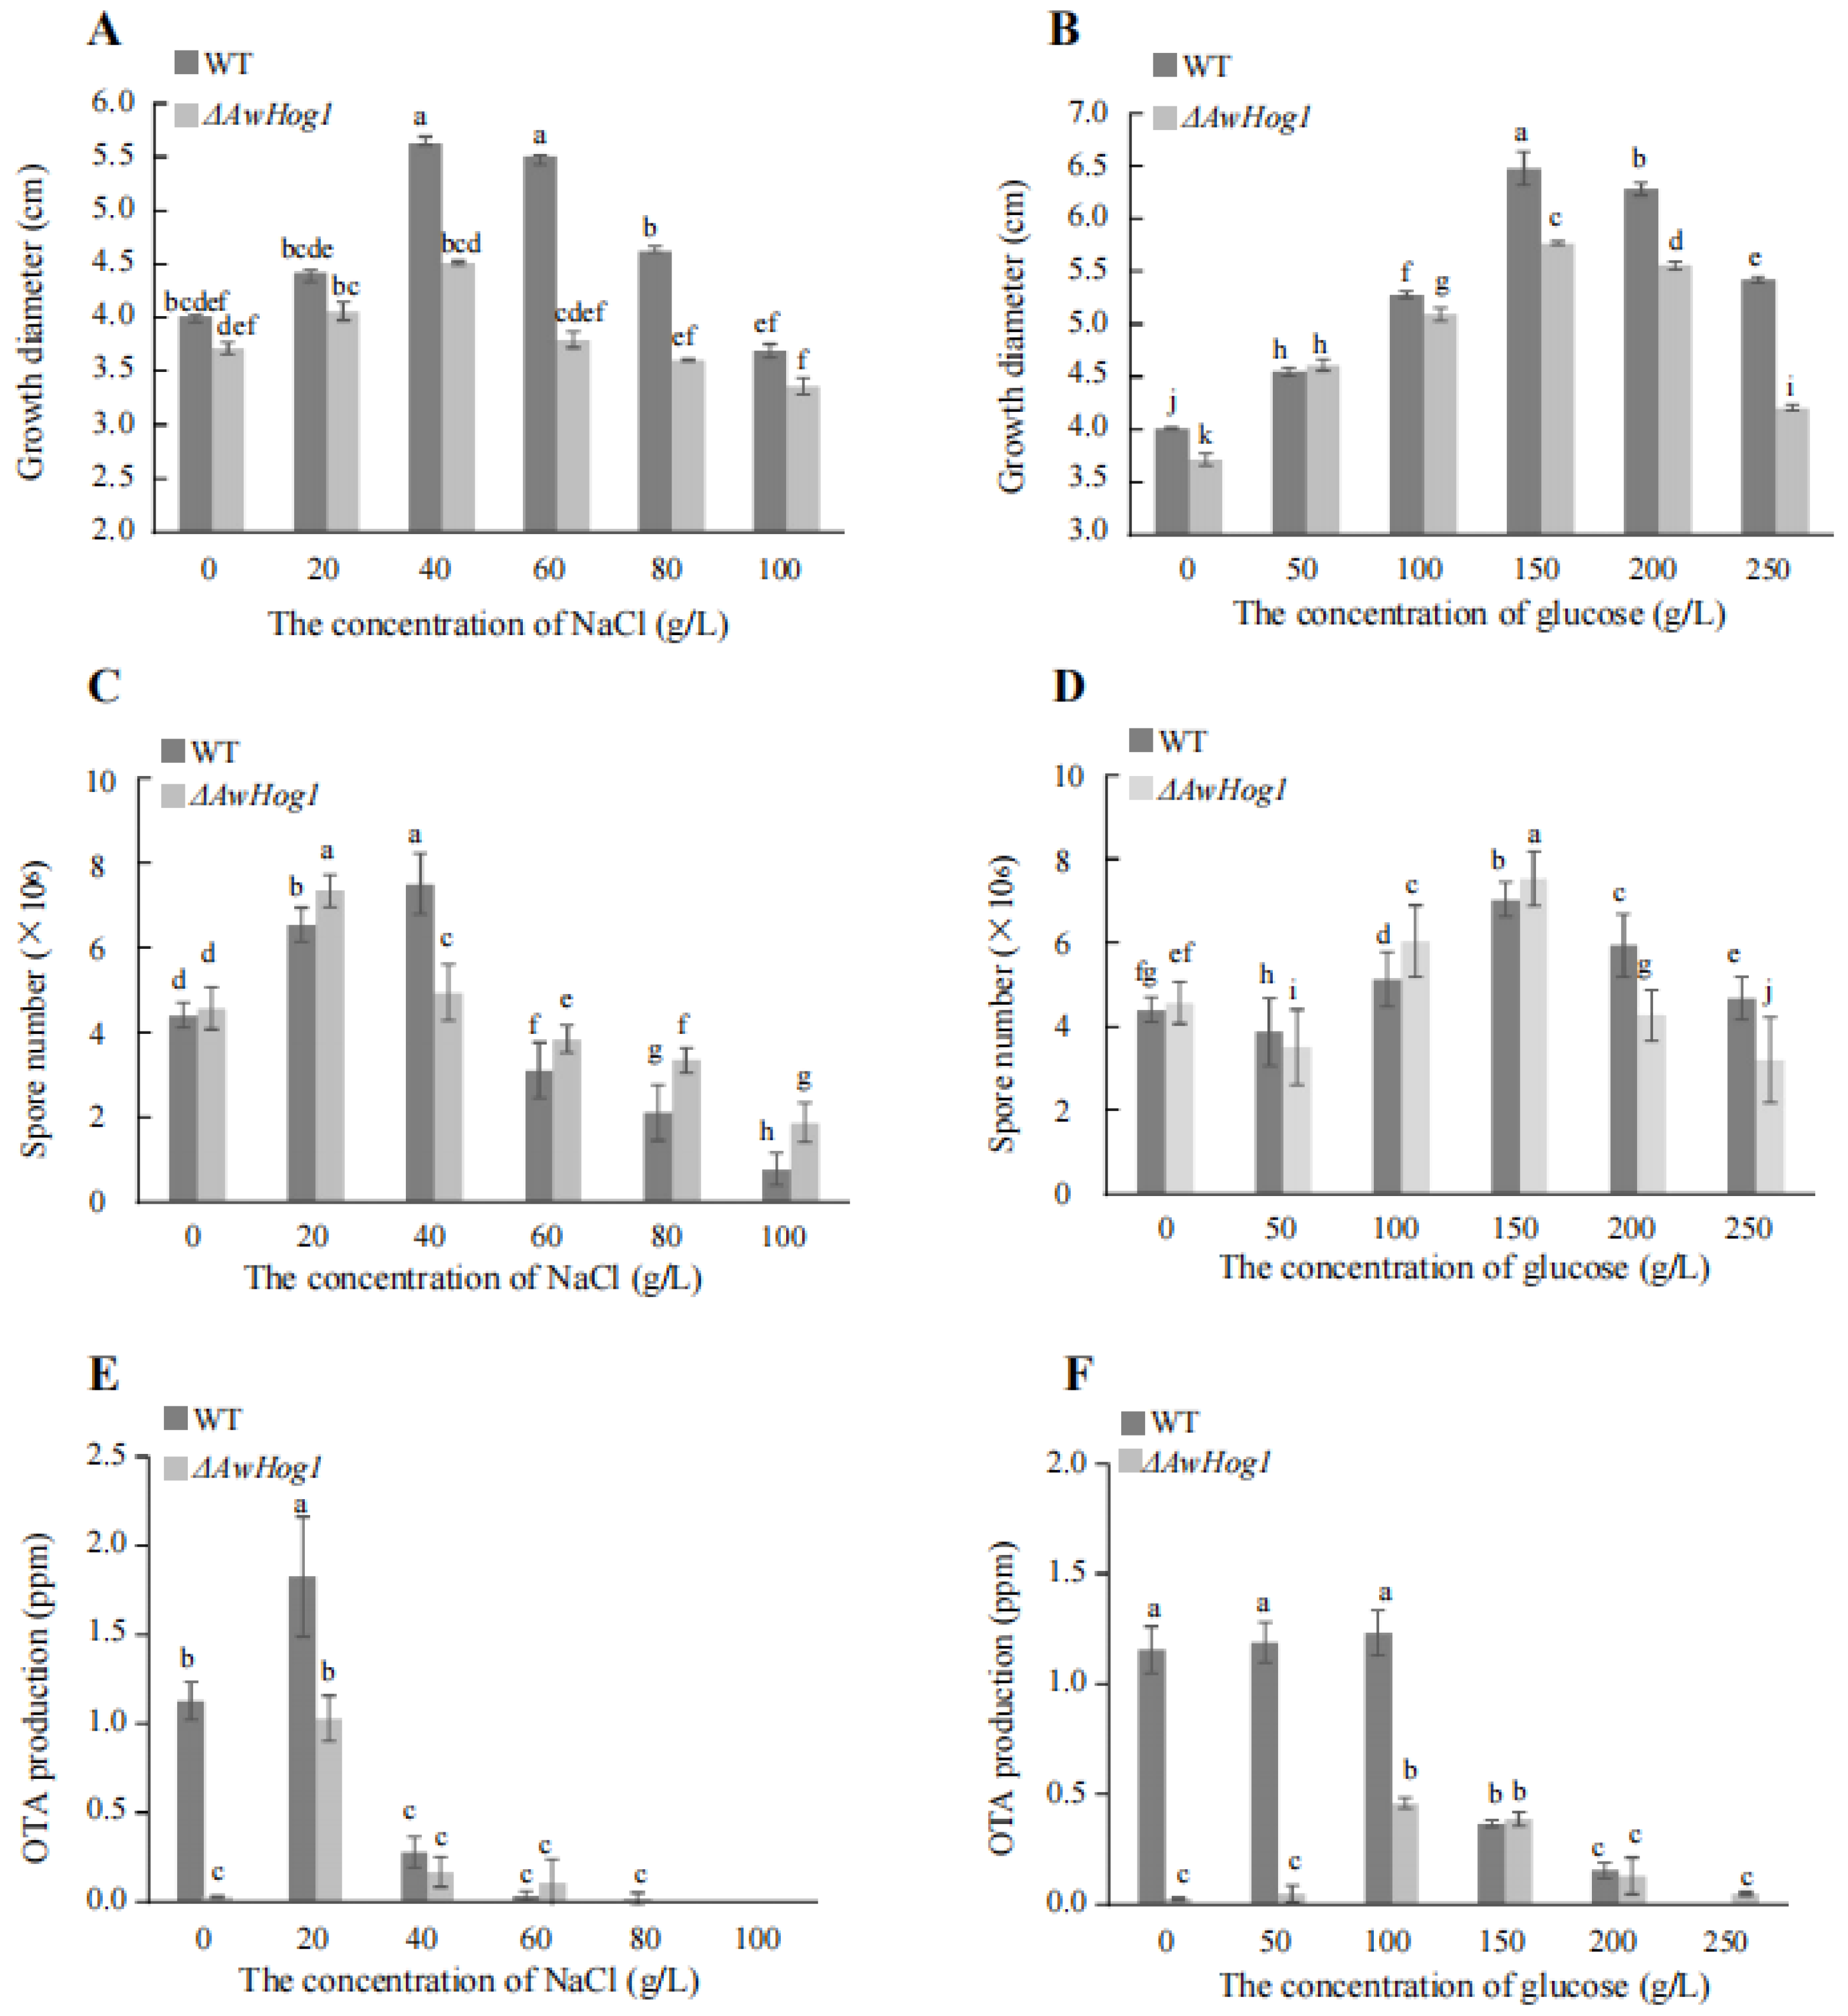
2.4. Growth Diameter, Spores Number, and OTA Production Are Affected and Modulated by AwHog1

To uncover the role of AwHog1, the growth, spore numbers, and OTA production under different concentrations of NaCl and glucose were compared. When the concentration of NaCl was 0–40 g/L, the mycelium growth diameters of the wild type and the ΔAwHog1 mutant showed a gradual increase, and the growth diameters of both strains declined as the NaCl concentration increased (Figure 4A). The growth diameters of the wild type and the ΔAwHog1 mutant increased when the concentration of glucose was 0–150 g/L, and with the increase in glucose concentration, the growth diameters of ΔAwHog1 mutant and the wild type decreased rapidly (Figure 4B). Compared with the wild type, the growth diameter of the ΔAwHog1 mutant under different concentrations of NaCl and glucose was lower than that of the wild type (Figure 4A,B), indicating that the deletion strain ΔAwHog1 would slow the growth of A. westerdijkiae fc-1. The spore numbers of the wild type and ΔAwHog1 increased when the concentration of NaCl was 0–40 g/L, then both strains decreased with the increase of NaCl concentration (Figure 4C). The spore numbers of ΔAwHog1 were higher than those of the wild type at NaCl concentration of less than 20 g/L. When the concentration of NaCl was between 40 and 100 g/L, the spore number of ΔAwHog1 was lower than the wild type. The result, which was similar to a previous report [12], showed that the spore number of the wild type and ΔAwHog1 increased overall when the concentration of glucose was 0–150 g/L (Figure 4D). When the concentration increased to 200 g/L glucose, the spore numbers of the wild type and ΔAwHog1 decreased. The spore number of ΔAwHog1 was higher than the wild type at glucose concentrations less than 150 g/L (Figure 4D). The OTA content in the deletion mutant strain ΔAwHog1 was almost undetectable in PDA or a YES plate (Figure 4E,F). The OTA production of the wild type and ΔAwHog1 increased when the concentration of NaCl was 0–20 g/L and then decreased with the increase of NaCl concentrations (Figure 4E). The OTA production in the ΔAwHog1 mutant grew rapidly at glucose concentrations of 100 and 150 g/L (Figure 4F). Similar to the earlier report [12], the OTA production of ΔAwHog1 under different concentrations of NaCl and glucose was lower than that of the wild type.

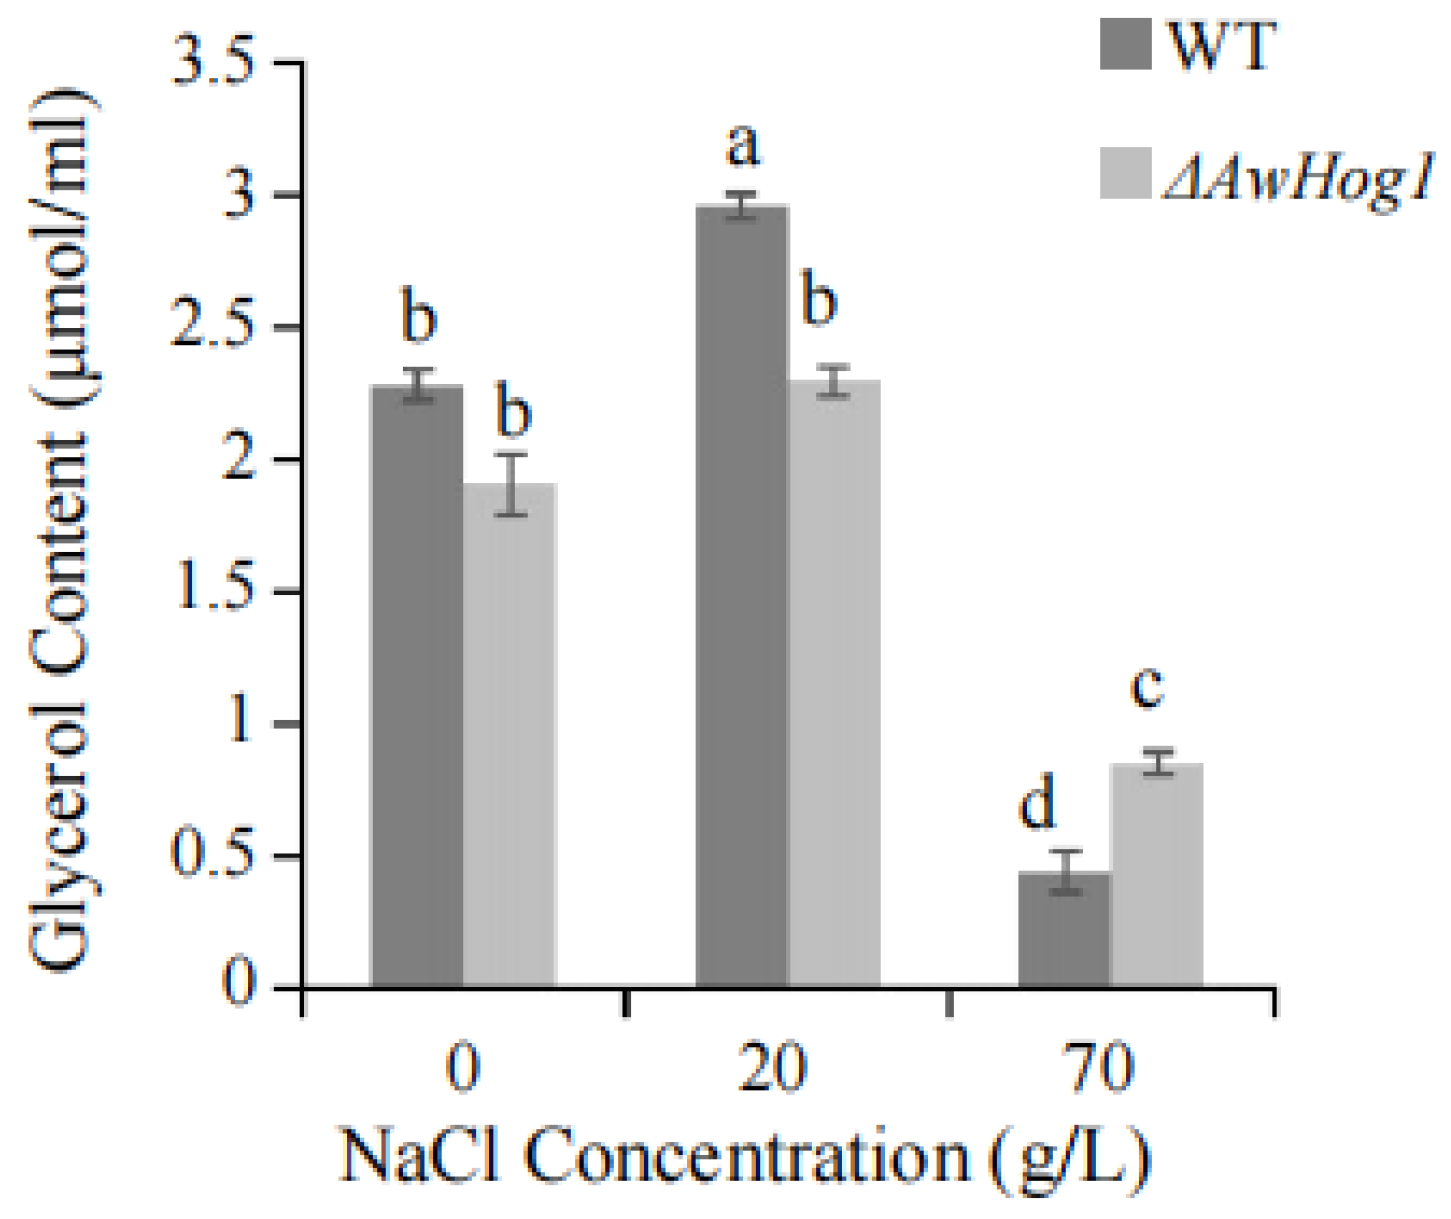
2.5. Glycerol Content Is Affected by AwHog1

To evaluate whether the absence of AwHog1 affects the glycerol content, the glycerol content of the ΔAwHog1 mutant and the wild type grown in different concentrations of NaCl was detected. The glycerol content of the ΔAwHog1 mutant was smaller than that of the wild type when the concentration of NaCl was between 0 and 20 g/L. The trend of the wild type and the ΔAwHog1 mutant increased with the increase of the NaCl concentration and then decreased when the concentration rose to 70 g/L. The ΔAwHog1 mutant has a higher glycerol content than the wild type under conditions of high NaCl concentration (Figure 5).

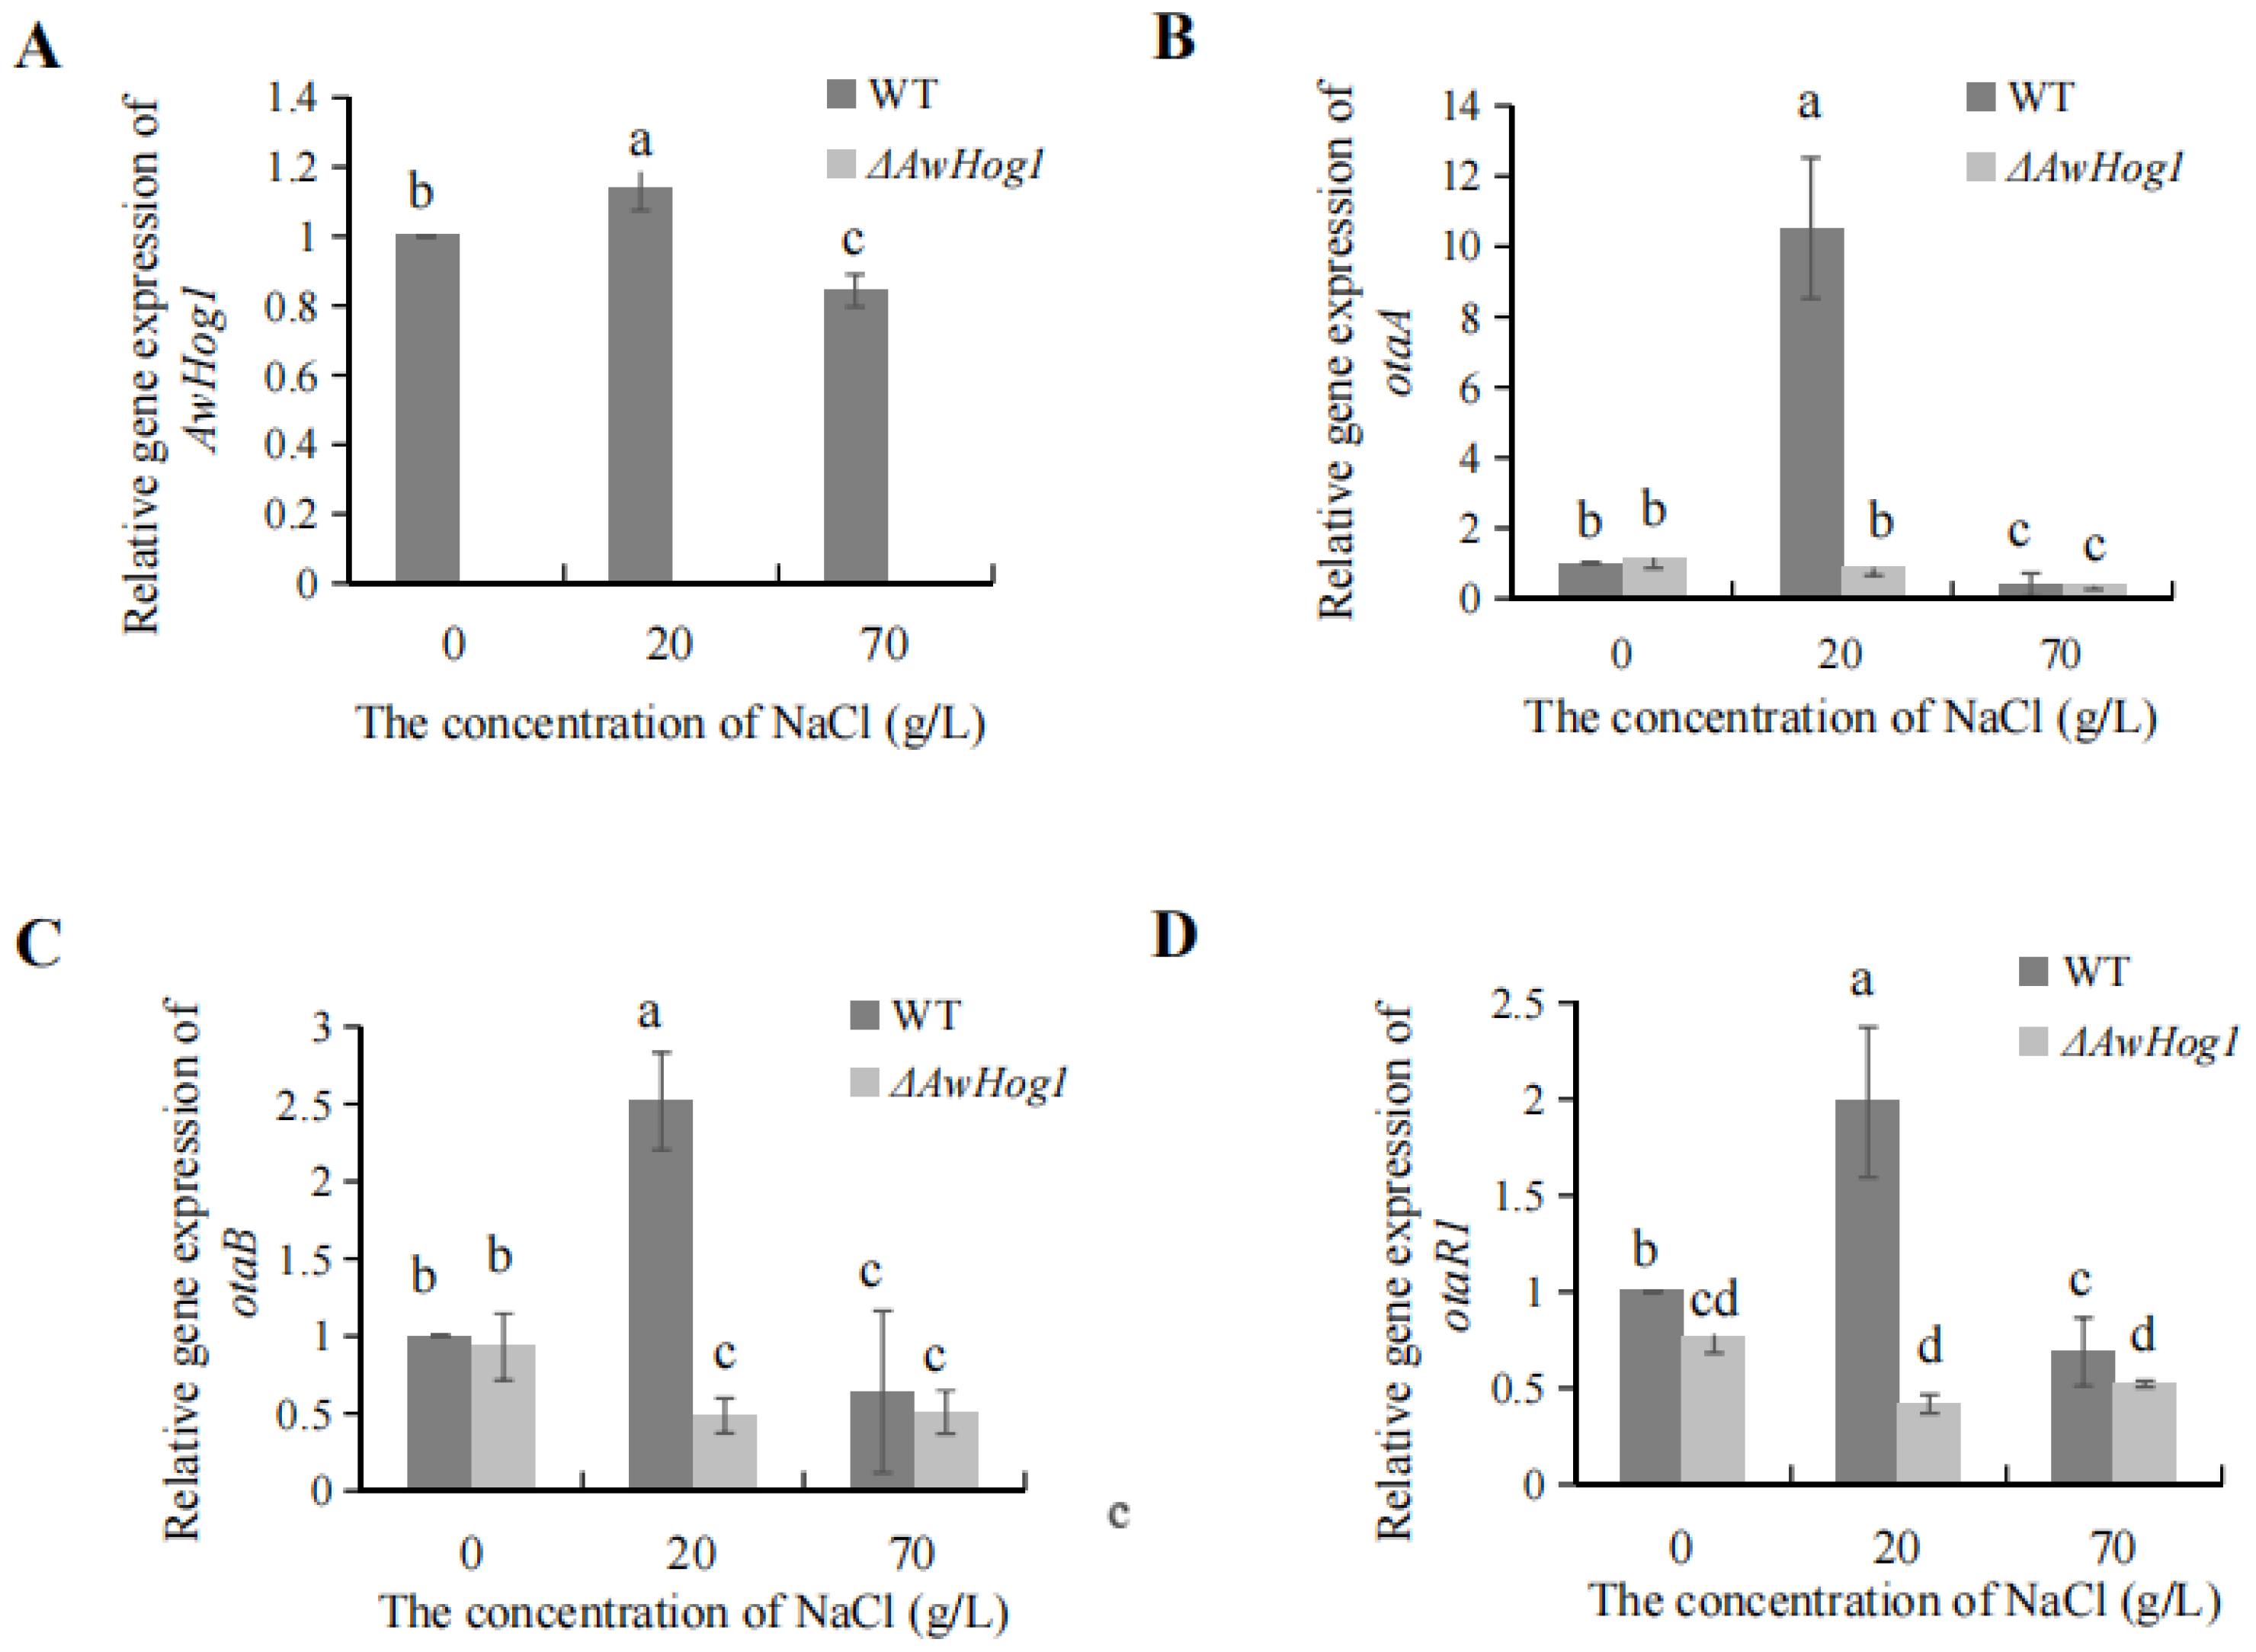
2.6. Relative Expression of AwHog1 and OTA Biosynthetic Genes

The expression of AwHog1 and OTA biosynthetic genes under different concentrations of NaCl was detected by PCR. Compared with the wild type, the AwHog1 gene was not expressed in the ΔAwHog1 mutant at different NaCl concentrations (Figure 6A). The expression of OTA biosynthetic genes tended to initially increase and then decrease with the increase in the concentration of NaCl, and the phenomenon was similar to the level of the AwHog1 gene (Figure 6). The relative gene expression of otaA, otaB, and otaR1 in the ΔAwHog1 mutant was lower than that of the wild type in the media without NaCl (Figure 6B–D). The difference was more obviously affected by the deletion of AwHog1 in the medium containing 20 g/L NaCl. The OTA content was not detectable in ΔAwHog1 mutant without salt addition, and the OTA accumulation was the largest in the ΔAwHog1 mutant and the wild type under 20 g/L NaCl. The tendency of OTA biosynthetic gene expression was similar to OTA accumulation changes.

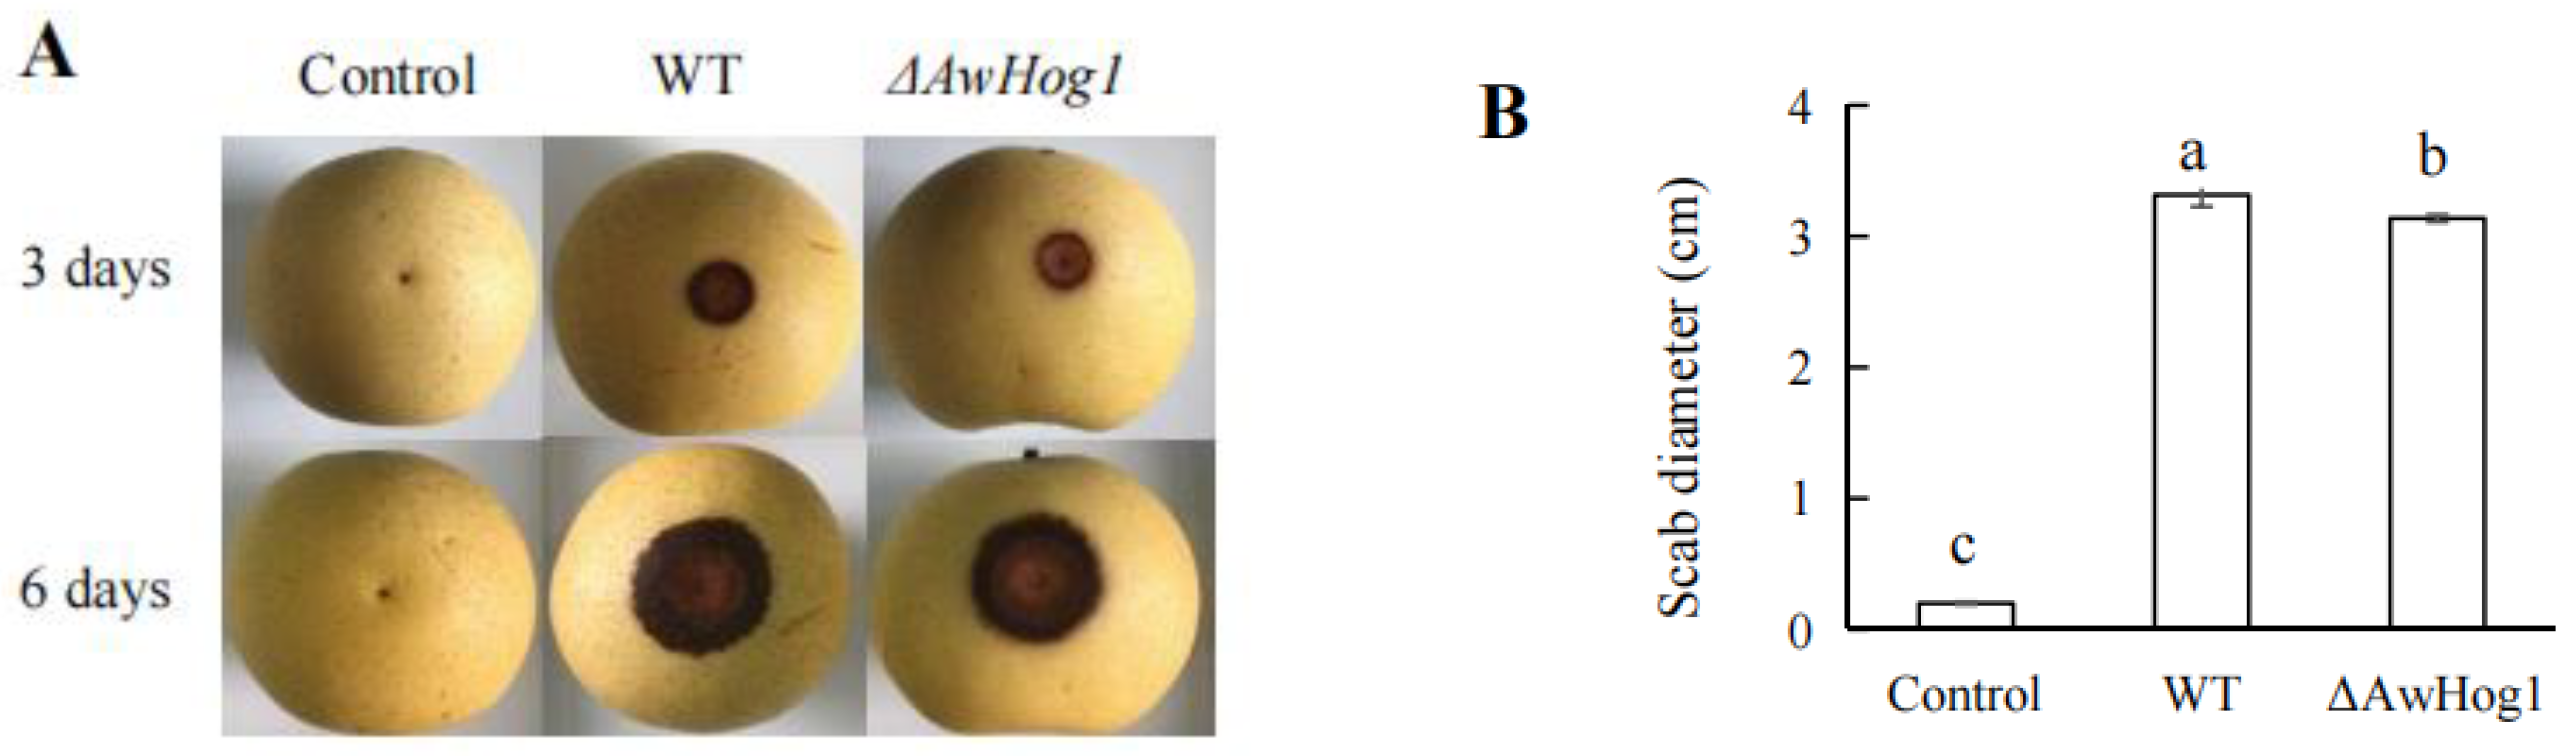
2.7. Transcription Factor AwHog1 in A. westerdijkiae fc-1 Is Essential for Fungi Infection

A. westerdijkiae fc-1 and the ΔAwHog1 mutant were inoculated into pears to determine whether AwHog1 plays a role in the ability to infect. At 6 days after infection, the diameter of the lesion was measured (Figure 7). After 6 days of incubation, the scab diameter of the wild type-infected pear was 3.32 ± 0.09 cm, while the scab diameter of the ΔAwHog1 mutant-infected pear was 3.13 ± 0.02 cm. The scab diameter of the infection from the ΔAwHog1 mutant is about 6% smaller than that of wild type, which demonstrates that AwHog1 actively regulates A. westerdijkiae’s capacity for infection.

3. Discussion

In this study, we have successfully constructed a ΔAwHog1 mutant. Then, by analysing the effects of AwHog1 deletion on colony morphology, mycelium growth, spore generation, toxin accumulation under osmotic stress, and the infection capacity of A. westerdijkiae, the role of the transcription factor AwHog1 was identified. We discovered that the ΔAwHog1 mutant had growth flaws, a reduction in the amount of ochratoxin A produced on various mediums, increased sensitivity to osmotic stress, and impaired infection capacity. These might be connected to the HOG pathway that the Hog1 gene activates.
The expression of the Hog1 gene encoding transcription factor can regulate the adaptive response to osmotic stress and can mediate the responses induced by osmotic stress [28,29]. In Sclerotinia sclerotiorum, the increased sensitivity to NaCl and glucose media was observed in ΔAwHog1 mutants, which is in line with previous research findings that Hog1 mutants were more sensitive to sugars and NaCl [30]. The members involved in the HOG pathway show the characteristics of adapting to the osmotic stress source in filamentous fungi. There was an increased sensitivity to hyperosmolarity in the Hog1 mutant of M. oryzae. The elements SKN7 and SsK1 in the HOG pathway have been shown to have a role in the effects of osmotic stress [31]. Meanwhile, the Hog1 gene could influence mycelium growth and spore number. The bos5 gene was identified as a key component of the HOG pathway. It has been found that the deletion of the bos5 gene in B. cinerea would result in a significant decrease in the growth rate and spore yield of the aerial mycelium [32]. The StPBS2 gene was found to be involved in the HOG pathway mechanism. In comparison with the wild type strain, the StPBS2 gene showed decreased colony growth in Setosphaeria turcica [33].
The Hog signal pathway plays a major role in the biosynthesis of toxins and accumulation in filamentous fungi. The transcriptomics was applied to study OTA biosynthetic expression genes and stress-related genes in P. nordicum strains [34]. P. nordicum is able to successfully adapt to the high osmolarity stress caused by the production of up to 22% NaCl in the manufacture of cured meats such as sausages and hams [35]. FgPrb1 is involved in the osmotic stress response of Fusarium graminearum via the HOG pathway. It has been shown that DON biosynthesis and the pathogenicity of F. graminearum were greatly reduced when FgPrb1 was deleted [36]. The quantitative PCR outcomes of this investigation showed that the expression of OTA biosynthetic genes in the ΔAwHog1 mutant was lower than that of the wild type. We found that compared with the wild type, deletion of the AwHog1 gene would reduce the mycelium growth rate, spore number, and OTA accumulation.
The HOG pathway is particularly important in pathogenic fungi because of its traits related to pathogenicity. The inactivation of HOG pathway components could decrease the pathogenicity of fungi. These include biofilm formation, surface adhesion, morphological occurrence, and epigenetic transformation [37]. The STK1 was found to be highly homologous with the HOG MAPK gene HOG1 of Saccharomyces cerevisiae and it had diminished virulence, a significantly altered toxin, and reduced pathogenicity on the leaves of susceptible inbred corn OH43 [38]. Msn2, a general HOG pathway stress response transcription factor, plays pleiotropic roles in infection-related morphogenesis and pathogenicity in pathogenic fungi [39]. The mutants Δpgpbs1 and Δpgpbs showed a decrease in pathogenicity during experimental induction of infection of barley seeds and leaves, indicating that pgpbs1 and pgpbs play key roles in the HOG signalling pathway of P. graminea. [19]. In our study, the diameter of the infection of ΔAwHog1 mutant was about 6% smaller compared with the wild type. As a result, the HOG pathway genes have been shown to improve resistance to some fungi.

4. Conclusions

According to the results, the lack of AwHog1 has a negative effect on colony morphology, mycelial growth, spore production, OTA accumulation, and the infection ability of A. westerdijkiae, while increasing the susceptibility of the mutant to high osmotic pressure environments. Therefore, we believe that the AwHog1 transcription factor plays a key role in influencing A. westerdijkiae growth, hyperosmotic response, OTA biosynthesis, and pathogenicity by regulating HOG pathway.

5. Materials and Methods

5.1. Strains and Media

In this study, the wild type strain A. westerdijkiae fc-1 was isolated and characterized in our laboratory [5]. The strains were usually cultured in the dark at 28 °C. Conidia were scraped from a PDA plate with a sterile cotton swab, cultured for four to eight days, and then resuspended in sterile water. A blood cell counter was used to adjust the number of conidia to 1.0~2.0 × 10⁷ conidia/mL. Conidial suspensions of the wild type and mutant strains were stored at −80 °C with 15% glycerol.

5.2. Culture Conditions

The OTA-producing strain A. westerdijkiae fc-1 was put in potato glucose agar (PDA; potato 200 g/L, glucose 20 g/L, agar 20 g/L) [12] for 7 days. The ΔAwHog1 mutant strain was built and stored in our lab. To produce ochratoxin A, the culture was grown and cultured in yeast extract sucrose agar [12] (YES; Yeast extract 20 g/L, sucrose 150 g/L, agar 15 g/L) with different concentrations of NaCl (0, 20, 40, 60, 80 and 100 g/L) and malt extract-agar (MEA) medium supplemented with glucose in different amounts (0, 50, 100, 150, 200 and 250 g/L). Scraping the PDA plate with a sterile cotton swab was used to obtain the best viable conidia on the 5th day of culture and 10 mL sterile water containing 0.01% Tween 80 was used to collect the spores; spores were counted with a hemocytometer, adjusted to 107 conidia mL−1 [40], and used as an inoculum. The spore suspension was preserved in glycerine solution at −80 °C. Each agar plate was inoculated with 5 μL of spore suspension and incubated at 28 °C for 7 days. All experiments were repeated 3 times, with 3 treatments each time.

5.3. Construction of ΔAwHog1 Deletion Strains

In order to obtain the mycelia for DNA extraction, 10 μL of conidial suspension was inoculated into 20 mL liquid potato glucose broth (PDB) and incubated at 180 r/min [40] and 28 °C. After 84 h of incubation, we collected and dried the mycelium. The mycelium was precooled in liquid nitrogen and stored at −80 °C.
Two pairs of primers were used to detect the insertion of the AwHog1 gene selection marker and the deletion of the AwHog1 gene (Table 1). In order to construct AwHog1-missing strains, primers AwHog1-up-F/R and AwHog1-down-F/R were respectively used to clone the 1.4 Kb upstream and downstream DNA fragments. The hygromycin B phosphotransferase (hyg) gene from the pCAMBIA-1300 vector (Abcam, Cambridge, UK) was cloned using the hyg-F/R primer combination as a resistance marker. The upstream/downstream sequences, hyg gene cassette, and knockout primers AwHog1-knock-F/R were used to obtain a replacement cassette of AwHog1 through nested PCR. A. westerdijkiae protoplasts were created from purified PCR fusion products using the SanPrep column DNA gel extraction kit (SANGON). The preparation of the protoplast and the transformation process were carried out in accordance with the previous work. A total of 300 μL of the transformed product was inoculated into a HYG resistant plate with 100 μg/mL hygromycin B. Each mutant was repeated with ten plates. An ordinary PDA board served as a positive control. A single colony that had been incubating for 3 to 4 days was collected for identification. The specific primers AwHog1-in-F/R and AwHog1-out-F/R were used to identify the ΔAwHog1 mutant. The specific primers AwHog1-in-F/R were used to amplify the internal genes of AwHog1 from the A. westerdijkiae genomic DNA by PCR (Table 1).

5.4. OTA Production Analysis in the ΔAwHog1 Mutants and the Wild Type

In order to investigate the production of OTA, 5 mL of conidial suspension (wild type and ΔAwHog1 mutant) was placed in a 100 mL Ellen Meyer flask containing 25 g of wheat. The initial water activity of wheat was modified to 0.9 from 0.35 by adding 15% water. After incubating at 28 °C for 4 days [41], 5 g wheat culture was added to 25 mL methanol and agitated for 1 min. After centrifugation at 7500 g, the supernatant was separated. The supernatant was then put into a vial after being passed through a 0.22 m filter. Then, a C18 column (4.6 mm × 150 mm, Agilent, Santa Clara, CA, USA) [42] was used, and 20 μL of each sample was injected into an HPLC-FLD consisting of Agilent 1260 infinity, using 330 nm for the excitation wavelength and 460 nm for the fluorescence detector. The mobile phase’s main component was acetonitrile: water: acetic acid (99:99:2 v/v/v); column temperature was 37 °C, and the flow rate was 1 mL/min.

5.5. Mycelial Growth, Conidia Count, and OTA Production

To analyse the colony diameter, 5 μL suspension of 107 conidia mL−1 was positioned in the centre of a solid medium drop by drop. The cross method was used to measure the diameter of the colonies growing every 12 h. Each group was treated with either NaCl or glucose. Colony morphology and colour were observed during culture, and mycelium morphology was observed under a microscope on the 4th day of culture.
Five agar plugs (8 mm in diameter) were removed from the colony and put into 10 mL microreactive tubes with 5 mL sterile water that contained 0.01% Tween 80. The spores were shaken for two hours at room temperature on a rotary shaker, and a hemostatic meter was used to count the conidia (Fisher Scientific Company, Loughborough, UK). All experiments were performed three times for each treatment and repeated twice.
In order to determine the production of ochratoxin A, the strain was incubated on agar plates supplemented with NaCl or glucose at 28 °C. Five 8 mm-diameter agar plugs were removed from the colony and placed in a 2 mL micro reaction tube, and then 1 mL methanol was added. The mycelium of the fungus was extracted for 2 h at room temperature on a rotary shaker; the mycelium was discarded, and OTA was immediately identified by HPLC-FLD after the supernatant was filtered through a 0.22 μm filter and placed in a brown vial.

5.6. Phenotypic Comparison of Wild Type and ΔAwHog1 Mutants in Different High Permeability Conditions

The conidial suspensions (2.5 μL, 107 conidia mL−1) of the wild type strain and ΔAwHog1 mutant were added dropwise to the middle of each plate. Five replicates of each experiment were performed. The culture was incubated in the dark at 28 °C. The growth rate was assessed by examining the colony diameter of the wild type and ΔAwHog1 mutant under different NaCl and glucose conditions every 12 h with the cross-sectional method. The formula below was used to compute the percentage of mycelial growth inhibition: inhibition rate (%) = [(C − T)/C] × 100%, where T was the average colony diameter of the test group given either NaCl or glucose treatment, and C was the average colony diameter of the control group.

5.7. Glycerol Content of Wild Type and ΔAwHog1 Mutant on PDA Medium with Increased NaCl Concentration

Measurements were made of the glycerol content of the wild type and AwHog1 mutant cells cultured on PDA medium with the addition of NaCl. The glycerol assay kit (purchased at the Institute of Bioengineering in Nanjing) employed the GPO Trinder enzymes and the glycerol phosphatase technique to measure the glycerol content of liquid samples using colorimetry. The glycerol concentration was measured according to the formula: Glycerol concentration = [Calibration A/Sample A] × calibration concentration (mmol/L).

5.8. Gene Expression under Various NaCl Environments

The wild type and ΔAwHog1 mutant were cultivated under three distinct NaCl concentrations (0, 20, 70 g/L) to learn how OTA biosynthesis genes are expressed and controlled under various high permeability conditions. Each plate was placed on the same size of cellophane, which is a semi-permeable membrane. The conidial suspensions (200 μL) were inoculated with the wild type and ΔAwHog1 mutants in the centre of the plate. After being cultured at 28 °C for 84 h in the dark, they were discarded. The cultures were collected and immediately precooled in liquid nitrogen and then stored at −80 °C prior to use. The RNA Easy Plant Mini Kit (QIAGEN, Hilden, Germany) was used to extract total RNA. Using an RNAPCR kit (AMV) (TAKARA, Omatsu, Shiga, Japan), reverse transcription PCR (RT-qPCR) was carried out, and the specific primers used are shown in Table 2. The cDNA and primers were mixed with the SYBR green PCR master mixture and RT-qPCR was performed in the 7500 real-time PCR system (Applied Biosystems, Foster City, Foster City, CA, USA). The relative expression of the gene was calculated using the internal control group GADPH, and the relative quantitative expression of the target gene was calculated with the 2−ΔΔCT method, where ∆∆CT = (CT, Target—CT, Gadph) Treatment—(CT, Target—CT, Gadph) Control.

5.9. Infection Ability in Pears

Three pears (Pyrus × bretschneideri) of uniform size without wounds were chosen to test the infection ability of the ΔAwHog1 mutant. The pears were washed three times with 0.01% sodium hypochlorite and then dried. Each pear was pricked with a sterile needle to make a wound (1 mm in diameter and 3–4 mm in depth). Then, with sterile water and OTA standard solution as controls, 10 µL of spore suspension of the wild type and deletion mutant was dropped on the wound. After culturing in the dark at 28 °C for 6 days, the diameter of the colony was measured using the cross-section method and photographs were taken. The conidia suspensions of the wild type and ΔAwHog1 deletion mutant were injected with 10 μL sterile water, respectively, and the OTA standard was used as a control.

5.10. Statistical Analysis

SPSS Statistics 21.0 (Chicago, IL, USA) and Microsoft Excel 2019 (Redmond, WA, USA) were used to conduct all statistical analyses. Analyses of gene expression were evaluated using one-way analysis of variance (ANOVA). The mean value comparison was analysed by the Tukey procedure. The difference was considered significant at p < 0.05.

Author Contributions

Conceptualization, Y.W. (Yan Wang); methodology, F.L. and H.Y.; formal analysis, Y.W. (Yufei Wang) and J.P.; validation, H.Y.; writing—original draft preparation, Y.W. (Yufei Wang) and F.L.; writing—review and editing, H.Y. and Y.W. (Yan Wang); supervision and project administration, Y.W. (Yan Wang); funding acquisition, Y.W. (Yan Wang). All authors have read and agreed to the published version of the manuscript.

Funding

This research was funded by the National Natural Science Foundation of China (31601577), the National Scholarship Fund of China (201603250023), the Key Research and Development Projects of Zhejiang (2021C02058), and the Visiting Scholar Teacher Professional Development Project (FX2022001).

Institutional Review Board Statement

Not applicable.

Informed Consent Statement

Not applicable.

Data Availability Statement

Not applicable.

Conflicts of Interest

The authors declare no conflict of interest. The funders had no role in the design of the study; in the collection, analyses, or interpretation of data; in the writing of the manuscript; or in the decision to publish the results.

References

  1. Wang, Y.; Wang, L.; Liu, F.; Wang, Q.; Selvaraj, J.N.; Xing, F.; Zhao, Y.; Liu, Y. Ochratoxin A producing fungi, biosynthetic pathway and regulatory mechanisms. Toxins 2016, 8, 83. [Google Scholar] [CrossRef] [Green Version]
  2. Al Ayoubi, M.; Solfrizzo, M.; Gambacorta, L.; Watson, I.; El Darra, N. Risk of exposure to aflatoxin B1, ochratoxin A, and fumonisin B1 from spices used routinely in Lebanese cooking. Food Chem. Toxicol. 2021, 147, 111895. [Google Scholar] [CrossRef]
  3. Wang, Y.; Shang, J.; Cai, M.; Liu, Y.; Yang, K. Detoxification of mycotoxins in agricultural products by non-thermal physical technologies: A review of the past five years. Crit. Rev. Food Sci. Nutr. 2022; ahead-of-print. [Google Scholar] [CrossRef]
  4. Wilson, K.A.; Kung, R.W.; Wetmore, S.D. Chapter seven—Toxicology of DNA adducts formed upon human exposure to carcinogens: Insights gained from molecular modeling. In Advances in Molecular Toxicology; Fishbein, J.C., Heilman, J.M., Eds.; Academic Press: Cambridge, MA, USA, 2016; Volume 10, pp. 293–360. [Google Scholar]
  5. Wang, Y.; Wang, L.; Wu, F.; Liu, F.; Wang, Q.; Zhang, X.; Selvaraj, J.N.; Zhao, Y.; Xing, F.; Yin, W.B.; et al. A consensus ochratoxin A biosynthetic pathway: Insights from the genome sequence of Aspergillus ochraceus and a comparative genomic analysis. Appl. Environ. Microbiol. 2018, 84, e01009-18. [Google Scholar] [CrossRef] [Green Version]
  6. Longobardi, C.; Damiano, S.; Andretta, E.; Prisco, F.; Russo, V.; Pagnini, F.; Florio, S.; Ciarcia, R. Curcumin modulates nitrosative stress, inflammation and DNA damage and protects against ochratoxin A-induced hepatotoxicity and nephrotoxicity in rats. Antioxidants 2021, 10, 1239. [Google Scholar] [CrossRef]
  7. Stoll, D.; Schmidt-Heydt, M.; Geisen, R. Differences in the regulation of ochratoxin A by the HOG pathway in Penicillium and Aspergillus in response to high osmolar environments. Toxins 2013, 5, 1282–1298. [Google Scholar] [CrossRef] [Green Version]
  8. Han, X.; Chakrabortti, A.; Zhu, J.; Liang, Z.-X.; Li, J. Sequencing and functional annotation of the whole genome of the filamentous fungus Aspergillus westerdijkiae. BMC Genom. 2016, 17, 633. [Google Scholar] [CrossRef] [Green Version]
  9. Rodríguez, A.; Medina, Á.; Córdoba, J.J.; Magan, N. Development of a HOG-based real-time PCR method to detect stress response changes in mycotoxigenic moulds. Food Microbiol. 2016, 57, 109–115. [Google Scholar] [CrossRef]
  10. Schmidt-Heydt, M.; Graf, E.; Stoll, D.; Geisen, R. The biosynthesis of ochratoxin A by Penicillium as one mechanism for adaptation to NaCl rich foods. Food Microbiol. 2012, 29, 233–241. [Google Scholar] [CrossRef]
  11. Delgado, J.; da Cruz Cabral, L.; Rodríguez, M.; Rodríguez, A. Influence of ochratoxin A on adaptation of Penicillium nordicum on a NaCl-rich dry-cured ham-based medium. Int. J. Food Microbiol. 2018, 272, 22–28. [Google Scholar] [CrossRef]
  12. Wang, Y.; Yan, H.; Neng, J.; Gao, J.; Yang, B.; Liu, Y. The influence of NaCl and glucose content on growth and ochratoxin A production by Aspergillus ochraceus. Aspergillus carbonarius and Penicillium nordicum. Toxins 2020, 12, 515. [Google Scholar] [CrossRef]
  13. De Nadal, E.; Posas, F. The HOG pathway and the regulation of osmoadaptive responses in yeast. FEMS Yeast Res. 2022, 22, foac013. [Google Scholar] [CrossRef]
  14. Zhu, J.; Ying, S.; Feng, M. The Pal pathway required for ambient pH adaptation regulates growth, conidiation, and osmotolerance of Beauveria bassiana in a pH-dependent manner. Appl. Microbiol. Biot. 2016, 100, 4423–4433. [Google Scholar] [CrossRef]
  15. Yang, Q.; Li, J.; Sun, J.; Cui, X. Comparative transcriptomic and proteomic analyses to determine the lignin synthesis pathway involved in the fungal stress response in Panax notoginseng. Physiol. Mol. Plant Pathol. 2022, 11, 101814. [Google Scholar] [CrossRef]
  16. Dihazi, H.; Kessler, R.; Eschrich, K. High Osmolarity Glycerol (HOG) pathway-induced phosphorylation and activation of 6-phosphofructo-2-kinase are essential for glycerol accumulation and yeast cell proliferation under hyperosmotic stress. J. Biol. Chem. 2004, 279, 23961–23968. [Google Scholar] [CrossRef] [Green Version]
  17. Álvarez, M.; Rodríguez, A.; Núñez, F.; Silva, A.; Andrade, M.J. In vitro antifungal effects of spices on ochratoxin A production and related gene expression in Penicillium nordicum on a dry-cured fermented sausage medium. Food Control 2020, 114, 107222. [Google Scholar] [CrossRef]
  18. Graf, E.; Schmidt-Heydt, M.; Geisen, R. HOG MAP kinase regulation of alternariol biosynthesis in Alternaria alternata is important for substrate colonization. Int. J. Food Microbiol. 2012, 157, 353–359. [Google Scholar] [CrossRef]
  19. Liang, Q.; Li, B.; Wang, J.; Ren, P.; Yao, L.; Meng, Y.; Si, E.; Shang, X.; Wang, H. PGPBS, a mitogen-activated protein kinase kinase, is required for vegetative differentiation, cell wall integrity, and pathogenicity of the barley leaf stripe fungus Pyrenophora graminea. Gene 2019, 696, 95–104. [Google Scholar] [CrossRef]
  20. Lemos, P.; Ruiz-Roldán, C.; Hera, C. Role of the phosphatase Ptc1 in stress responses mediated by CWI and HOG pathways in Fusarium oxysporum. Fungal Genet. Biol. 2018, 118, 10–20. [Google Scholar] [CrossRef]
  21. Yamaguchi, Y.; Katsuki, Y.; Tanaka, S.; Kawaguchi, R.; Denda, H.; Ikeda, T.; Funato, K.; Tani, M. Protective role of the HOG pathway against the growth defect caused by impaired biosynthesis of complex sphingolipids in yeast Saccharomyces cerevisiae. Mol. Microbiol. 2018, 107, 363–386. [Google Scholar] [CrossRef] [Green Version]
  22. Zuchman, R.; Koren, R.; Horwitz, B.A. Developmental roles of the hog1 protein phosphatases of the maize pathogen Cochliobolus heterostrophus. J. Fungi 2021, 7, 83. [Google Scholar] [CrossRef]
  23. Zhang, M.; Gao, Z.-C.; Chi, Z.; Liu, G.-L.; Hu, Z.; Chi, Z.-M. cAMP-PKA and HOG1 signaling pathways regulate liamocin production by different ways via the transcriptional activator Msn2 in Aureobasidium melanogenum. Enzym. Microb. Technol. 2021, 143, 109705. [Google Scholar] [CrossRef]
  24. Schmidt-Heydt, M.; Stoll, D.A.; Mrohs, J.; Geisen, R. Intraspecific variability of HOG1 phosphorylation in Penicillium verrucosum reflects different adaptation levels to salt rich habitats. Int. J. Food Microbiol. 2013, 165, 246–250. [Google Scholar] [CrossRef]
  25. Kohut, G.; Ádám, A.L.; Fazekas, B.; Hornok, L. N-starvation stress induced FUM gene expression and fumonisin production is mediated via the HOG-type MAPK pathway in Fusarium proliferatum. Int. J. Food Microbiol. 2009, 130, 65–69. [Google Scholar] [CrossRef]
  26. Gu, Q.; Zhang, C.; Yu, F.; Yin, Y.; Shim, W.-B.; Ma, Z. Protein kinase FgSch9 serves as a mediator of the target of rapamycin and high osmolarity glycerol pathways and regulates multiple stress responses and secondary metabolism in Fusarium graminearum. Environ. Microbiol. 2015, 17, 2661–2676. [Google Scholar] [CrossRef]
  27. Yuan, J.; Chen, Z.; Guo, Z.; Li, D.; Zhang, F.; Shen, J.; Zhang, Y.; Wang, S.; Zhuang, Z. PbsB regulates morphogenesis, aflatoxin B1 biosynthesis, and pathogenicity of Aspergillus flavus. Front. Cell. Infect. Microbiol. 2018, 8, 162. [Google Scholar] [CrossRef] [Green Version]
  28. Hayes, B.M.E.; Anderson, M.A.; Traven, A.; van der Weerden, N.L.; Bleackley, M.R. Activation of stress signalling pathways enhances tolerance of fungi to chemical fungicides and antifungal proteins. Cell. Mol. Life Sci. 2014, 71, 2651–2666. [Google Scholar] [CrossRef]
  29. Lee, D.W.; Hong, C.P.; Thak, E.J.; Park, S.G.; Lee, C.H.; Lim, J.Y.; Seo, J.A.; Kang, H.A. Integrated genomic and transcriptomic analysis reveals unique mechanisms for high osmotolerance and halotolerance in Hyphopichia yeast. Environ. Microbiol. 2021, 23, 3499–3522. [Google Scholar] [CrossRef]
  30. Li, T.; Xiu, Q.; Wang, J.; Duan, Y.; Zhou, M. A putative MAPK kinase kinase gene Ssos4 is involved in mycelial growth, virulence, osmotic adaptation, and sensitivity to fludioxonil and is essential for SsHog1 phosphorylation in Sclerotinia sclerotiorum. Phytopathology 2021, 111, 521–530. [Google Scholar] [CrossRef]
  31. Motoyama, T.; Ochiai, N.; Morita, M.; Iida, Y.; Usami, R.; Kudo, T. Involvement of putative response regulator genes of the rice blast fungus Magnaporthe oryzae in osmotic stress response, fungicide action, and pathogenicity. Curr. Genet. 2008, 54, 185–195. [Google Scholar] [CrossRef]
  32. Yan, L.; Yang, Q.; Sundin, G.W.; Li, H.; Ma, Z. The mitogen-activated protein kinase kinase BOS5 is involved in regulating vegetative differentiation and virulence in Botrytis cinerea. Fungal Gent. Biol. 2010, 47, 753–760. [Google Scholar] [CrossRef]
  33. Gong, X.-D.; Feng, S.-Z.; Zhao, J.; Tang, C.; Tian, L.; Fan, Y.-S.; Cao, Z.-Y.; Hao, Z.-M.; Jia, H.; Zang, J.-P.; et al. StPBS2, a MAPK kinase gene, is involved in determining hyphal morphology, cell wall development, hypertonic stress reaction as well as the production of secondary metabolites in Northern Corn Leaf Blight pathogen Setosphaeria turcica. Microbiol. Res. 2017, 201, 30–38. [Google Scholar] [CrossRef]
  34. Schmidt-Heydt, M.; Graf, E.; Batzler, J.; Geisen, R. The application of transcriptomics to understand the ecological reasons of ochratoxin a biosynthesis by Penicillium nordicum on sodium chloride rich dry cured foods. Trends Food Sci. Technol. 2011, 22, S39–S48. [Google Scholar] [CrossRef]
  35. Rodríguez, A.; Medina, Á.; Córdoba, J.J.; Magan, N. The influence of salt (NaCl) on ochratoxin A biosynthetic genes, growth and ochratoxin A production by three strains of Penicillium nordicum on a dry-cured ham-based medium. Int. J. Food Microbiol. 2014, 178, 113–119. [Google Scholar] [CrossRef]
  36. Xu, L.; Wang, H.; Zhang, C.; Wang, J.; Chen, A.; Chen, Y.; Ma, Z. System-wide characterization of subtilases reveals that subtilisin-like protease FgPrb1 of Fusarium graminearum regulates fungal development and virulence. Fungal Genet. Biol. 2020, 144, 103449. [Google Scholar] [CrossRef]
  37. Román, E.; Correia, I.; Prieto, D.; Alonso, R.; Pla, J. The HOG MAPK pathway in Candida albicans: More than an osmosensing pathway. Int. Microbiol. 2020, 23, 23–29. [Google Scholar] [CrossRef]
  38. Li, P.; Gong, X.-D.; Jia, H.; Fan, Y.-S.; Zhang, Y.-F.; Cao, Z.-Y.; Hao, Z.-M.; Han, J.-M.; Gu, S.-Q.; Dong, J.-G. MAP kinase gene STK1 is required for hyphal, conidial, and appressorial development, toxin biosynthesis, pathogenicity, and hypertonic stress response in the plant pathogenic fungus Setosphaeria turcica. J. Integr. Agric. 2016, 15, 2786–2794. [Google Scholar] [CrossRef]
  39. Tian, L.; Yu, J.; Wang, Y.; Tian, C. The C2H2 transcription factor VdMsn2 controls hyphal growth, microsclerotia formation, and virulence of Verticillium dahliae. Fungal Biol. 2017, 121, 1001–1010. [Google Scholar] [CrossRef]
  40. Wang, Y.; Liu, F.; Wang, L.; Wang, Q.; Selvaraj, J.N.; Zhao, Y.; Wang, Y.; Xing, F.; Liu, Y. pH-signaling transcription factor AopacC regulates ochratoxin A biosynthesis in Aspergillus ochraceus. J. Agric. Food Chem. 2018, 66, 4394–4401. [Google Scholar] [CrossRef]
  41. Liu, F.; Wang, Y.; Wang, L.; Wang, Q.; Wang, Y.; Liu, Y. Effect of different media on the growth and toxicity production capacity of Aspergillus ochraceus. J. Nucl. Agric. Sci. 2017, 31, 702–710. [Google Scholar]
  42. Wang, Y.; Zheng, Y.; Zhou, A.; Neng, J.; Wu, D.; Shen, L.X.; Lou, X. Transcriptomic analysis reveals the inhibition mechanism of pulsed light on fungal growth and ochratoxin A biosynthesis in Aspergillus carbonarius. Food Res. Int. 2023, 165, 112501. [Google Scholar] [CrossRef]
Figure 1. Phylogenetic tree of AwHog1 in A. westerdijkiae fc-1 with 11 fungal Hog homologs genes.
Toxins 15 00432 g001
Figure 2. Construction of the ΔAwHog1 mutant and characteristic analysis. (A) Construction of the ΔAwHog1 mutant, (B) Colonies of the ΔAwHog1 mutant and the wild type grown on PDA plates at 1.5 M glucose, 1.7 M NaCl, and PDA medium, which was used as a control. Strains were incubated at 28 °C for 6 days and photographed. (C) OTA content of the wild type and the ΔAwHog1 mutant grown on wheat medium. Chromatograms of different concentrations of OTA detected in the wild type (D) and the ΔAwHog1 mutant (E). Different letters indicate a significant difference between the corresponding values (p < 0.05).
Toxins 15 00432 g002
Figure 3. The colony of the ΔAwHog1 mutant and the wild type after incubation at 28 °C for 84 h (A) Colonies of the wild type and the ΔAwHog1 mutant grown on 0, 20, 40, 60, 80, 100 g/L NaCl-supplemented PDA plates. (B) The colony diameter of the ΔAwHog1 mutant and the wild type grown on glucose-supplemented PDA plates at different cultivation times. (C) Colonies of ΔAwHog1(dotted line) and the wild type (full line) grown on media supplemented with 0 g/L NaCl (rotundity), 60 g/L NaCl (triangle), and 150 g/L glucose (lozenge).
Toxins 15 00432 g003
Figure 4. Response of the wild type and the ΔAwHog1 mutant of A. westerdijkiae at different concentrations of NaCl and glucose. Colony growth diameters of the wild type and the ΔAwHog1 mutant under different concentrations of NaCl (A) or glucose (B). Spore numbers of the ΔAwHog1 mutant and the wild type under different concentrations of NaCl (C) or glucose (D). OTA production of the ΔAwHog1 mutant and the wild type under different concentrations of NaCl (E) or glucose (F). Different letters indicate a significant difference between the corresponding values (p < 0.05).
Toxins 15 00432 g004
Figure 5. The glycerol content of the ΔAwHog1 mutant and the wild type at different concentrations of NaCl. Different letters show a significant difference between the corresponding values (p < 0.05).
Toxins 15 00432 g005
Figure 6. The relative levels of gene expression of AwHog1 (A) and OTA biosynthetic genes otaA (B), otaB (C), and otaR1 (D) under different concentrations of NaCl. Different letters show a significant difference between the corresponding values (p < 0.05).
Toxins 15 00432 g006
Figure 7. Pathogenicity assay for the ΔAwHog1 mutant and the wild type strains in A. westerdijkiae fc-1 on pears (Pyrus × bretschneideri). (A) The infected pears were photographed after 6 days of 28 °C incubation. (B) The diameter of the scab was measured by the cross-section method. Control, pears are infected with the same amount of water instead of spore suspension. Different letters indicate a significant difference between the corresponding values (p < 0.05).
Toxins 15 00432 g007
Table 1. Primers used for constructing ΔAwHog1 cassettes and screening transformants.
Primer NameSequence (5′ to 3′)Base (bp)Product Size (bp)
AwHog1-UpForward—AGGAACATCTTGCATGGGCA201425
Reverse—CAAAATAGGCATTGATGTGTT
GACCTCCCAGCCATACCAGACCAGTCC
48
AwHog1-DownForward—CTCGTCCGAGGGCAAAGGAAT
AGAGTAGACGATGCTGAGCTACCAGTG
481548
Reverse—TCCTGGTGATACGGAGGGAG20
AwHog1-KnockForward—TTGGGGTTCTAGTCCGTGTC203698
Reverse—GGCAGTCACTTACCTCGCAT20
AwHog1-Out-FForward—TTGTGGAGACAAGGAAGCCG20860
Reverse—TCGAAGCTGAAAGCACGAGA20
AwHog1-In-FForward—GCGTTTGGACTGGTCTGGTA201795
Reverse—TTGACATGGTCCTTTCCGGG20
Table 2. Primers used to amplify GADPH, otaA, otaB, otaR1, and AwHog1 through real time PCR.
Primer NameSequence (5′ to 3′)
GADPH-FCGGCAAGAAGGTTCAGTT
GADPH-RCTCGTTGGTGGTGAAGAC
otaA-FGGATCTTTATGACCGAATCAG
otaA-RCCTTGACCTGAAGAATGCT
otaB-FATACCACCAGAGCTCCAAA
otaB-RGAGATGTTCGGTCTGTTCA
otaR1-FGCTTTCAAATCGAATGATTCC
otaR1-RGATCGGTTGGAAGTGTAGAA
AwHog1-FGGTCGCCGTCAAAAAGATTA
AwHog1-RCAGCTCGGTCACGAAGTAGA
Disclaimer/Publisher’s Note: The statements, opinions and data contained in all publications are solely those of the individual author(s) and contributor(s) and not of MDPI and/or the editor(s). MDPI and/or the editor(s) disclaim responsibility for any injury to people or property resulting from any ideas, methods, instructions or products referred to in the content.

