Dissolved Algal Toxins along the Southern Coast of British Columbia Canada

 ,
,
Abstract
1. Introduction
2. Results
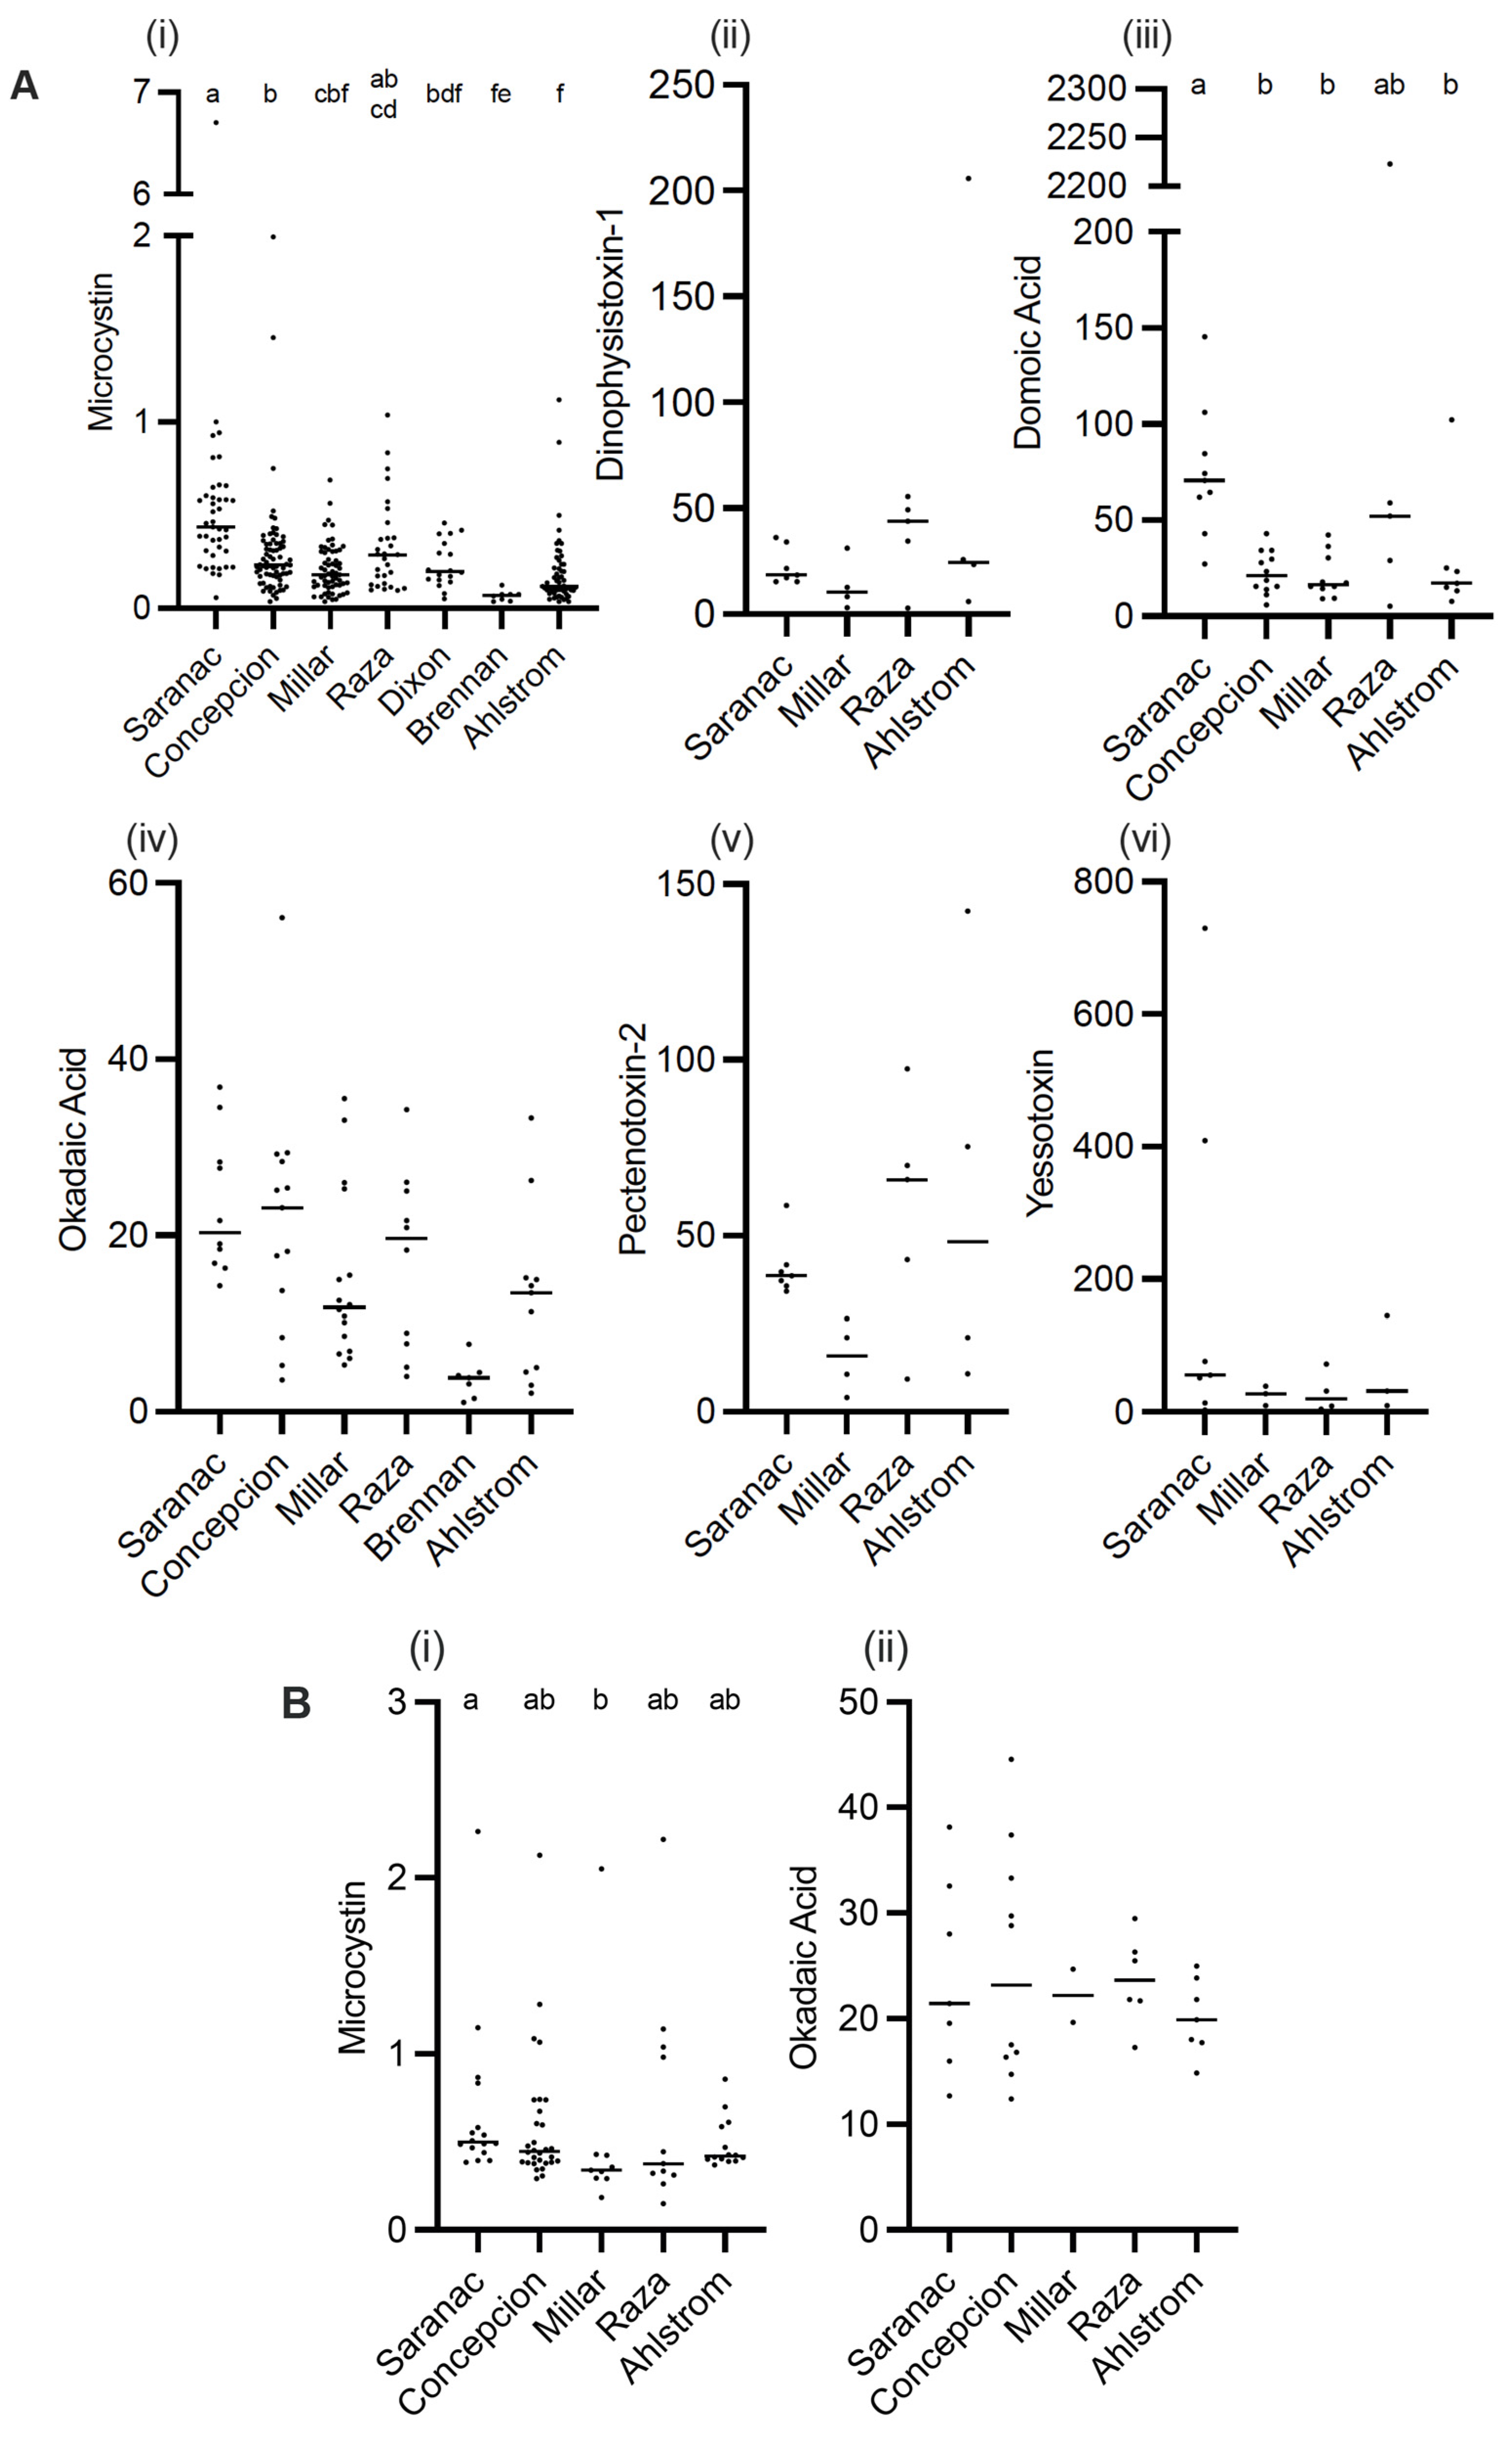
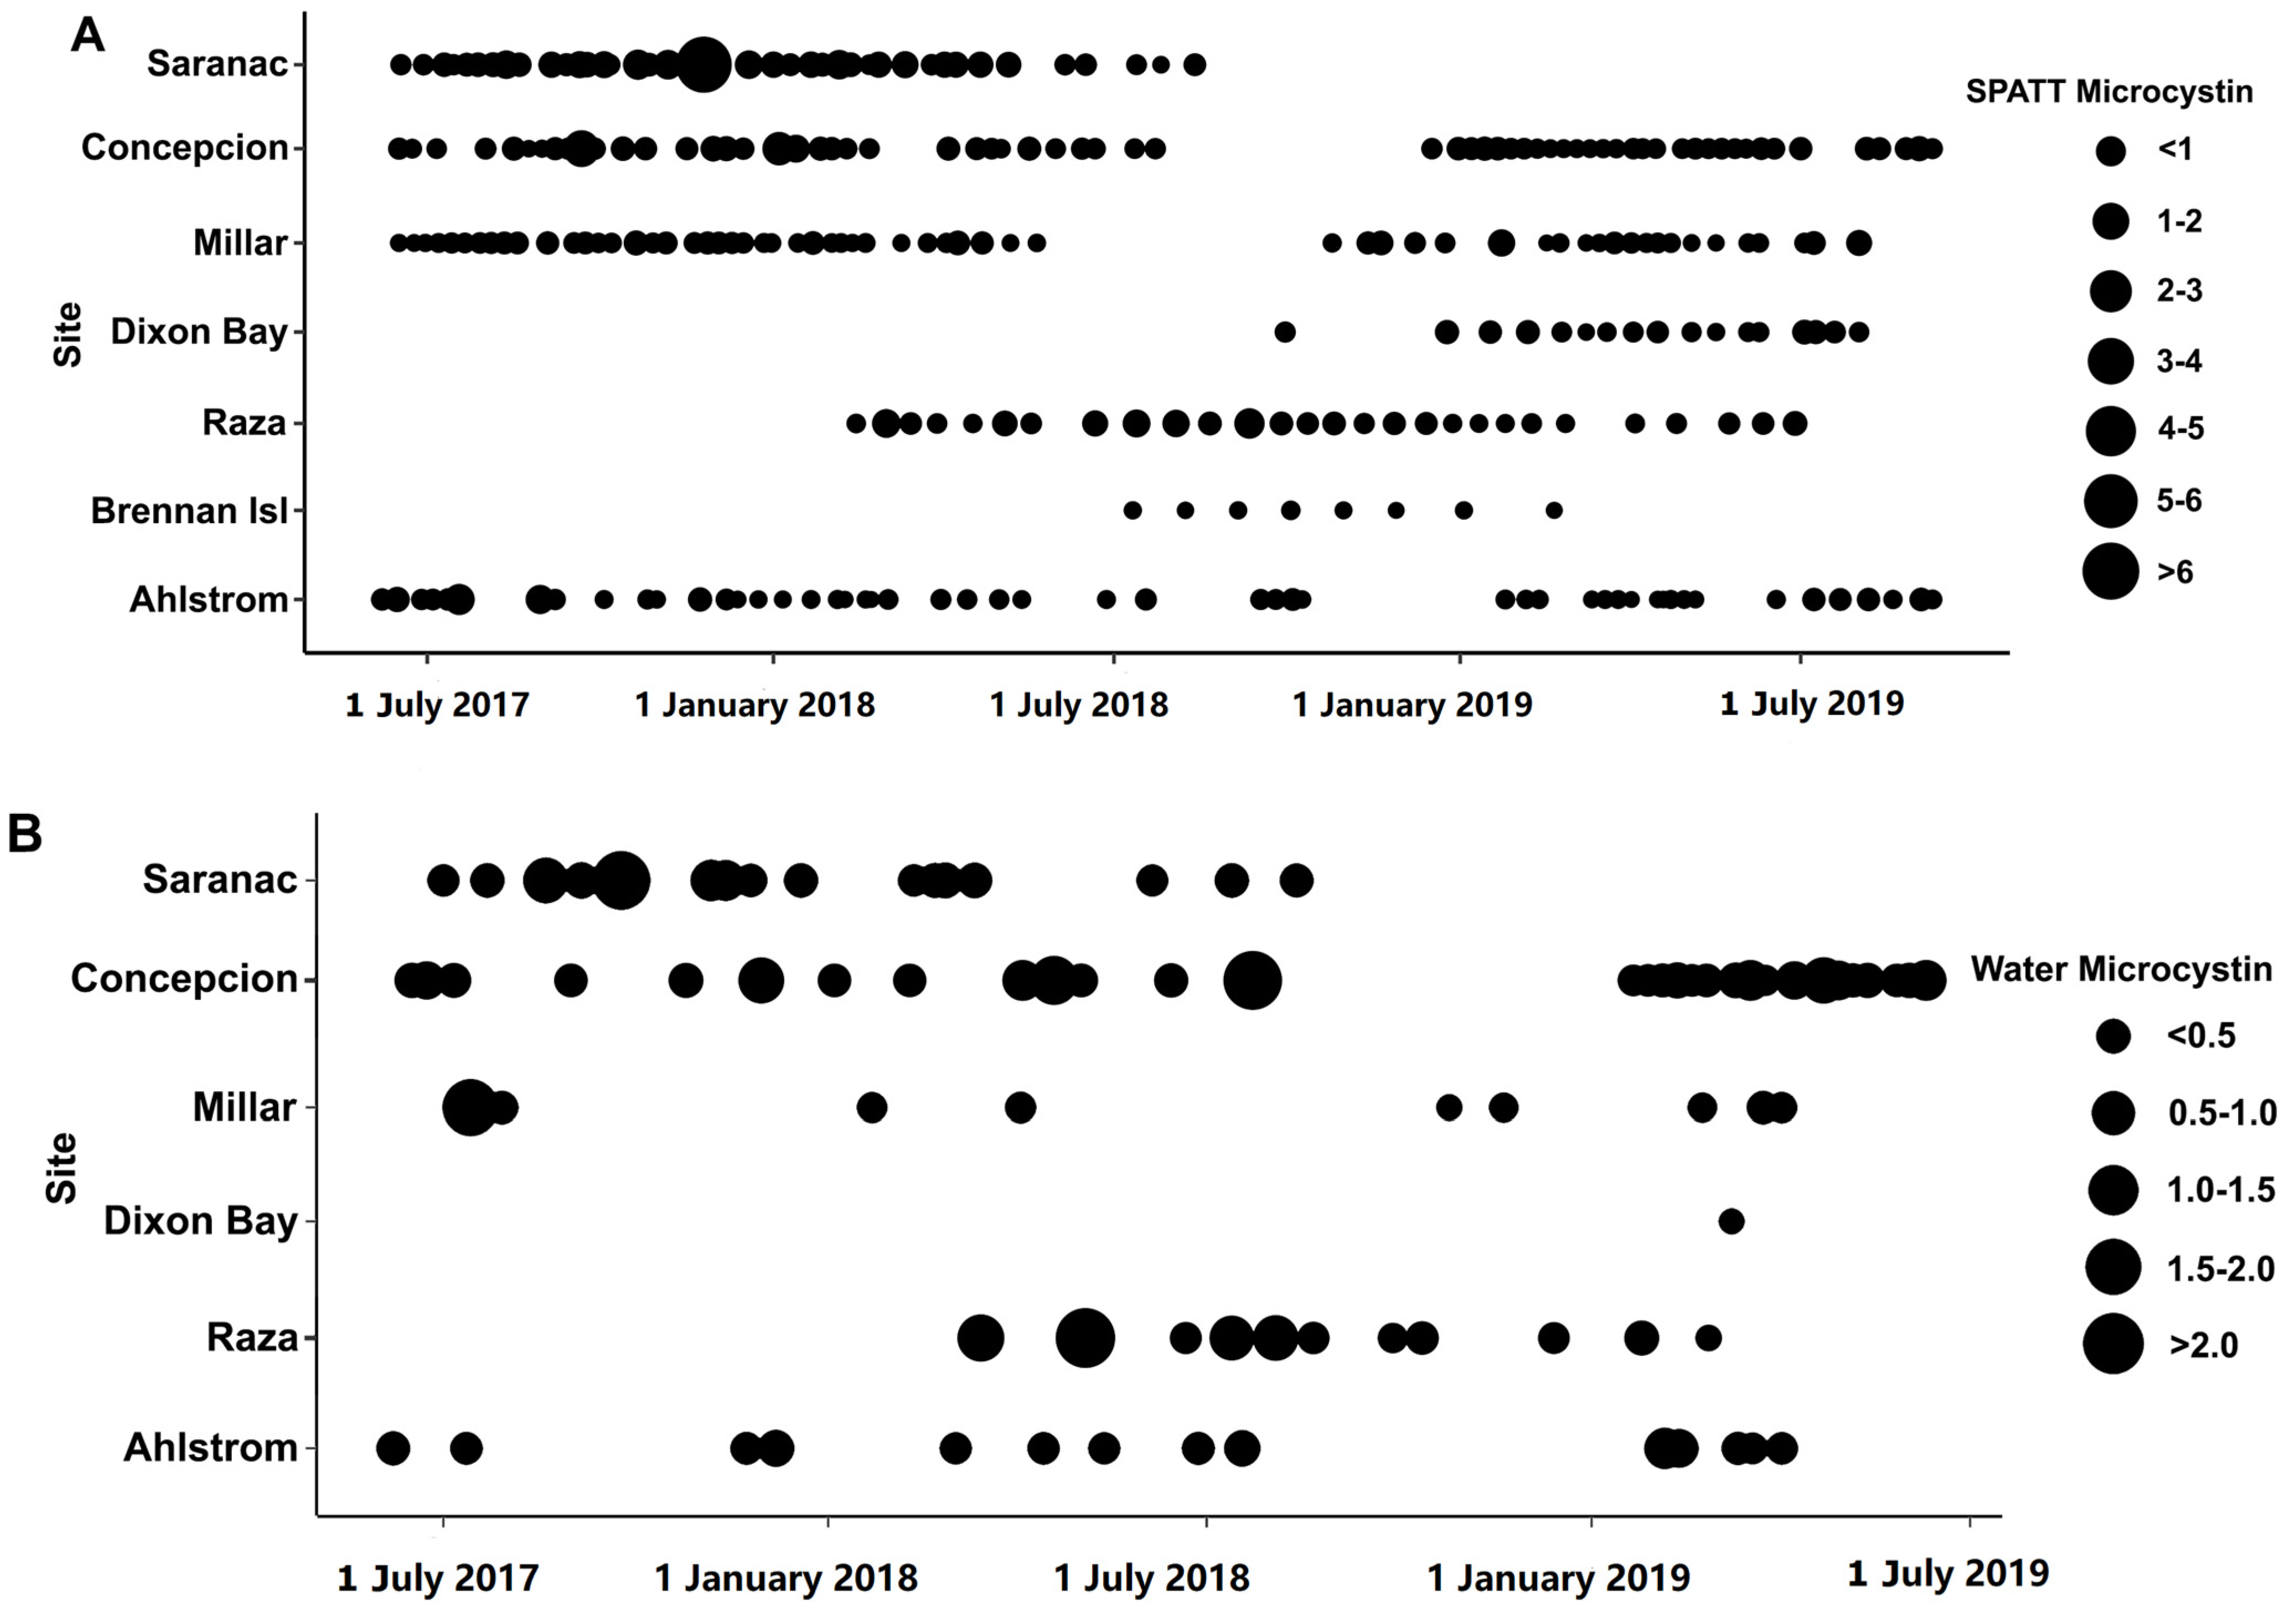
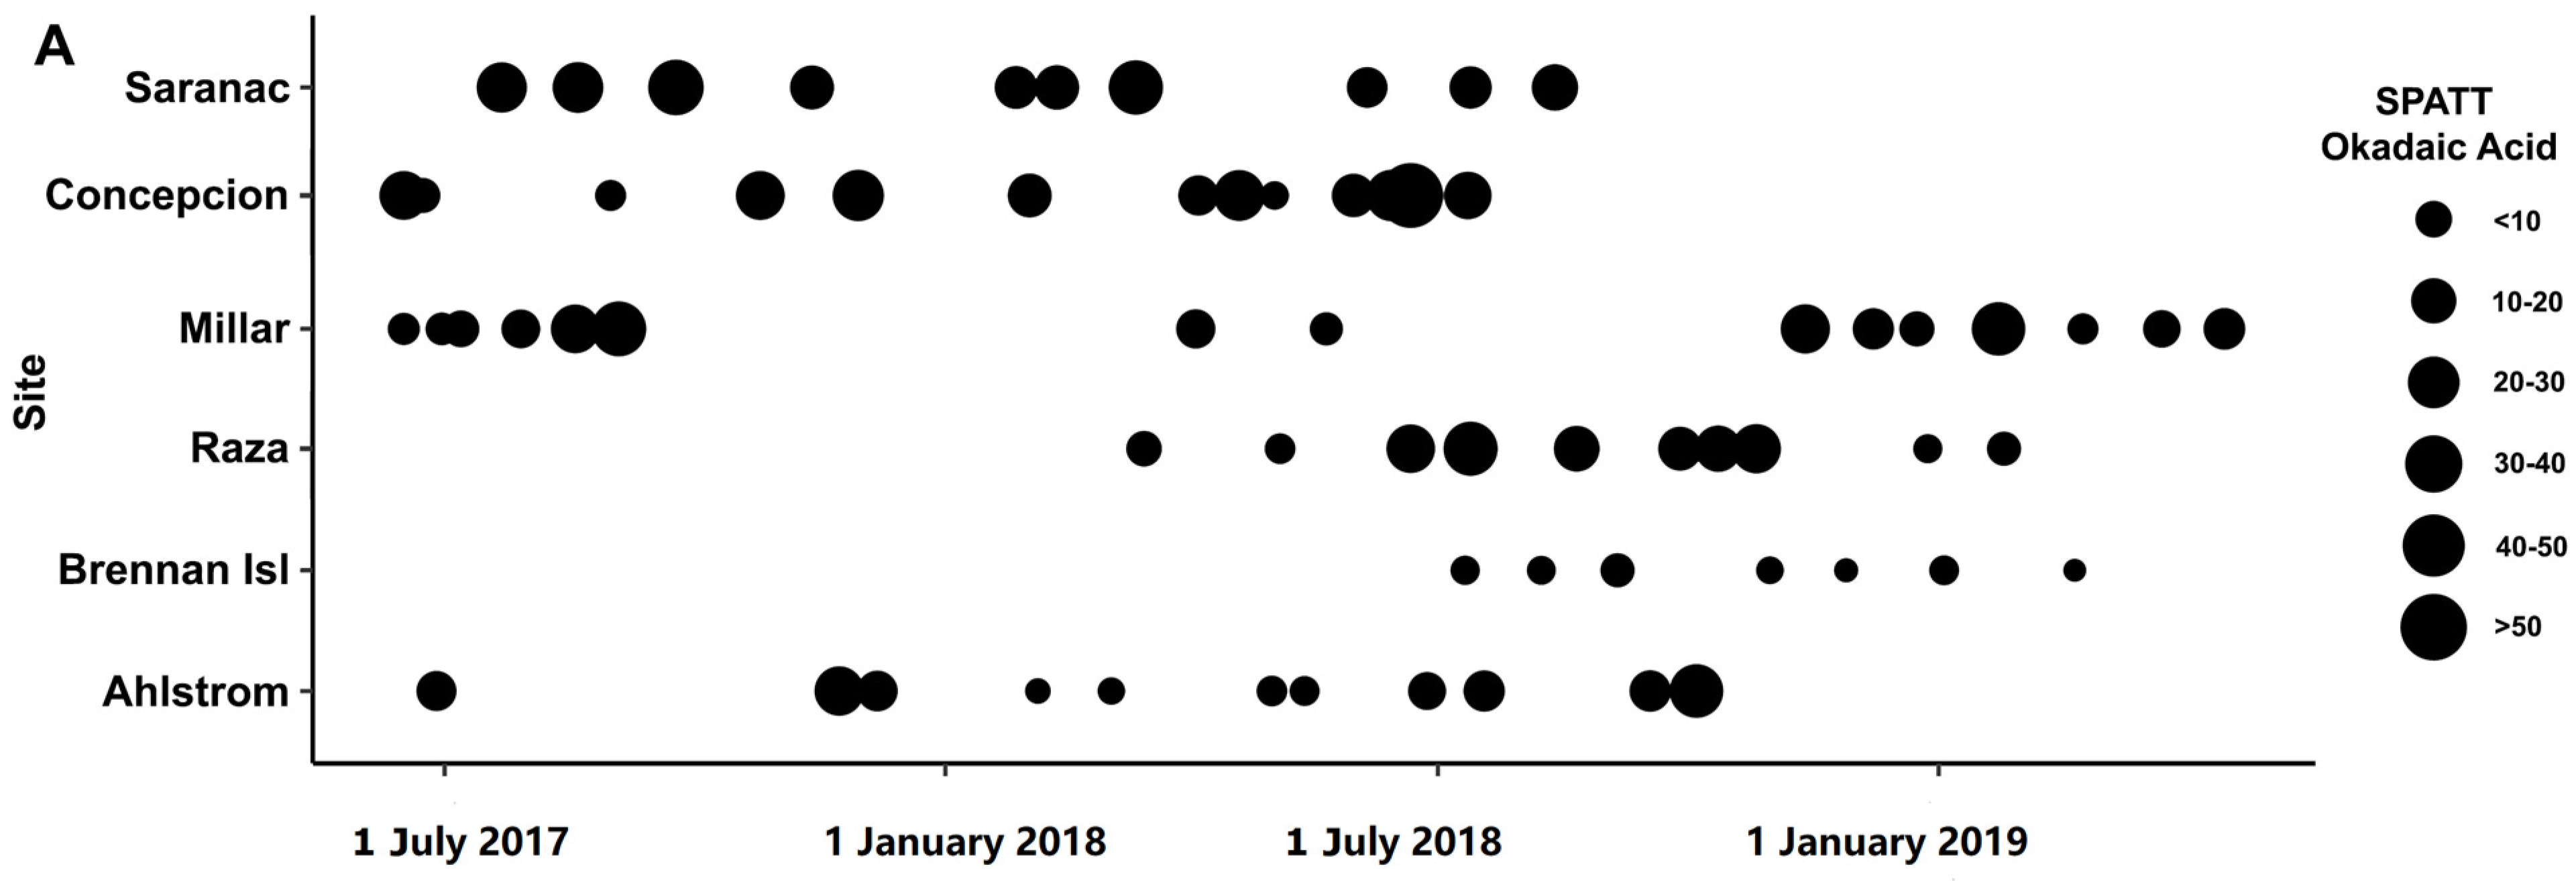
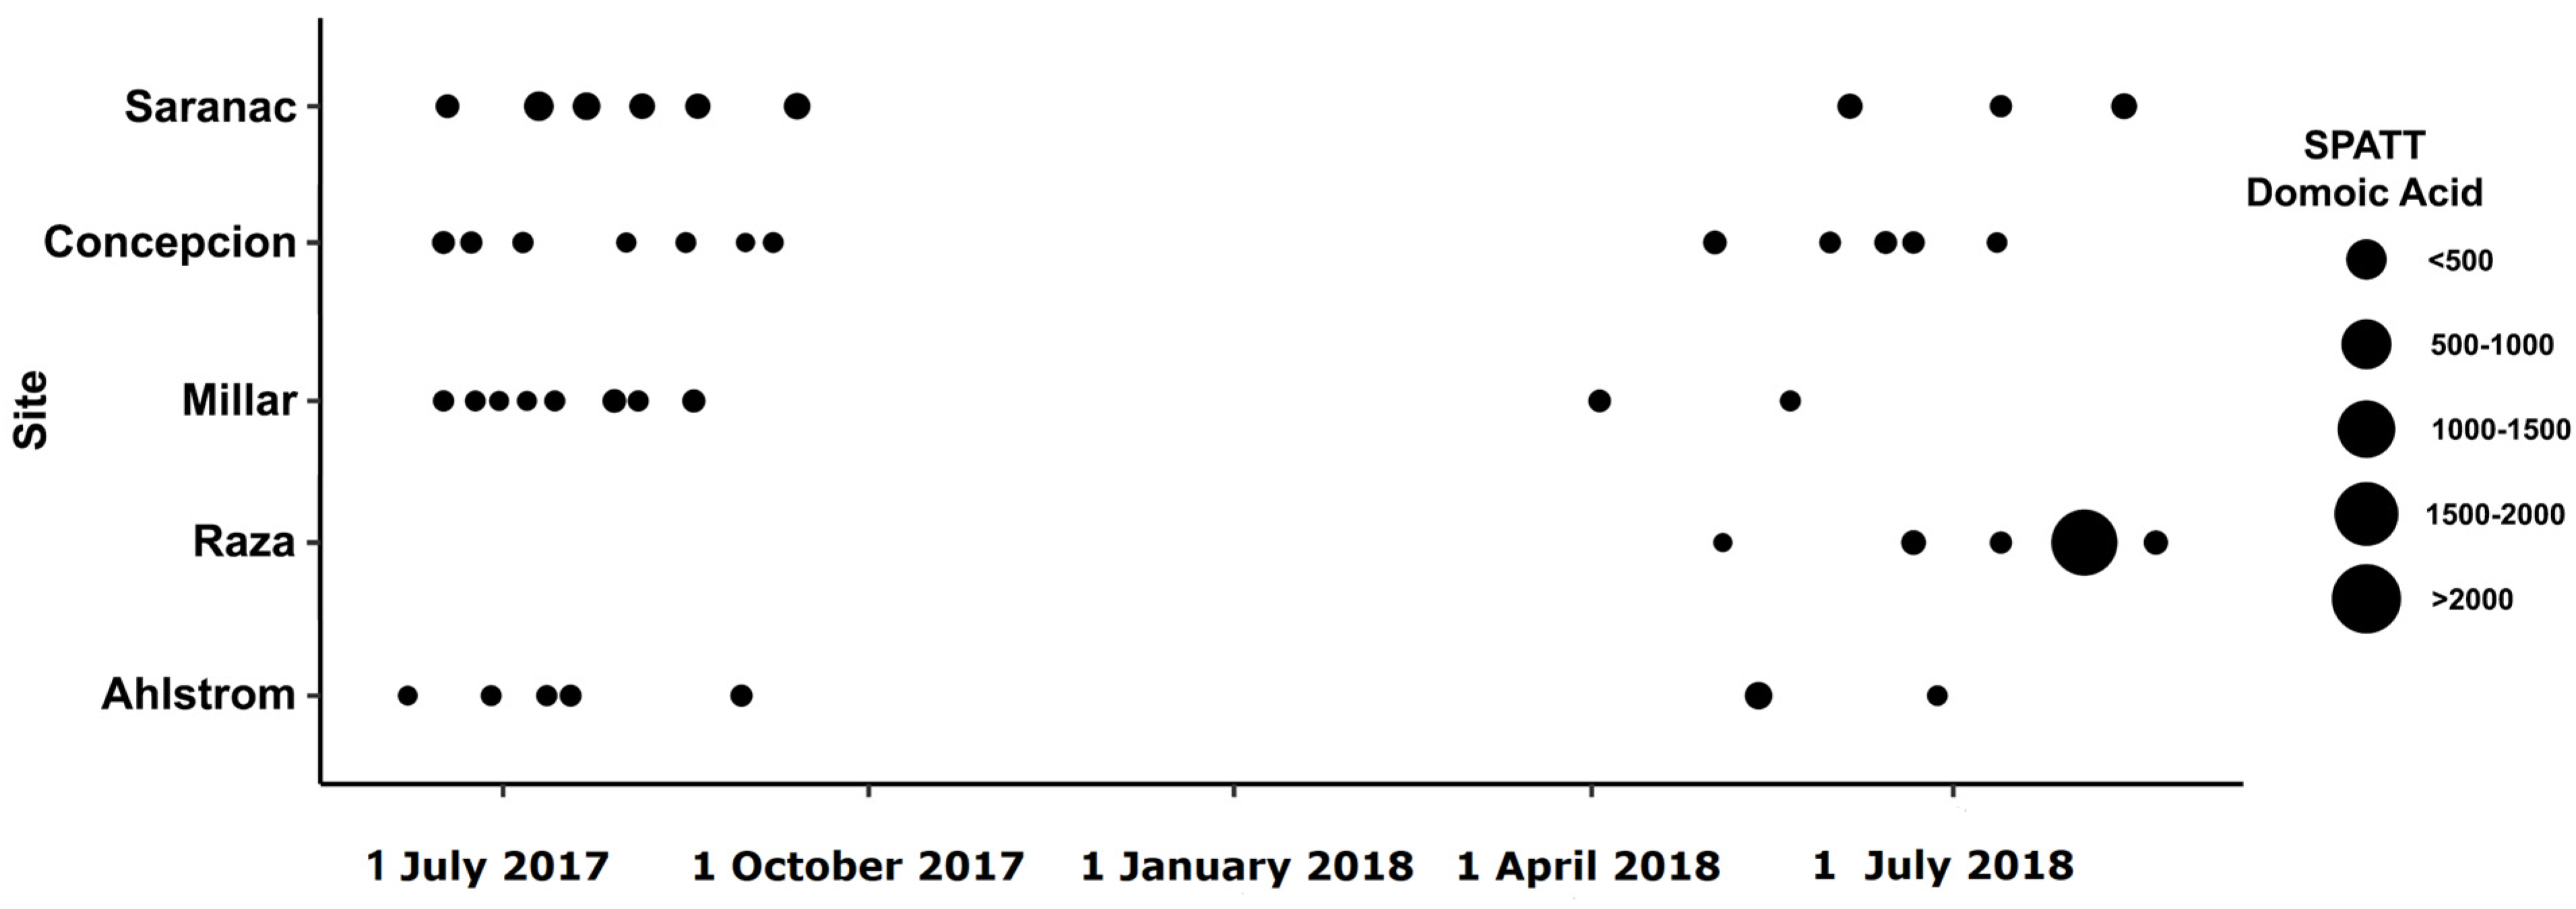
2.1. Toxins Detected in Solid Phase Adsorption Toxin Tracking (SPATT)
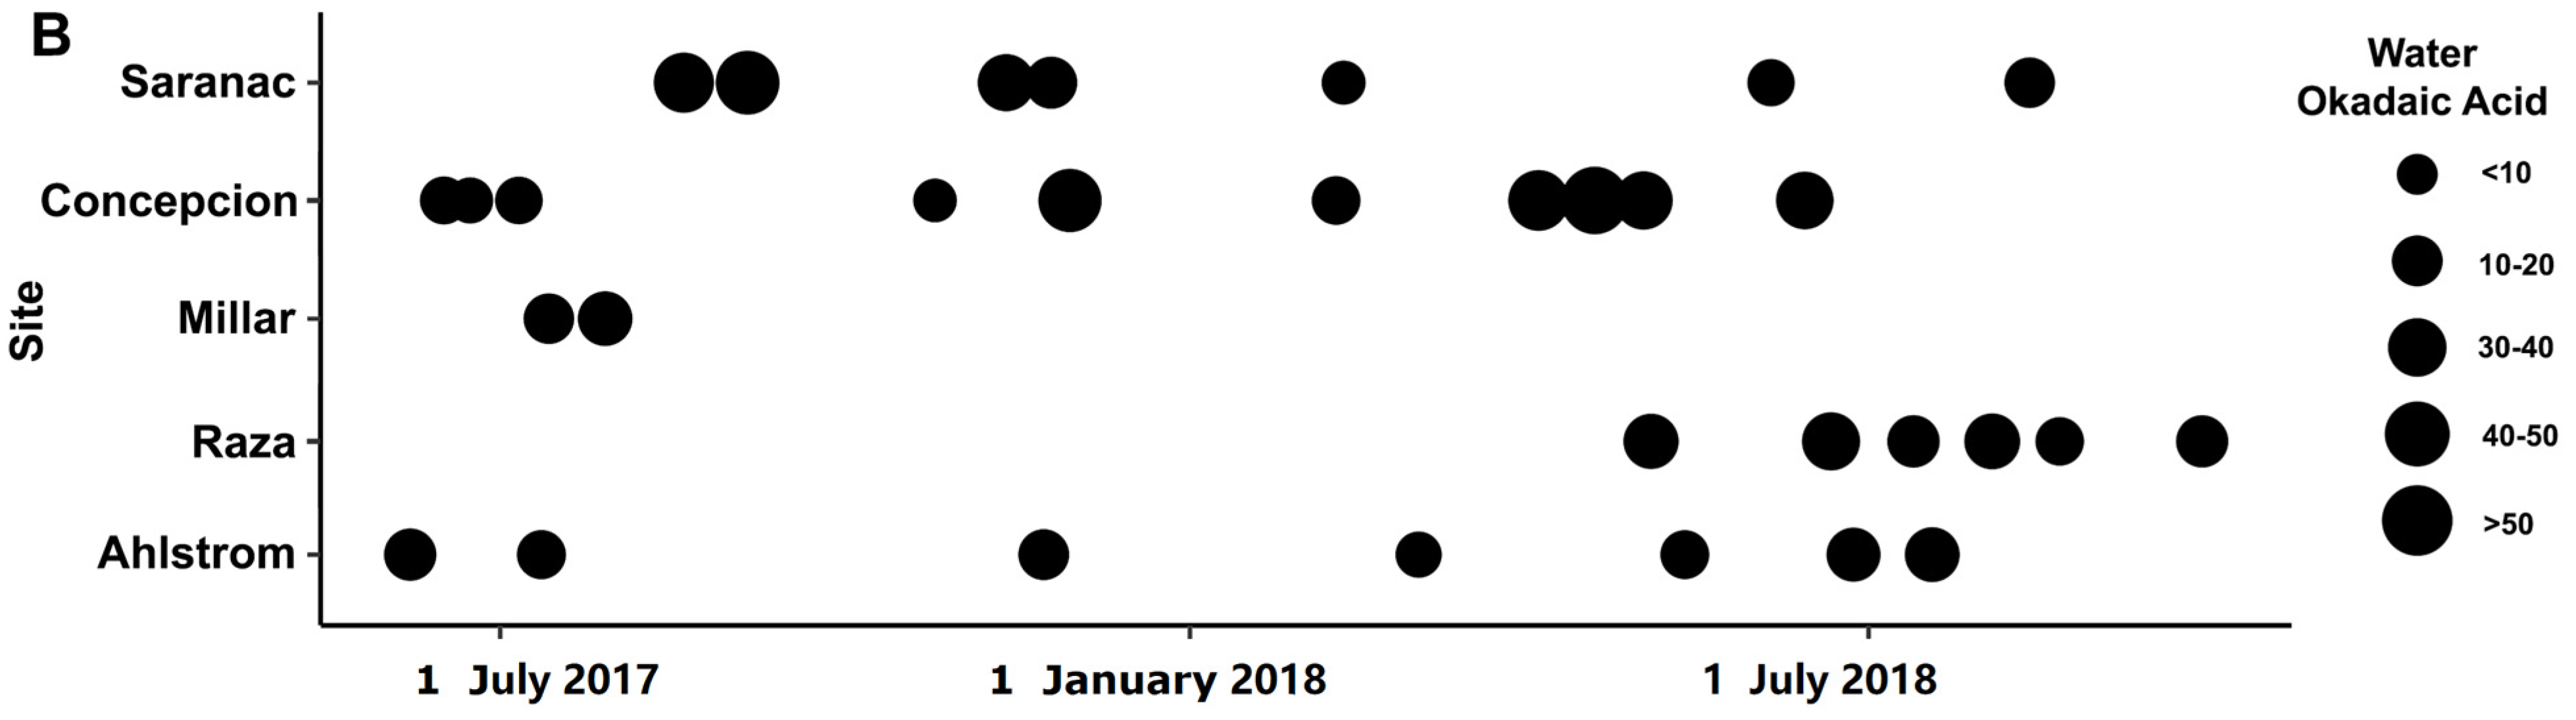
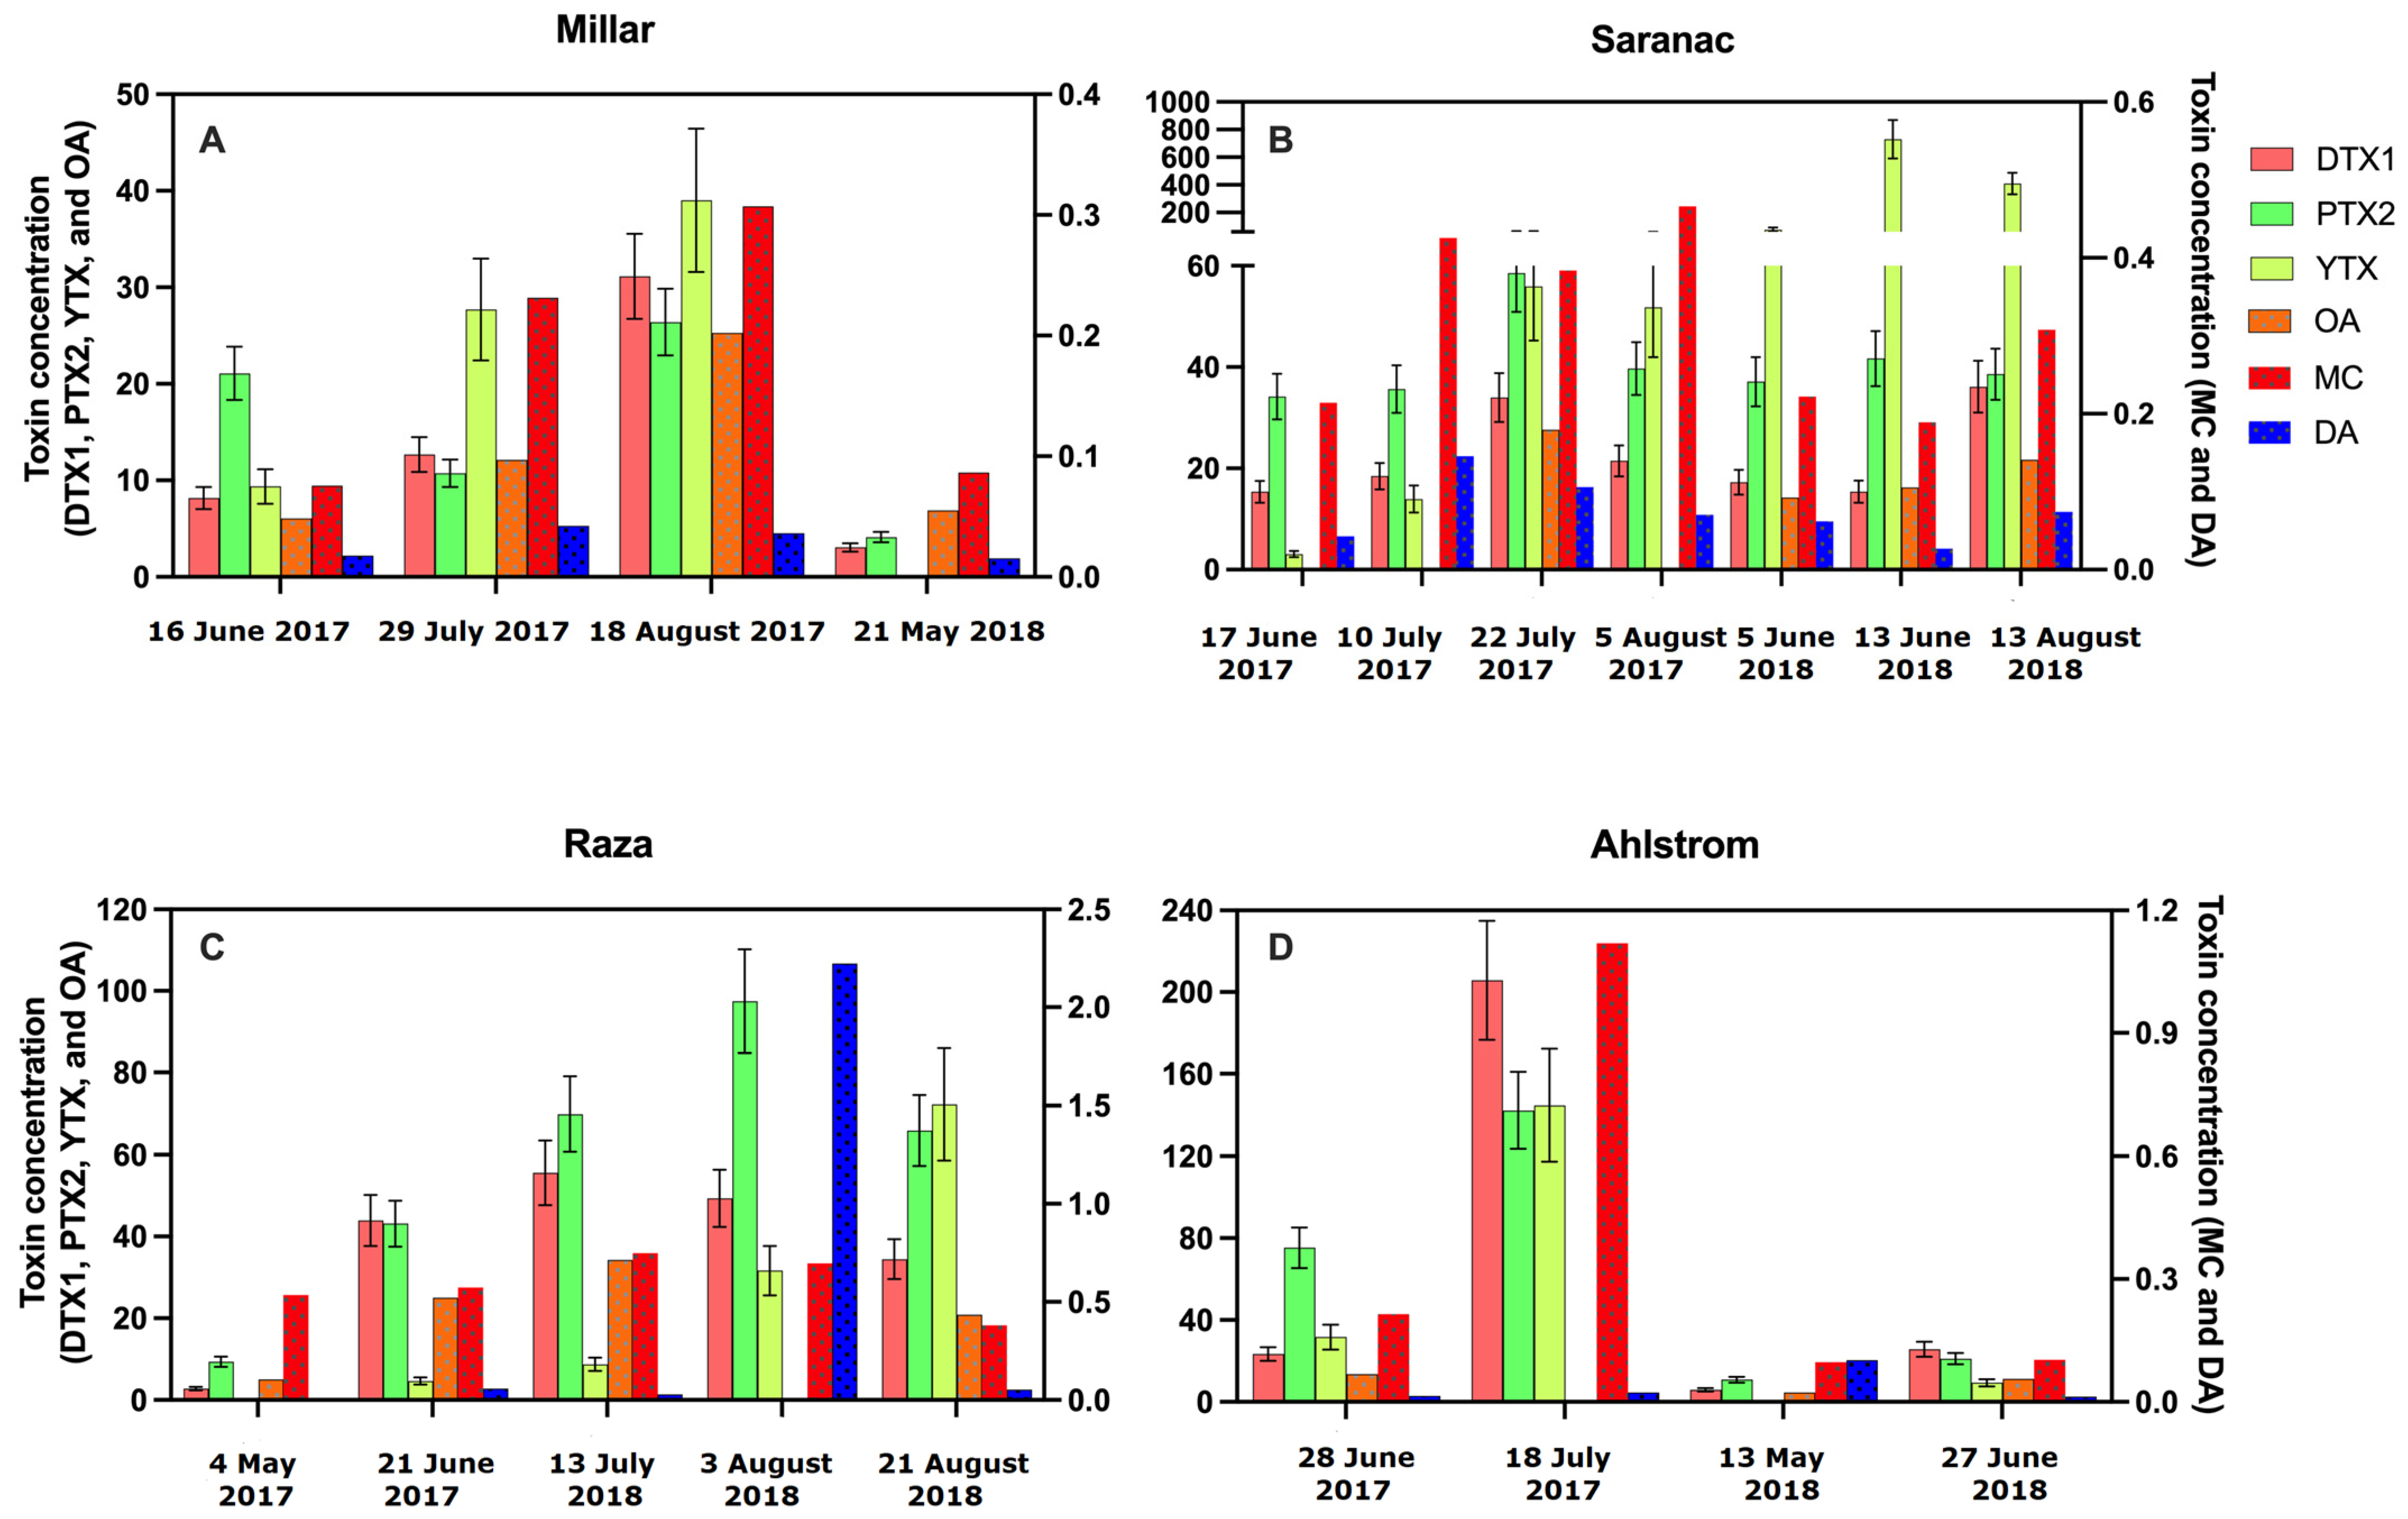
2.2. Toxins Detected in Grab Samples
3. Discussion
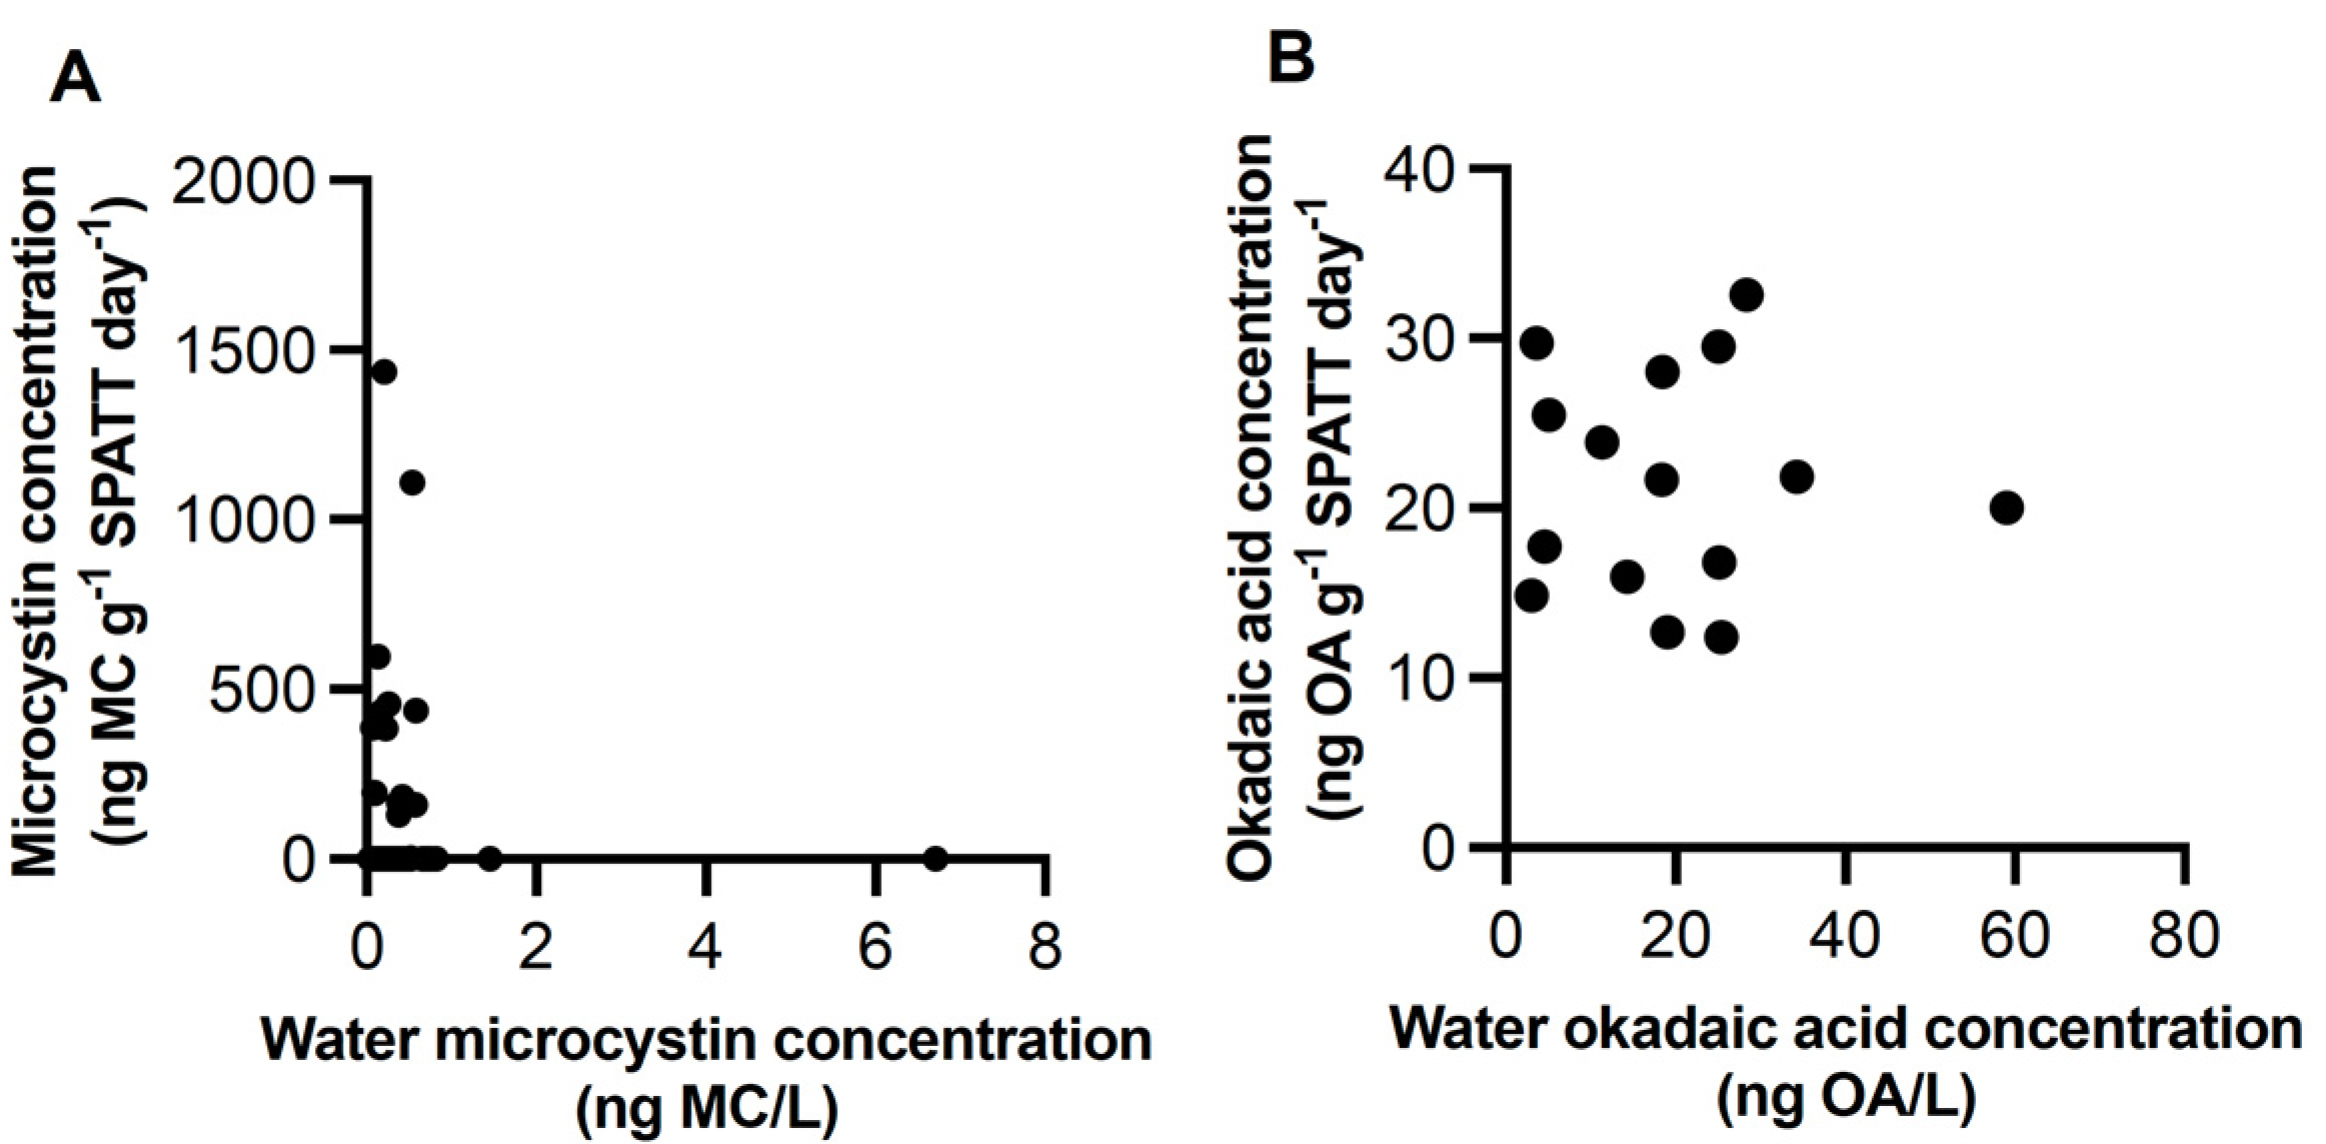
3.1. Microcystin
3.2. Okadaic Acid
3.3. Domoic Acid
3.4. DTX-1, PTX-2, and YTX
3.5. Co-Occurrence of Toxins and Distributions
3.6. Relevance and Future Directions
4. Materials and Methods
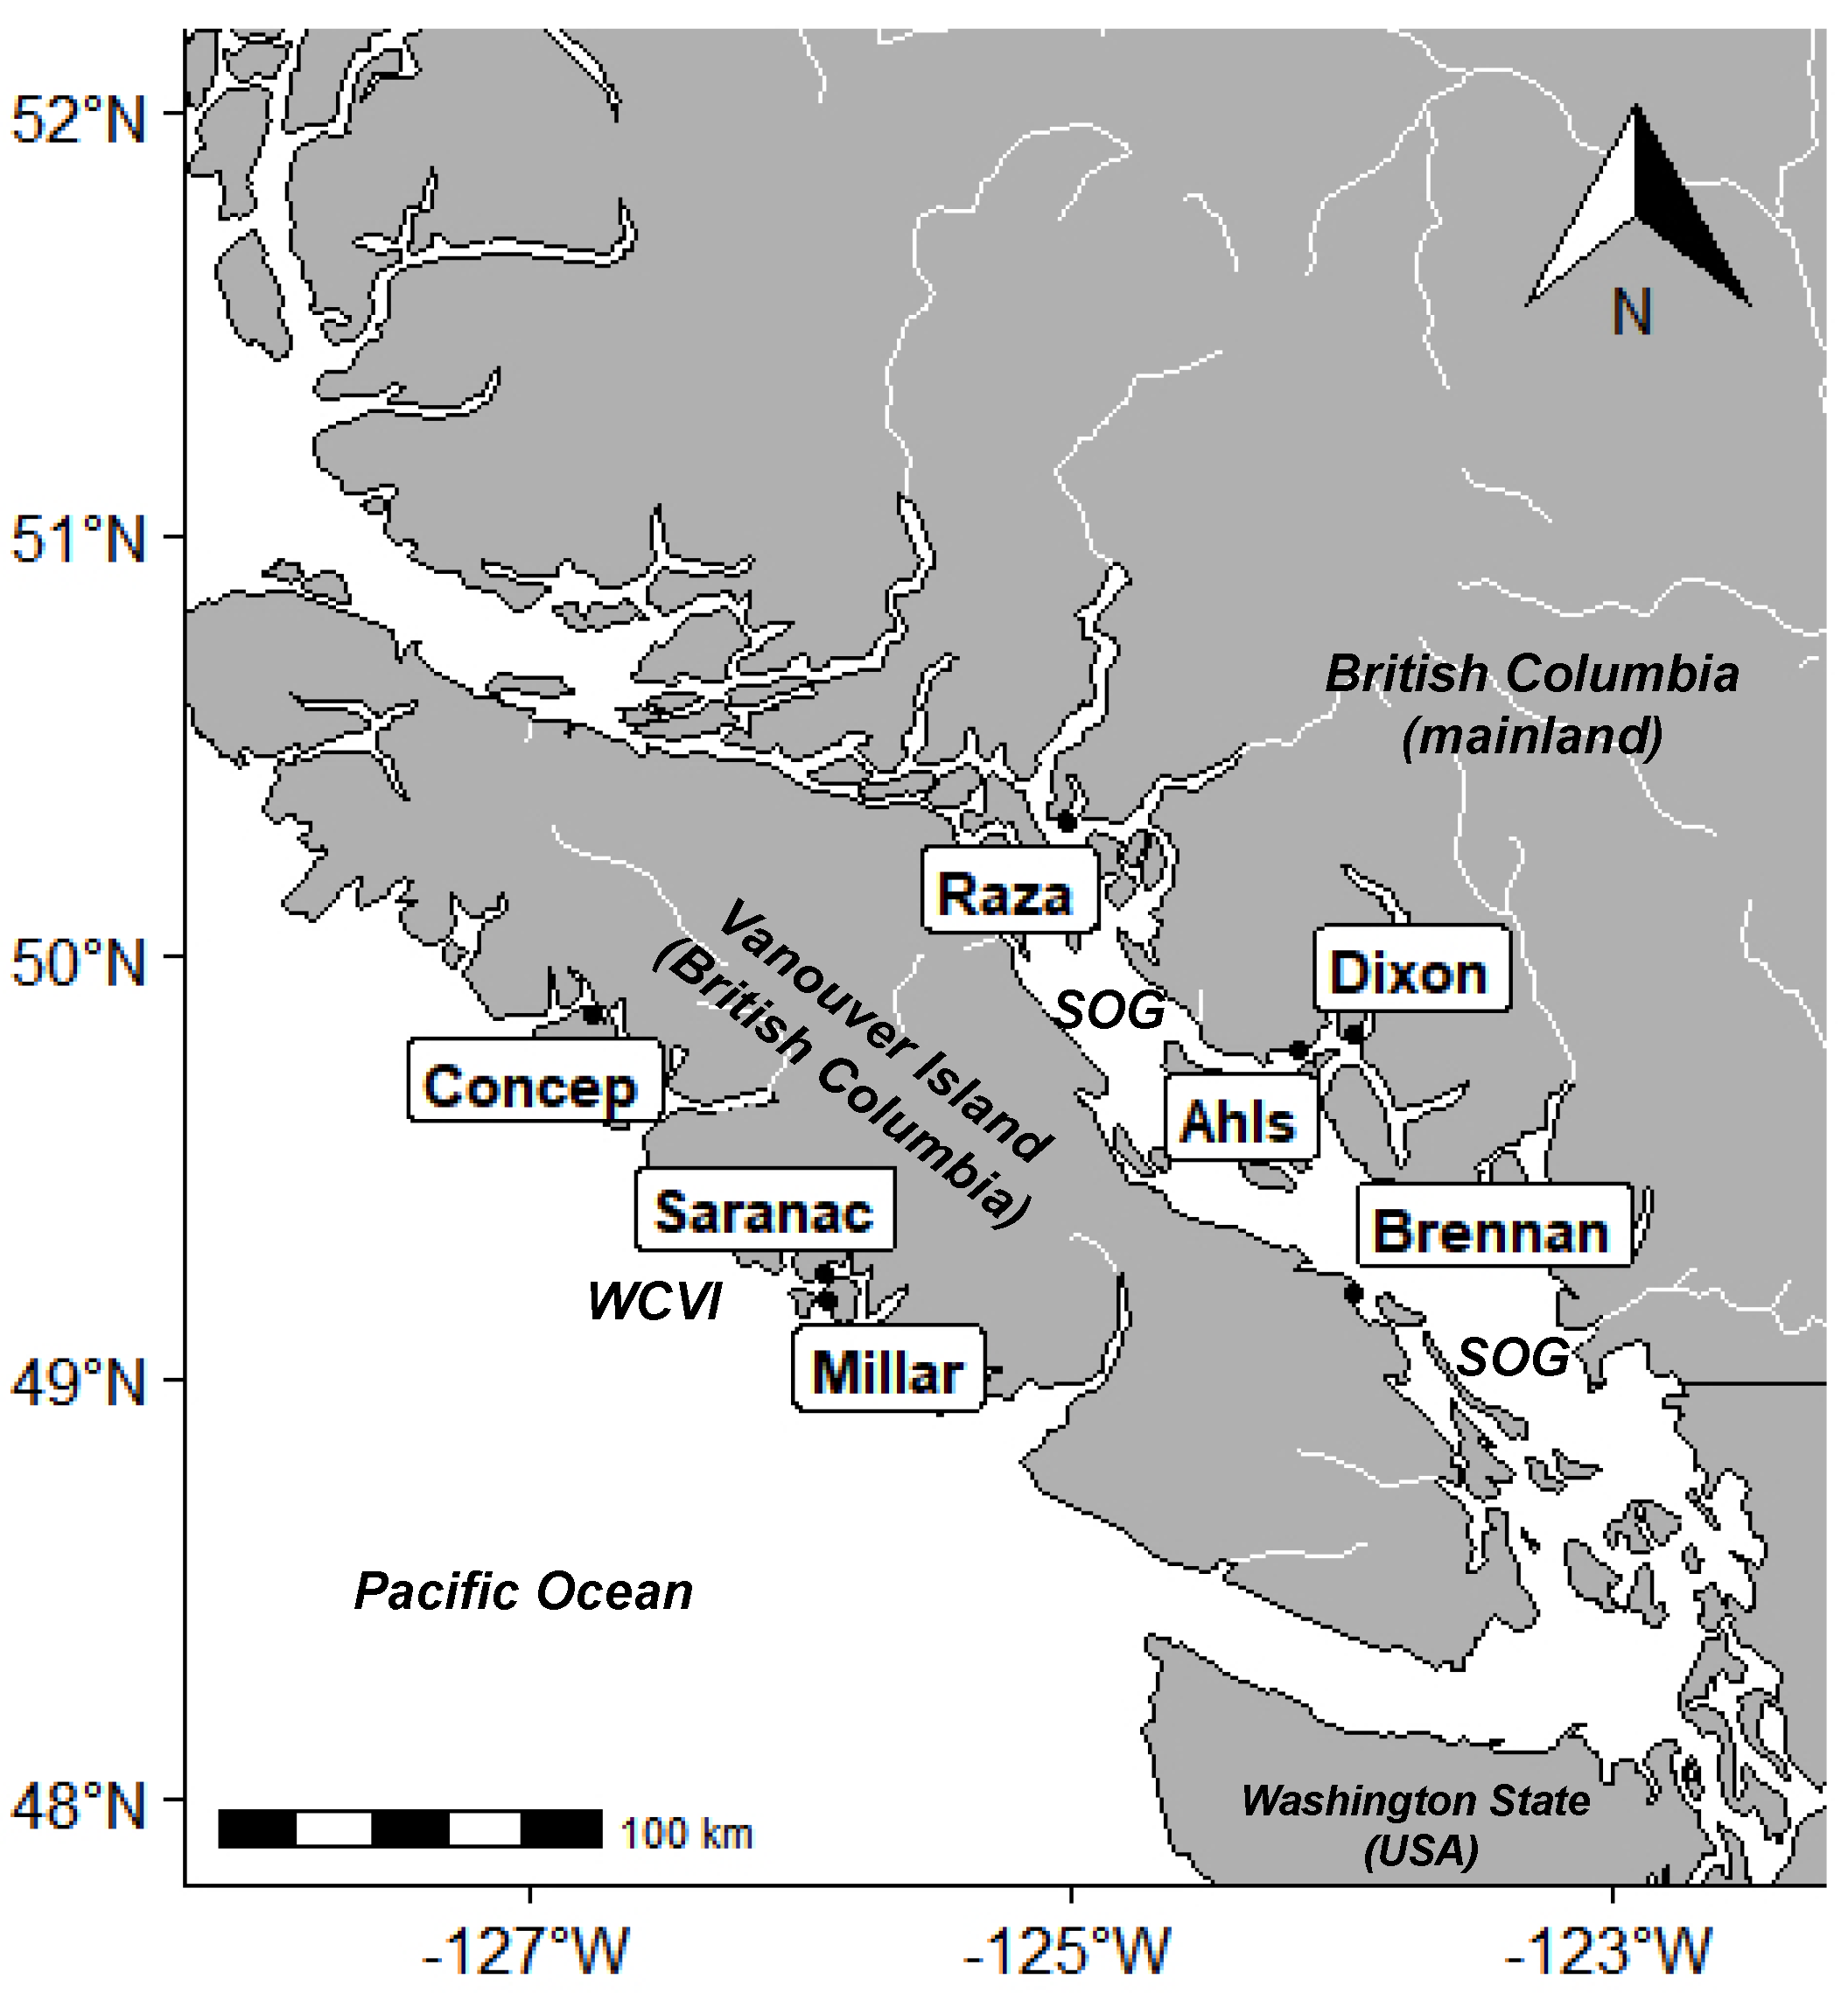
4.1. Sample Collection
4.2. Toxin Analysis by ELISA
4.3. Toxin Analysis by LC–MS/MS
4.4. Statistical Analyses
Author Contributions
Funding
Institutional Review Board Statement
Informed Consent Statement
Data Availability Statement
Acknowledgments
Conflicts of Interest
References
- Haigh, N.; Esenkulova, S. Economic Losses to the British Columbia Salmon Aquaculture Industry Due to Harmful Algal Blooms, 2009–2012. In PICES Scientific Reports No. 47: Proceedings of the Workshop on Economic Impacts of Harmful Algal Blooms on Fisheries and Aquaculture; PICES: Nanaimo, BC, Canada, 2014; pp. 1–6. [Google Scholar]
- Noakes, D.J.; Beamish, R.J.; Kent, M.L. On the Decline of Pacific Salmon and Speculative Links to Salmon Farming in British Columbia. Aquaculture 2000, 183, 363–386. [Google Scholar] [CrossRef]
- McKenzie, C.H.; Bates, S.S.; Martin, J.L.; Haigh, N.; Howland, K.L.; Lewis, N.I.; Locke, A.; Peña, A.; Poulin, M.; Rochon, A.; et al. Three Decades of Canadian Marine Harmful Algal Events: Phytoplankton and Phycotoxins of Concern to Human and Ecosystem Health. Harmful Algae 2021, 102, 101852. [Google Scholar] [CrossRef]
- Shahmohamadloo, R.S.; Frenken, T.; Rudman, S.M.; Ibelings, B.W.; Trainer, V.L. Climate Change on Diseases and Disorders of Finfish in Cage Culture; CABI: Oxfordshire, UK, 2023; pp. 387–429. [Google Scholar] [CrossRef]
- Esenkulova, S.; Neville, C.; DiCicco, E.; Pearsall, I. Indications That Algal Blooms May Affect Wild Salmon in a Similar Way as Farmed Salmon. Harmful Algae 2022, 118, 102310. [Google Scholar] [CrossRef]
- Kent, M.L. Netpen Liver Disease What We Know. 2015. Available online: https://www.cahs-bc.ca/wp-content/uploads/2019/03/Netpen_Liver_Disease_What_we_know.pdf (accessed on 21 May 2023).
- Kent, M.L. Netpen Liver Disease (NLD) of Salmonid Fishes Reared in Sea Water: Species Susceptibility, Recovery, and Probable Cause. Dis. Aquat. Org. 1990, 8, 21–28. [Google Scholar] [CrossRef]
- Stephen, C.; Kent, M.L.; Dawe, S.C. Hepatic Megalocytosis in Wild and Farmed Chinook Salmon Oncorhynchus Ishawytscha in British Columbia, Canada. Dis. Aquat. Org. 1993, 16, 35–39. [Google Scholar] [CrossRef]
- Saksida, S.M.; Marty, G.D.; Jones, S.R.M.; Manchester, H.A.; Diamond, C.L.; Bidulka, J.; Hilaire, S.S. Parasites and Hepatic Lesions among Pink Salmon, Oncorhynchus gorbuscha (Walbaum), during Early Seawater Residence. J. Fish Dis. 2012, 35, 137–151. [Google Scholar] [CrossRef] [PubMed]
- Andersen, R.J.; Luu, H.A.; Chen, D.Z.X.; Holmes, C.F.B.; Kent, M.L.; Blanc, M.L.; Taylor, F.J.R.; Williams, D.E. Chemical and Biological Evidence Links Microcystins to Salmon ‘Netpen Liver Disease’. Toxicon 1993, 31, 1315–1323. [Google Scholar] [CrossRef]
- Hardy, F.J.; Johnson, A.; Hamel, K.; Preece, E. Cyanotoxin Bioaccumulation in Freshwater Fish, Washington State, USA. Environ. Monit. Assess. 2015, 187, 2687. [Google Scholar] [CrossRef]
- Landsberg, J.H.; Hendrickson, J.; Tabuchi, M.; Kiryu, Y.; Williams, B.J.; Tomlinson, M.C. A Large-Scale Sustained Fish Kill in the St. Johns River, Florida: A Complex Consequence of Cyanobacteria Blooms. Harmful Algae 2020, 92, 101771. [Google Scholar] [CrossRef]
- Preece, E.P.; Moore, B.C.; Hardy, F.J. Transfer of Microcystin from Freshwater Lakes to Puget Sound, WA and Toxin Accumulation in Marine Mussels (Mytilus trossulus). Ecotoxicol. Environ. Saf. 2015, 122, 98–105. [Google Scholar] [CrossRef]
- Preece, E.P.; Hardy, F.J.; Moore, B.C.; Bryan, M. A Review of Microcystin Detections in Estuarine and Marine Waters: Environmental Implications and Human Health Risk. Harmful Algae 2017, 61, 31–45. [Google Scholar] [CrossRef]
- Howard, M.D.A.; Kudela, R.M.; Hayashi, K.; Tatters, A.O.; Caron, D.A.; Theroux, S.; Oehrle, S.; Roethler, M.; Donovan, A.; Loftin, K.; et al. Multiple Co-Occurring and Persistently Detected Cyanotoxins and Associated Cyanobacteria in Adjacent California Lakes. Toxicon 2021, 192, 1–14. [Google Scholar] [CrossRef] [PubMed]
- Gibble, C.M.; Kudela, R.M. Detection of Persistent Microcystin Toxins at the Land–Sea Interface in Monterey Bay, California. Harmful Algae 2014, 39, 146–153. [Google Scholar] [CrossRef]
- Peacock, M.B.; Gibble, C.M.; Senn, D.B.; Cloern, J.E.; Kudela, R.M. Blurred Lines: Multiple Freshwater and Marine Algal Toxins at the Land-Sea Interface of San Francisco Bay, California. Harmful Algae 2018, 73, 138–147. [Google Scholar] [CrossRef]
- Smith, J.; Lie, A.A.Y.; Seubert, E.L.; Crowley, N.; Robertson, G.; Caron, D.A. Co-Occurring Dissolved Algal Toxins Observed at Multiple Coastal Sites in Southern California via Solid Phase Adsorption Toxin Tracking. Toxicon 2019, 171, 62–65. [Google Scholar] [CrossRef]
- Howard, M.; Nagoda, C.; Kudela, R.; Hayashi, K.; Tatters, A.; Caron, D.; Busse, L.; Brown, J.; Sutula, M.; Stein, E. Microcystin Prevalence throughout Lentic Waterbodies in Coastal Southern California. Toxins 2017, 9, 231. [Google Scholar] [CrossRef]
- Miller, M.A.; Kudela, R.M.; Mekebri, A.; Crane, D.; Oates, S.C.; Tinker, M.T.; Staedler, M.; Miller, W.A.; Toy-Choutka, S.; Dominik, C.; et al. Evidence for a Novel Marine Harmful Algal Bloom: Cyanotoxin (Microcystin) Transfer from Land to Sea Otters. PLoS ONE 2010, 5, e12576. [Google Scholar] [CrossRef]
- Anderson, M.; Valera, M.; Schnetzer, A. Co-Occurrence of Freshwater and Marine Phycotoxins: A Record of Microcystins and Domoic Acid in Bogue Sound, North Carolina (2015 to 2020). Harmful Algae 2023, 125, 102412. [Google Scholar] [CrossRef]
- Tango, P.J.; Butler, W. Cyanotoxins in Tidal Waters of Chesapeake Bay. Northeast. Nat. 2008, 15, 403–416. [Google Scholar] [CrossRef]
- Onofrio, M.D.; Egerton, T.A.; Reece, K.S.; Pease, S.K.D.; Sanderson, M.P.; III, W.J.; Yeargan, E.; Roach, A.; DeMent, C.; Wood, A.; et al. Spatiotemporal Distribution of Phycotoxins and Their Co-Occurrence within Nearshore Waters. Harmful Algae 2021, 103, 101993. [Google Scholar] [CrossRef]
- Takahashi, T.; Umehara, A.; Tsutsumi, H. Diffusion of Microcystins (Cyanobacteria Hepatotoxins) from the Reservoir of Isahaya Bay, Japan, into the Marine and Surrounding Ecosystems as a Result of Large-Scale Drainage. Mar. Pollut. Bull. 2014, 89, 250–258. [Google Scholar] [CrossRef] [PubMed]
- Trout-Haney, J.; Wood, Z.; Cottingham, K. Presence of the Cyanotoxin Microcystin in Arctic Lakes of Southwestern Greenland. Toxins 2016, 8, 256. [Google Scholar] [CrossRef] [PubMed]
- Díez-Quijada, L.; Puerto, M.; Gutiérrez-Praena, D.; Llana-Ruiz-Cabello, M.; Jos, A.; Cameán, A.M. Microcystin-RR: Occurrence, Content in Water and Food and Toxicological Studies. A Review. Environ. Res. 2019, 168, 467–489. [Google Scholar] [CrossRef] [PubMed]
- Gibble, C.M.; Peacock, M.B.; Kudela, R.M. Evidence of Freshwater Algal Toxins in Marine Shellfish: Implications for Human and Aquatic Health. Harmful Algae 2016, 59, 59–66. [Google Scholar] [CrossRef]
- Jones, M.R.; Pinto, E.; Torres, M.A.; Dörr, F.; Mazur-Marzec, H.; Szubert, K.; Tartaglione, L.; Dell’Aversano, C.; Miles, C.O.; Beach, D.G.; et al. CyanoMetDB, a Comprehensive Public Database of Secondary Metabolites from Cyanobacteria. Water Res. 2021, 196, 117017. [Google Scholar] [CrossRef]
- Bouaïcha, N.; Miles, C.O.; Beach, D.G.; Labidi, Z.; Djabri, A.; Benayache, N.Y.; Nguyen-Quang, T. Structural Diversity, Characterization and Toxicology of Microcystins. Toxins 2019, 11, 714. [Google Scholar] [CrossRef]
- Pham, T.-L.; Utsumi, M. An Overview of the Accumulation of Microcystins in Aquatic Ecosystems. J. Environ. Manag. 2018, 213, 520–529. [Google Scholar] [CrossRef]
- Hughes, E.O.; Gorham, P.R.; Zehnder, A. Toxicity of a Unialgal Culture of Microcystis aeruginosa. Can. J. Microbiol. 1958, 4, 225–236. [Google Scholar] [CrossRef]
- Malbrouck, C.; Kestemont, P. Effects of Microcystins on Fish. Environ. Toxicol. Chem. 2006, 25, 72. [Google Scholar] [CrossRef]
- Pavagadhi, S.; Balasubramanian, R. Toxicological Evaluation of Microcystins in Aquatic Fish Species: Current Knowledge and Future Directions. Aquat. Toxicol. 2013, 142–143, 1–16. [CrossRef]
- Shahmohamadloo, R.S.; Almirall, X.O.; Simmons, D.B.D.; Lumsden, J.S.; Bhavsar, S.P.; Watson-Leung, T.; Eyken, A.V.; Hankins, G.; Hubbs, K.; Konopelko, P.; et al. Cyanotoxins within and Outside of Microcystis aeruginosa Cause Adverse Effects in Rainbow Trout (Oncorhynchus mykiss). Environ. Sci. Technol. 2021, 55, 10422–10431. [Google Scholar] [CrossRef]
- Shahmohamadloo, R.S.; Almirall, X.O.; Simmons, D.B.D.; Poirier, D.G.; Bhavsar, S.P.; Sibley, P.K. Fish Tissue Accumulation and Proteomic Response to Microcystins Is Species-Dependent. Chemosphere 2022, 287, 132028. [Google Scholar] [CrossRef] [PubMed]
- Bukaveckas, P.A.; Franklin, R.; Tassone, S.; Trache, B.; Egerton, T. Cyanobacteria and Cyanotoxins at the River-Estuarine Transition. Harmful Algae 2018, 76, 11–21. [Google Scholar] [CrossRef] [PubMed]
- Shahmohamadloo, R.S.; Poirier, D.G.; Almirall, X.O.; Bhavsar, S.P.; Sibley, P.K. Assessing the Toxicity of Cell-Bound Microcystins on Freshwater Pelagic and Benthic Invertebrates. Ecotoxicol. Environ. Saf. 2020, 188, 109945. [Google Scholar] [CrossRef] [PubMed]
- DeMott, W.R.; Zhang, Q.; Carmichael, W.W. Effects of Toxic Cyanobacteria and Purified Toxins on the Survival and Feeding of a Copepod and Three Species of Daphnia. Limnol. Oceanogr. 1991, 36, 1346–1357. [Google Scholar] [CrossRef]
- Herrera, N.A.; Echeverri, L.F.; Ferrão-Filho, A.S. Effects of Phytoplankton Extracts Containing the Toxin Microcystin-LR on the Survival and Reproduction of Cladocerans. Toxicon 2015, 95, 38–45. [Google Scholar] [CrossRef]
- Gene, S.M.; Shahmohamadloo, R.S.; Ortiz, X.; Prosser, R.S. Effect of Microcystis Aeruginosa–Associated Microcystin-LR on the Survival of 2 Life Stages of Freshwater Mussel (Lampsilis siliquoidea). Environ. Toxicol. Chem. 2019, 38, 2137–2144. [Google Scholar] [CrossRef]
- Brown, A.; Foss, A.; Miller, M.A.; Gibson, Q. Detection of Cyanotoxins (Microcystins/Nodularins) in Livers from Estuarine and Coastal Bottlenose Dolphins (Tursiops truncatus) from Northeast Florida. Harmful Algae 2018, 76, 22–34. [Google Scholar] [CrossRef]
- Chen, L.; Giesy, J.P.; Adamovsky, O.; Svirčev, Z.; Meriluoto, J.; Codd, G.A.; Mijovic, B.; Shi, T.; Tuo, X.; Li, S.-C.; et al. Challenges of Using Blooms of Microcystis Spp. in Animal Feeds: A Comprehensive Review of Nutritional, Toxicological and Microbial Health Evaluation. Sci. Total Environ. 2021, 764, 142319. [Google Scholar] [CrossRef]
- Martins, N.D.; Yunes, J.S.; McKenzie, D.J.; Rantin, F.T.; Kalinin, A.L.; Monteiro, D.A. Microcystin–LR Exposure Causes Cardiorespiratory Impairments and Tissue Oxidative Damage in Trahira, Hoplias malabaricus. Ecotoxicol. Environ. Saf. 2019, 173, 436–443. [Google Scholar] [CrossRef]
- Best, J.H.; Eddy, F.B.; Codd, G.A. Effects of Purified Microcystin-LR and Cell Extracts of Microcystis Strains PCC 7813 and CYA 43 on Cardiac Function in Brown Trout (Salmo trutta) Alevins. Fish Physiol. Biochem. 2001, 24, 171–178. [Google Scholar] [CrossRef]
- Liu, G.; Ke, M.; Fan, X.; Zhang, M.; Zhu, Y.; Lu, T.; Sun, L.; Qian, H. Reproductive and Endocrine-Disrupting Toxicity of Microcystis aeruginosa in Female Zebrafish. Chemosphere 2017, 192, 289–296. [Google Scholar] [CrossRef]
- Gao, Y.; Liu, Z.; Jia, D.; Hu, Q.; Li, L.; Tang, R.; Li, D. Acute Microcystin-LR Exposure Interfere Thyroid Hormones Homeostasis in Adult Zebrafish (Danio rerio). Chemosphere 2020, 243, 125258. [Google Scholar] [CrossRef]
- Zhan, C.; Liu, W.; Zhang, F.; Zhang, X. Microcystin-LR Triggers Different Endoplasmic Reticulum Stress Pathways in the Liver, Ovary, and Offspring of Zebrafish (Danio rerio). J. Hazard. Mater. 2020, 386, 121939. [Google Scholar] [CrossRef] [PubMed]
- Chen, L.; Chen, J.; Zhang, X.; Xie, P. A Review of Reproductive Toxicity of Microcystins. J. Hazard. Mater. 2016, 301, 381–399. [Google Scholar] [CrossRef] [PubMed]
- Dong, G.; Xie, S.; Zhu, X.; Han, D.; Yang, Y.; Song, L.; Gan, L.; Chen, W. Responses of Yellow Catfish (Pelteobagrus fulvidraco Richardson) Exposed to Dietary Cyanobacteria and Subsequent Recovery. Toxicon 2012, 60, 1298–1306. [Google Scholar] [CrossRef] [PubMed]
- Acou, A.; Robinet, T.; Lance, E.; Gerard, C.; Mounaix, B.; Brient, L.; Rouzic, B.L.; Feunteun, E. Evidence of Silver Eels Contamination by Microcystin-LR at the Onset of Their Seaward Migration: What Consequences for Breeding Potential? J. Fish Biol. 2008, 72, 753–762. [Google Scholar] [CrossRef]
- Cazenave, J.; Nores, M.L.; Miceli, M.; Díaz, M.P.; Wunderlin, D.A.; Bistoni, M.A. Changes in the Swimming Activity and the Glutathione S-Transferase Activity of Jenynsia multidentata Fed with Microcystin-RR. Water Res. 2008, 42, 1299–1307. [Google Scholar] [CrossRef]
- Li, Y.; Sun, B.; Wu, H.; Nie, P. Effects of Pure Microcystin-LR on the Transcription of Immune Related Genes and Heat Shock Proteins in Larval Stage of Zebrafish (Danio rerio). Aquaculture 2009, 289, 154–160. [Google Scholar] [CrossRef]
- Lin, W.; Hou, J.; Guo, H.; Qiu, Y.; Li, L.; Li, D.; Tang, R. Dualistic Immunomodulation of Sub-Chronic Microcystin-LR Exposure on the Innate-Immune Defense System in Male Zebrafish. Chemosphere 2017, 183, 315–322. [Google Scholar] [CrossRef]
- Liu, W.; Qiao, Q.; Chen, Y.; Wu, K.; Zhang, X. Microcystin-LR Exposure to Adult Zebrafish (Danio rerio) Leads to Growth Inhibition and Immune Dysfunction in F1 Offspring, a Parental Transmission Effect of Toxicity. Aquat. Toxicol. 2014, 155, 360–367. [Google Scholar] [CrossRef]
- Svirčev, Z.; Lujić, J.; Marinović, Z.; Drobac, D.; Tokodi, N.; Stojiljković, B.; Meriluoto, J. Toxicopathology Induced by Microcystins and Nodularin: A Histopathological Review. J. Environ. Sci. Health Part C 2015, 33, 125–167. [Google Scholar] [CrossRef]
- Taylor, F.J.R.; Haigh, R. Spatial and Temporal Distributions of Microplankton during the Summers of 1992–1993 in Barkley Sound, British Columbia, with Emphasis on Harmful Species. Can. J. Fish. Aquat. Sci. 1996, 53, 2310–2322. [Google Scholar] [CrossRef]
- Gobler, C.J.; Doherty, O.M.; Hattenrath-Lehmann, T.K.; Griffith, A.W.; Kang, Y.; Litaker, R.W. Ocean Warming since 1982 Has Expanded the Niche of Toxic Algal Blooms in the North Atlantic and North Pacific Oceans. Proc. Natl. Acad. Sci. USA 2017, 114, 4975. [Google Scholar] [CrossRef] [PubMed]
- Valdiglesias, V.; Prego-Faraldo, V.M.; Pasaro, E.; Mendez, J.; Laffon, B. Okadaic Acid: More than a Diarrheic Toxin. Mar. Drugs 2013, 11, 4328–4349. [Google Scholar] [CrossRef] [PubMed]
- Ajuzie, C.C. Toxic Prorocentrum Lima Induces Abnormal Behaviour in Juvenile Sea Bass. J. Appl. Phycol. 2008, 20, 19–27. [Google Scholar] [CrossRef]
- Souid, G.; Souayed, N.; Haouas, Z.; Maaroufi, K. Does the Phycotoxin Okadaic Acid Cause Oxidative Stress Damages and Histological Alterations to Seabream (Sparus aurata)? Toxicon 2018, 144, 55–60. [Google Scholar] [CrossRef]
- Du, J.L.; Tovar-Ramírez, D.; Núñez-Vázquez, E.J. Embryotoxic Effects of Dissolved Okadaic Acid on the Development of Longfin Yellowtail Seriola rivoliana. Aquat. Toxicol. 2017, 190, 210–216. [Google Scholar] [CrossRef]
- Corriere, M.; Soliño, L.; Costa, P.R. Effects of the Marine Biotoxins Okadaic Acid and Dinophysistoxins on Fish. J. Mar. Sci. Eng. 2021, 9, 293. [Google Scholar] [CrossRef]
- Varsamos, S.; Nebel, C.; Charmantier, G. Ontogeny of Osmoregulation in Postembryonic Fish: A Review. Comp. Biochem. Physiol. Part A Mol. Integr. Physiol. 2005, 141, 401–429. [Google Scholar] [CrossRef]
- Shartau, R.B.; Snyman, H.N.; Turcotte, L.; McCarron, P.; Bradshaw, J.C.; Johnson, S.C. Acute Microcystin Exposure Induces Reversible Histopathological Changes in Chinook Salmon (Oncorhynchus tshawytscha) and Atlantic Salmon (Salmo salar). J. Fish Dis. 2022, 45, 729–742. [Google Scholar] [CrossRef]
- MacKenzie, L.; Beuzenberg, V.; Holland, P.; McNabb, P.; Selwood, A. Solid Phase Adsorption Toxin Tracking (SPATT): A New Monitoring Tool That Simulates the Biotoxin Contamination of Filter Feeding Bivalves. Toxicon 2004, 44, 901–918. [Google Scholar] [CrossRef] [PubMed]
- Roué, M.; Darius, H.; Chinain, M. Solid Phase Adsorption Toxin Tracking (SPATT) Technology for the Monitoring of Aquatic Toxins: A Review. Toxins 2018, 10, 167. [Google Scholar] [CrossRef]
- Kudela, R.M. Characterization and Deployment of Solid Phase Adsorption Toxin Tracking (SPATT) Resin for Monitoring of Microcystins in Fresh and Saltwater. Harmful Algae 2011, 11, 117–125. [Google Scholar] [CrossRef]
- Lane, J.Q.; Roddam, C.M.; Langlois, G.W.; Kudela, R.M. Application of Solid Phase Adsorption Toxin Tracking (SPATT) for Field Detection of the Hydrophilic Phycotoxins Domoic Acid and Saxitoxin in Coastal California. Limnol. Oceanogr. Methods 2010, 8, 645–660. [Google Scholar] [CrossRef]
- Eliason, E.J.; Clark, T.D.; Hague, M.J.; Hanson, L.M.; Gallagher, Z.S.; Jeffries, K.M.; Gale, M.K.; Patterson, D.A.; Hinch, S.G.; Farrell, A.P. Differences in Thermal Tolerance Among Sockeye Salmon Populations. Science 2011, 332, 109–112. [Google Scholar] [CrossRef]
- Rundberget, T.; Gustad, E.; Samdal, I.A.; Sandvik, M.; Miles, C.O. A Convenient and Cost-Effective Method for Monitoring Marine Algal Toxins with Passive Samplers. Toxicon Off. J. Int. Soc. Toxinol. 2009, 53, 543–550. [Google Scholar] [CrossRef]
- Health Canada. Guidelines for Canadian Recreational Water Quality—Cyanobacteria and Their Toxins. 2022. Available online: https://www.canada.ca/en/health-canada/services/publications/healthy-living/guidance-canadian-recreational-water-quality-cyanobacteria-toxins.html (accessed on 15 May 2023).
- Hattenrath-Lehmann, T.K.; Marcoval, M.A.; Berry, D.L.; Fire, S.; Wang, Z.; Morton, S.L.; Gobler, C.J. The Emergence of Dinophysis Acuminata Blooms and DSP Toxins in Shellfish in New York Waters. Harmful Algae 2013, 26, 33–44. [Google Scholar] [CrossRef]
- Esenkulova, S.; Suchy, K.D.; Pawlowicz, R.; Costa, M.; Pearsall, I.A. Harmful Algae and Oceanographic Conditions in the Strait of Georgia, Canada Based on Citizen Science Monitoring. Front. Mar. Sci. 2021, 8, 725092. [Google Scholar] [CrossRef]
- Tubaro, A.; Dell’Ovo, V.; Sosa, S.; Florio, C. Yessotoxins: A Toxicological Overview. Toxicon 2010, 56, 163–172. [Google Scholar] [CrossRef]
- Rhodes, L.; McNabb, P.; de Salas, M.; Briggs, L.; Beuzenberg, V.; Gladstone, M. Yessotoxin Production by Gonyaulax spinifera. Harmful Algae 2006, 5, 148–155. [Google Scholar] [CrossRef]
- Rubini, S.; Albonetti, S.; Menotta, S.; Cervo, A.; Callegari, E.; Cangini, M.; Dall’Ara, S.; Baldini, E.; Vertuani, S.; Manfredini, S. New Trends in the Occurrence of Yessotoxins in the Northwestern Adriatic Sea. Toxins 2021, 13, 634. [Google Scholar] [CrossRef]
- Wit, P.D.; Rogers-Bennett, L.; Kudela, R.M.; Palumbi, S.R. Forensic Genomics as a Novel Tool for Identifying the Causes of Mass Mortality Events. Nat. Commun. 2014, 5, 3652. [Google Scholar] [CrossRef] [PubMed]
- Fire, S.E.; Wang, Z.; Byrd, M.; Whitehead, H.R.; Paternoster, J.; Morton, S.L. Co-Occurrence of Multiple Classes of Harmful Algal Toxins in Bottlenose Dolphins (Tursiops truncatus) Stranding during an Unusual Mortality Event in Texas, USA. Harmful Algae 2011, 10, 330–336. [Google Scholar] [CrossRef]
- Marshall, H.G.; Lane, M.F.; Nesius, K.K.; Burchardt, L. Assessment and Significance of Phytoplankton Species Composition within Chesapeake Bay and Virginia Tributaries through a Long-Term Monitoring Program. Environ. Monit. Assess. 2009, 150, 143–155. [Google Scholar] [CrossRef] [PubMed]
- Trainer, V.L.; Moore, S.K.; Hallegraeff, G.; Kudela, R.M.; Clement, A.; Mardones, J.I.; Cochlan, W.P. Pelagic Harmful Algal Blooms and Climate Change: Lessons from Nature’s Experiments with Extremes. Harmful Algae 2020, 91, 101591. [Google Scholar] [CrossRef] [PubMed]
- Trainer, V.L.; Kudela, R.M.; Hunter, M.V.; Adams, N.G.; McCabe, R.M. Climate Extreme Seeds a New Domoic Acid Hotspot on the US West Coast. Front. Clim. 2020, 2, 571836. [Google Scholar] [CrossRef]
- McCabe, R.M.; Hickey, B.M.; Kudela, R.M.; Lefebvre, K.A.; Adams, N.G.; Bill, B.D.; Gulland, F.M.D.; Thomson, R.E.; Cochlan, W.P.; Trainer, V.L. An Unprecedented Coastwide Toxic Algal Bloom Linked to Anomalous Ocean Conditions. Geophys. Res. Lett. 2016, 43, 10366–10376. [Google Scholar] [CrossRef]
- Blanco, J.; Martín-Morales, E.; Álvarez, G. Stability of Okadaic Acid and 13-Desmethyl Spirolide C in Seawater and Sediment. Mar. Chem. 2018, 207, 21–25. [Google Scholar] [CrossRef]
- Bouillon, R.-C.; Knierim, T.L.; Kieber, R.J.; Skrabal, S.A.; Wright, J.L.C. Photodegradation of the Algal Toxin Domoic Acid in Natural Water Matrices. Limnol. Oceanogr. 2006, 51, 321–330. [Google Scholar] [CrossRef]
- Harada, K.-I.; Tsuji, K. Persistence and Decomposition of Hepatotoxic Microcystins Produced by Cyanobacteria in Natural Environment. J. Toxicol. Toxin Rev. 1998, 17, 385–403. [Google Scholar] [CrossRef]
- Tsuji, K.; Watanuki, T.; Kondo, F.; Watanabe, M.F.; Suzuki, S.; Nakazawa, H.; Suzuki, M.; Uchida, H.; Harada, K. Stability of Microcystins from Cyanobacteria—II. Effect of UV Light on Decomposition and Isomerization. Toxicon 1995, 33, 1619–1631. [Google Scholar] [CrossRef] [PubMed]
- Harada, K.; Tsuji, K.; Watanabe, M.F.; Kondo, F. Stability of Microcystins from Cyanobacteria—III. Effect of PH and Temperature. Phycologia 1996, 35, 83–88. [Google Scholar] [CrossRef]
- Damsgaard, C.; McGrath, M.; Wood, C.M.; Richards, J.G.; Brauner, C.J. Ion-Regulation, Acid/Base-Balance, Kidney Function, and Effects of Hypoxia in Coho Salmon, Oncorhynchus kisutch, after Long-Term Acclimation to Different Salinities. Aquaculture 2020, 528, 735571. [Google Scholar] [CrossRef]
- Best, J.H.; Eddy, F.B.; Codd, G.A. Effects of Microcystis Cells, Cell Extracts and Lipopolysaccharide on Drinking and Liver Function in Rainbow Trout Oncorhynchus mykiss Walbaum. Aquat. Toxicol. 2003, 64, 419–426. [Google Scholar] [CrossRef] [PubMed]
- Seo, C.; Lee, J.W.; Jung, W.-K.; Lee, Y.-M.; Lee, S.; Lee, S.G. Examination of Microcystin Adsorption by the Type of Plastic Materials Used during the Procedure of Microcystin Analysis. Toxins 2022, 14, 625. [Google Scholar] [CrossRef] [PubMed]


| Site | Water Microcystin Concentration (ng MC/L) | Microcystin Concentration in SPATT (ng MC/g SPATT Dry Weight/Day) | ||||||||
|---|---|---|---|---|---|---|---|---|---|---|
| Min | Max | Median | Mean (SE) | n | Min | Max | Median | Mean (SE) | n | |
| Ahlstrom | 0.369 | 0.855 | 0.419 | 0.489 (0.039) | 14 | 0.037 | 1.120 | 0.119 | 0.191 (0.026) | 55 |
| Concepcion | 0.290 | 2.128 | 0.446 | 0.589 (0.069) | 30 | 0.037 | 1.992 | 0.233 | 0.296 (0.033) | 71 |
| Dixon Bay | Not measured | 0.053 | 0.406 | 0.199 | 0.239 (0.029) | 18 | ||||
| Millar | 0.185 | 2.050 | 0.340 | 0.522 (0.193) | 9 | 0.038 | 0.689 | 0.181 | 0.213 (0.017) | 61 |
| Raza Island | 0.148 | 2.218 | 0.376 | 0.689 (0.186) | 11 | 0.097 | 1.038 | 0.290 | 0.335 (0.045) | 29 |
| Brennan Island | Not measured | 0.038 | 0.125 | 0.072 | 0.069 (0.010) | 8 | ||||
| Saranac Island | 0.384 | 2.265 | 0.498 | 0.677 (0.118) | 16 | 0.058 | 6.704 | 0.437 | 0.620 (0.156) | 41 |
| Site | Water Okadaic Acid Concentration (ng OA/L) | Okadaic Acid Concentration in SPATT (ng OA/g SPATT Dry Weight/Day) | ||||||||
|---|---|---|---|---|---|---|---|---|---|---|
| Min | Max | Median | Mean (SE) | n | Min | Max | Median | Mean (SE) | n | |
| Ahlstrom | 14.86 | 24.96 | 19.89 | 20.16 (1.36) | 7 | 2.13 | 33.32 | 13.50 | 13.04 (2.95) | 11 |
| Concepcion | 12.41 | 44.56 | 23.18 | 25.16 (3.50) | 10 | 3.63 | 56.06 | 23.11 | 21.81 (3.78) | 13 |
| Millar | 19.65 | 24.70 | 22.17 | 22.17 (2.53) | 2 | 5.32 | 35.54 | 11.85 | 15.06 (2.41) | 16 |
| Raza Island | 17.29 | 29.50 | 23.65 | 23.68 (1.75) | 6 | 4.03 | 34.26 | 19.61 | 17.20 (3.24) | 10 |
| Brennan Island | Not measured | 1.09 | 7.69 | 3.88 | 3.70 (0.82) | 7 | ||||
| Saranac Island | 12.70 | 38.16 | 21.45 | 24.06 (3.48) | 7 | 14.26 | 36.81 | 20.35 | 23.37 (2.52) | 10 |
| Site | Domoic Acid Concentration in SPATT (pg DA/g SPATT Dry Weight/Day) | ||||
|---|---|---|---|---|---|
| Min | Max | Median | Mean (SE) | n | |
| Saranac Island | 27.1 | 145.5 | 70.5 | 75.2 (11.6) | 9 |
| Concepcion | 5.9 | 43.0 | 20.93 | 22.7 (3.2) | 12 |
| Millar | 9.1 | 42.3 | 16.4 | 20.7 (3.6) | 10 |
| Raza Island | 5.1 | 2223.0 | 52.1 | 473.6 (437.4) | 5 |
| Ahlstrom | 7.6 | 102.1 | 17.1 | 29.0 (12.4) | 7 |
| Site | DTX-1 Concentration in SPATT (ng DTX-1/g SPATT Dry Weight/Day) | ||||
|---|---|---|---|---|---|
| Min | Max | Median | Mean (SE) | n | |
| Saranac Island | 15.4 | 36.1 | 18.5 | 22.3 (3.3) | 7 |
| Millar | 3.1 | 31.1 | 10.4 | 13.8 (12.2) | 4 |
| Raza Island | 2.8 | 55.6 | 43.9 | 37.2 (20.8) | 5 |
| Ahlstrom | 5.9 | 205.8 | 24.5 | 65.2 (47.1) | 4 |
| Site | PTX-2 Concentration in SPATT (ng PTX-2/g SPATT Dry Weight/Day) | ||||
|---|---|---|---|---|---|
| Min | Max | Median | Mean (SE) | n | |
| Saranac Island | 34.2 | 58.6 | 38.6 | 40.8 (3.1) | 7 |
| Millar | 4.1 | 26.4 | 15.9 | 15.6 (5.0) | 4 |
| Raza Island | 9.4 | 97.5 | 65.9 | 57.2 (14.7) | 5 |
| Ahlstrom | 10.9 | 142.3 | 48.2 | 62.4 (30.2) | 4 |
| Site | YTX Concentration in SPATT (ng YTX/g SPATT Dry Weight/Day) | ||||
|---|---|---|---|---|---|
| Min | Max | Median | Mean (SE) | n | |
| Saranac Island | 3.1 | 729.7 | 55.9 | 191.4 (104.1) | 7 |
| Millar | 9.4 | 39.0 | 27.7 | 25.4 (8.6) | 3 |
| Raza Island | 4.6 | 72.3 | 20.2 | 29.3 (15.5) | 4 |
| Ahlstrom | 9.4 | 144.9 | 31.7 | 62.0 (42.0) | 3 |
| Water Toxin Conc. | Duration of Drinking | ||||||
|---|---|---|---|---|---|---|---|
| (ng/L) | Hour | Day | Week | Month | Year | ||
| Min | 0.1 | 0.00 | 0.04 | 0.25 | 0.99 | 11.91 | |
| Microcystin | Median | 0.4 | 0.00 | 0.10 | 0.73 | 2.93 | 35.16 |
| Max | 2.3 | 0.02 | 0.54 | 3.81 | 15.22 | 182.65 | |
| Min | 12 | 0.1 | 3.0 | 20.8 | 83.4 | 1000.7 | |
| Okadaic acid | Median | 22 | 0.2 | 5.2 | 36.5 | 146.1 | 1753.1 |
| Max | 45 | 0.4 | 10.7 | 74.9 | 299.4 | 3593.3 | |
| Site | Date Range 1 | Parameter | Min | Max | Median | Mean (SE) | n |
|---|---|---|---|---|---|---|---|
| Ahlstrom | 1 June 2017–27 June 2019 | Dissolved O2 (mg/L) | 5.3 | 15.2 | 8.8 | 8.8 (0.1) | 595 |
| Salinity (psu) | 15.0 | 33.5 | 27.5 | 26.9 (0.1) | |||
| Temperature (°C) | 6.7 | 20.6 | 13.5 | 12.9 (0.2) | |||
| Concepcion | 1 June 2017–26 June 2019 | Dissolved O2 (mg/L) | 41.1 | 26.5 | 8.9 | 8.9 (0.1) | 630 |
| Salinity (psu) | 9.0 | 27.5 | 27.5 | 26.4 (0.2) | |||
| Temperature (°C) | 4.5 | 16.2 | 10.0 | 10.6 (0.1) | |||
| Dixon Bay | 9 February 2018–7 June 2019 | Dissolved O2 (mg/L) | 6.0 | 10.8 | 8.8 | 8.6 (0.1) | 307 |
| Salinity (psu) | 16.0 | 33.0 | 29.0 | 28.1 (0.2) | |||
| Temperature (°C) | 7.7 | 13.7 | 10.4 | 10.5 (0.1) | |||
| Millar | 28 September 2017–7 June 2019 | Dissolved O2 (mg/L) | 6.4 | 11.5 | 8.9 | 8.7 (0.1) | 282 |
| Salinity (psu) | 16.5 | 33.0 | 29.5 | 28.6 (0.1) | |||
| Temperature (°C) | 7.9 | 15.7 | 10.1 | 10.6 (0.1) | |||
| Raza Island | 10 October 2017–7 June 2019 | Dissolved O2 (mg/L) | 5.0 | 12.2 | 8.4 | 8.5 (0.0) | 621 |
| Salinity (psu) | 19.5 | 31.0 | 28.0 | 27.5 (0.1) | |||
| Temperature (°C) | 6.4 | 18.5 | 9.5 | 10.1 (0.1) | |||
| Saranac Island | 28 February 2019–7 June 2019 | Dissolved O2 (mg/L) | 8.5 | 11.8 | 9.4 | 9.5 (0.0) | 129 |
| Salinity (psu) | 26.0 | 29.0 | 26.0 | 29.2 (0.1) | |||
| Temperature (°C) | 7.5 | 13.9 | 10.8 | 10.9 (0.2) |
| Analyte | Retention | ESI | Primary Transition (m/z) * | Collision Energy (V) | Secondary | Collision | |
|---|---|---|---|---|---|---|---|
| Time (min) | Mode | Transition m/z | Energy (V) | ||||
| DTX-1 | 9.39 | (-) | 817.0 > 254.7 | 40 | 817.0 > 113.0 | 40 | |
| PTX-2 | 8.26 | (+) | 876.3 > 823.0 | 30 | 876.3 > 213.0 | 30 | |
| YTX | 8.53 | (-) | 1141 > 1061 | 46 | 1141 > 855.0 | 60 | |
Disclaimer/Publisher’s Note: The statements, opinions and data contained in all publications are solely those of the individual author(s) and contributor(s) and not of MDPI and/or the editor(s). MDPI and/or the editor(s) disclaim responsibility for any injury to people or property resulting from any ideas, methods, instructions or products referred to in the content. |
© 2023 by the authors. Licensee MDPI, Basel, Switzerland. This article is an open access article distributed under the terms and conditions of the Creative Commons Attribution (CC BY) license (https://creativecommons.org/licenses/by/4.0/).
Share and Cite
Shartau, R.B.; Turcotte, L.D.M.; Bradshaw, J.C.; Ross, A.R.S.; Surridge, B.D.; Nemcek, N.; Johnson, S.C. Dissolved Algal Toxins along the Southern Coast of British Columbia Canada. Toxins 2023, 15, 395. https://doi.org/10.3390/toxins15060395
Shartau RB, Turcotte LDM, Bradshaw JC, Ross ARS, Surridge BD, Nemcek N, Johnson SC. Dissolved Algal Toxins along the Southern Coast of British Columbia Canada. Toxins. 2023; 15(6):395. https://doi.org/10.3390/toxins15060395
Chicago/Turabian StyleShartau, Ryan B., Lenora D. M. Turcotte, Julia C. Bradshaw, Andrew R. S. Ross, Blair D. Surridge, Nina Nemcek, and Stewart C. Johnson. 2023. "Dissolved Algal Toxins along the Southern Coast of British Columbia Canada" Toxins 15, no. 6: 395. https://doi.org/10.3390/toxins15060395
APA StyleShartau, R. B., Turcotte, L. D. M., Bradshaw, J. C., Ross, A. R. S., Surridge, B. D., Nemcek, N., & Johnson, S. C. (2023). Dissolved Algal Toxins along the Southern Coast of British Columbia Canada. Toxins, 15(6), 395. https://doi.org/10.3390/toxins15060395