Natural Antioxidant By-Product Mixture Counteracts the Effects of Aflatoxin B1 and Ochratoxin A Exposure of Piglets after Weaning: A Proteomic Survey on Liver Microsomal Fraction

 , ,
, ,  and
and 
Abstract
1. Introduction
2. Results
2.1. Pathway Enrichment Analysis of the Differentially Expressed Proteins
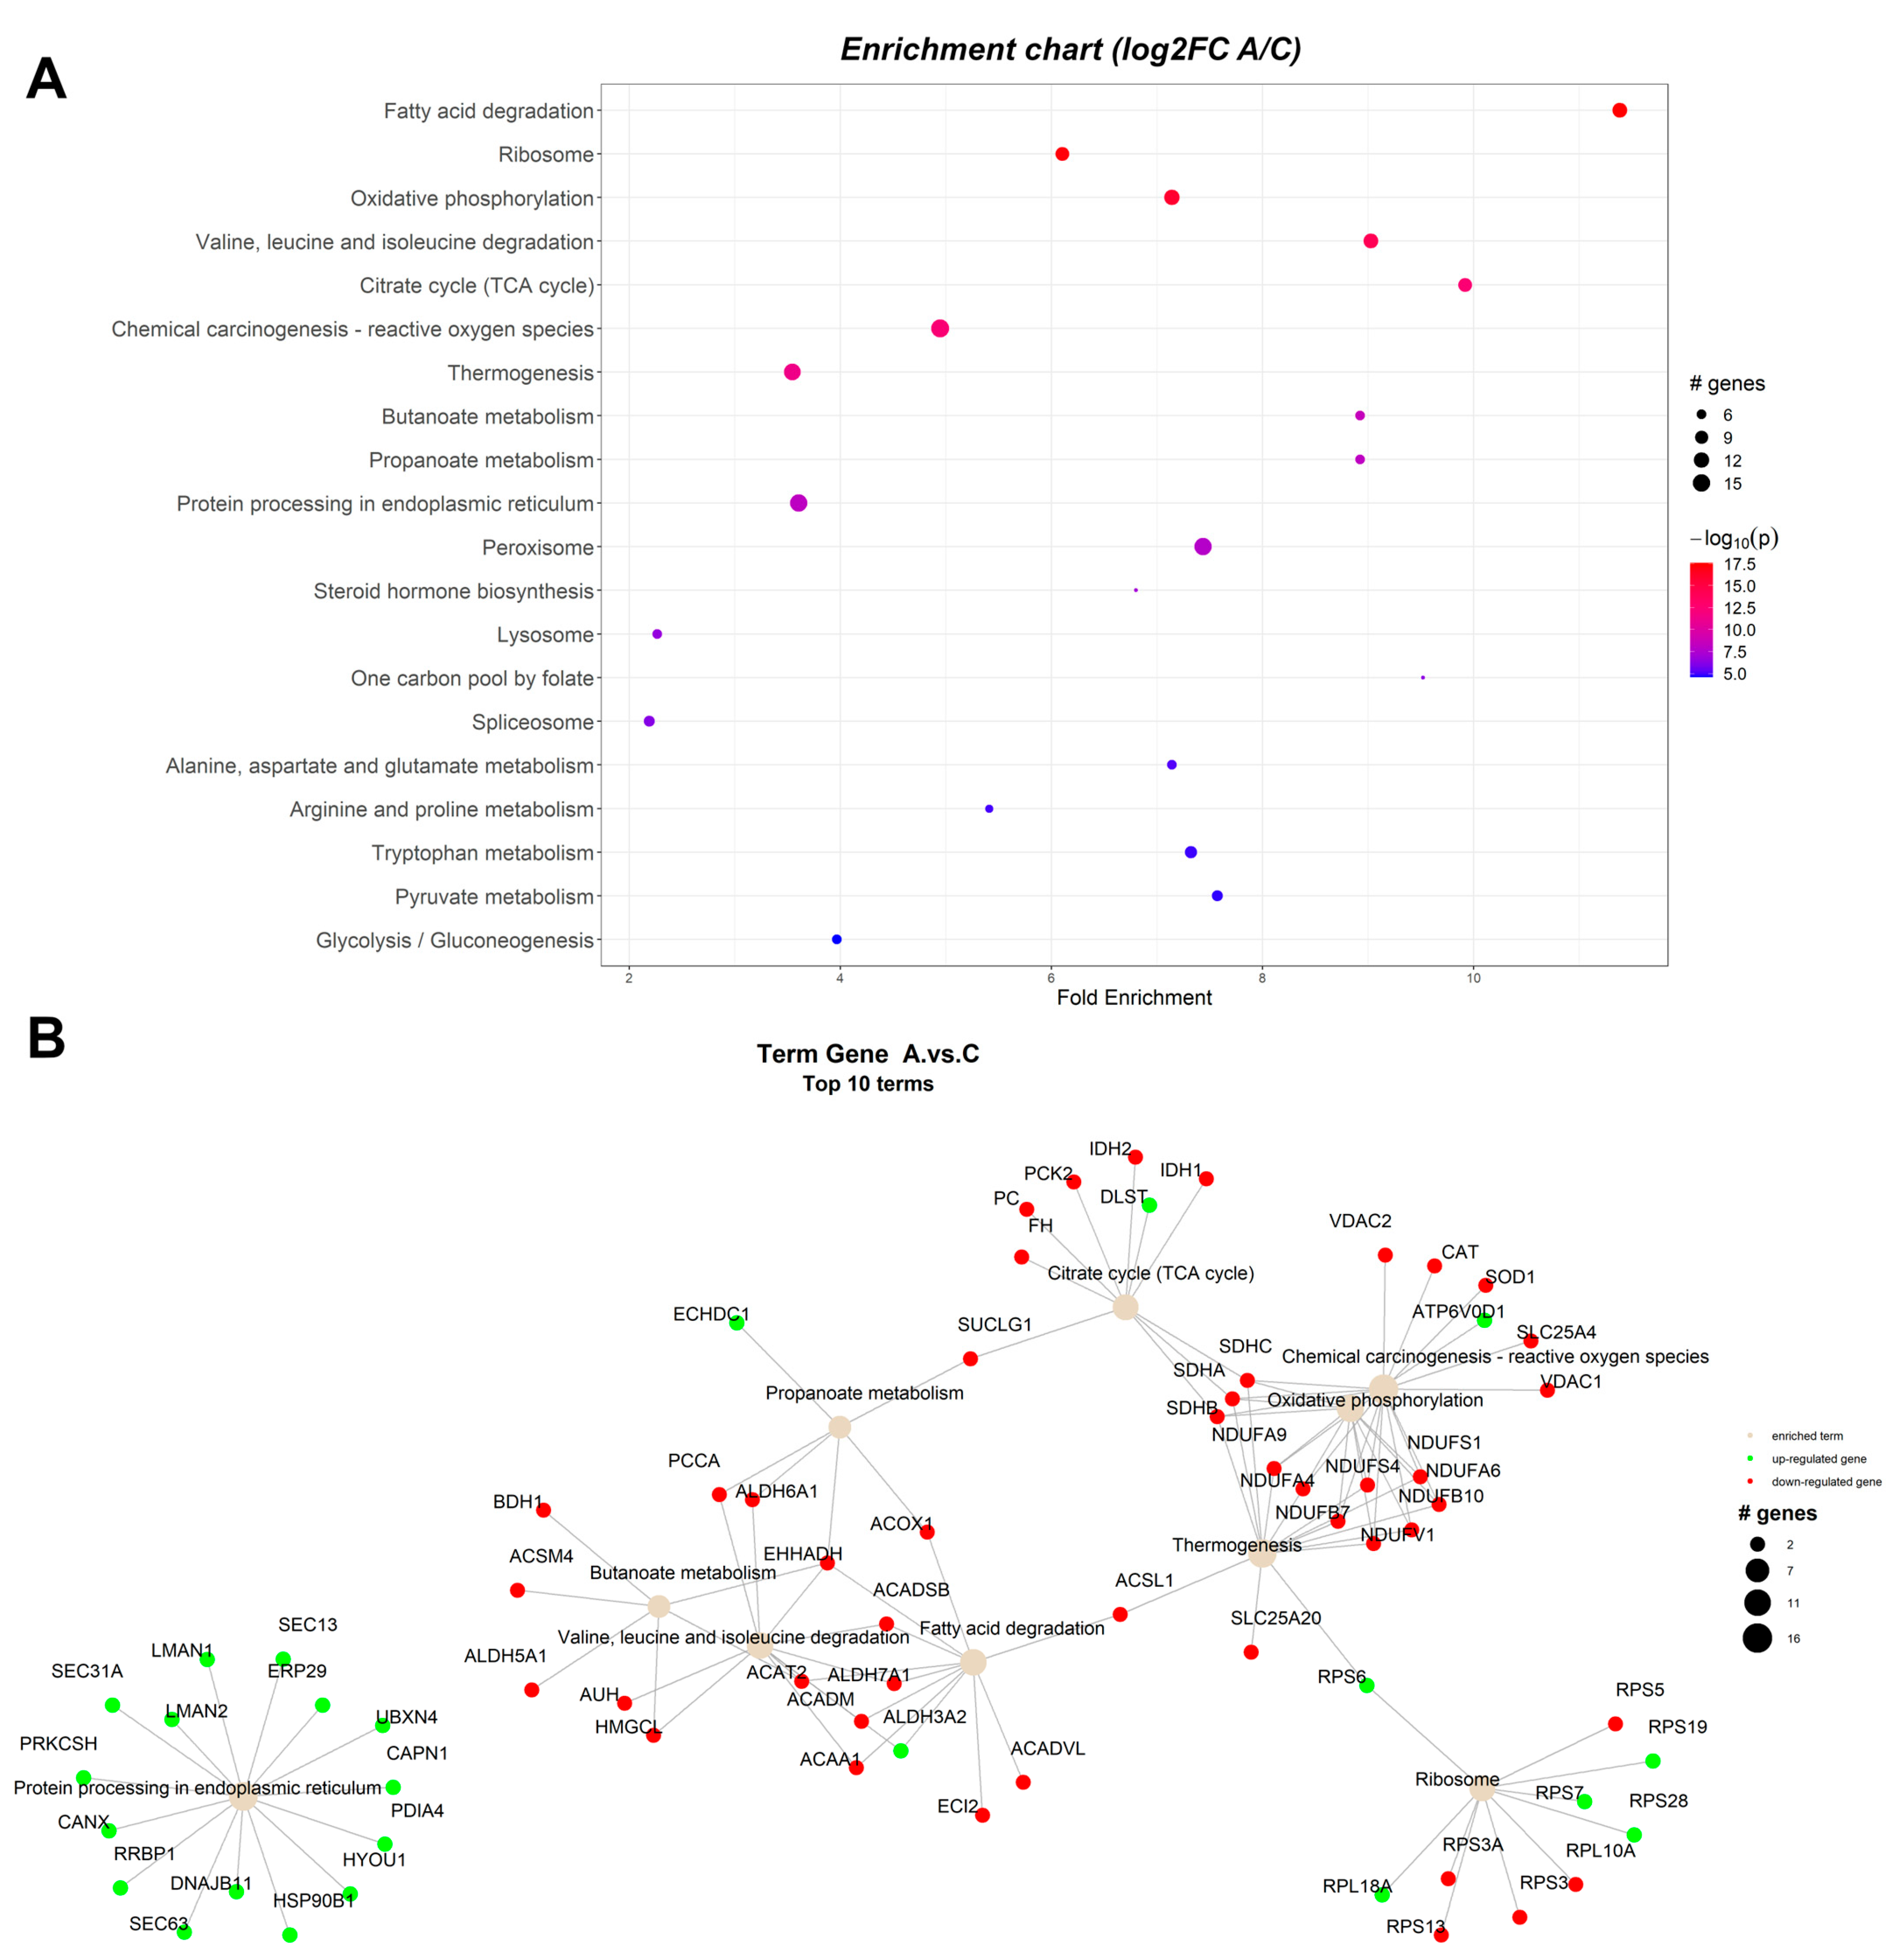
2.1.1. Proteomic Changes Associated with Dietary Byproduct Antioxidants Administration
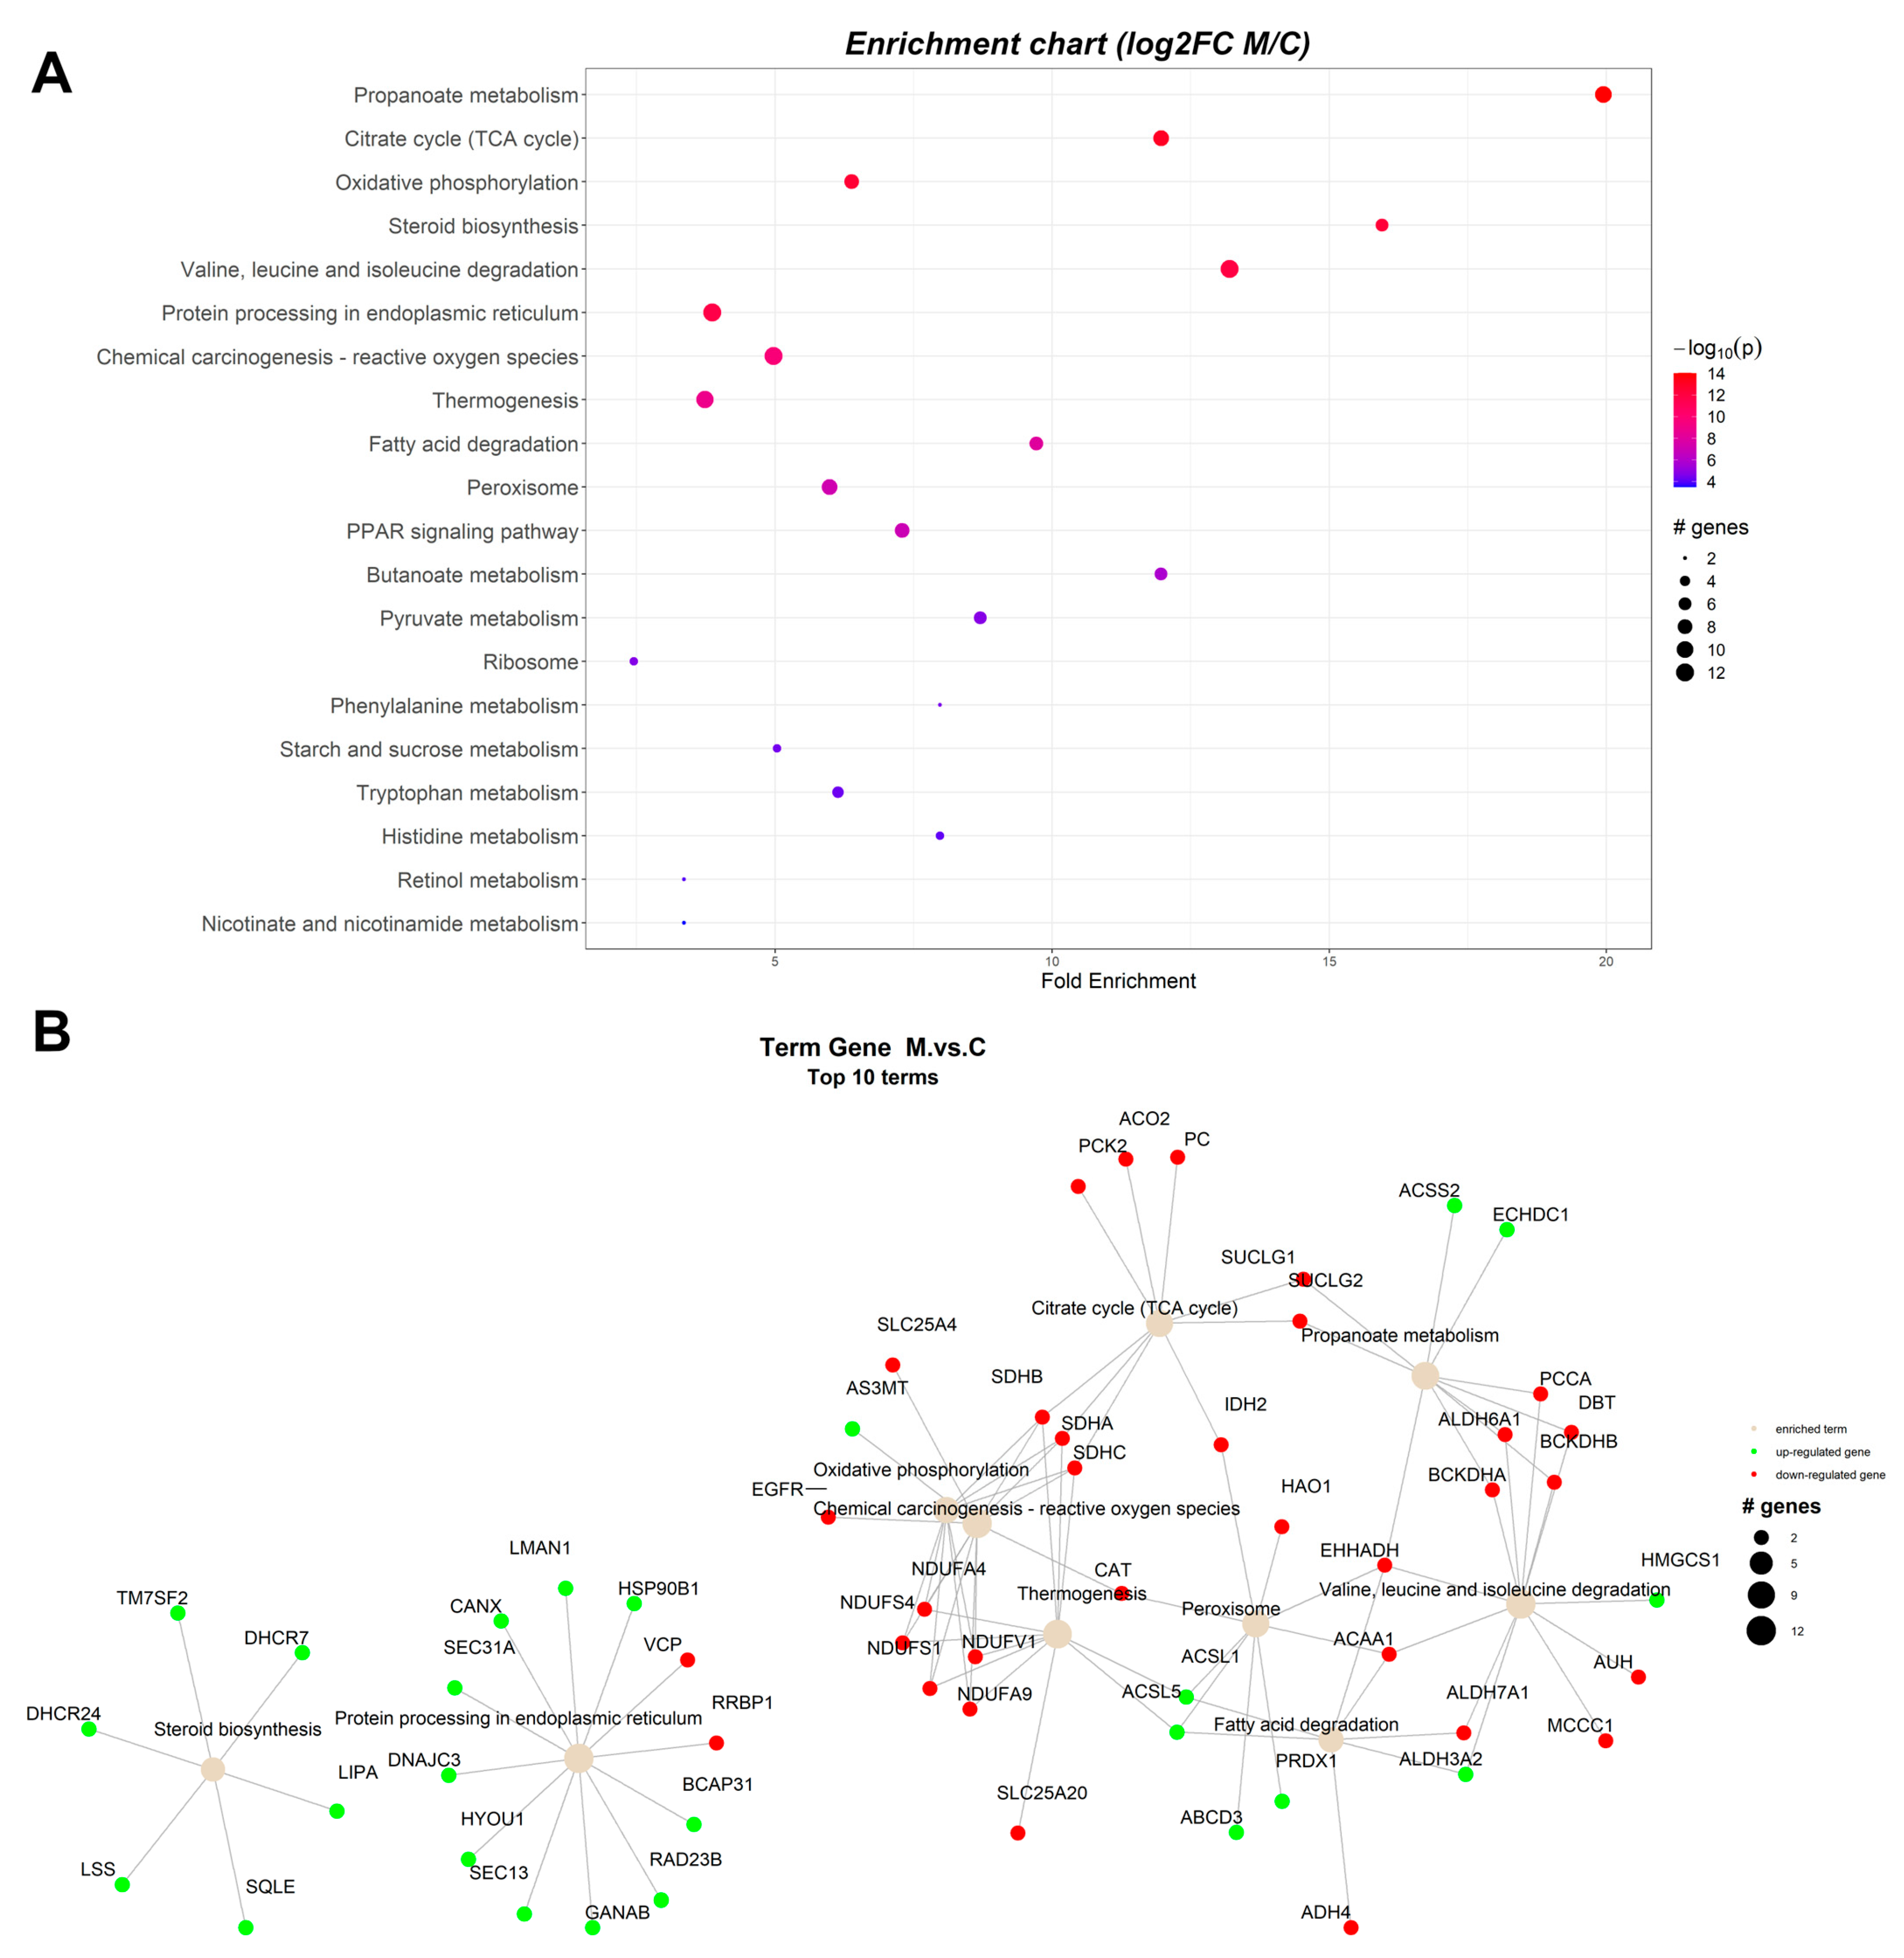
2.1.2. Proteomic Changes in Pigs’ Liver Fed with Mycotoxins Contaminated Diet
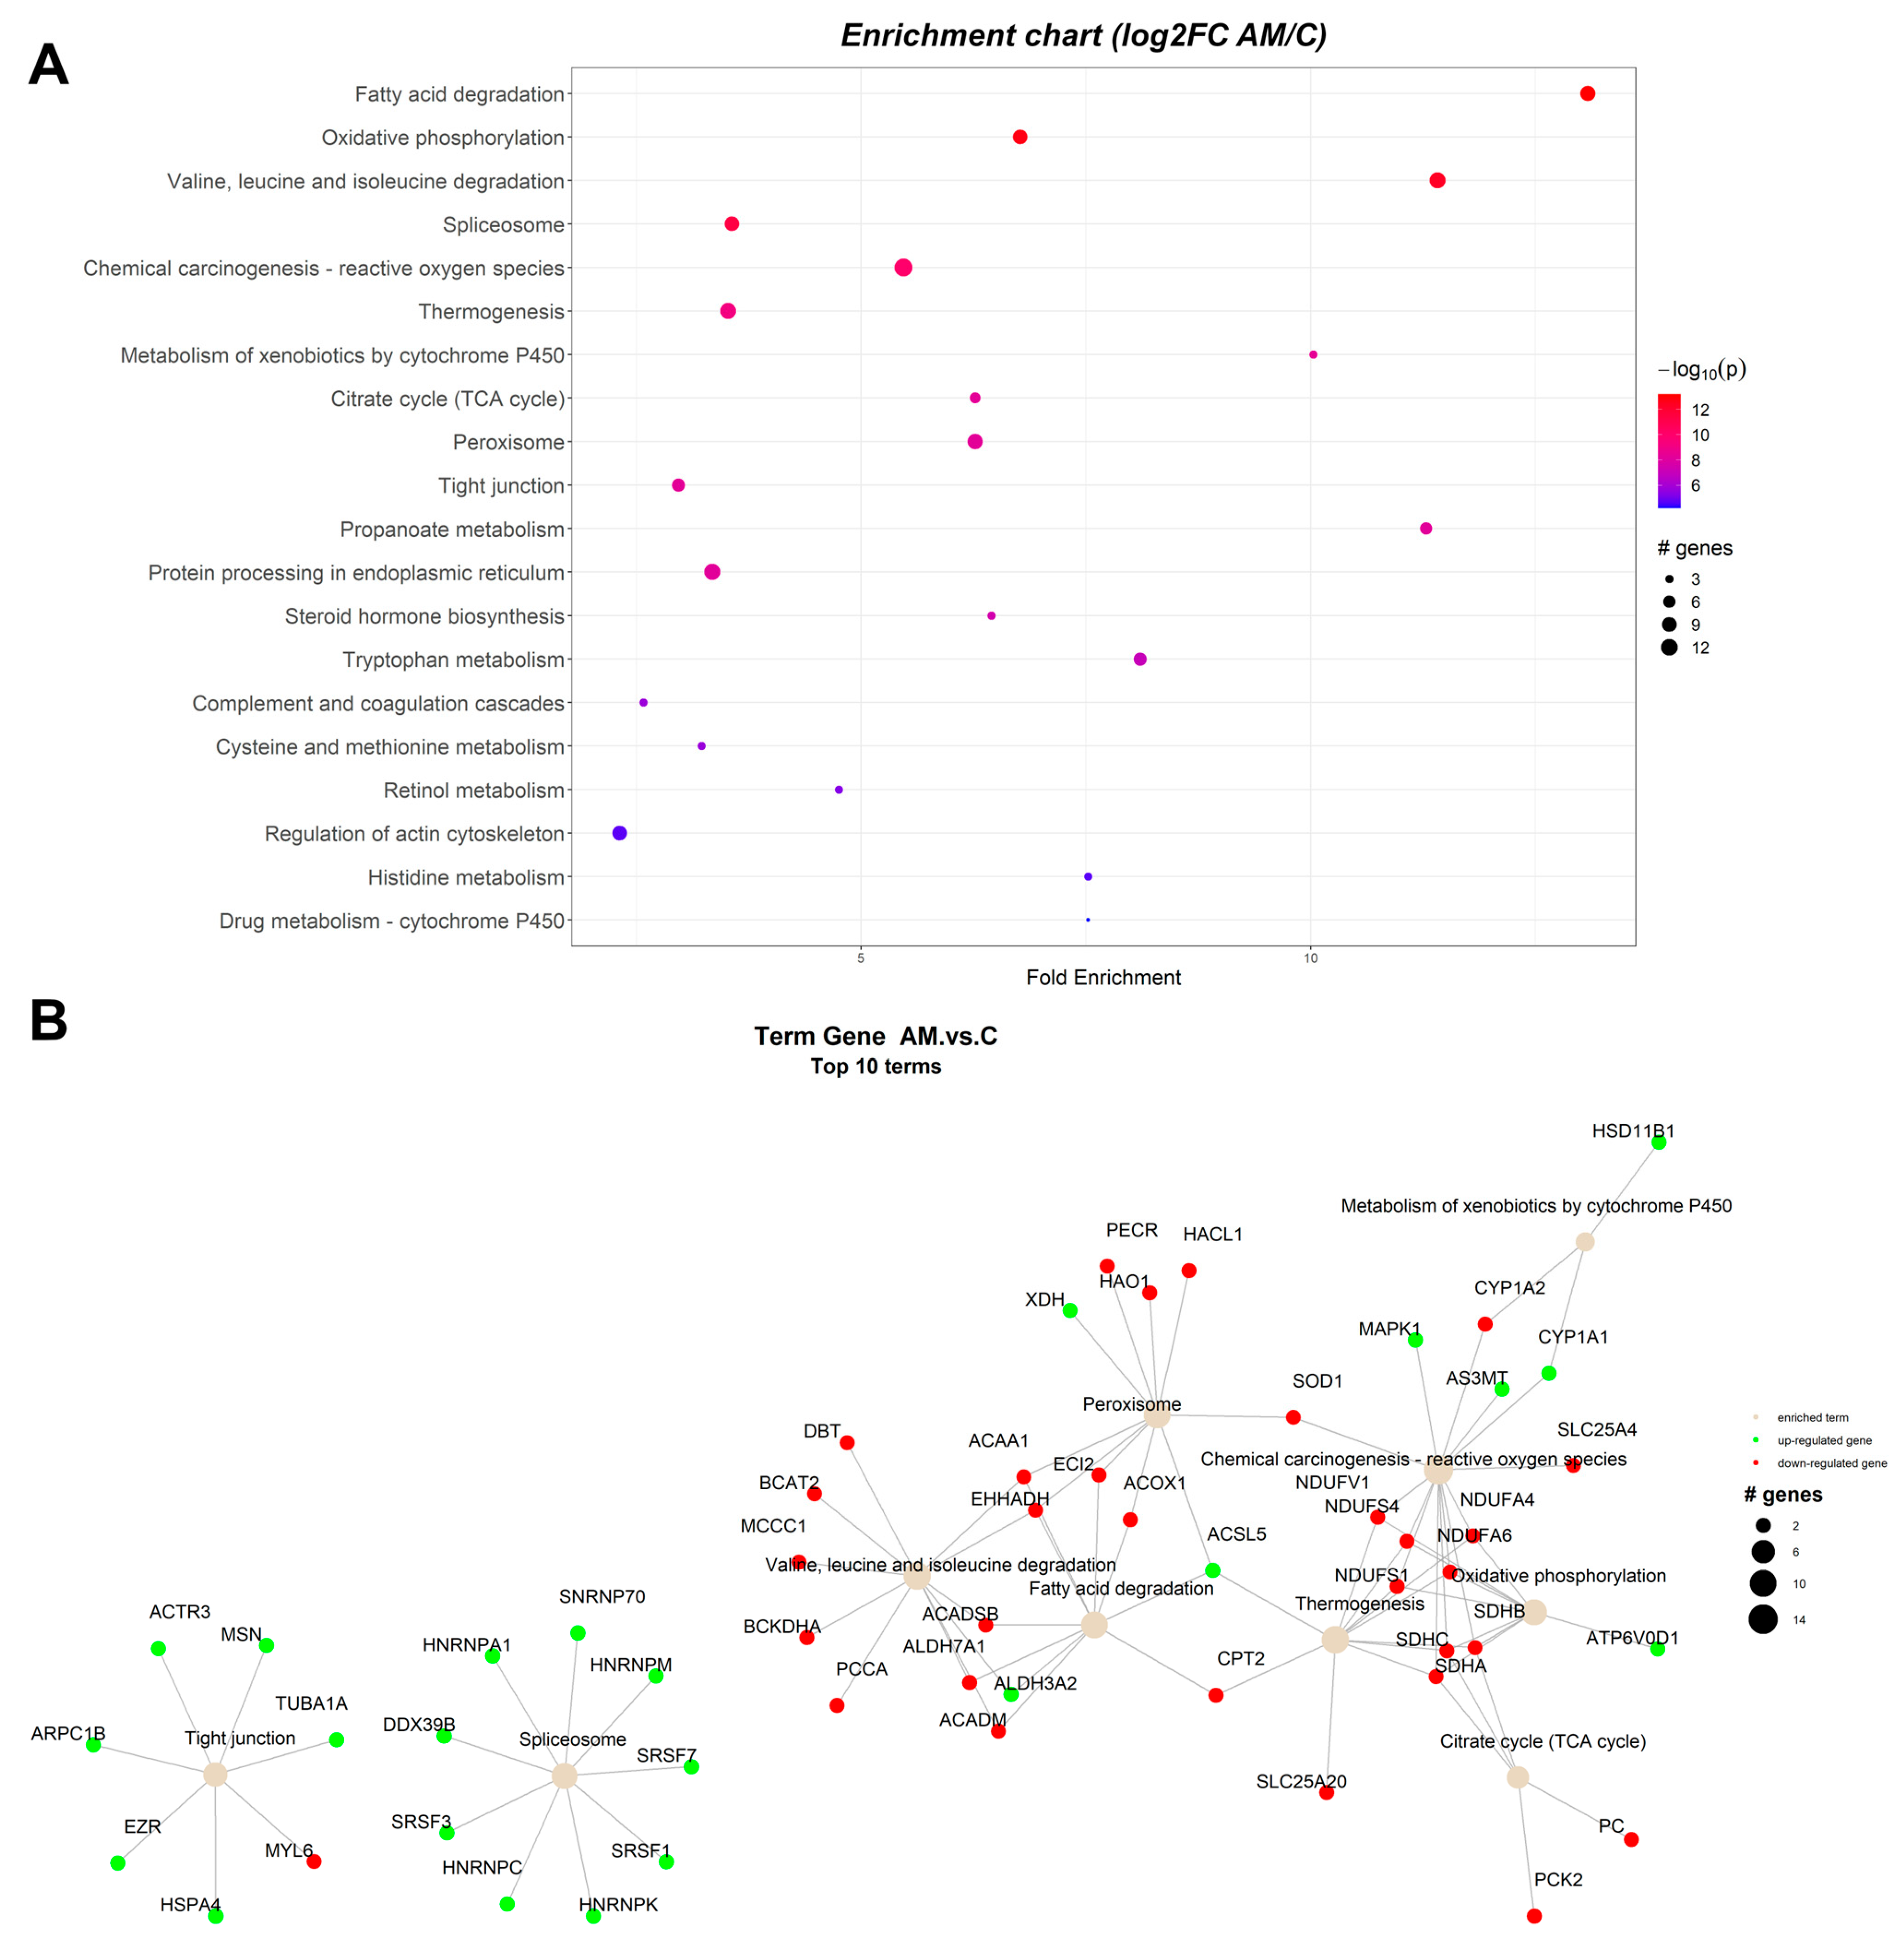
2.1.3. Proteomic Changes in Concomitant Administration of Antioxidants and Mycotoxins in Weaned Piglets’ Diet
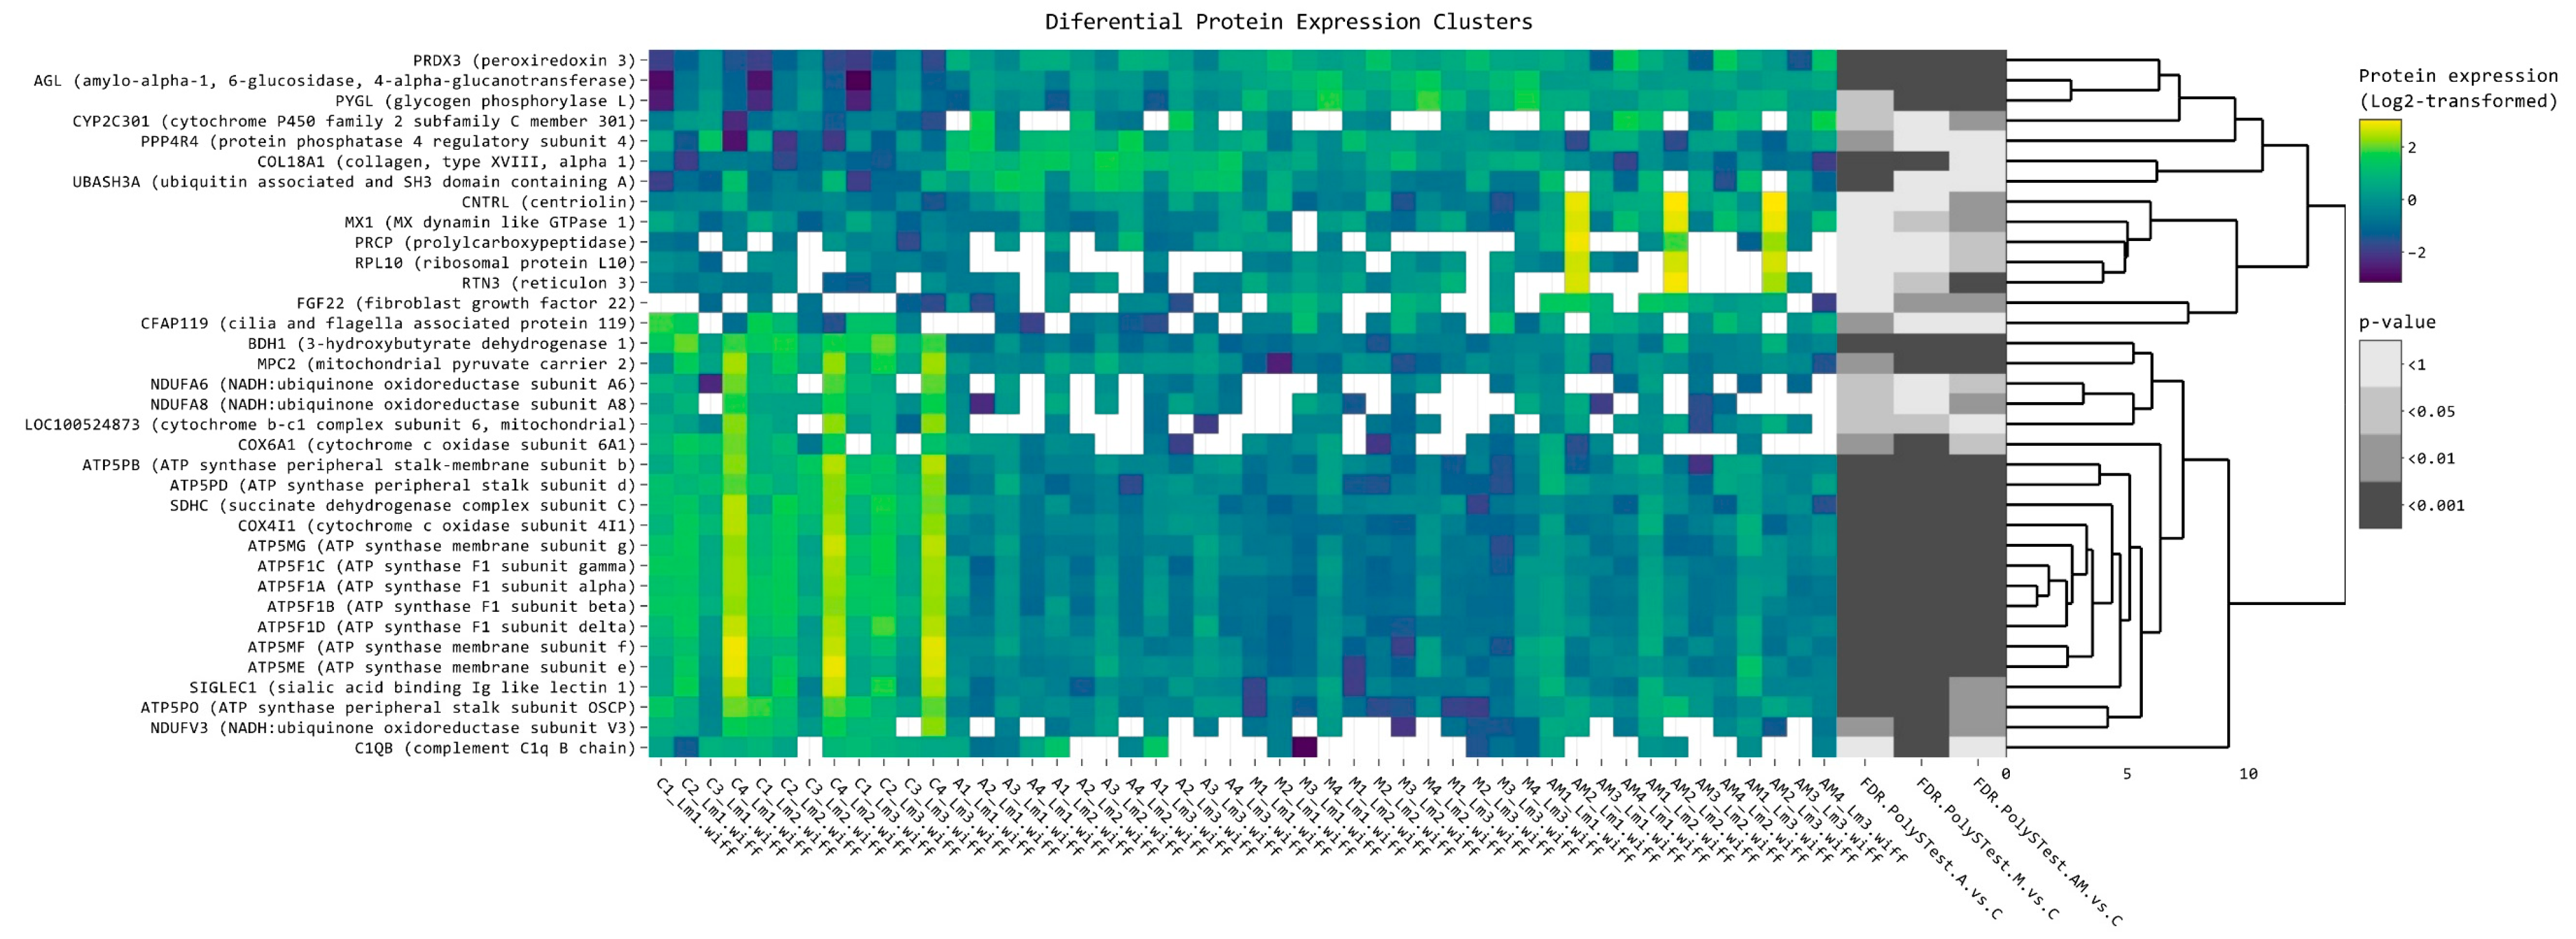
2.2. Heatmap Analysis of Differentially Expressed Proteins of Hepatic Microsomal Fraction
2.3. Most significant Changes in Protein Expression
2.3.1. Impact of Mycotoxins
2.3.2. Impact of Antioxidants
3. Discussion
4. Conclusions
5. Materials and Methods
5.1. Animals, Treatment and Sampling
5.2. Microsomal Fraction Isolation
5.3. Trypsin Digestion
5.4. LC-MS/MS Analysis
5.5. Data Analysis
Supplementary Materials
Author Contributions
Funding
Institutional Review Board Statement
Informed Consent Statement
Data Availability Statement
Acknowledgments
Conflicts of Interest
Appendix A


References
- Pleadin, J.; Frece, J.; Markov, K. Mycotoxins in food and feed. In Advances in Food and Nutrition Research, 1st ed.; Toldrá, F., Ed.; Elsevier Inc.: Cambridge, MA, USA, 2019; Volume 89, pp. 297–345. [Google Scholar]
- El-Sayed, R.A.; Jebur, A.B.; Kang, W.; El-Demerdash, F.M. An overview on the major mycotoxins in food products: Characteristics, toxicity, and analysis. J. Futur. Foods 2022, 2, 91–102. [Google Scholar] [CrossRef]
- Kępińska-Pacelik, J.; Biel, W. Alimentary risk of mycotoxins for humans and animals. Toxins 2021, 13, 822. [Google Scholar] [CrossRef]
- Nešić, K.; Habschied, K.; Mastanjević, K. Possibilities for the Biological Control of Mycotoxins in Food and Feed. Toxins 2021, 13, 198. [Google Scholar] [CrossRef]
- Pleadin, J.; Staver, M.M.; Vahčić, N.; Kovačević, D.; Milone, S.; Saftić, L.; Scortichini, G. Survey of aflatoxin B1 and ochratoxin A occurrence in traditional meat products coming from Croatian households and markets. Food Control 2015, 52, 71–77. [Google Scholar] [CrossRef]
- Popescu, R.G.; Rădulescu, A.L.; Georgescu, S.E.; Dinischiotu, A. Aflatoxins in Feed: Types, Metabolism, Health Consequences in Swine and Mitigation Strategies. Toxins 2022, 14, 853. [Google Scholar] [CrossRef]
- Omar, S.S. Prevalence, level and health risk assessment of mycotoxins in the fried poultry eggs from Jordan. Environ. Res. 2021, 200, 111701. [Google Scholar] [CrossRef]
- Awuchi, C.G.; Ondari, E.N.; Nwozo, S.; Odongo, G.A.; Eseoghene, J.; Twinomuhwezi, H.; Ogbonna, C.U.; Upadhyay, A.K.; Adeleye, A.O.; Okpala, C.O.R. Livestock and Their Associated Health Concerns: A Review. Toxins 2022, 14, 167. [Google Scholar] [CrossRef]
- Kortei, N.K.; Annan, T.; Kyei-Baffour, V.; Essuman, E.K.; Okyere, H.; Tettey, C.O. Exposure and risk characterizations of ochratoxins A and aflatoxins through maize (Zea mays) consumed in different agro-ecological zones of Ghana. Sci. Rep. 2021, 11, 23339. [Google Scholar] [CrossRef]
- Ul-Hassan, Z.; Zargham Khan, M.; Khan, A.; Javed, I. Immunological status of the progeny of breeder hens kept on ochratoxin A (OTA)-and aflatoxin B1 (AFB1)-contaminated feeds. J. Immunotoxicol. 2012, 9, 381–391. [Google Scholar] [CrossRef]
- Magnoli, A.P.; Poloni, V.L.; Cavaglieri, L. Impact of mycotoxin contamination in the animal feed industry. Curr. Opin. Food Sci. 2019, 29, 99–108. [Google Scholar] [CrossRef]
- Tsiouris, V.; Tassis, P.; Raj, J.; Mantzios, T.; Kiskinis, K.; Vasiljević, M.; Delić, N.; Petridou, E.; Brellou, G.D.; Polizopoulou, Z.; et al. Investigation of a novel multicomponent mycotoxin detoxifying agent in amelioration of mycotoxicosis induced by aflatoxin-b1 and ochratoxin a in broiler chicks. Toxins 2021, 13, 367. [Google Scholar] [CrossRef]
- Jin, S.; Yang, H.; Wang, Y.; Pang, Q.; Jiao, Y.; Shan, A.; Feng, X. Dietary curcumin alleviated aflatoxin b1-induced acute liver damage in ducks by regulating nlrp3–caspase-1 signaling pathways. Foods 2021, 10, 3086. [Google Scholar] [CrossRef] [PubMed]
- Yang, C.; Song, G.; Lim, W. Effects of mycotoxin-contaminated feed on farm animals. J. Hazard. Mater. 2020, 389, 122087. [Google Scholar] [CrossRef]
- Pu, J.; Yuan, Q.; Yan, H.; Tian, G.; Chen, D.; He, J.; Zheng, P.; Yu, J.; Mao, X.; Huang, Z.; et al. Effects of chronic exposure to low levels of dietary aflatoxin b1 on growth performance, apparent total tract digestibility and intestinal health in pigs. Animals 2021, 11, 336. [Google Scholar] [CrossRef] [PubMed]
- Tkaczyk, A.; Jedziniak, P. Mycotoxin biomarkers in pigs—Current state of knowledge and analytics. Toxins 2021, 13, 586. [Google Scholar] [CrossRef]
- Vlachou, M.; Pexara, A.; Solomakos, N.; Govaris, A. Ochratoxin A in Slaughtered Pigs and Pork Products. Toxins 2022, 14, 67. [Google Scholar] [CrossRef] [PubMed]
- Janik, E.; Niemcewicz, M.; Ceremuga, M.; Stela, M.; Saluk-bijak, J.; Siadkowski, A.; Bijak, M. Molecular Aspects of Mycotoxins—A Serious Problem for Human Health. Int. J. Mol. Sci. 2020, 21, 8187. [Google Scholar] [CrossRef]
- Zain, M.E. Impact of mycotoxins on humans and animals. J. Saudi Chem. Soc. 2011, 15, 129–144. [Google Scholar] [CrossRef]
- Tolosa, J.; Rodríguez-Carrasco, Y.; Ruiz, M.J.; Vila-Donat, P. Multi-mycotoxin occurrence in feed, metabolism and carry-over to animal-derived food products: A review. Food Chem. Toxicol. 2021, 158, 112661. [Google Scholar] [CrossRef]
- Nji, Q.N.; Babalola, O.O.; Nleya, N.; Mwanza, M. Underreported Human Exposure to Mycotoxins: The Case of South Africa. Foods 2022, 11, 2714. [Google Scholar] [CrossRef]
- Haque, M.A.; Wang, Y.; Shen, Z.; Li, X.; Saleemi, M.K.; He, C. Mycotoxin contamination and control strategy in human, domestic animal and poultry: A review. Microb. Pathog. 2020, 142, 104095. [Google Scholar] [CrossRef]
- Alam, S.; Nisa, S.; Daud, S. Mycotoxins in Environment and Its Health Implications. In Hazardous Environmental Micro-Pollutants, Health Impacts and Allied Treatment Technologies. Emerging Contaminants and Associated Treatment Technologies, 1st ed.; Ahmed, T., Hashmi, M.Z., Eds.; Springer: Berlin/Heidelberg, Germany, 2022; pp. 289–318. [Google Scholar]
- Pickova, D.; Ostry, V.; Malir, F. A Recent Overview of Producers and Important Dietary Sources of Aflatoxins. Toxins 2021, 13, 186. [Google Scholar] [CrossRef] [PubMed]
- Schmidt, M.A.; Mao, Y.; Opoku, J.; Mehl, H.L. Enzymatic degradation is an effective means to reduce aflatoxin contamination in maize. BMC Biotechnol. 2021, 21, 1–10. [Google Scholar] [CrossRef] [PubMed]
- De Almeida, L.; Williams, R.; Soares, D.M.; Nesbitt, H.; Wright, G.; Erskine, W. Aflatoxin levels in maize and peanut and blood in women and children: The case of Timor-Leste. Sci. Rep. 2019, 9, 13158. [Google Scholar] [CrossRef] [PubMed]
- Mahato, D.K.; Lee, K.E.; Kamle, M.; Devi, S.; Dewangan, K.N.; Kumar, P.; Kang, S.G. Aflatoxins in Food and Feed: An Overview on Prevalence, Detection and Control Strategies. Front. Microbiol. 2019, 10, 2266. [Google Scholar] [CrossRef] [PubMed]
- Redzwan, S.M.; Rosita, J.; Sokhini, A.M.M.; Aqilah, A.R.N.; Wang, J.; Kang, M.; Zuraini, A. International Journal of Hygiene and Detection of serum AFB 1 -lysine adduct in Malaysia and its association with liver and kidney functions. Int. J. Hyg. Environ. Health 2014, 217, 443–451. [Google Scholar] [CrossRef] [PubMed]
- Zhou, R.; Liu, M.; Liang, X.; Su, M.; Li, R. Clinical features of a fl atoxin B1-exposed patients with liver cancer and the molecular mechanism of a fl atoxin B1 on liver cancer cells. Environ. Toxicol. Pharmacol. 2019, 71, 103225. [Google Scholar] [CrossRef] [PubMed]
- Dabuo, B.; Wesome Avogo, E.; Owusu Koomson, G.; Akantibila, M.; Ayendo Gbati, D. Aflatoxins: Toxicity, Occurrences and Chronic Exposure. In Aflatoxins—Occurrence, Detection and Novel Detoxification Strategies; Assaf, J.C., Ed.; IntechOpen: London, UK, 2022; Volume 1, pp. 1–21. [Google Scholar] [CrossRef]
- Kumar, P.; Kumar, D.; Sharma, B.; Borah, R.; Haque, S.; Mahmud, M.M.C.; Kumar, A.; Rawal, D.; Bora, H.; Bui, S. Toxicon Ochratoxins in food and feed: Occurrence and its impact on human health and management strategies. Toxicon 2020, 187, 151–162. [Google Scholar] [CrossRef]
- Imaoka, T.; Yang, J.; Wang, L.; Mcdonald, M.G.; Afsharinejad, Z.; Bammler, T.K.; Van Ness, K.; Yeung, C.K.; Rettie, A.E.; Himmelfarb, J.; et al. Microphysiological system modeling of ochratoxin A-associated nephrotoxicity. Toxicology 2020, 444, 152582. [Google Scholar] [CrossRef]
- Lee, H.J.; Pyo, M.C.; Shin, H.S.; Ryu, D.; Lee, K.W. Renal toxicity through AhR, PXR, and Nrf2 signaling pathway activation of ochratoxin A-induced oxidative stress in kidney cells. Food Chem. Toxicol. 2018, 122, 59–68. [Google Scholar] [CrossRef] [PubMed]
- Li, P.; Li, K.; Zou, C.; Tong, C.; Sun, L.; Cao, Z.; Yang, S.; Lyu, Q. Selenium yeast alleviates ochratoxin a-induced hepatotoxicity via modulation of the PI3K/AKT and Nrf2/Keap1 signaling pathways in chickens. Toxins 2020, 12, 143. [Google Scholar] [CrossRef]
- Marin, D.E.; Pistol, G.C.; Gras, M.; Palade, M.; Taranu, I. A comparison between the effects of ochratoxin A and aristolochic acid on the inflammation and oxidative stress in the liver and kidney of weanling piglets. Naunyn Schmiedebergs Arch Pharmacol. 2018, 391, 1147–1156. [Google Scholar] [CrossRef] [PubMed]
- Shephard, G.S. Impact of mycotoxins on human health in developing countries. Food Addit Contam. 2008, 25, 146–151. [Google Scholar] [CrossRef]
- Marc, R.A. (Ed.) Implications of Mycotoxins in Food Safety. In Mycotoxins and Food Safety—Recent Advances; IntechOpen: London, UK, 2022; Volume 1, pp. 1–33. [Google Scholar] [CrossRef]
- Xu, R.; Kiarie, E.G.; Yiannikouris, A.; Sun, L.; Karrow, N.A. Nutritional impact of mycotoxins in food animal production and strategies for mitigation. J. Anim. Sci. Biotechnol. 2022, 13, 69. [Google Scholar] [CrossRef] [PubMed]
- Müller, L.K.F.; Paiano, D.; Gugel, J.; Lorenzetti, W.R.; Santurio, J.M.; de Castro Tavernari, F.; da Gloria, E.M.; Baldissera, M.D.; Da Silva, A.S. Post-weaning piglets fed with different levels of fungal mycotoxins and spray-dried porcine plasma have improved weight gain, feed intake and reduced diarrhea incidence. Microb. Pathog. 2018, 117, 259–264. [Google Scholar] [CrossRef] [PubMed]
- Holanda, D.M.; Kim, Y.I.; Parnsen, W.; Kim, S.W. Phytobiotics with Adsorbent to Mitigate Toxicity of Multiple Mycotoxins on Health and Growth of Pigs. Toxins 2021, 13, 442. [Google Scholar] [CrossRef]
- Peng, W.X.; Marchal, J.L.M.; van der Poel, A.F.B. Strategies to prevent and reduce mycotoxins for compound feed manufacturing. Anim. Feed Sci. Technol. 2018, 237, 129–153. [Google Scholar] [CrossRef]
- Palade, L.M.; Dore, M.I.; Marin, D.E.; Rotar, M.C.; Taranu, I. Assessment of Food By-Products’ Potential for Simultaneous Binding of Aflatoxin B1 and Zearalenone. Toxins 2021, 13, 2. [Google Scholar] [CrossRef] [PubMed]
- Marin, D.E.; Pistol, G.C. Effect of sea buckthorn meal extract in alleviating the toxic effect of ochratoxin A and zearalenone in porcine peripheral blood mononuclear cells. Arch. Zootech. 2021, 24, 84–92. [Google Scholar] [CrossRef]
- Ahmad, M.M.; Qamar, F.; Saifi, M. Natural inhibitors: A sustainable way to combat aflatoxins. Front. Microbiol. 2022, 13, 993834. [Google Scholar] [CrossRef] [PubMed]
- Popescu, R.G.; Bulgaru, C.; Untea, A.; Vlassa, M.; Filip, M.; Hermenean, A.; Marin, D.; Țăranu, I.; Georgescu, S.E.; Dinischiotu, A. The Effectiveness of Dietary Byproduct Antioxidants on Induced CYP Genes Expression and Histological Alteration in Piglets Liver and Kidney Fed with Aflatoxin B1 and Ochratoxin, A. Toxins 2021, 13, 148. [Google Scholar] [CrossRef] [PubMed]
- Popescu, R.G.; Avramescu, S.; Marin, D.E.; Țăranu, I.; Georgescu, S.E.; Dinischiotu, A. The reduction of the combined effects of aflatoxin and ochratoxin a in piglet livers and kidneys by dietary antioxidants. Toxins 2021, 13, 648. [Google Scholar] [CrossRef] [PubMed]
- Demichev, V.; Messner, C.B.; Vernardis, S.I.; Lilley, K.S.; Ralser, M. DIA-NN: Neural networks and interference correction enable deep proteome coverage in high throughput. Nat. Methods 2020, 17, 41–44. [Google Scholar] [CrossRef]
- Liu, Y.N.; Mu, Y.D.; Wang, H.; Zhang, M.; Shi, Y.W.; Mi, G.; Peng, L.X.; Chen, J.H. Endoplasmic reticulum stress pathway mediates T-2 toxin-induced chondrocyte apoptosis. Toxicology 2021, 464, 152989. [Google Scholar] [CrossRef] [PubMed]
- Yin, S.; Liu, X.; Fan, L.; Hu, H.; Health, H. Mechanisms of cell death induction by food-borne mycotoxins. Crit. Rev. Food. Sci. Nutr. 2018, 58, 1406–1417. [Google Scholar] [CrossRef] [PubMed]
- Ohkuri, T.; Kosaka, A.; Ishibashi, K.; Kumai, T.; Hirata, Y.; Ohara, K.; Nagato, T.; Oikawa, K.; Aoki, N.; Harabuchi, Y.; et al. Intratumoral administration of cGAMP transiently accumulates potent macrophages for anti-tumor immunity at a mouse tumor site. Cancer Immunol. Immunother. 2017, 66, 705–716. [Google Scholar] [CrossRef]
- Pollutri, D.; Penzo, M. Ribosomal Protein L10: From Function to Dysfunction. Cells. 2020, 9, 2503. [Google Scholar] [CrossRef]
- Terauchi, A.; Gavin, E.; Wilson, J.; Umemori, H. Selective Inactivation of Fibroblast Growth Factor 22 (FGF22) in CA3 Pyramidal Neurons Impairs Local Synaptogenesis and Affective Behavior Without Affecting Dentate Neurogenesis. Front. Synaptic Neurosci. 2017, 9, 1–12. [Google Scholar] [CrossRef]
- Farooq, M.; Khan, A.W.; Kim, M.S.; Choi, S. The role of fibroblast growth factor (FGF) signaling in tissue repair and regeneration. Cells 2021, 10, 3242. [Google Scholar] [CrossRef]
- Ago, Y.; Otsuka, H.; Sasai, H.; Abdelkreem, E.; Nakama, M.; Aoyama, Y.; Matsumoto, H.; Fujiki, R.; Ohara, O.; Akiyama, K.; et al. Japanese patients with mitochondrial 3-hydroxy-3-methylglutaryl-CoA synthase deficiency: In vitro functional analysis of five novel HMGCS2 mutations. Exp. Ther. Med. 2020, 20, 39. [Google Scholar] [CrossRef]
- Newman, J.C.; Verdin, E. Ketone bodies as signaling metabolites. Trends Endocrinol Metab. 2014, 25, 42–52. [Google Scholar] [CrossRef] [PubMed]
- Capell-Hattam, I.M.; Fenton, N.M.; Coates, H.W.; Sharpe, L.J.; Brown, A.J. The Non Catalytic Protein ERG28 has a Functional Role in Cholesterol Synthesis and is Coregulated Transcriptionally. J. Lipid Res. 2022, 63, 100295. [Google Scholar] [CrossRef] [PubMed]
- Qin, L.; Huang, D.; Huang, J.; Qin, F.; Huang, H. Integrated Analysis and Finding Reveal Anti–Liver Cancer Targets and Mechanisms of Pachyman (Poria cocos Polysaccharides). Front. Pharmacol. 2021, 12, 742349. [Google Scholar] [CrossRef] [PubMed]
- Haller, O.; Staeheli, P.; Schwemmle, M.; Kochs, G. Mx GTPases: Dynamin-like antiviral machines of innate immunity. Trends Microbiol. 2015, 23, 154–163. [Google Scholar] [CrossRef]
- Watt, A.J.; Jones, E.A.; Ure, J.M.; Peddie, D.; Wilson, D.I.; Forrester, L.M. A gene trap integration provides an early in situ marker for hepatic specification of the foregut endoderm. Mech. Dev. 2001, 100, 205–215. [Google Scholar] [CrossRef] [PubMed]
- Deng, M.; Li, F.; Ballif, B.A.; Li, S.; Chen, X.; Guo, L.; Ye, X. Identification and functional analysis of a novel cyclin E/Cdk2 substrate ankrd17. J. Biol. Chem. 2009, 284, 7875–7888. [Google Scholar] [CrossRef]
- Uno, Y.; Morikuni, S.; Shiraishi, M.; Asano, A.; Kawaguchi, H.; Murayama, N.; Yamazaki, H. A comprehensive analysis of six forms of cytochrome P450 2C (CYP2C) in pigs. Xenobiotica 2022, 52, 963–972. [Google Scholar] [CrossRef]
- Graves, J.P.; Gruzdev, A.; Bradbury, J.A.; Degraff, L.M.; Edin, M.L.; Zeldin, D.C. Characterization of the Tissue Distribution of the Mouse Cyp2c Subfamily by Quantitative PCR Analysiss. Drug Metab. Dispos. 2017, 45, 807–816. [Google Scholar] [CrossRef]
- Lacombe, J.; Ferron, M. VKORC1L1, an enzyme mediating the effect of vitamin K in liver and extrahepatic tissues. Nutrients 2018, 10, 970. [Google Scholar] [CrossRef]
- Wallin, R.; Hutson, S. Vitamin K-dependent carboxylation. Evidence that at least two microsomal dehydrogenases reduce vitamin K1 to support carboxylation. J. Biol. Chem. 1982, 257, 1583–1586. [Google Scholar] [CrossRef]
- Dorji, J.; MacLeod, I.M.; Chamberlain, A.J.; Vander Jagt, C.J.; Ho, P.N.; Khansefid, M.; Mason, B.A.; Prowse-Wilkins, C.P.; Marett, L.C.; Wales, W.J.; et al. Mitochondrial protein gene expression and the oxidative phosphorylation pathway associated with feed efficiency and energy balance in dairy cattle. J. Dairy Sci. 2021, 104, 575–587. [Google Scholar] [CrossRef]
- Bottje, W.; Pumford, N.R.; Ojano-Dirain, C.; Iqbal, M.; Lassiter, K. Feed efficiency and mitochondrial function. Poult. Sci. 2006, 85, 8–14. [Google Scholar] [CrossRef] [PubMed]
- Keogh, K.; McKenna, C.; Porter, R.K.; Waters, S.M.; Kenny, D.A. Effect of dietary restriction and subsequent realimentation on hepatic oxidative phosphorylation in cattle. Animal 2021, 15, 100009. [Google Scholar] [CrossRef] [PubMed]
- Gallud, A.; Klöditz, K.; Ytterberg, J.; Östberg, N.; Katayama, S.; Skoog, T.; Gogvadze, V.; Chen, Y.Z.; Xue, D.; Moya, S.; et al. Cationic gold nanoparticles elicit mitochondrial dysfunction: A multi-omics study. Sci. Rep. 2019, 9, 4366. [Google Scholar] [CrossRef] [PubMed]
- Perez-Gomez, R.; Magnin, V.; Mihajlovic, Z.; Slaninova, V.; Krejci, A. Downregulation of respiratory complex I mediates major signalling changes triggered by TOR activation. Sci. Rep. 2020, 10, 4401. [Google Scholar] [CrossRef]
- Echeverri Ruiz, N.P.; Mohan, V.; Wu, J.; Scott, S.; Kreamer, M.; Benej, M.; Golias, T.; Papandreou, I.; Denko, N.C. Dynamic regulation of mitochondrial pyruvate metabolism is necessary for orthotopic pancreatic tumor growth. Cancer Metab. 2021, 9, 39. [Google Scholar] [CrossRef]
- Martínez-Reyes, I.; Chandel, N.S. Mitochondrial TCA cycle metabolites control physiology and disease. Nat. Commun. 2020, 11, 102. [Google Scholar] [CrossRef]
- Zhao, R.Z.; Jiang, S.; Zhang, L.; Yu, Z. Bin Mitochondrial electron transport chain, ROS generation and uncoupling (Review). Int. J. Mol. Med. 2019, 44, 3–15. [Google Scholar] [CrossRef]
- Grimm, S. Respiratory chain complex II as general sensor for apoptosis. Biochim. Biophys. Acta Bioenerg. 2013, 1827, 565–572. [Google Scholar] [CrossRef]
- Luo, Y.; Ma, J.; Lu, W. The significance of mitochondrial dysfunction in cancer. Int. J. Mol. Sci. 2020, 21, 5598. [Google Scholar] [CrossRef]
- Silva-Marrero, J.I.; Sáez, A.; Caballero-Solares, A.; Viegas, I.; Almajano, M.P.; Fernández, F.; Baanante, I.V.; Metón, I. A transcriptomic approach to study the effect of long-term starvation and diet composition on the expression of mitochondrial oxidative phosphorylation genes in gilthead sea bream (Sparus aurata). BMC Genom. 2017, 18, 768. [Google Scholar] [CrossRef]
- Garćıa-Bartolomé, A.; Peñas, A.; Maŕın-Buera, L.; Lobo-Jarne, T.; Pérez-Pérez, R.; Morán, M.; Arenas, J.; Martín, M.A.; Ugalde, C. Respiratory chain enzyme deficiency induces mitochondrial location of actin-binding gelsolin to modulate the oligomerization of VDAC complexes and cell survival. Hum. Mol. Genet. 2017, 26, 2493–2506. [Google Scholar] [CrossRef] [PubMed]
- Lesner, N.P.; Wang, X.; Chen, Z.; Frank, A.; Menezes, C.; House, S.; Shelton, S.D.; Lemoff, A.; McFadden, D.G.; Wansapura, J.; et al. Differential requirements for mitochondrial electron transport chain components in the adult murine liver. Elife 2022, 11, e80919. [Google Scholar] [CrossRef] [PubMed]
- Wang, X.; Lv, W.; Xu, J.; Zheng, A.; Zeng, M.; Cao, K.; Wang, X.; Cui, Y.; Li, H.; Yang, M.; et al. Hepatic Suppression of Mitochondrial Complex II Assembly Drives Systemic Metabolic Benefits. Adv. Sci. 2022, 9, 2105587. [Google Scholar] [CrossRef] [PubMed]
- Uchenunu, O.; Zhdanov, A.V.; Hutton, P.; Jovanovic, P.; Wang, Y.; Andreev, D.E.; Hulea, L.; Papadopoli, D.J.; Avizonis, D.; Baranov, P.V.; et al. Mitochondrial complex IV defects induce metabolic and signaling perturbations that expose potential vulnerabilities in HCT116 cells. FEBS Open Bio 2022, 12, 959–982. [Google Scholar] [CrossRef]
- Hara, Y.; Kume, S.; Kataoka, Y.; Watanabe, N. Changes in TCA cycle and TCA cycle-related metabolites in plasma upon citric acid administration in rats. Heliyon 2021, 7, e08501. [Google Scholar] [CrossRef]
- Ma, X.; Yu, M.; Liu, Z.; Deng, D.; Cui, Y.; Tian, Z.; Wang, G. Effect of amino acids and their derivatives on meat quality of finishing pigs. J. Food Sci. Technol. 2020, 57, 404–412. [Google Scholar] [CrossRef]
- Wu, Y.; Zhang, X.; Wang, Z.; Zheng, W.; Cao, H.; Shen, W. Targeting oxidative phosphorylation as an approach for the treatment of ovarian cancer. Front. Oncol. 2022, 12, 971479. [Google Scholar] [CrossRef]
- Hayek, S.R.; Rane, H.S.; Parra, K.J. Reciprocal regulation of V-ATPase and glycolytic pathway elements in health and disease. Front. Physiol. 2019, 10, 127. [Google Scholar] [CrossRef]
- Zaytseva, Y.Y.; Harris, J.W.; Mitov, M.I.; Kim, J.T.; Allan Butterfield, D.; Lee, E.Y.; Weiss, H.L.; Gao, T.; Mark Evers, B. Increased expression of fatty acid synthase provides a survival advantage to colorectal cancer cells via upregulation of cellular respiration. Oncotarget 2015, 6, 18891–18904. [Google Scholar] [CrossRef]
- Abdelrahman, R.E.; Khalaf, A.A.A.; Elhady, M.A.; Ibrahim, M.A.; Hassanen, E.I.; Noshy, P.A. Quercetin ameliorates ochratoxin A-Induced immunotoxicity in broiler chickens by modulation of PI3K/AKT pathway. Chem. Biol. Interact. 2022, 351, 109720. [Google Scholar] [CrossRef]
- Yang, M.; Ma, F.; Guan, M. Role of steroid hormones in the pathogenesis of nonalcoholic fatty liver disease. Metabolites 2021, 11, 320. [Google Scholar] [CrossRef]
- Manna, P.R.; Stetson, C.L.; Daugherty, C.; Shimizu, I.; Syapin, P.J.; Garrel, G.; Cohen-Tannoudji, J.; Huhtaniemi, I.; Slominski, A.T.; Pruitt, K.; et al. Up-regulation of steroid biosynthesis by retinoid signaling: Implications for aging. Mech. Ageing Dev. 2015, 150, 74–82. [Google Scholar] [CrossRef] [PubMed]
- Lee, J.M.; Lee, H.; Kang, S.B.; Park, W.J. Fatty acid desaturases, polyunsaturated fatty acid regulation, and biotechnological advances. Nutrients 2016, 8, 23. [Google Scholar] [CrossRef]
- Tanaka, T.; Morishige, J.I.; Iwawaki, D.; Fukuhara, T.; Hamamura, N.; Hirano, K.; Osumi, T.; Satouchi, K. Metabolic pathway that produces essential fatty acids from polymethylene-interrupted polyunsaturated fatty acids in animal cells. FEBS J. 2007, 274, 2728–2737. [Google Scholar] [CrossRef] [PubMed]
- Gol, S.; González-Prendes, R.; Bosch, L.; Tor, M.; Reixach, J.; Pena, R.N.; Estany, J. Linoleic acid metabolic pathway allows for an efficient increase of intramuscular fat content in pigs. J. Anim. Sci. Biotechnol. 2019, 10, 33. [Google Scholar] [CrossRef]
- Mitchell, S.C.; Nickson, R.M. Metabolism of Sulfur-Containing Xenobiotics. Sulfur Rep. 1993, 13, 161–189. [Google Scholar] [CrossRef]
- Fujii, J.; Homma, T.; Osaki, T. Superoxide Radicals in the Execution of Cell Death. Antioxidants 2022, 11, 501. [Google Scholar] [CrossRef]
- Moriwaki, T.; Yoshimura, A.; Tamari, Y.; Sasanuma, H.; Takeda, S.; Seki, M.; Tano, K. PRDX1 is essential for the viability and maintenance of reactive oxygen species in chicken DT40. Genes Environ. 2021, 43, 35. [Google Scholar] [CrossRef] [PubMed]
- Wandinger-Ness, A.; Zerial, M. Rab proteins and the compartmentalization of the endosomal system. Cold Spring Harb. Perspect. Biol. 2014, 6, a022616. [Google Scholar] [CrossRef]
- Irons, J.L.; Hodge-Hanson, K.; Downs, D.M. RidA Proteins Protect against Metabolic Damage by Reactive Intermediates. Microbiol. Mol. Biol. Rev. 2020, 84, e00024-20. [Google Scholar] [CrossRef]
- Van Rahden, V.A.; Fernandez-Vizarra, E.; Alawi, M.; Brand, K.; Fellmann, F.; Horn, D.; Zeviani, M.; Kutsche, K. Mutations in NDUFB11, encoding a complex i component of the mitochondrial respiratory chain, cause microphthalmia with linear skin defects syndrome. Am. J. Hum. Genet. 2015, 96, 640–650. [Google Scholar] [CrossRef]
- Lee, K.W.; Bogenhagen, D.F. Assignment of 2′-O-methyltransferases to modification sites on the mammalian mitochondrial large subunit 16 S ribosomal RNA (rRNA). J. Biol. Chem. 2014, 289, 24936–24942. [Google Scholar] [CrossRef] [PubMed]
- Chen, H.; Zhao, X.; Li, Y.; Zhang, S.; Wang, Y.; Wang, L.; Ma, W. High Expression of TMEM33 Predicts Poor Prognosis and Promotes Cell Proliferation in Cervical Cancer. Front. Genet. 2022, 13, 908807. [Google Scholar] [CrossRef]
- Varghese, P.M.; Murugaiah, V.; Beirag, N.; Temperton, N.; Khan, H.A.; Alrokayan, S.H.; Al-Ahdal, M.N.; Nal, B.; Al-Mohanna, F.A.; Sim, R.B.; et al. C4b Binding Protein Acts as an Innate Immune Effector Against Influenza A Virus. Front. Immunol. 2021, 11, 585361. [Google Scholar] [CrossRef]
- Festing, S.; Wilkinson, R. The ethics of animal research. Talking Point on the use of animals in scientific research. EMBO Rep. 2007, 8, 526–530. [Google Scholar] [CrossRef]
- Rasmussen, M.K.; Ekstrand, B.; Zamaratskaia, G. Comparison of cytochrome P450 concentrations and metabolic activities in porcine hepatic microsomes prepared with two different methods. Toxicol. Vitr. 2011, 25, 343–346. [Google Scholar] [CrossRef]
- Bradford, M.M. A rapid and sensitive for the quantitation of microgram quantities of protein utilizing the principle of protein-dye binding. Anal. Biochem. 1976, 72, 248–254. [Google Scholar] [CrossRef]
- Perez-Riverol, Y.; Bai, J.; Bandla, C.; García-Seisdedos, D.; Hewapathirana, S.; Kamatchinathan, S.; Kundu, D.J.; Prakash, A.; Frericks-Zipper, A.; Eisenacher, M.; et al. The PRIDE database resources in 2022: A hub for mass spectrometry-based proteomics evidences. Nucleic Acids Res. 2022, 50, D543–D552. [Google Scholar] [CrossRef] [PubMed]
- Schwämmle, V.; Hagensen, C.E.; Rogowska-Wrzesinska, A.; Jensen, O.N. PolySTest: Robust statistical testing of proteomics data with missing values improves detection of biologically relevant features. Mol. Cell. Proteom. 2020, 19, 1396–1408. [Google Scholar] [CrossRef] [PubMed]
- Carlson, M. org.Ss.eg.db: Genome wide annotation for Pig, R package Version 3.8.2.; Bioconductor: Boston, MA, USA, 2019. [CrossRef]
- Ulgen, E.; Ozisik, O.; Sezerman, O.U. PathfindR: An R package for comprehensive identification of enriched pathways in omics data through active subnetworks. Front. Genet. 2019, 10, 858. [Google Scholar] [CrossRef] [PubMed]
- Luo, W.; Brouwer, C. Pathview: An R/Bioconductor package for pathway-based data integration and visualization. Bioinformatics 2013, 29, 1830–1831. [Google Scholar] [CrossRef] [PubMed]


| ID | Term Description | FE | Lowest p | Highest p | Up_Regulated | Down_Regulated |
|---|---|---|---|---|---|---|
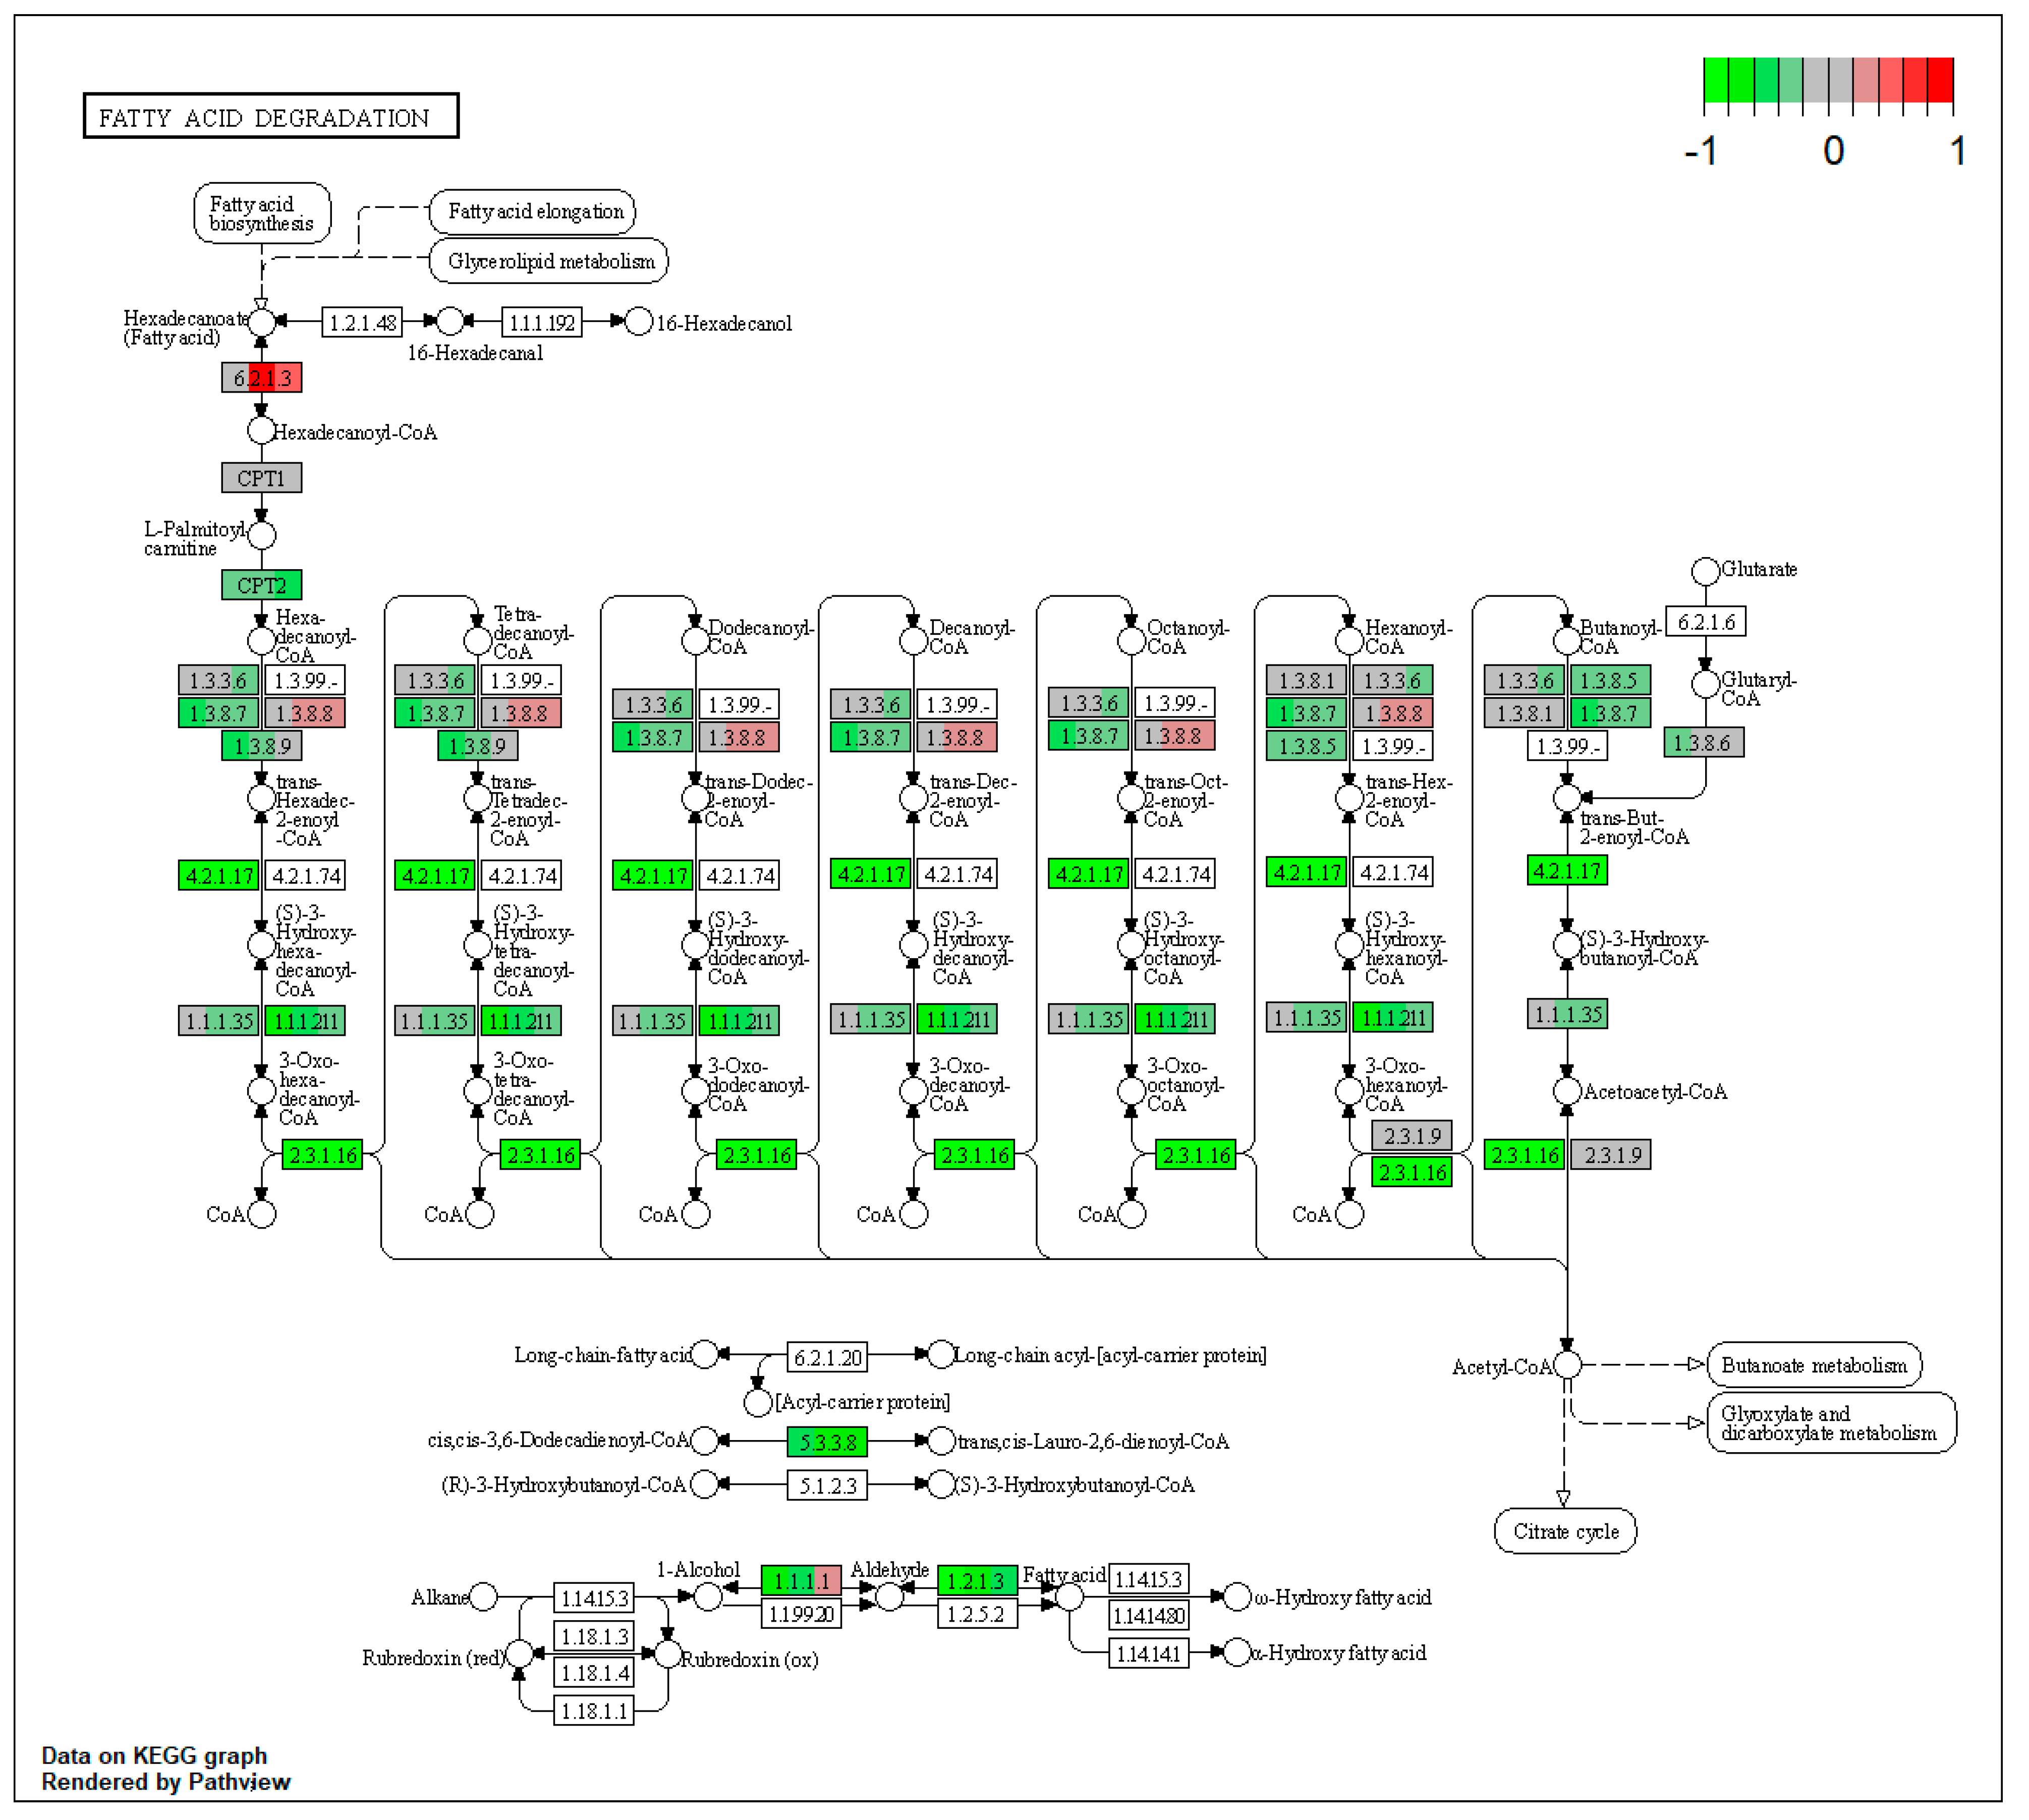
| ssc00071 | Fatty acid degradation | 11.4448 | 2.68 × 10⁻¹⁸ | 5.84 × 10⁻¹⁶ | ALDH3A2 | ACAT2, ACAA1, EHHADH, ACOX1, ACADM, ACADSB, ACADVL, ACSL1, ECI2, ALDH7A1 |
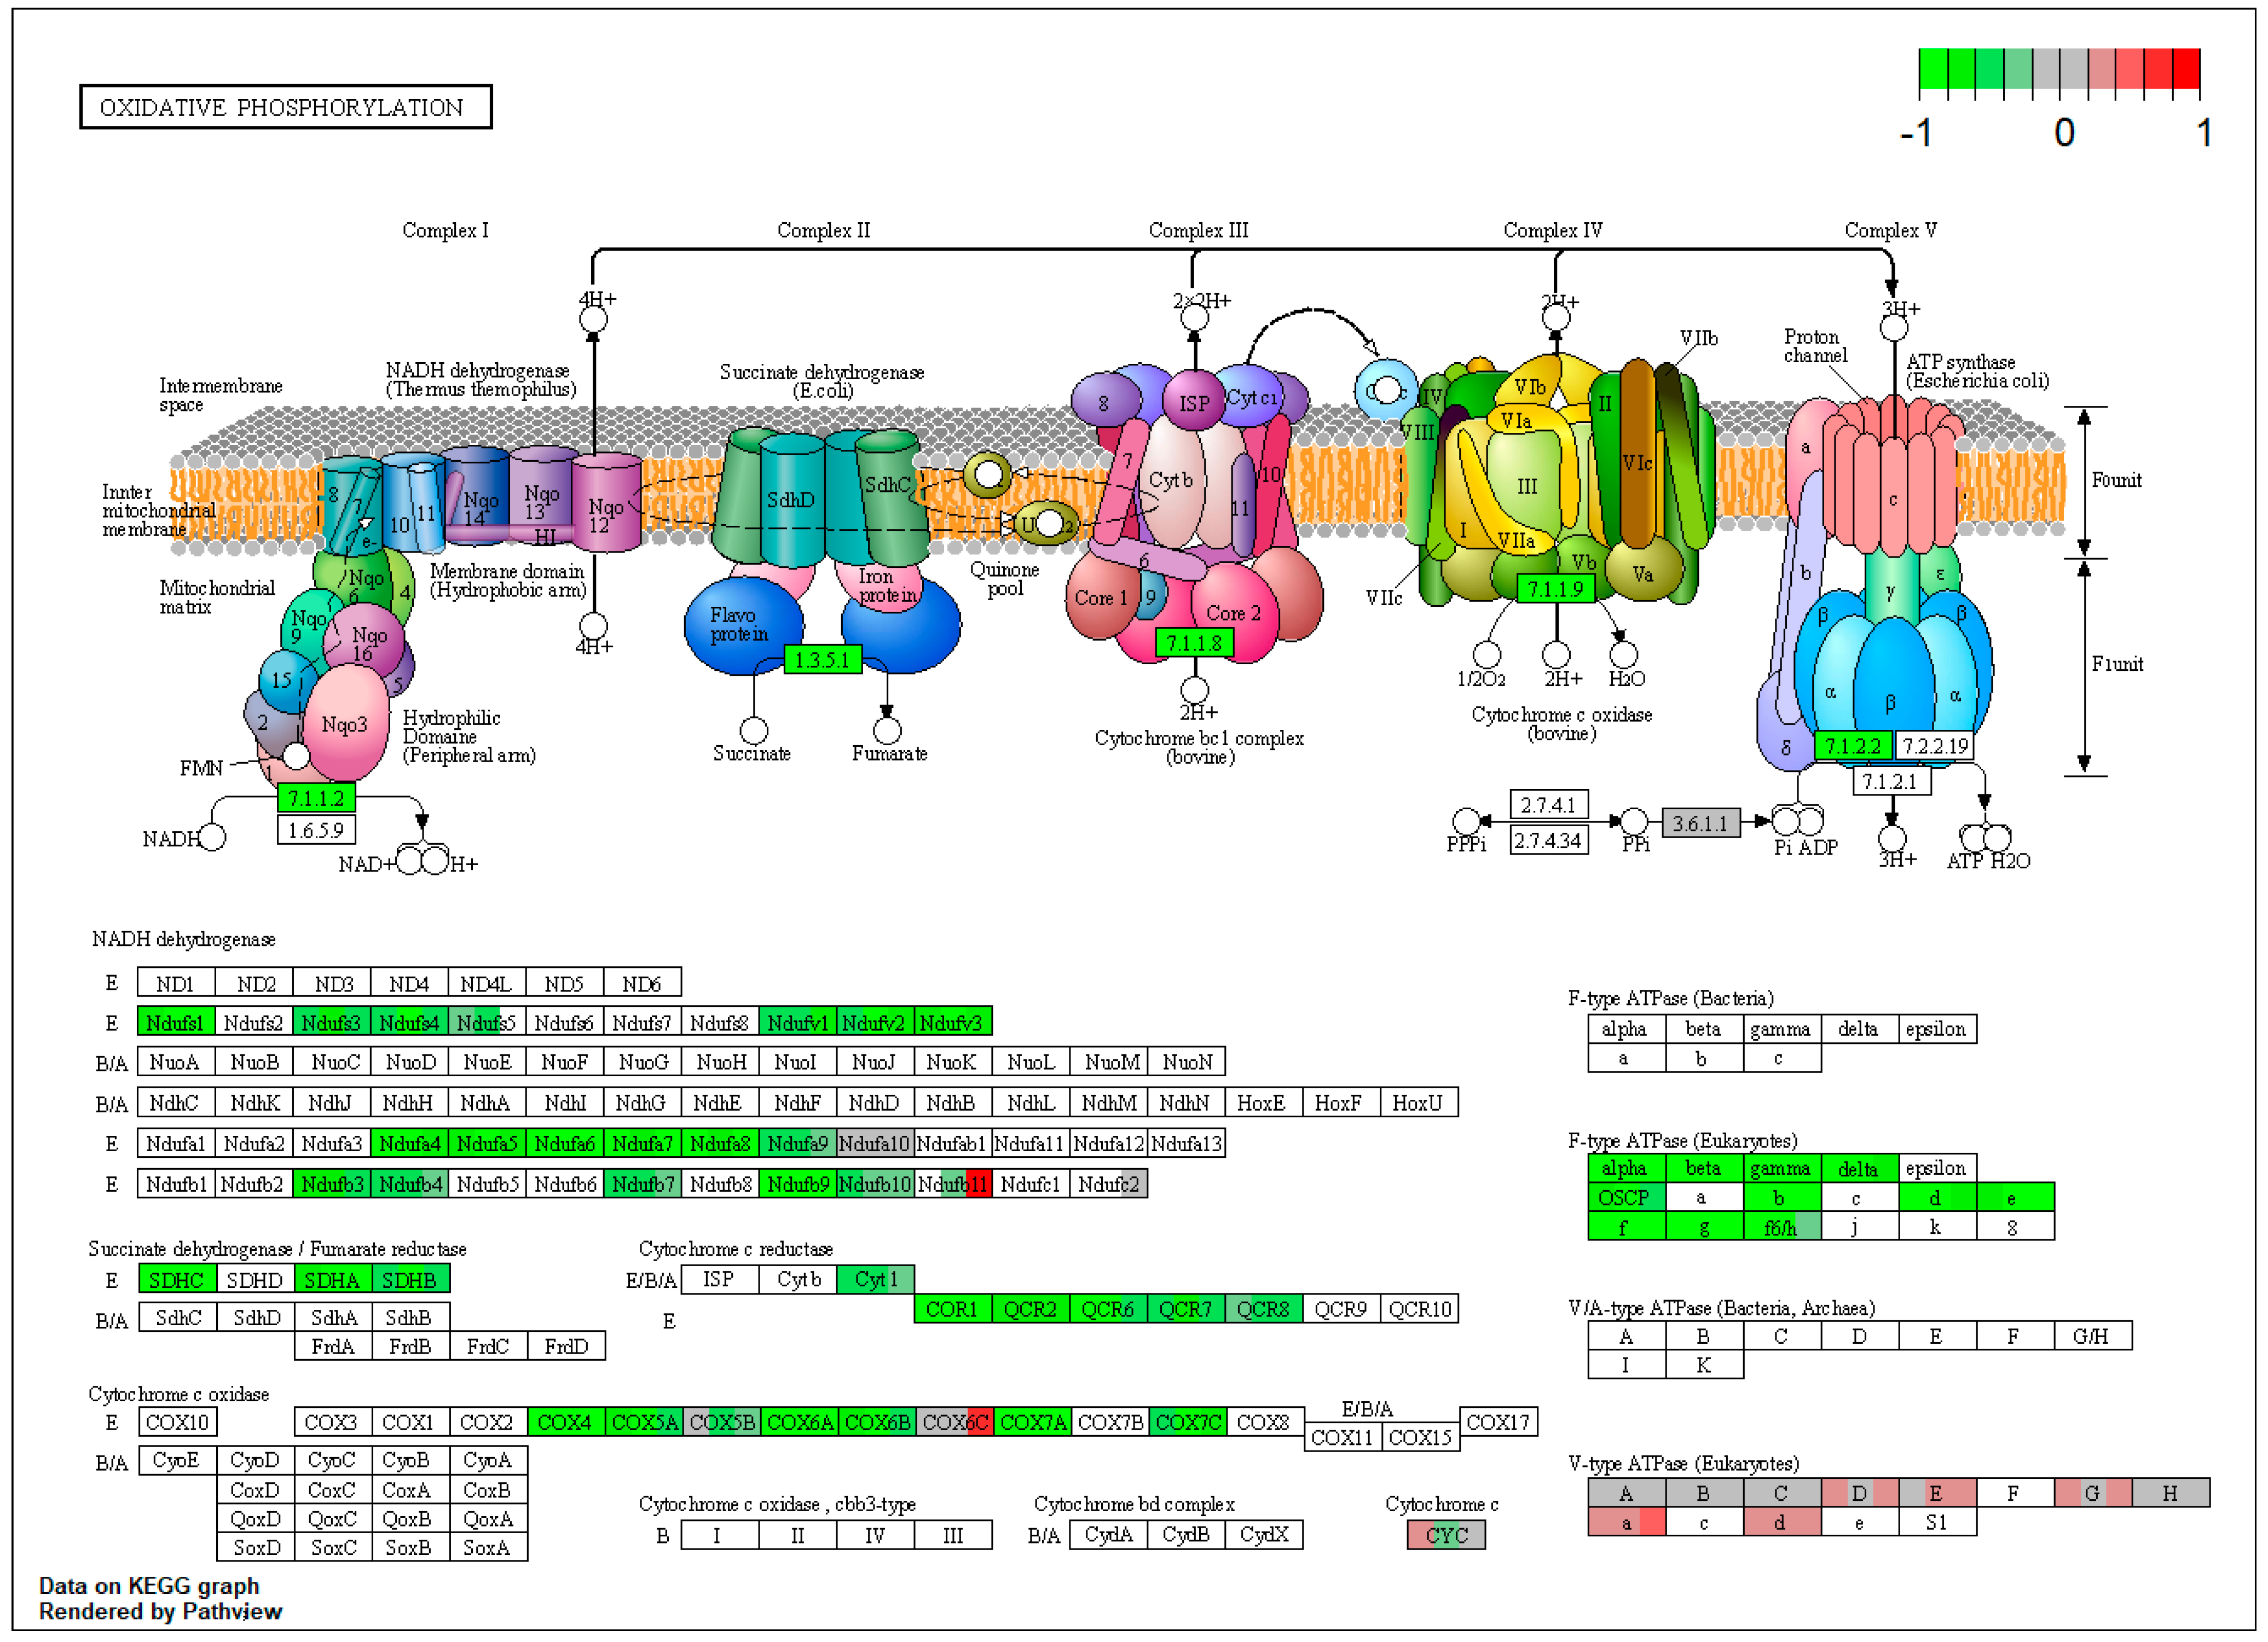
| ssc00190 | Oxidative phosphorylation | 7.179012 | 1.45 × 10⁻¹⁶ | 1.45 × 10⁻¹⁶ | ATP6V0D1 | NDUFS1, NDUFS4, NDUFV1, NDUFA4, NDUFA6, NDUFA9, NDUFB7, NDUFB10, SDHA, SDHB, SDHC |
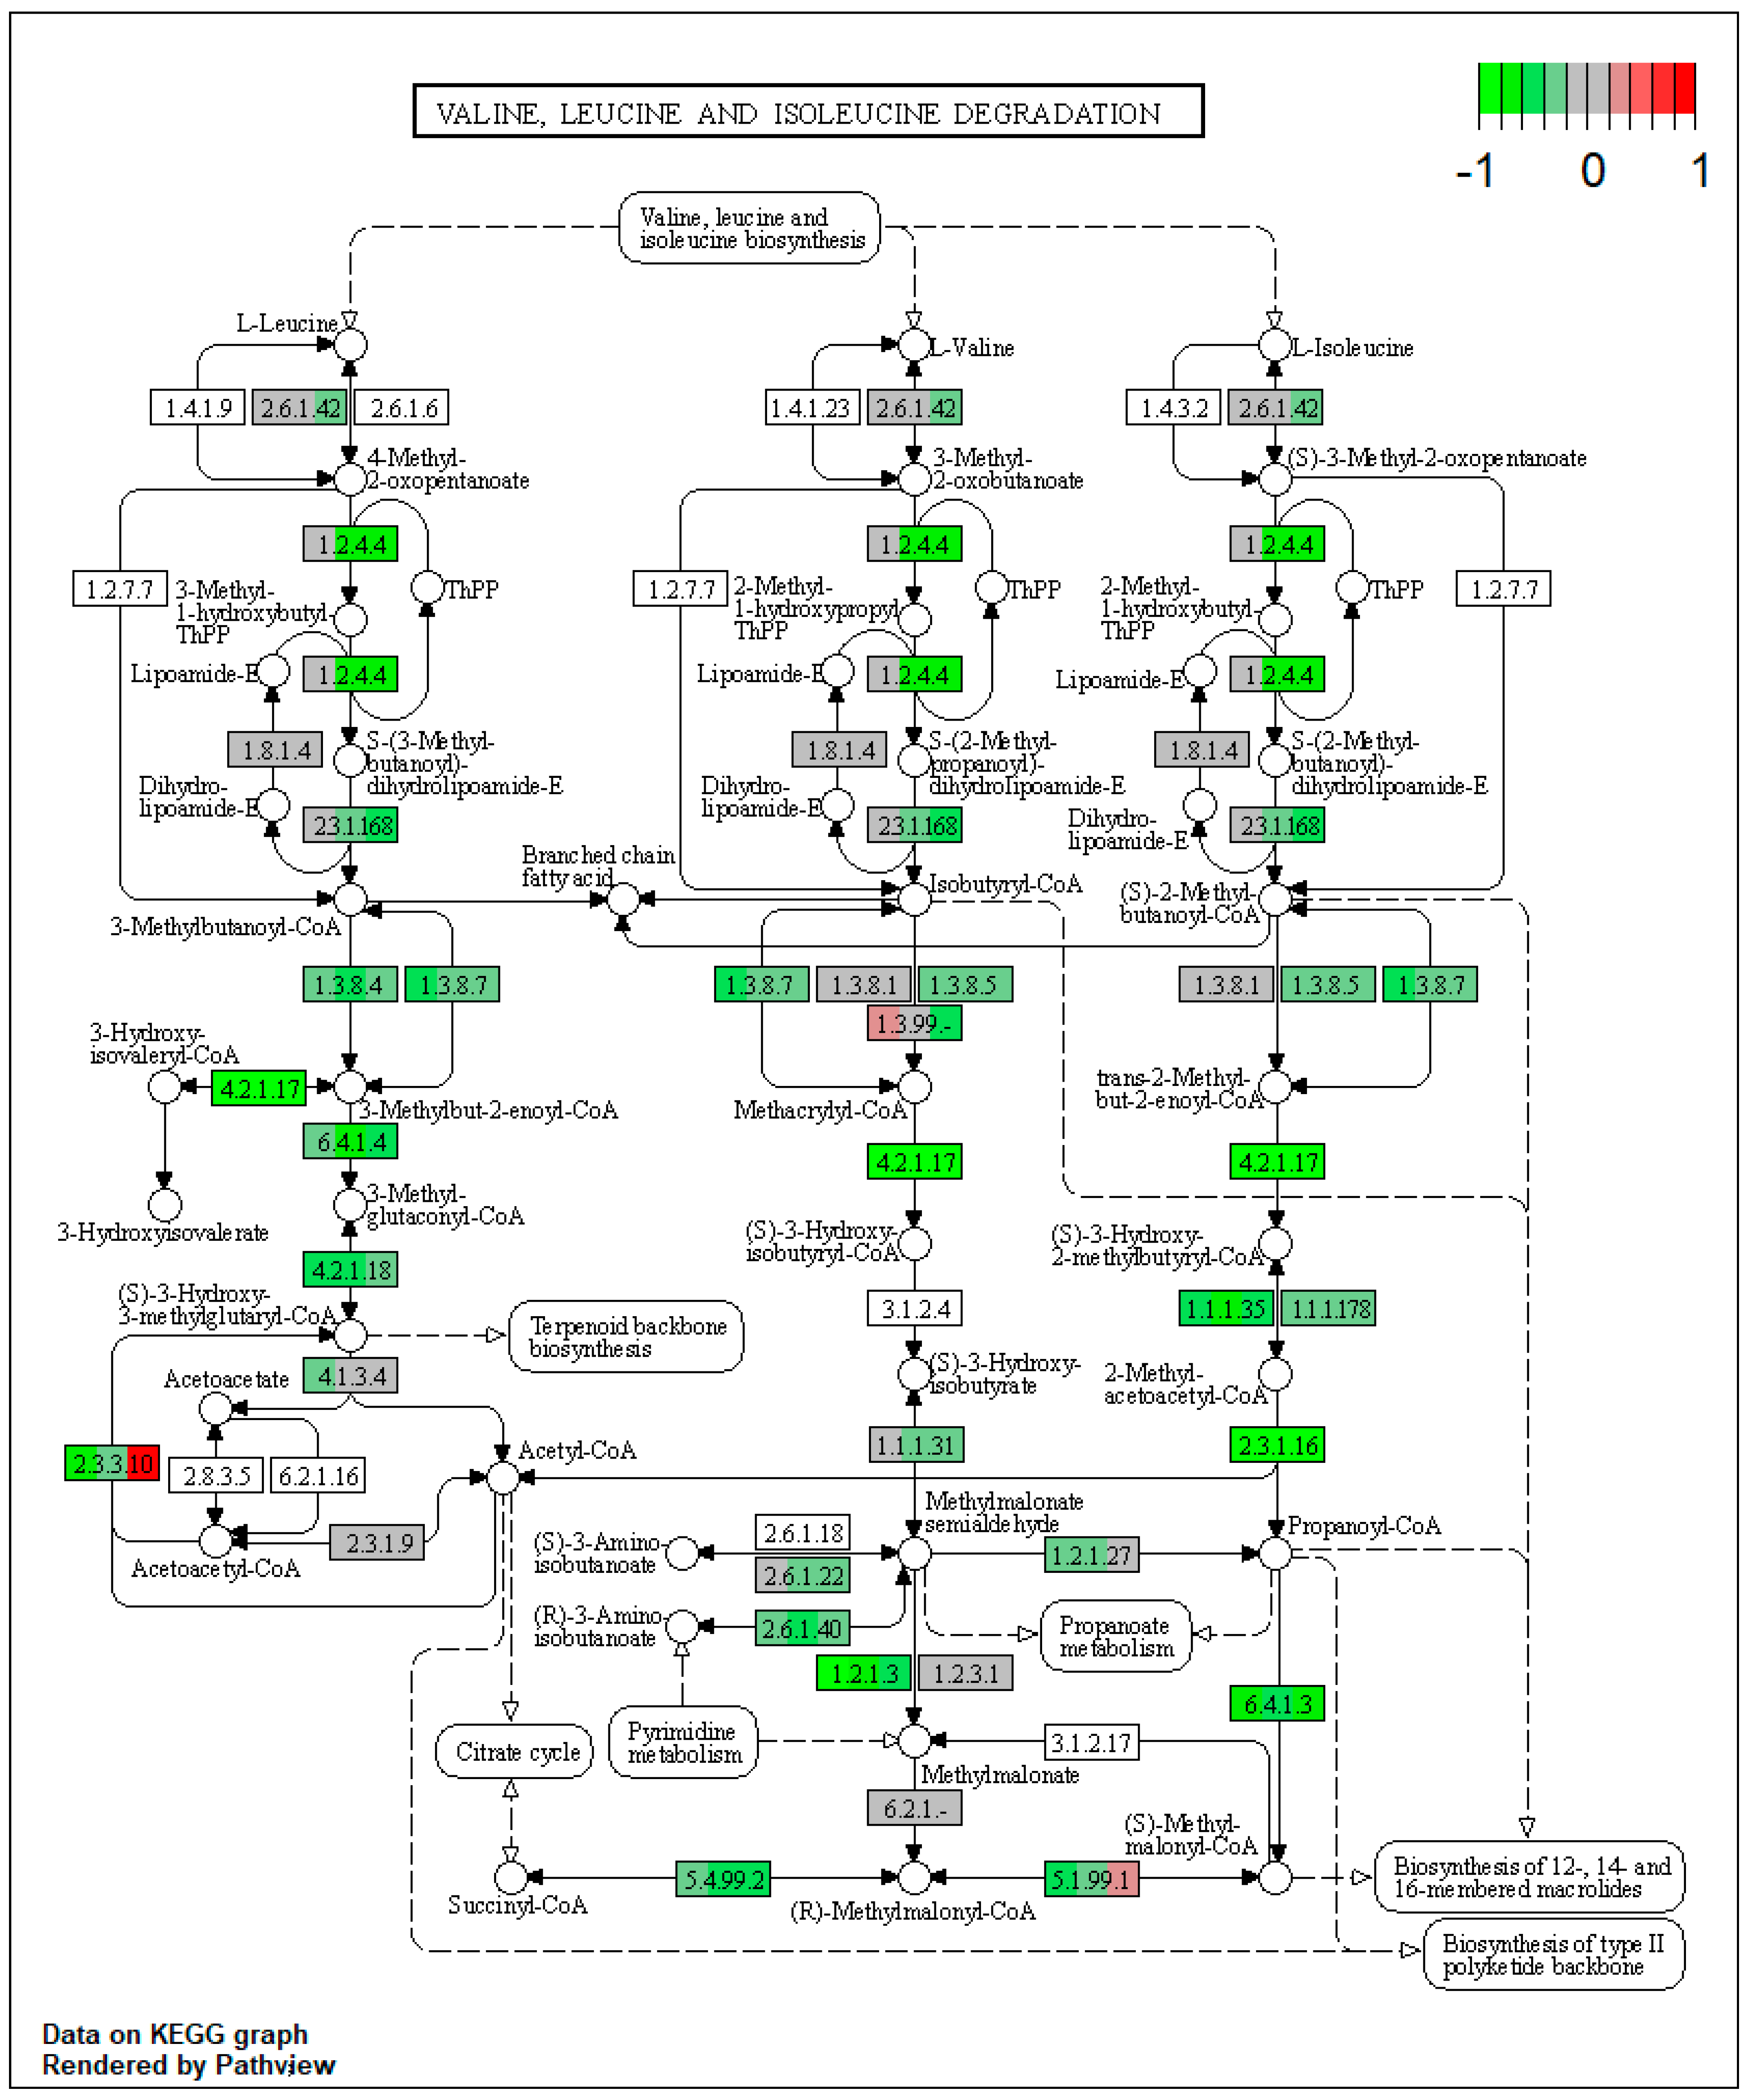
| ssc00280 | Valine, leucine, and isoleucine degradation | 9.076912 | 7.10 × 10⁻¹⁵ | 1.34 × 10⁻¹⁴ | ALDH3A2 | ACADM, ACADSB, EHHADH, ACAA1, PCCA, ALDH6A1, ALDH7A1, AUH, HMGCL, ACAT2 |
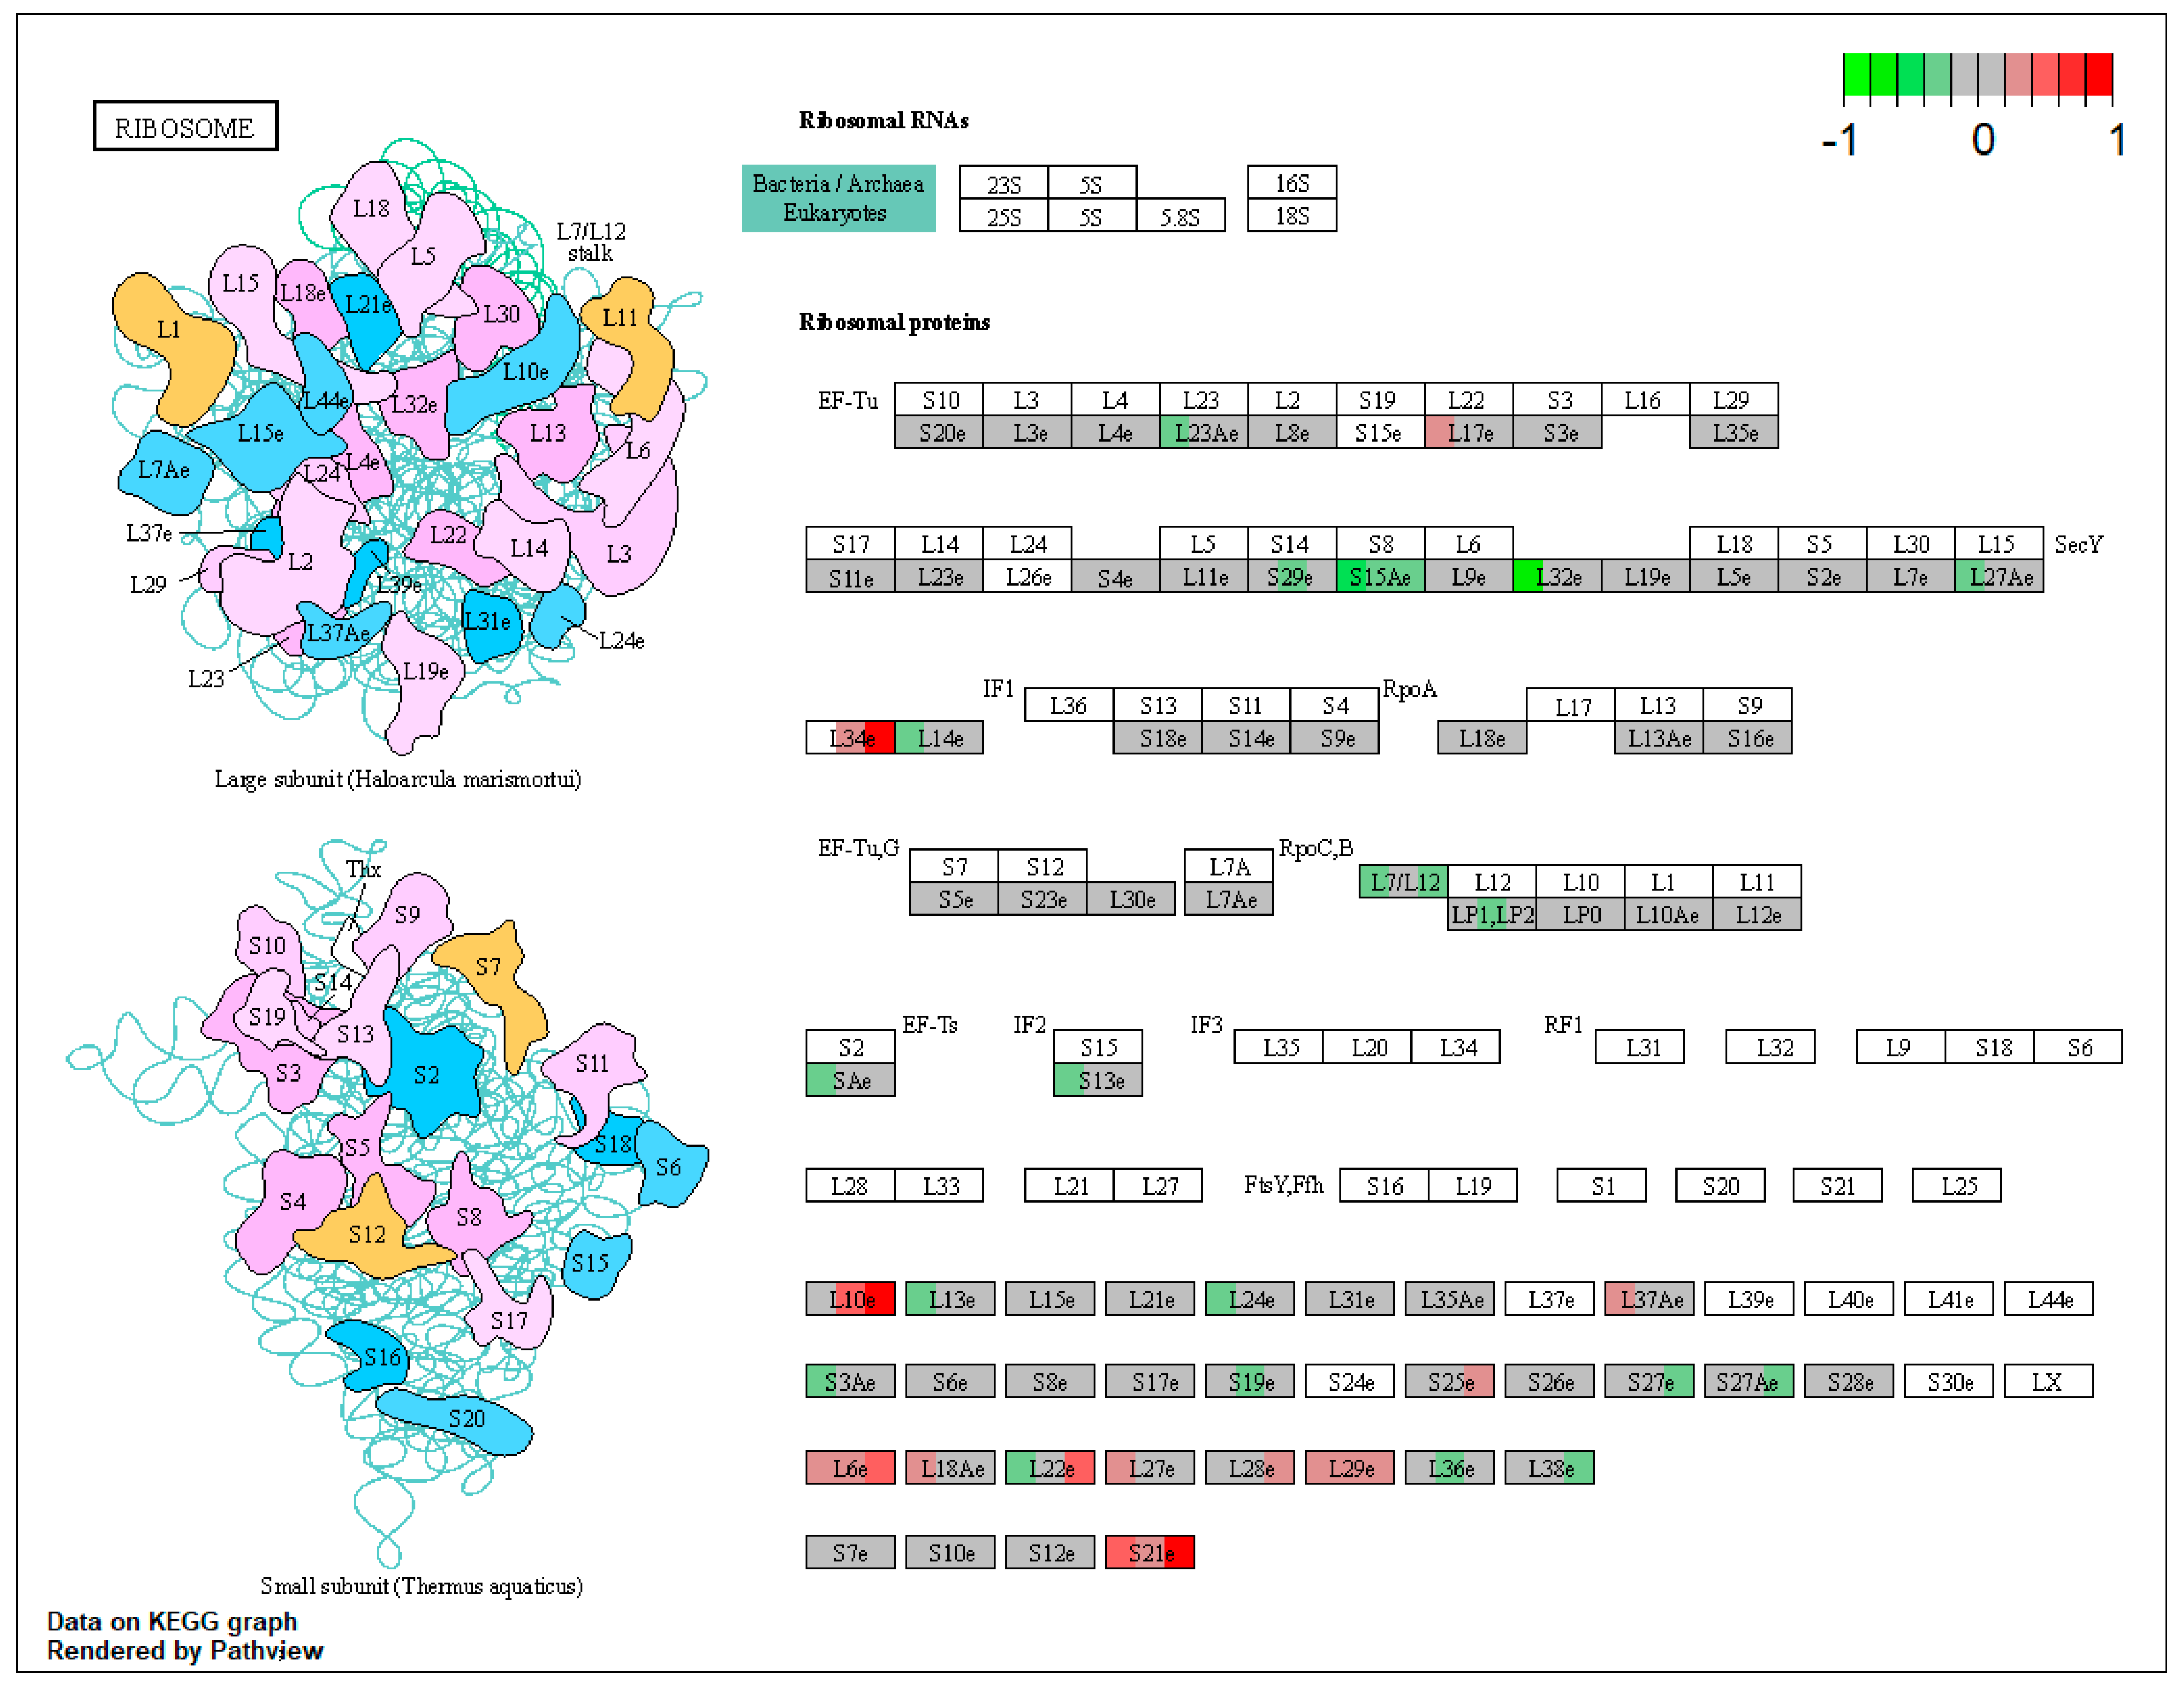
| ssc03010 | Ribosome | 5.317787 | 6.60 × 10⁻¹⁴ | 1.25 × 10⁻¹³ | RPS7, RPS19, RPL29 | RPS3, RPS3A, RPS5, RPS13, RPL27A |
| ssc00020 | Citrate cycle (TCA cycle) | 9.97085 | 2.89 × 10⁻¹³ | 7.94 × 10⁻¹³ | DLST | IDH2, IDH1, SUCLG1, SDHA, SDHB, SDHC, FH, PC, PCK2 |
| ssc05208 | Chemical carcinogenesis—reactive oxygen species | 4.661696 | 3.90 × 10⁻¹³ | 3.90 × 10⁻¹³ | NDUFV1, NDUFA4, NDUFA6, NDUFA9, NDUFB7, NDUFB10, NDUFS1, NDUFS4, SDHA, SDHB, SDHC, VDAC2, SLC25A4, SOD1, CAT | |
| ssc04714 | Thermogenesis | 3.34506 | 3.45 × 10⁻¹² | 3.45 × 10⁻¹² | ACSL1, NDUFS1, NDUFS4, NDUFV1, NDUFA4, NDUFA6, NDUFA9, NDUFB7, NDUFB10, SDHA, SDHB, SDHC, SLC25A20 | |
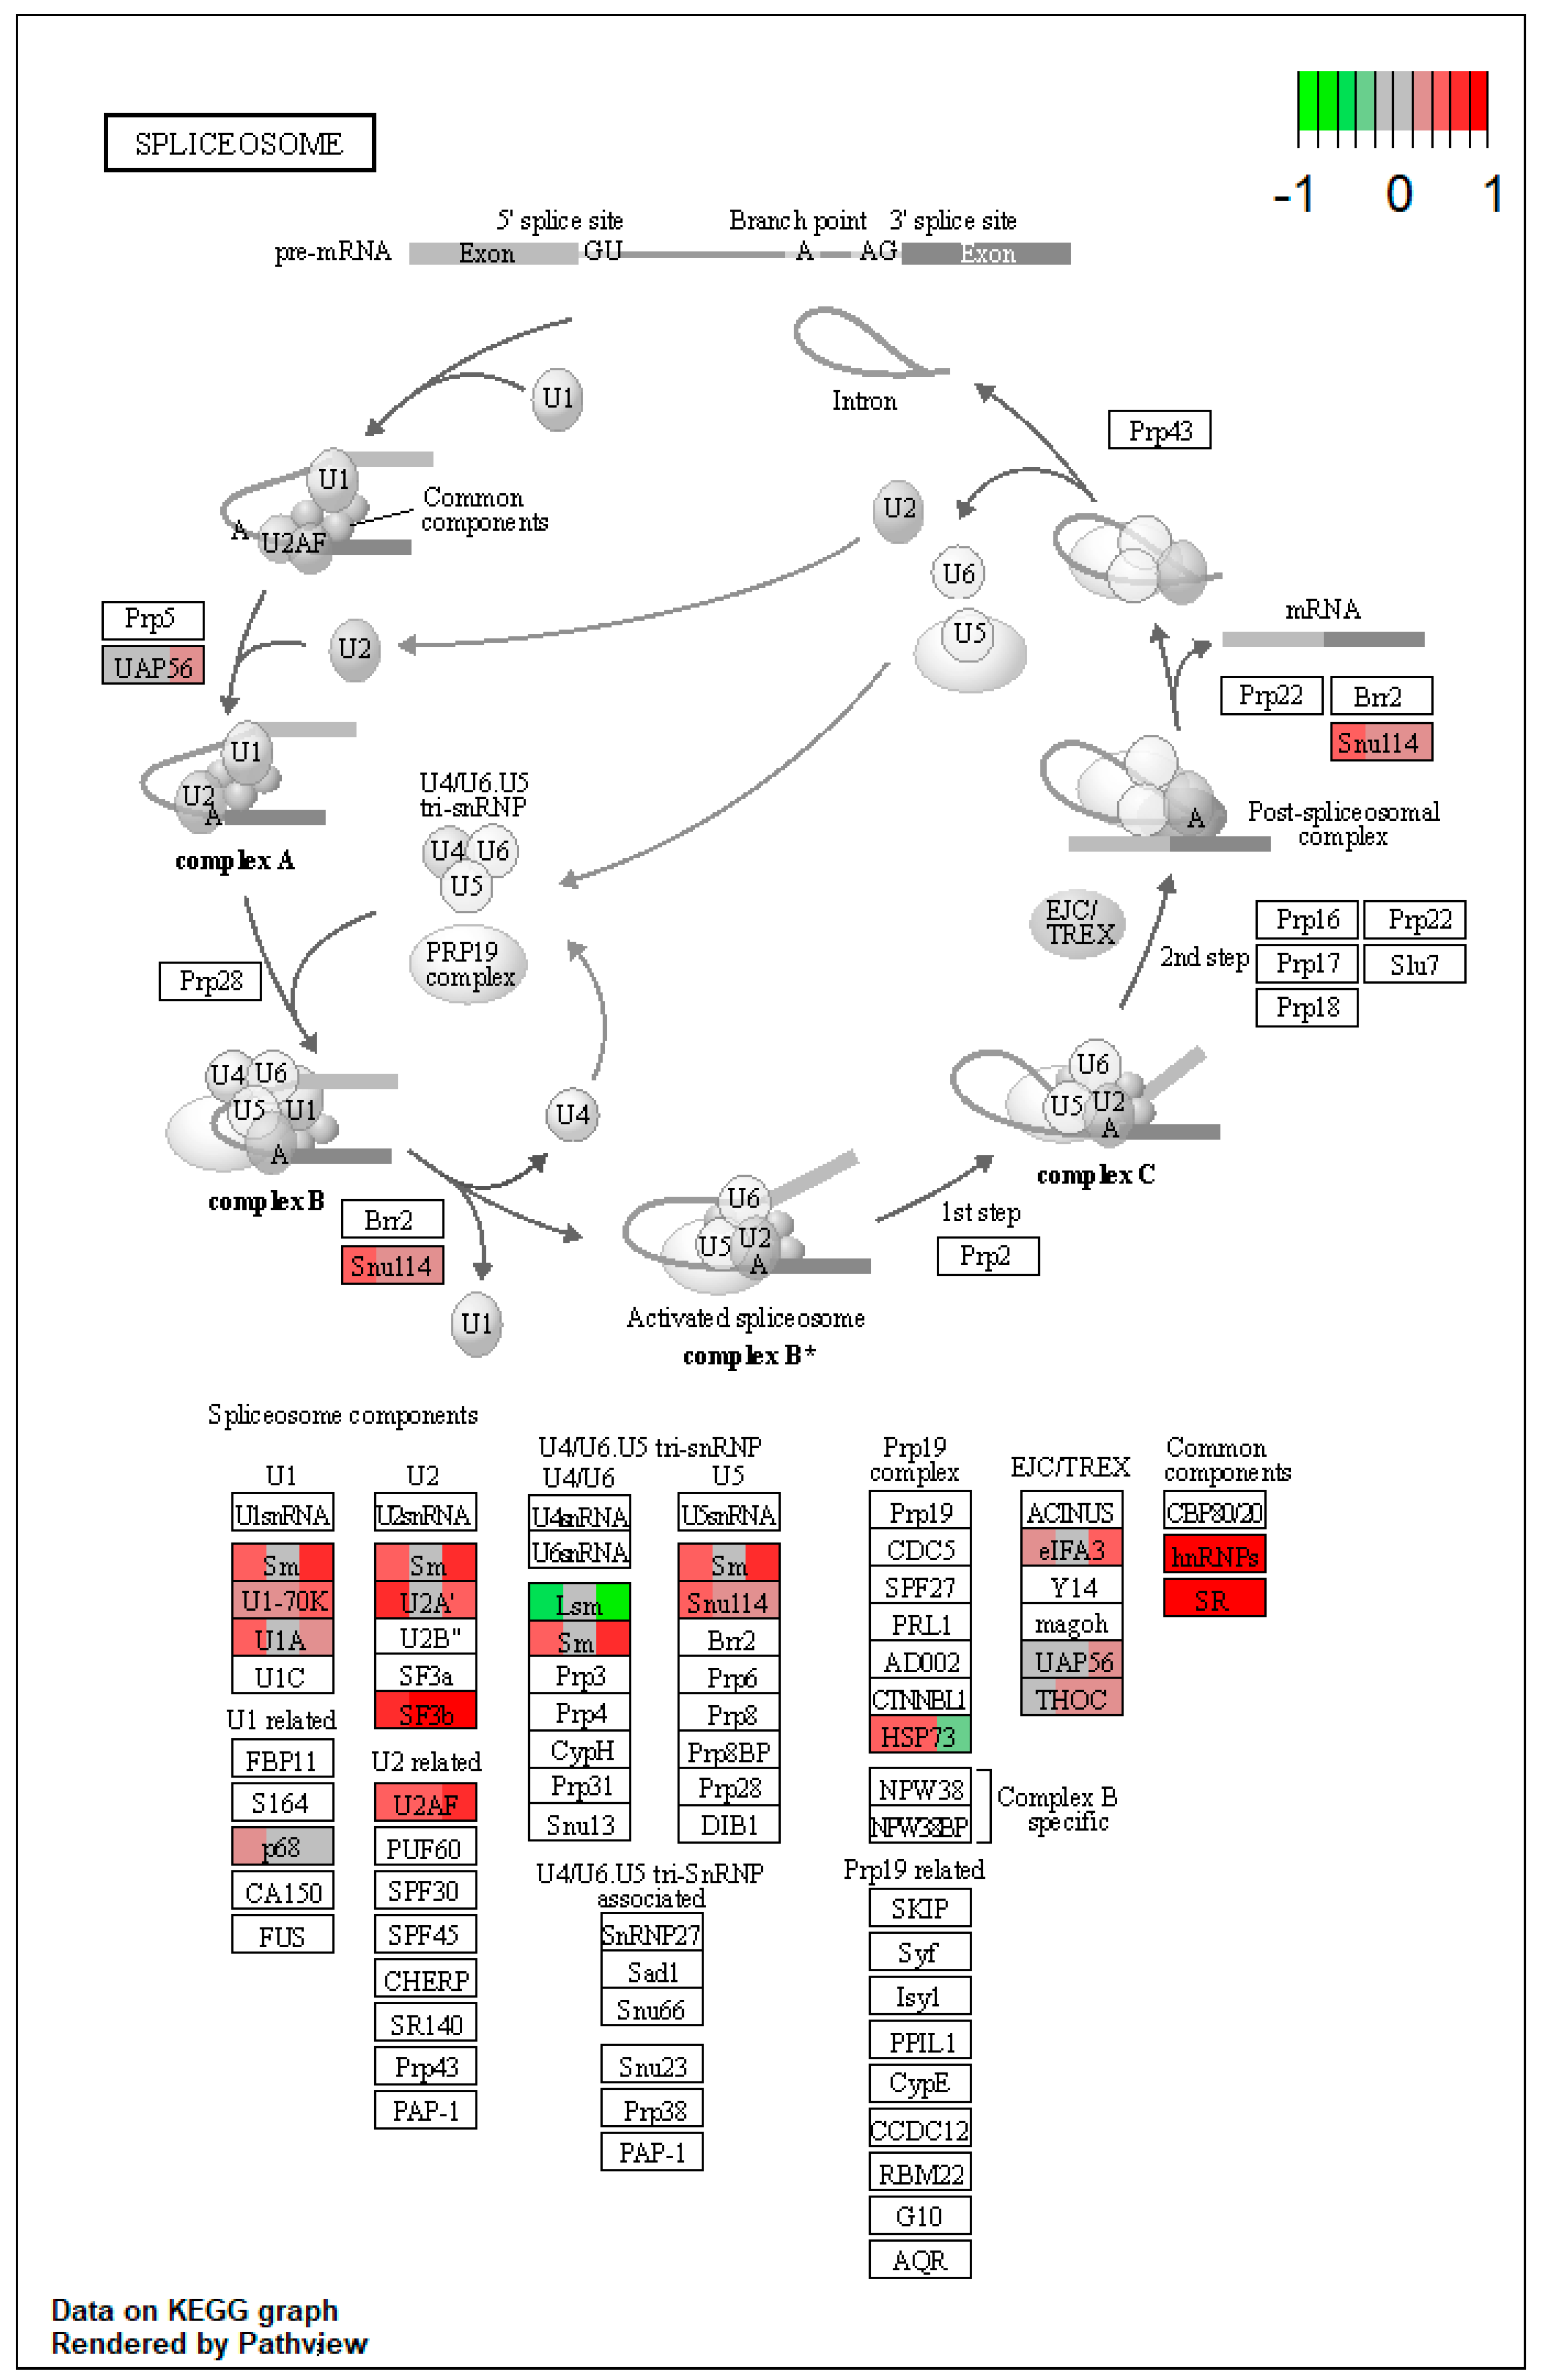
| ssc03040 | Spliceosome | 1.966853 | 1.33 × 10⁻⁹ | 1.33 × 10⁻⁹ | SNRPA, HNRNPM, SRSF1, SRSF3, SRSF7 | LSM8 |
| ssc00650 | Butanoate metabolism | 8.973765 | 3.08 × 10⁻⁹ | 0.005032 | ACAT2, EHHADH, ACSM4, ALDH5A1, HMGCL, BDH1 | |
| ssc00640 | Propanoate metabolism | 8.973765 | 6.16 × 10⁻⁹ | 6.16 × 10⁻⁹ | ECHDC1 | ACOX1, EHHADH, PCCA, SUCLG1, ALDH6A1 |
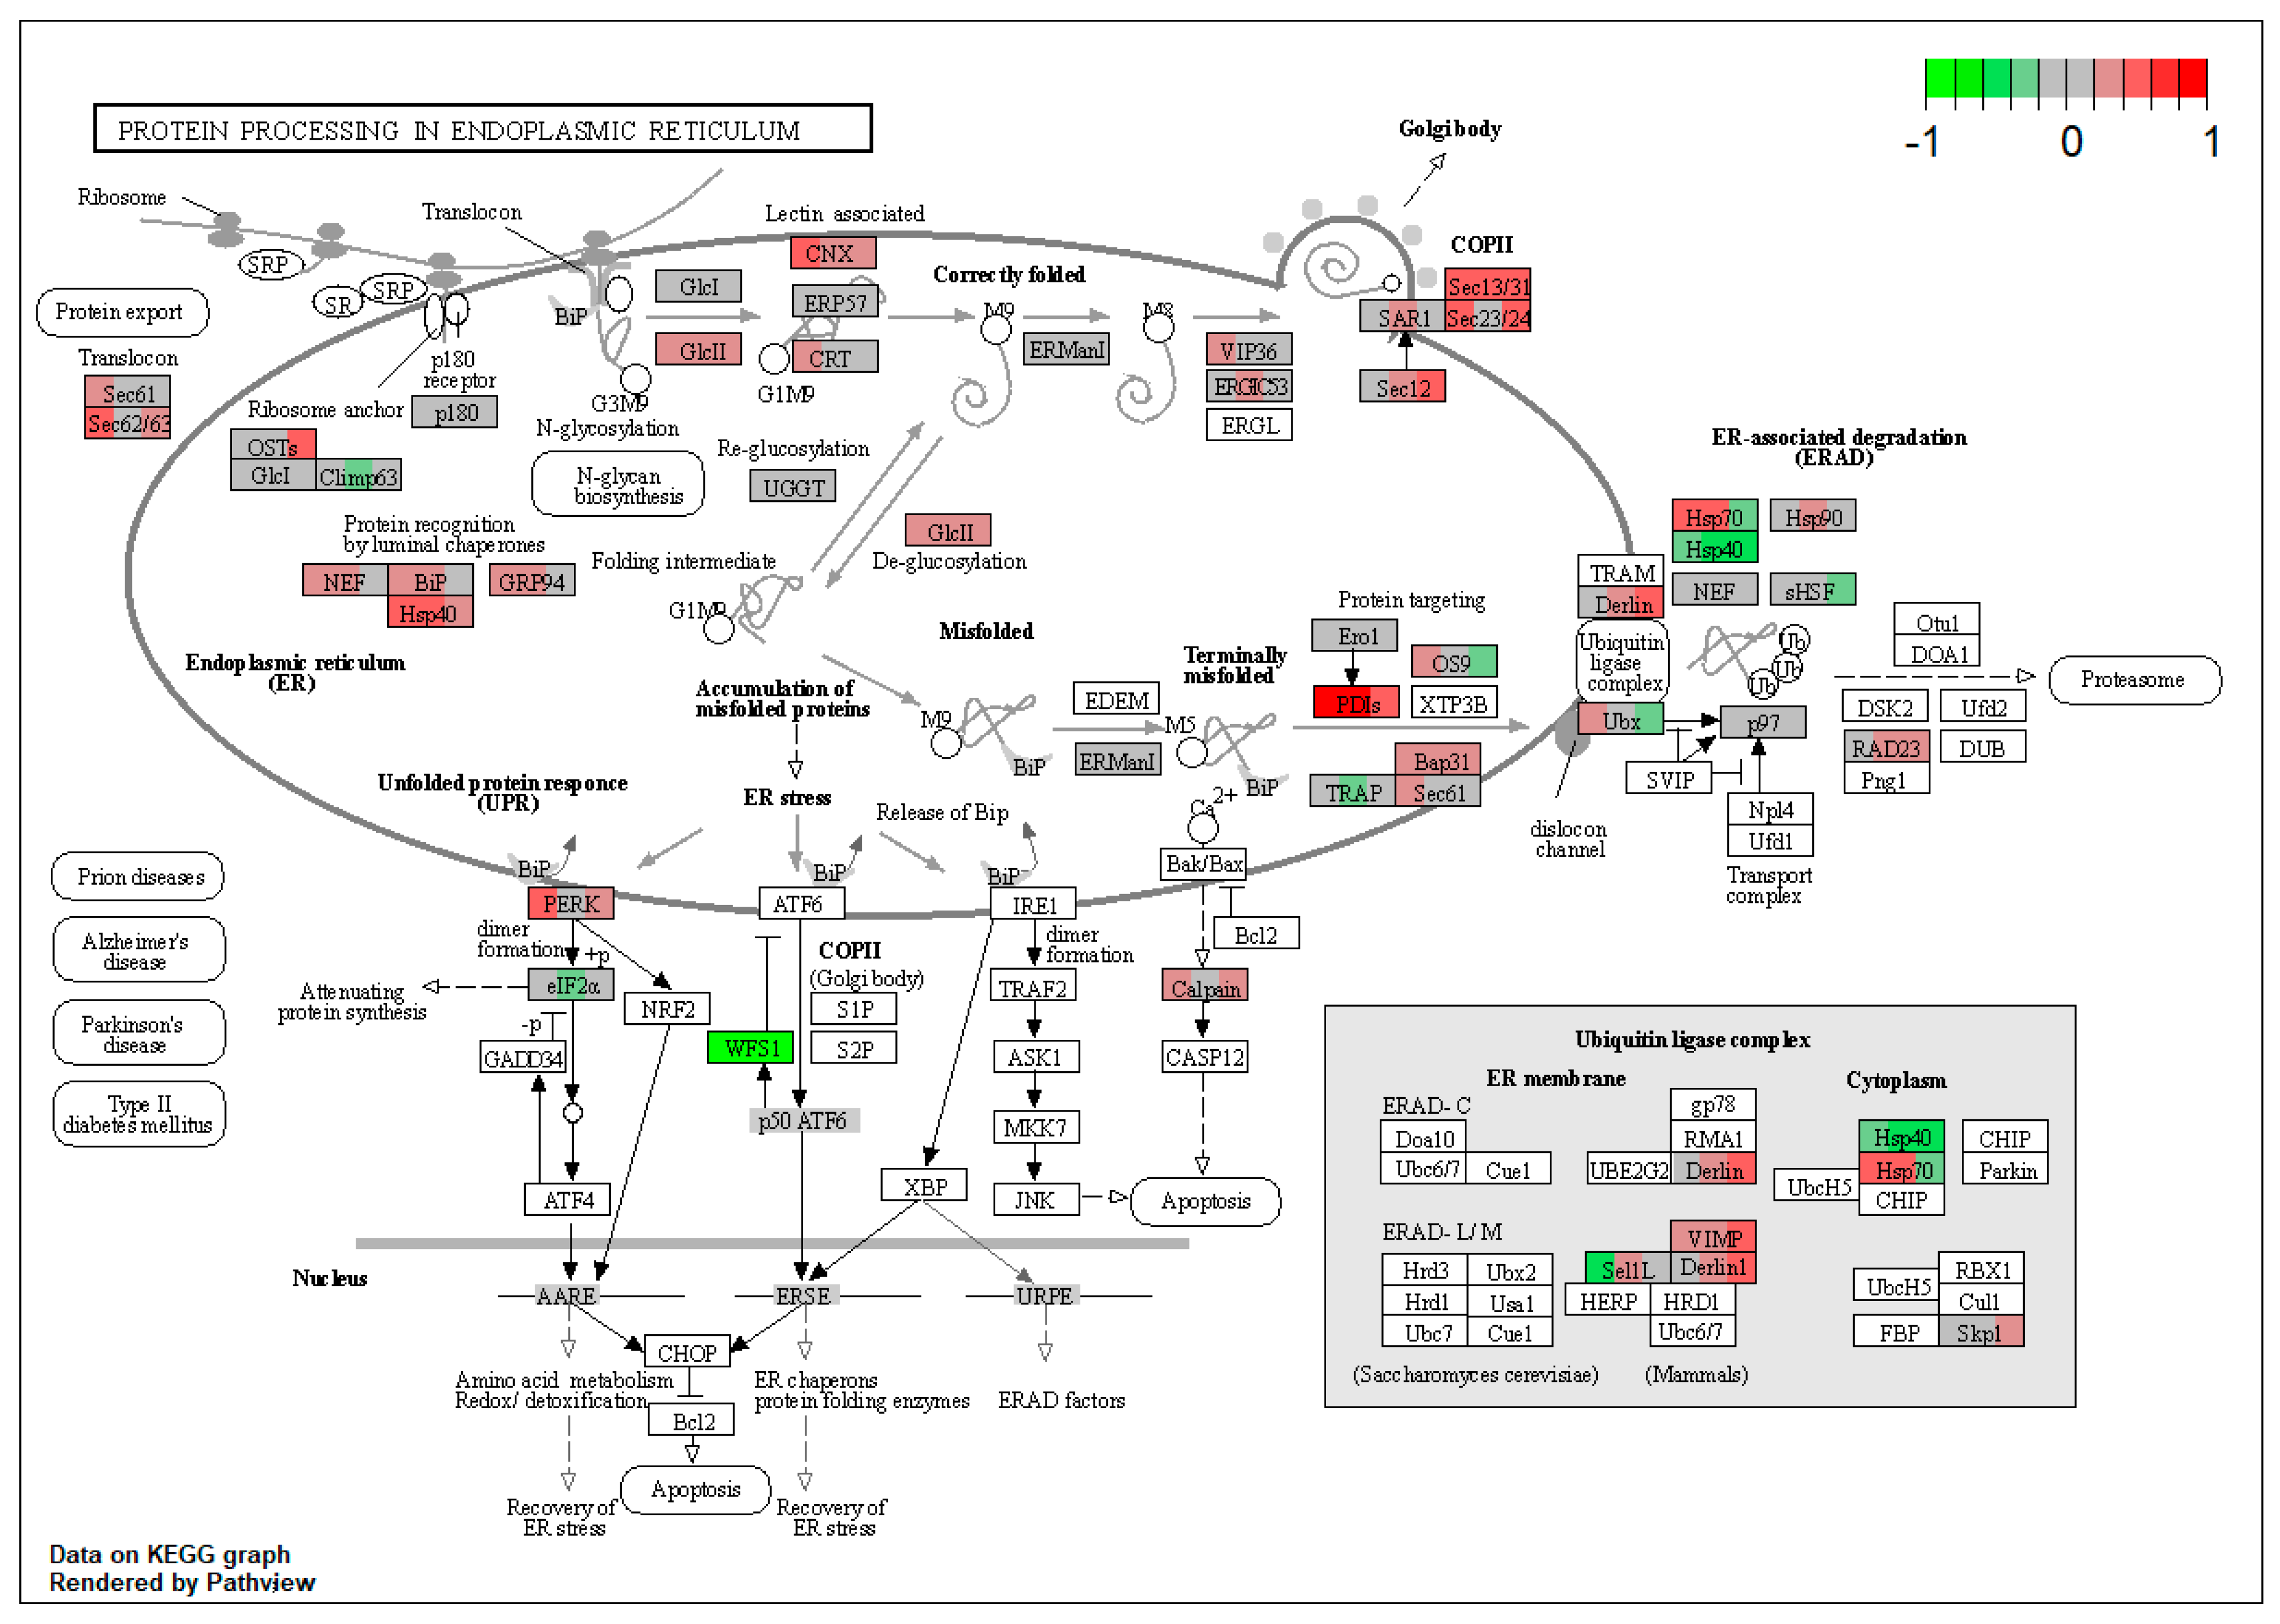
| ssc04141 | Protein processing in endoplasmic reticulum | 3.625764 | 6.53 × 10⁻⁹ | 4.51 × 10⁻⁸ | SEC63, RRBP1, HYOU1, DNAJB11, HSP90B1, PRKCSH, CANX, LMAN2, LMAN1, SEC13, SEC31A, PDIA4, ERP29, UBXN4, CAPN1 | |
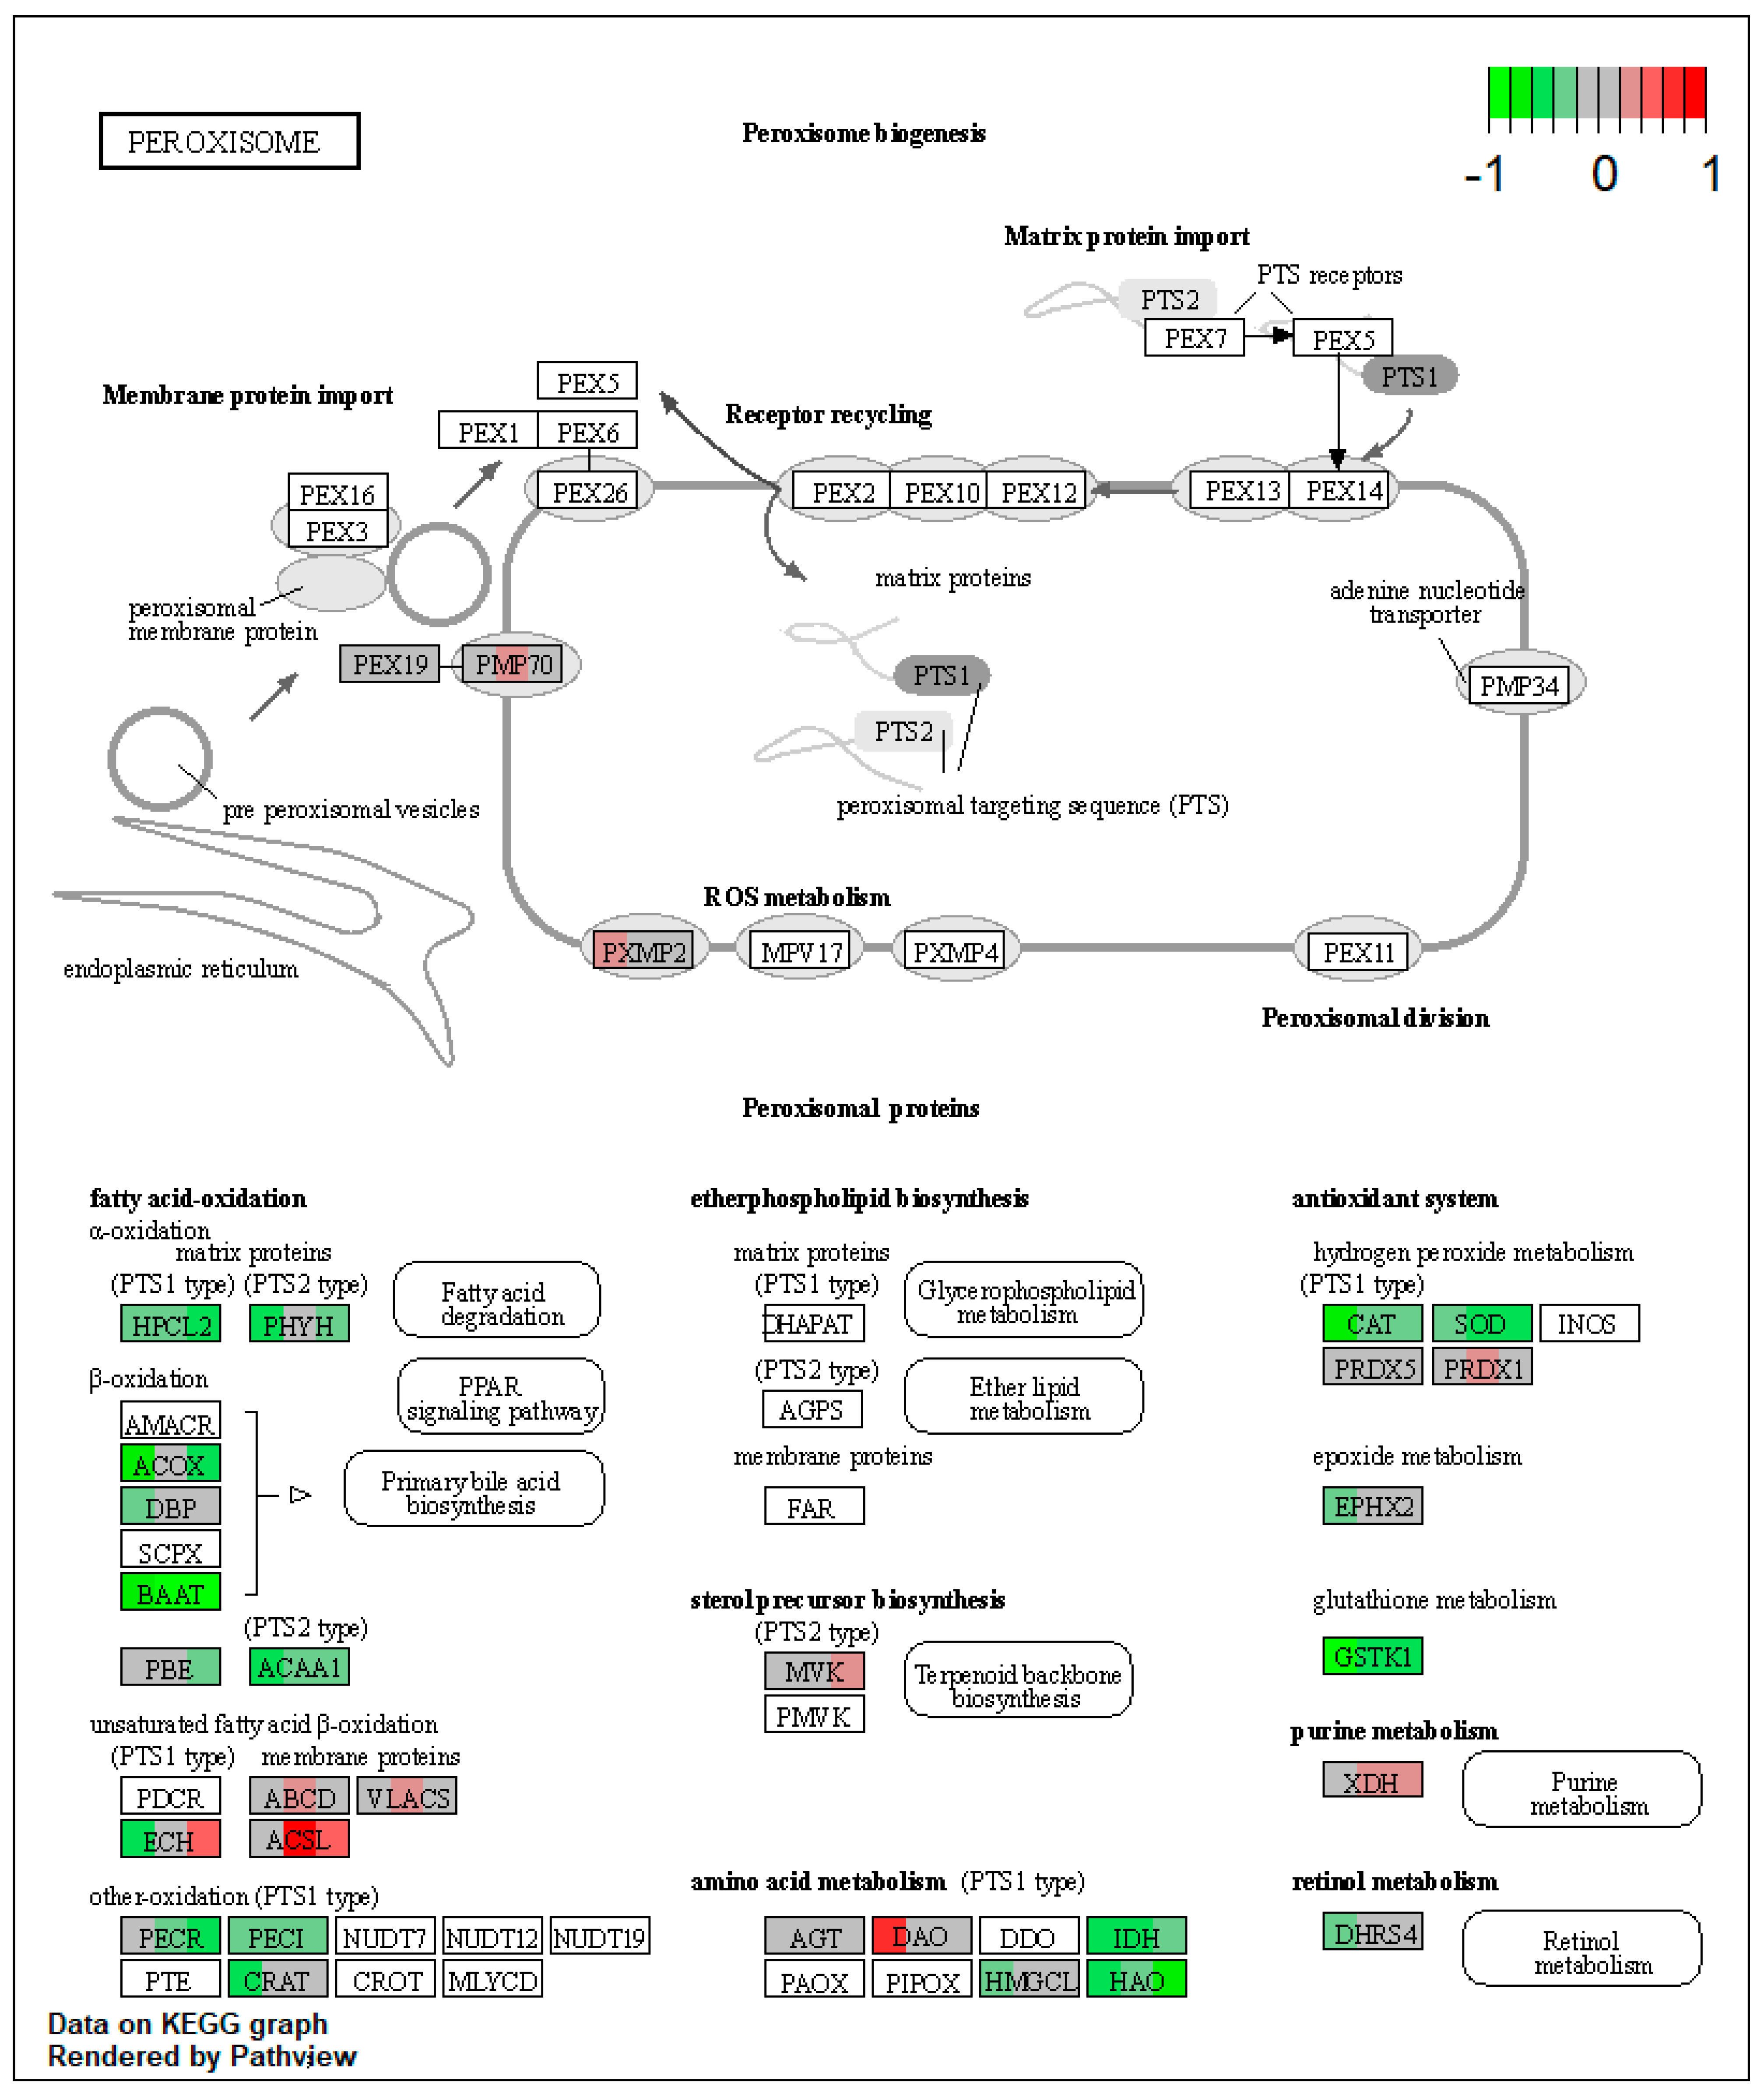
| ssc04146 | Peroxisome | 7.478138 | 1.54 × 10⁻⁸ | 2.42 × 10⁻⁸ | PRDX1, XDH | ACOX1, HSD17B4, EHHADH, ACAA1, ACSL1, ECI2, CRAT, IDH2, IDH1, HMGCL, HAO1, CAT, SOD1 |
| ssc00140 | Steroid hormone biosynthesis | 6.837155 | 9.82 × 10⁻⁸ | 9.82 × 10⁻⁸ | HSD11B1, HSD17B7 | AKR1D1, COMT |
| ssc04142 | Lysosome | 2.243441 | 2.56 × 10⁻⁷ | 2.56 × 10⁻⁷ | ATP6V0D1, IGF2R, CLTC, AP1G1, AP1M1 | SORT1 |
| ssc00670 | One carbon pool by folate | 9.572016 | 2.88 × 10⁻⁷ | 4.52 × 10⁻⁷ | GART | MTHFD1, AMT, ALDH1L1 |
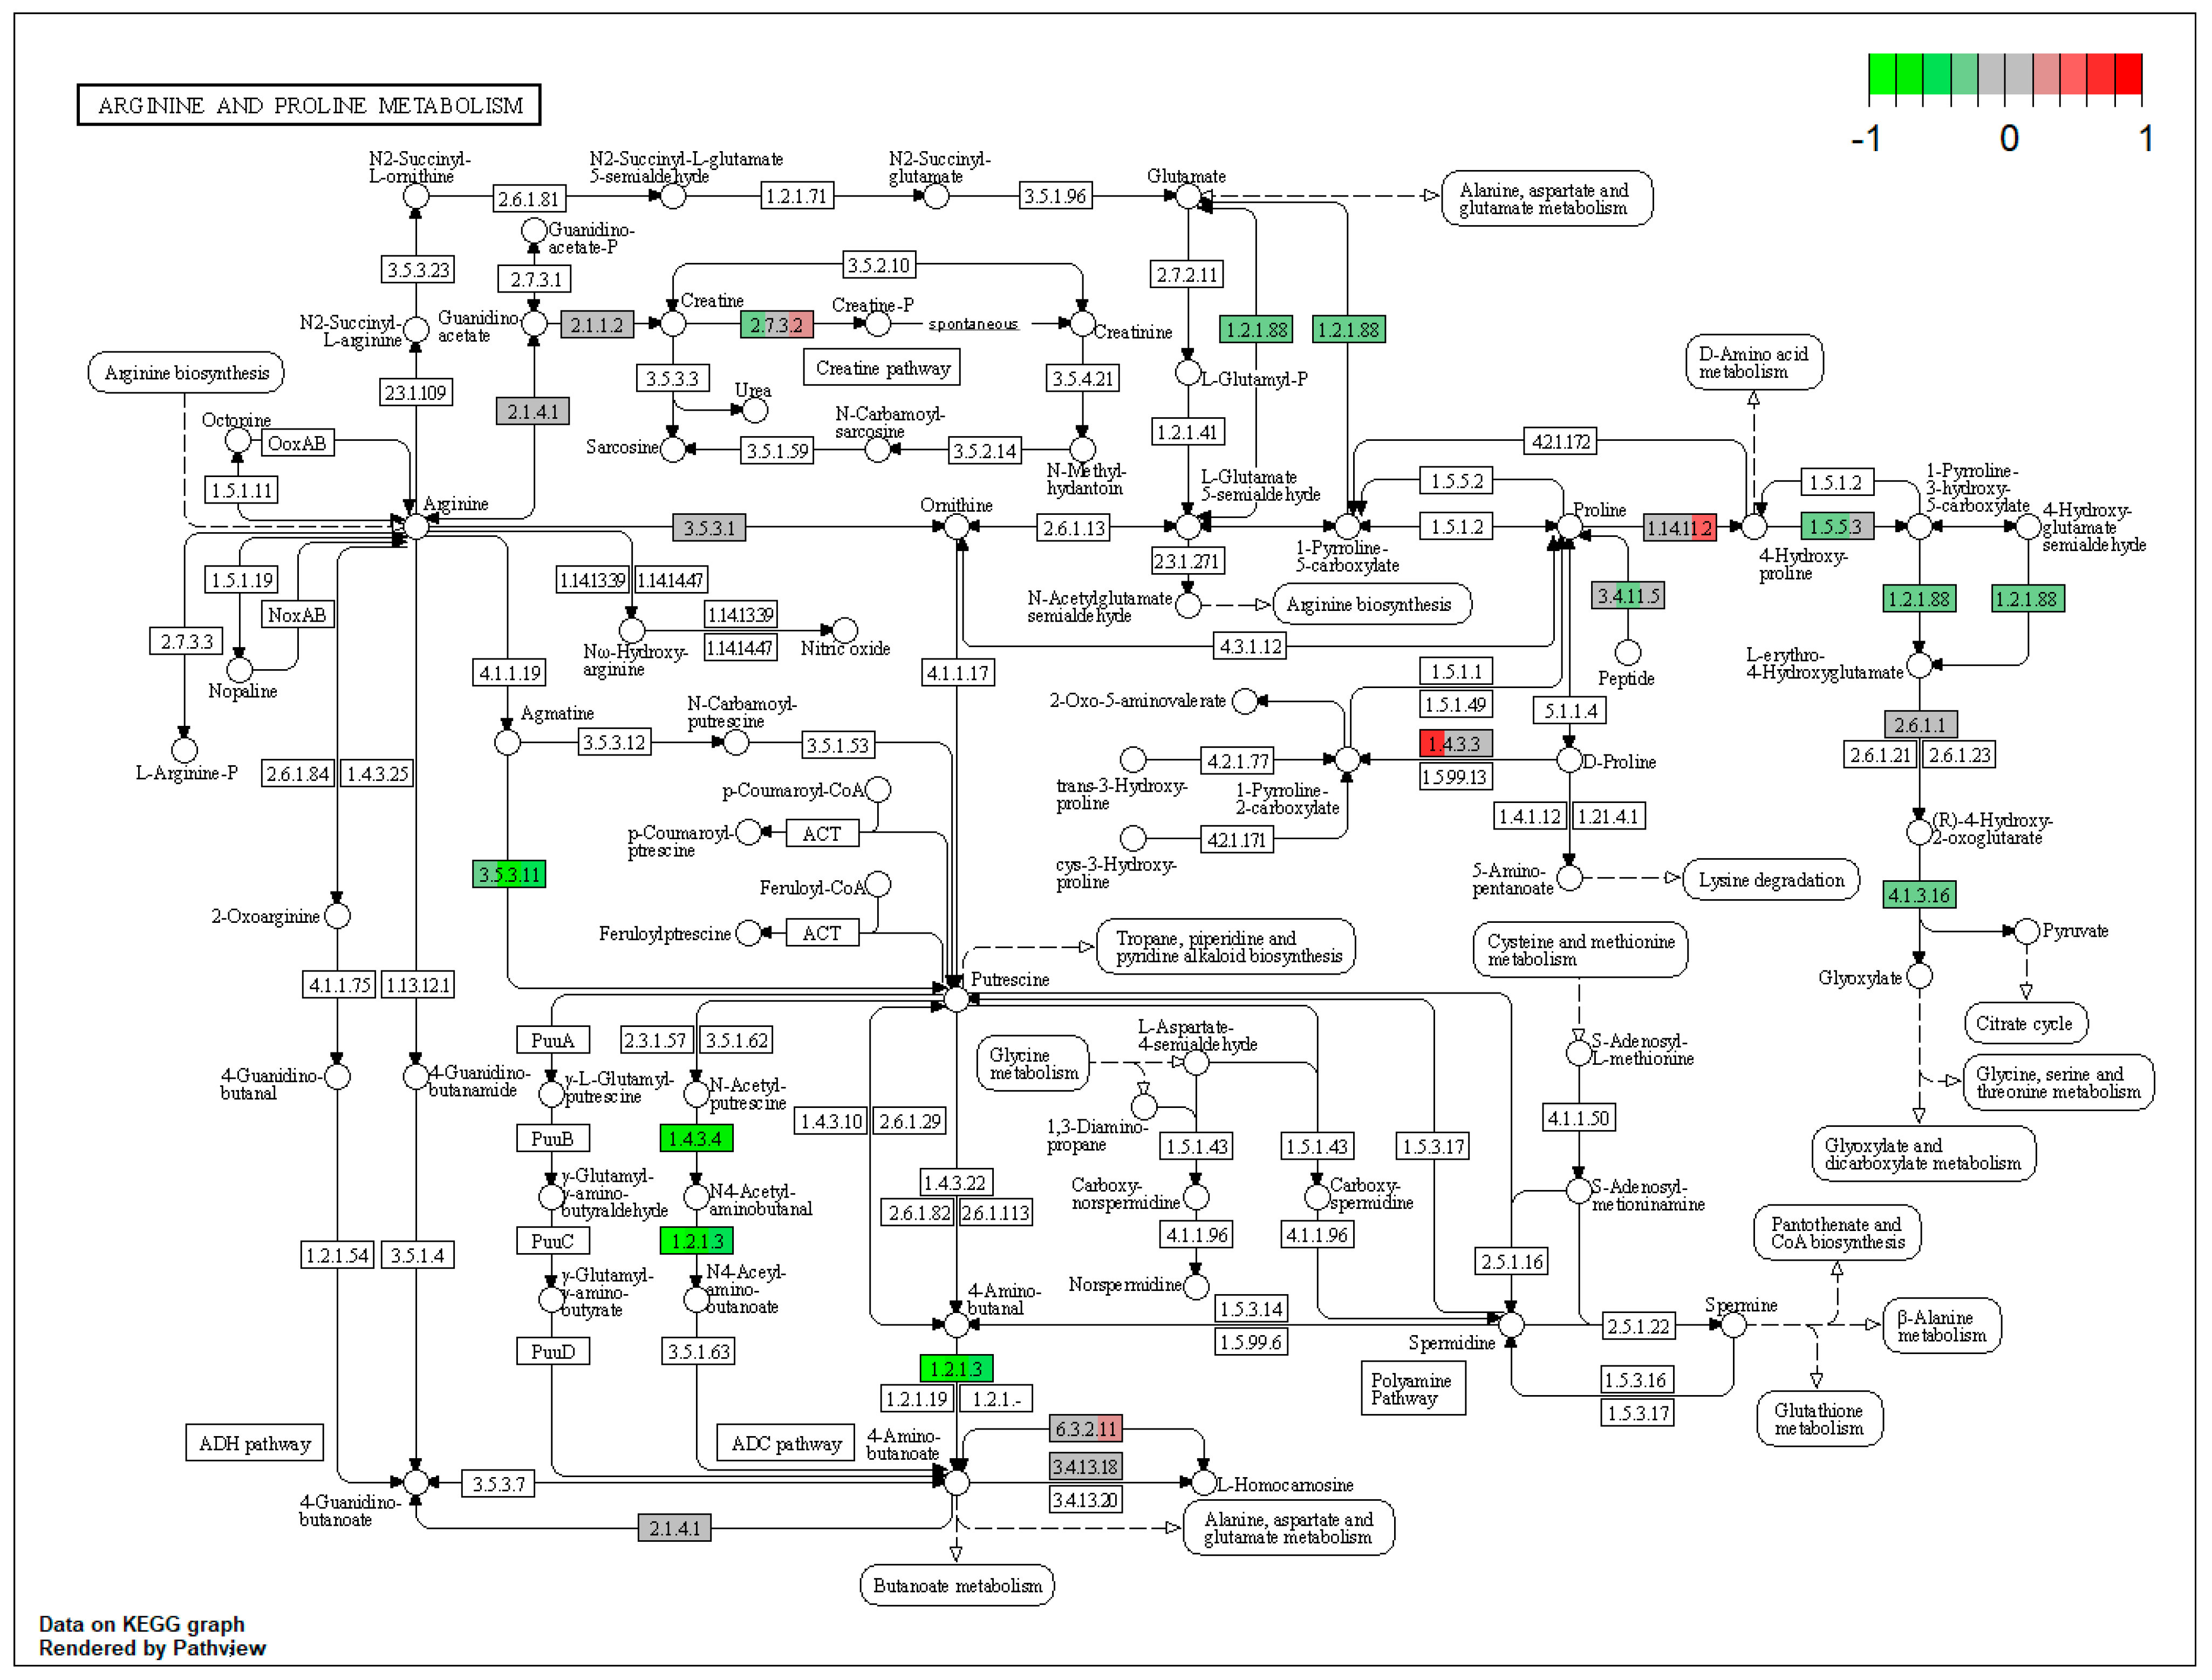
| ssc00330 | Arginine and proline metabolism | 5.438646 | 3.32 × 10⁻⁶ | 9.92 × 10⁻⁶ | ALDH3A2 | AGMAT, ALDH7A1, MAOB, ALDH4A1 |
| ssc00250 | Alanine, aspartate and glutamate metabolism | 7.179012 | 6.58 × 10−06 | 6.58 × 10−06 | GFPT1 | ASS1, ASL, ALDH5A1, ALDH4A1, CPS1 |
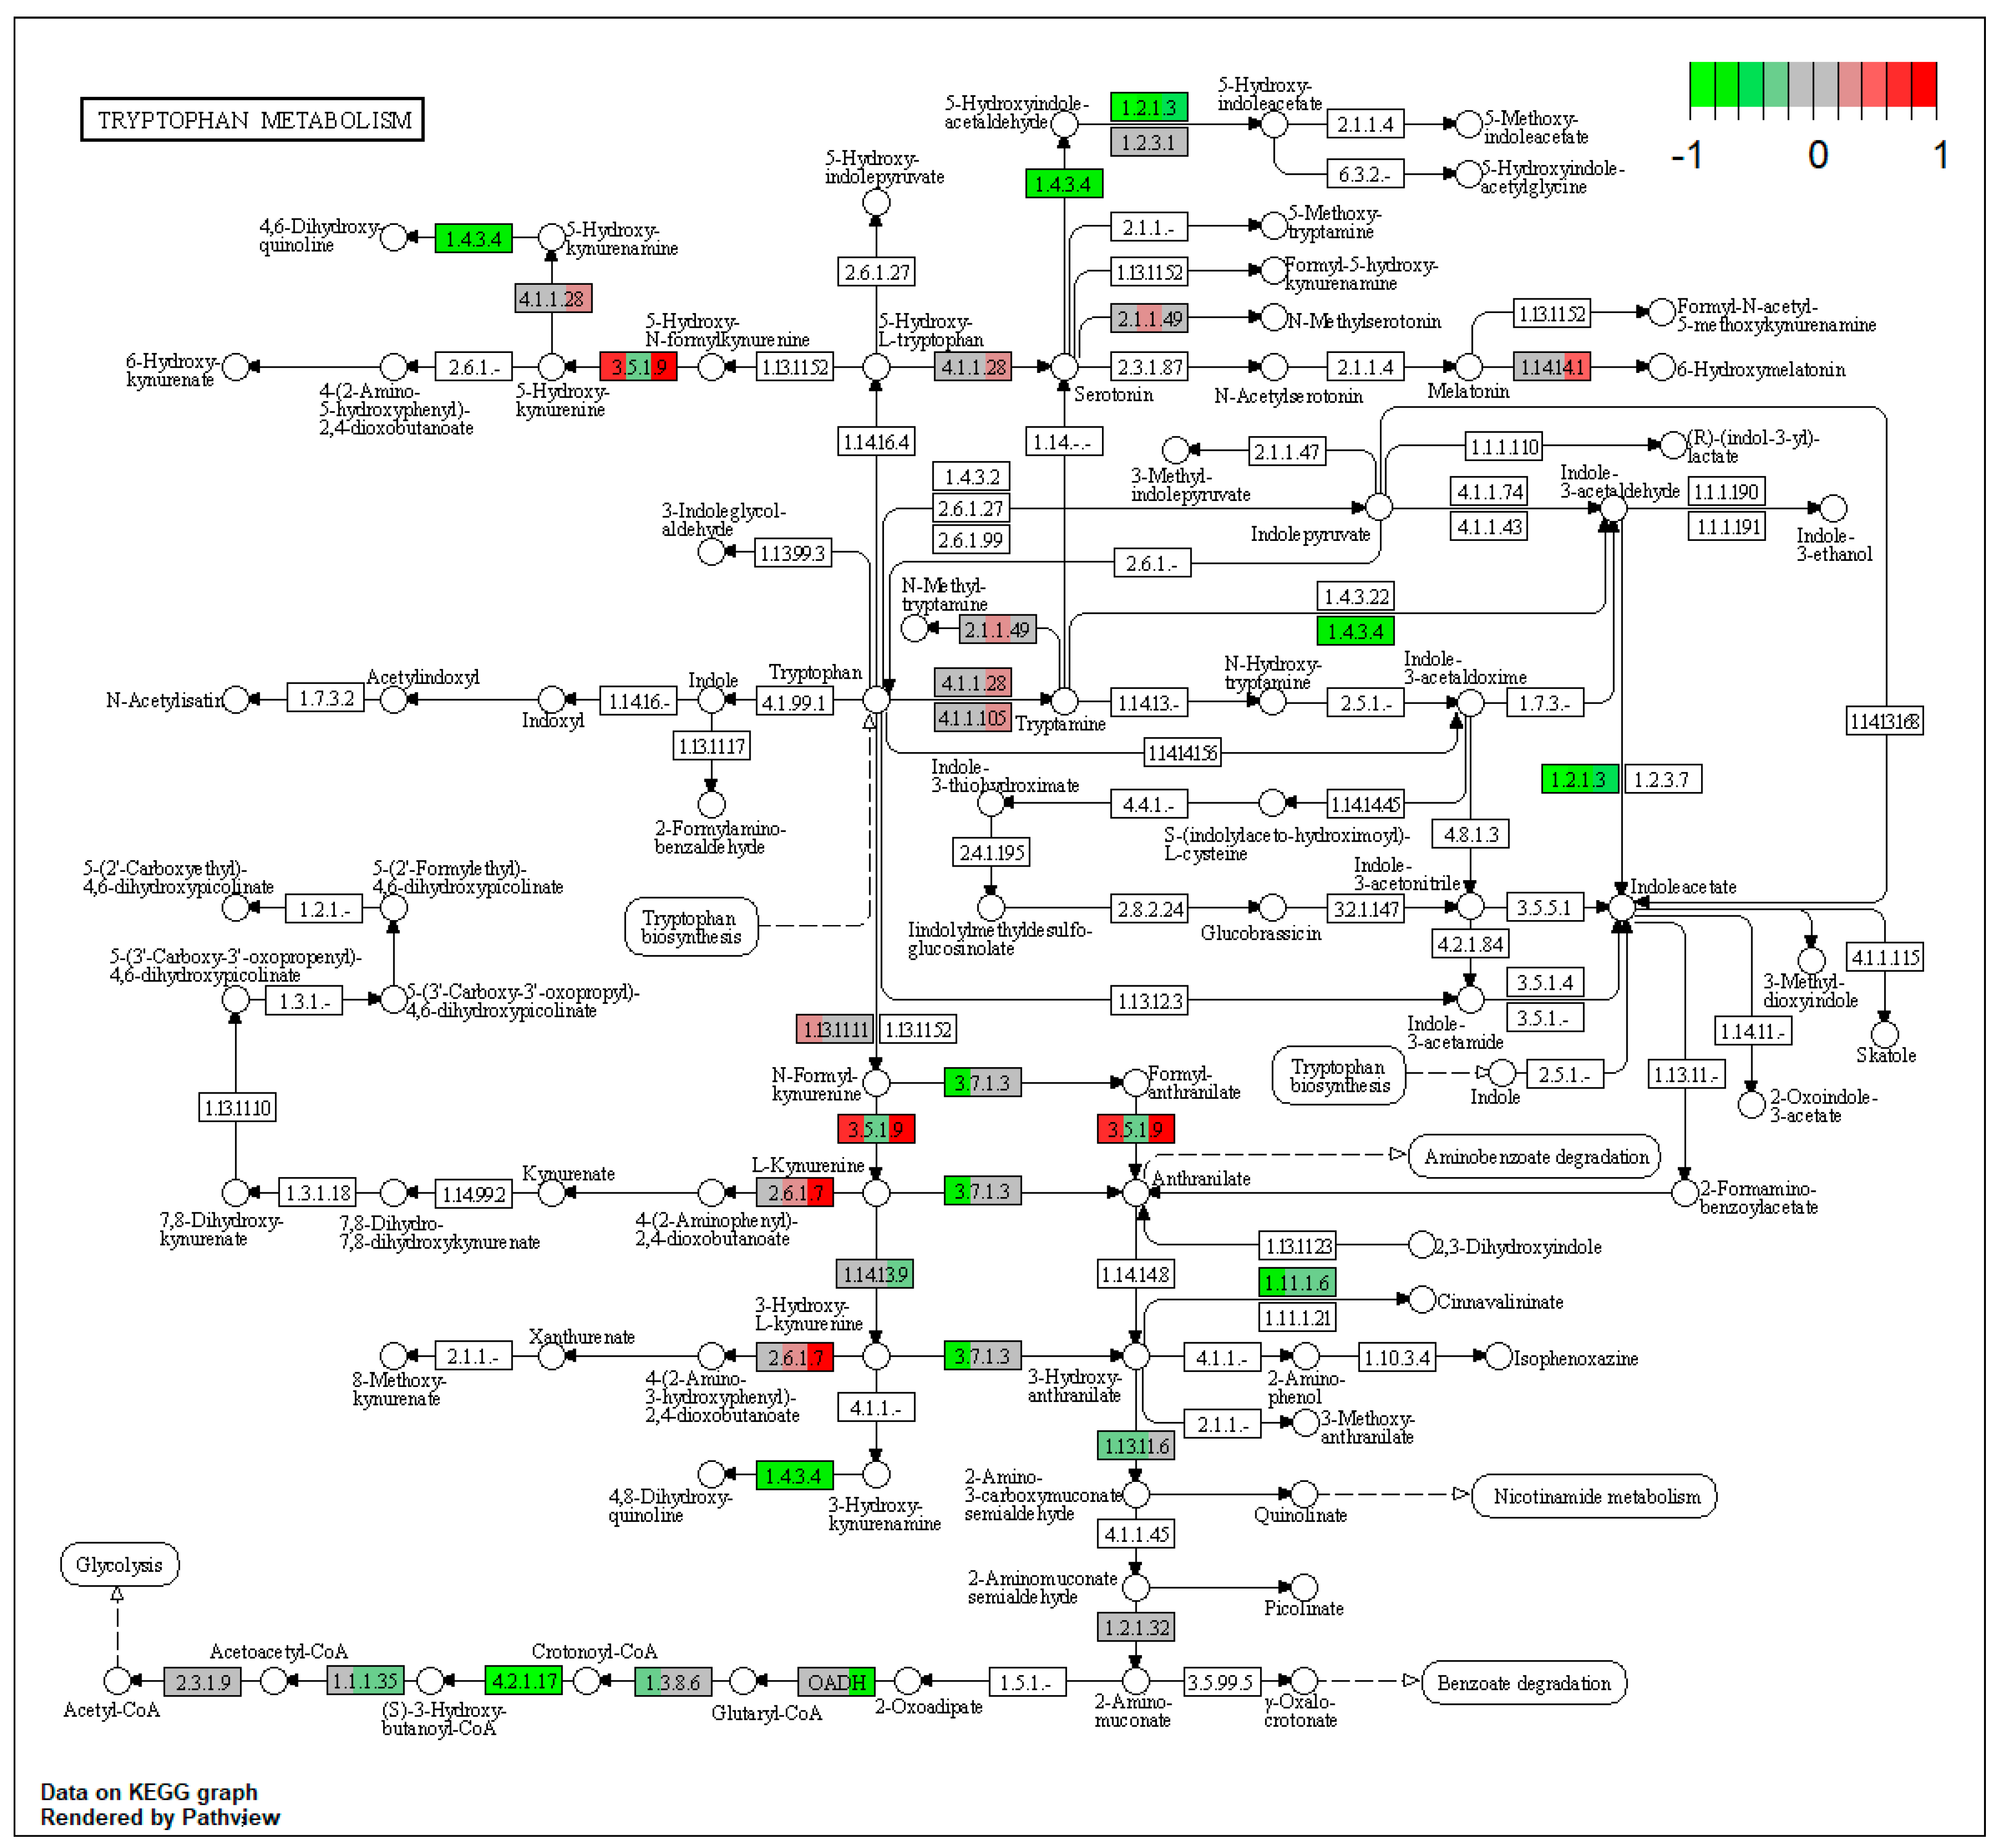
| ssc00380 | Tryptophan metabolism | 7.36309 | 6.78 × 10⁻⁶ | 1.22 × 10⁻⁵ | DLST, ALDH3A2 | KYNU, EHHADH, ACAT2, MAOB, ALDH7A1, CAT |
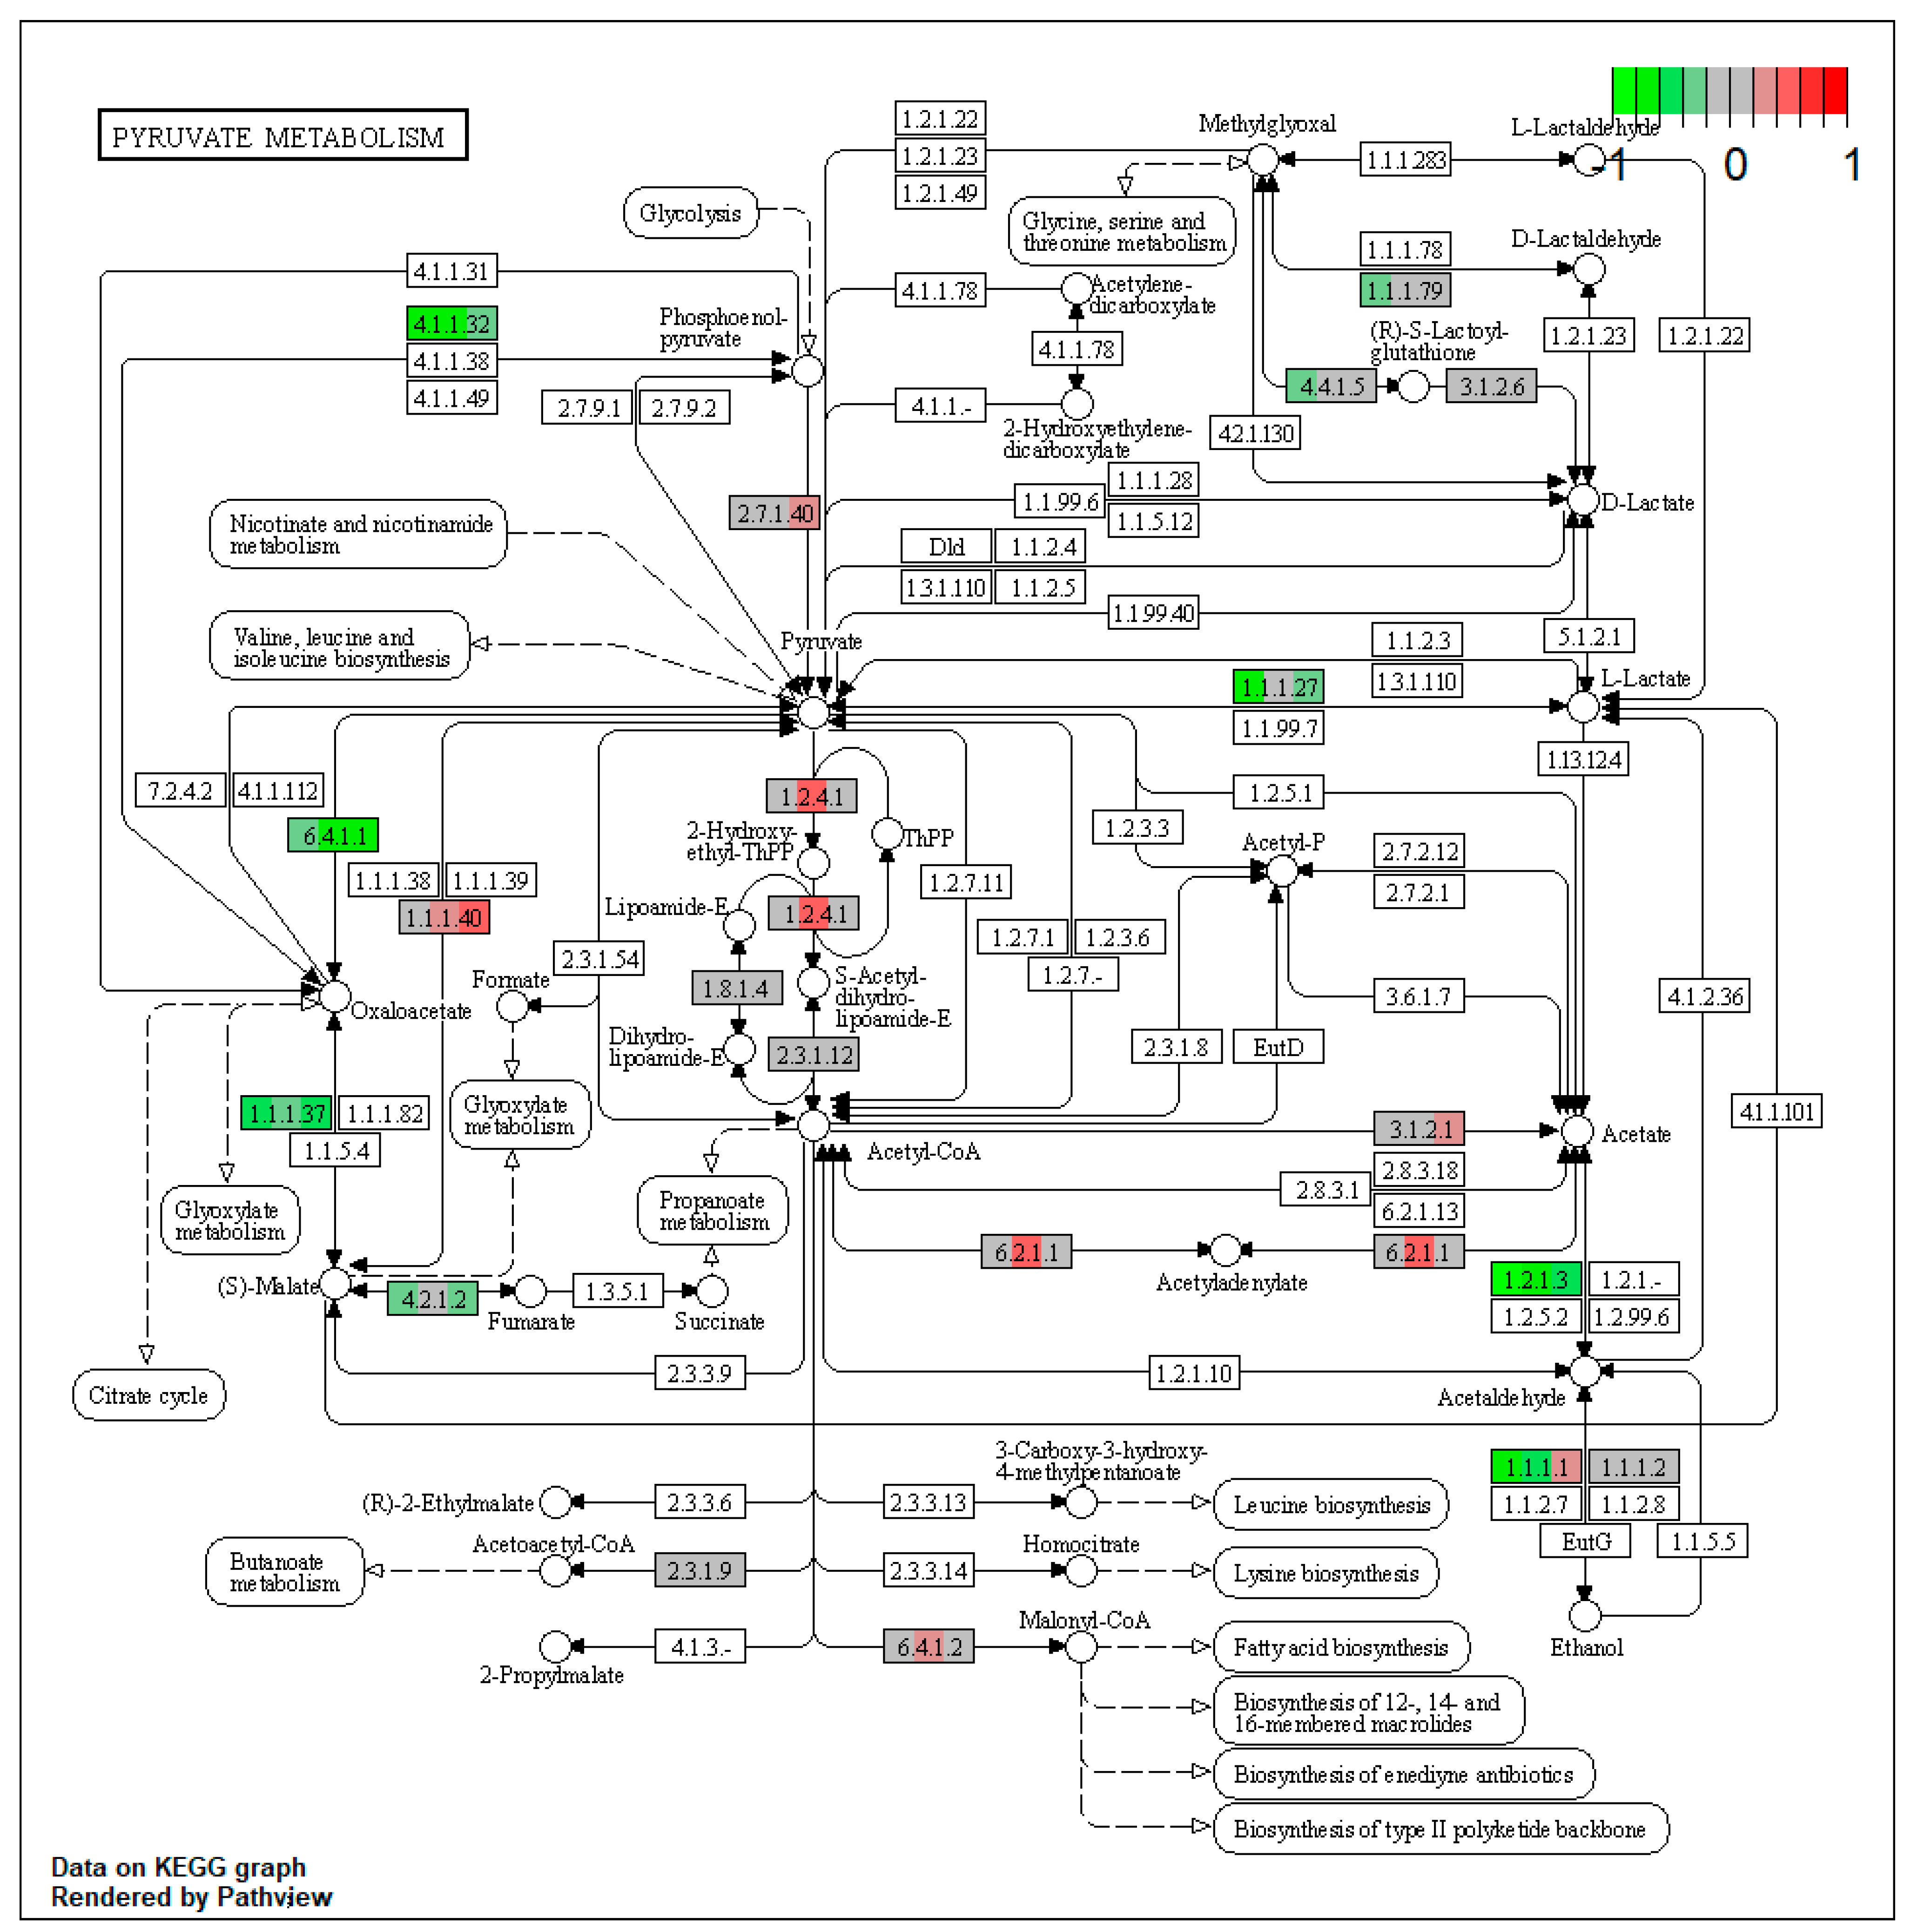
| ssc00620 | Pyruvate metabolism | 7.614104 | 1.56 × 10⁻⁵ | 1.56 × 10⁻⁵ | ALDH3A2 | ALDH7A1, GRHPR, PC, FH, PCK2, ACAT2 |
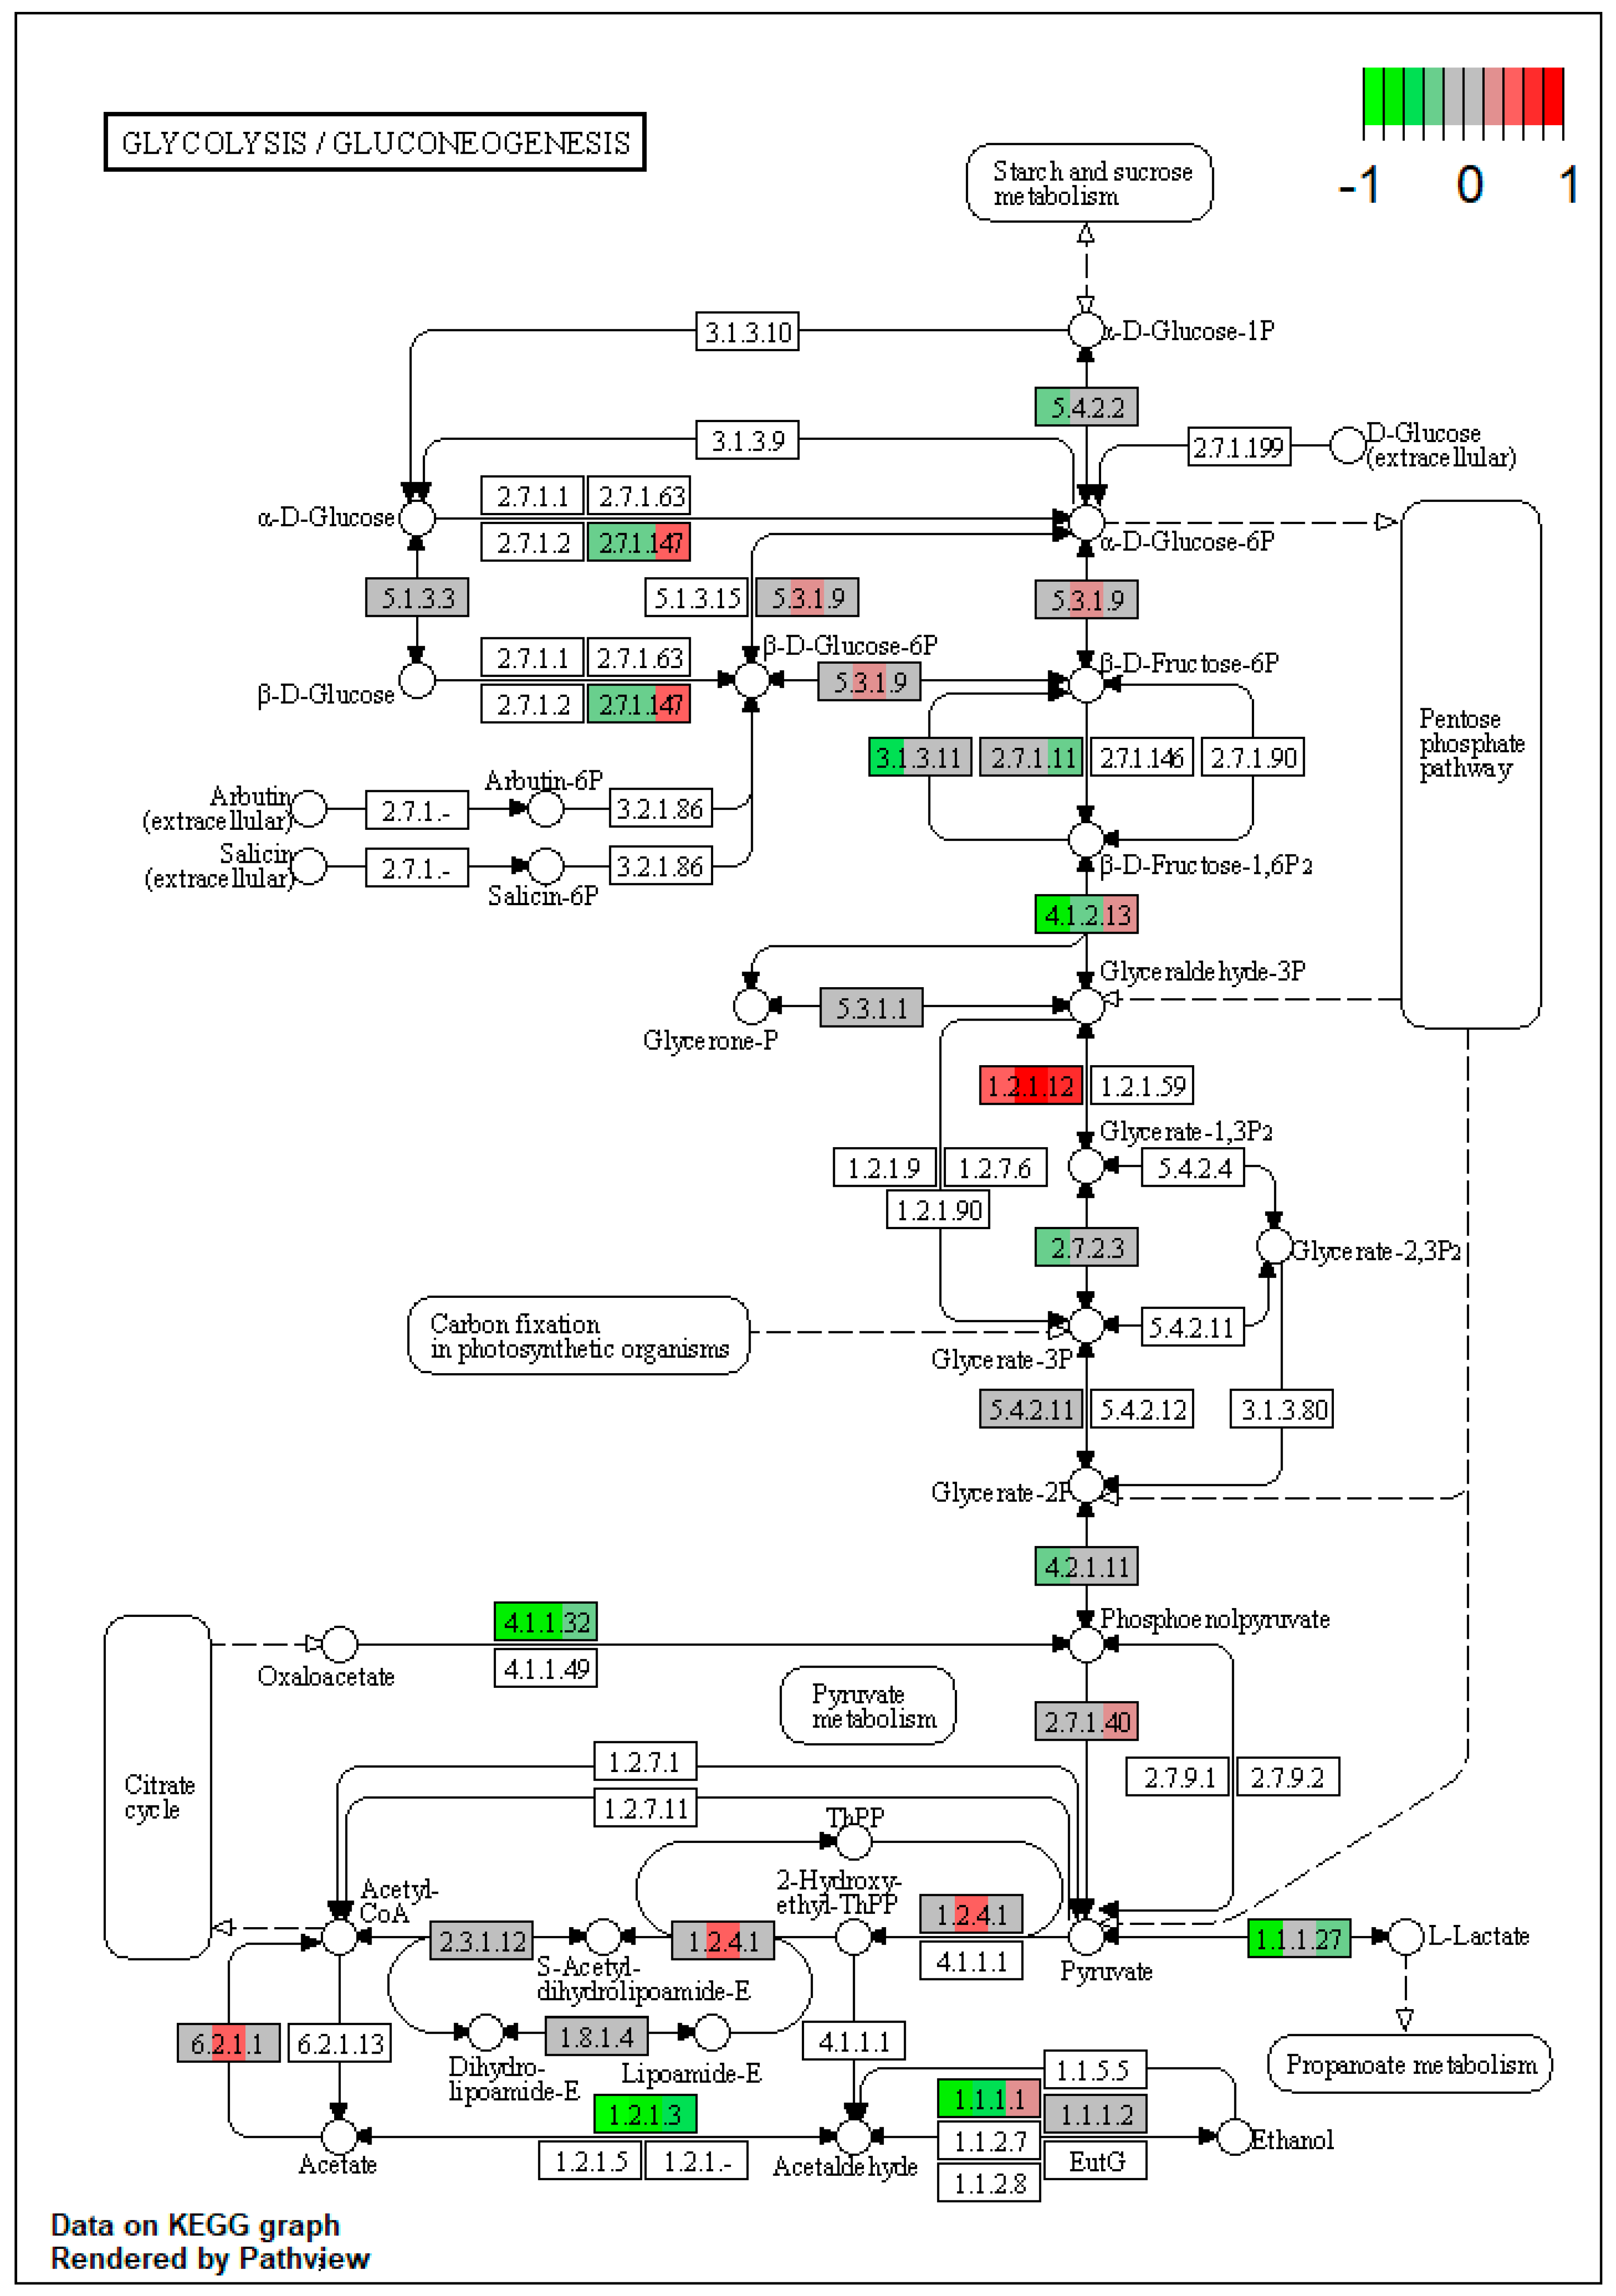
| ssc00010 | Glycolysis / Gluconeogenesis | 4.102293 | 2.36 × 10⁻⁵ | 2.36 × 10⁻⁵ | ALDH3A2 | PGK1, ENO3, ALDH7A1, PGM2, PCK2 |
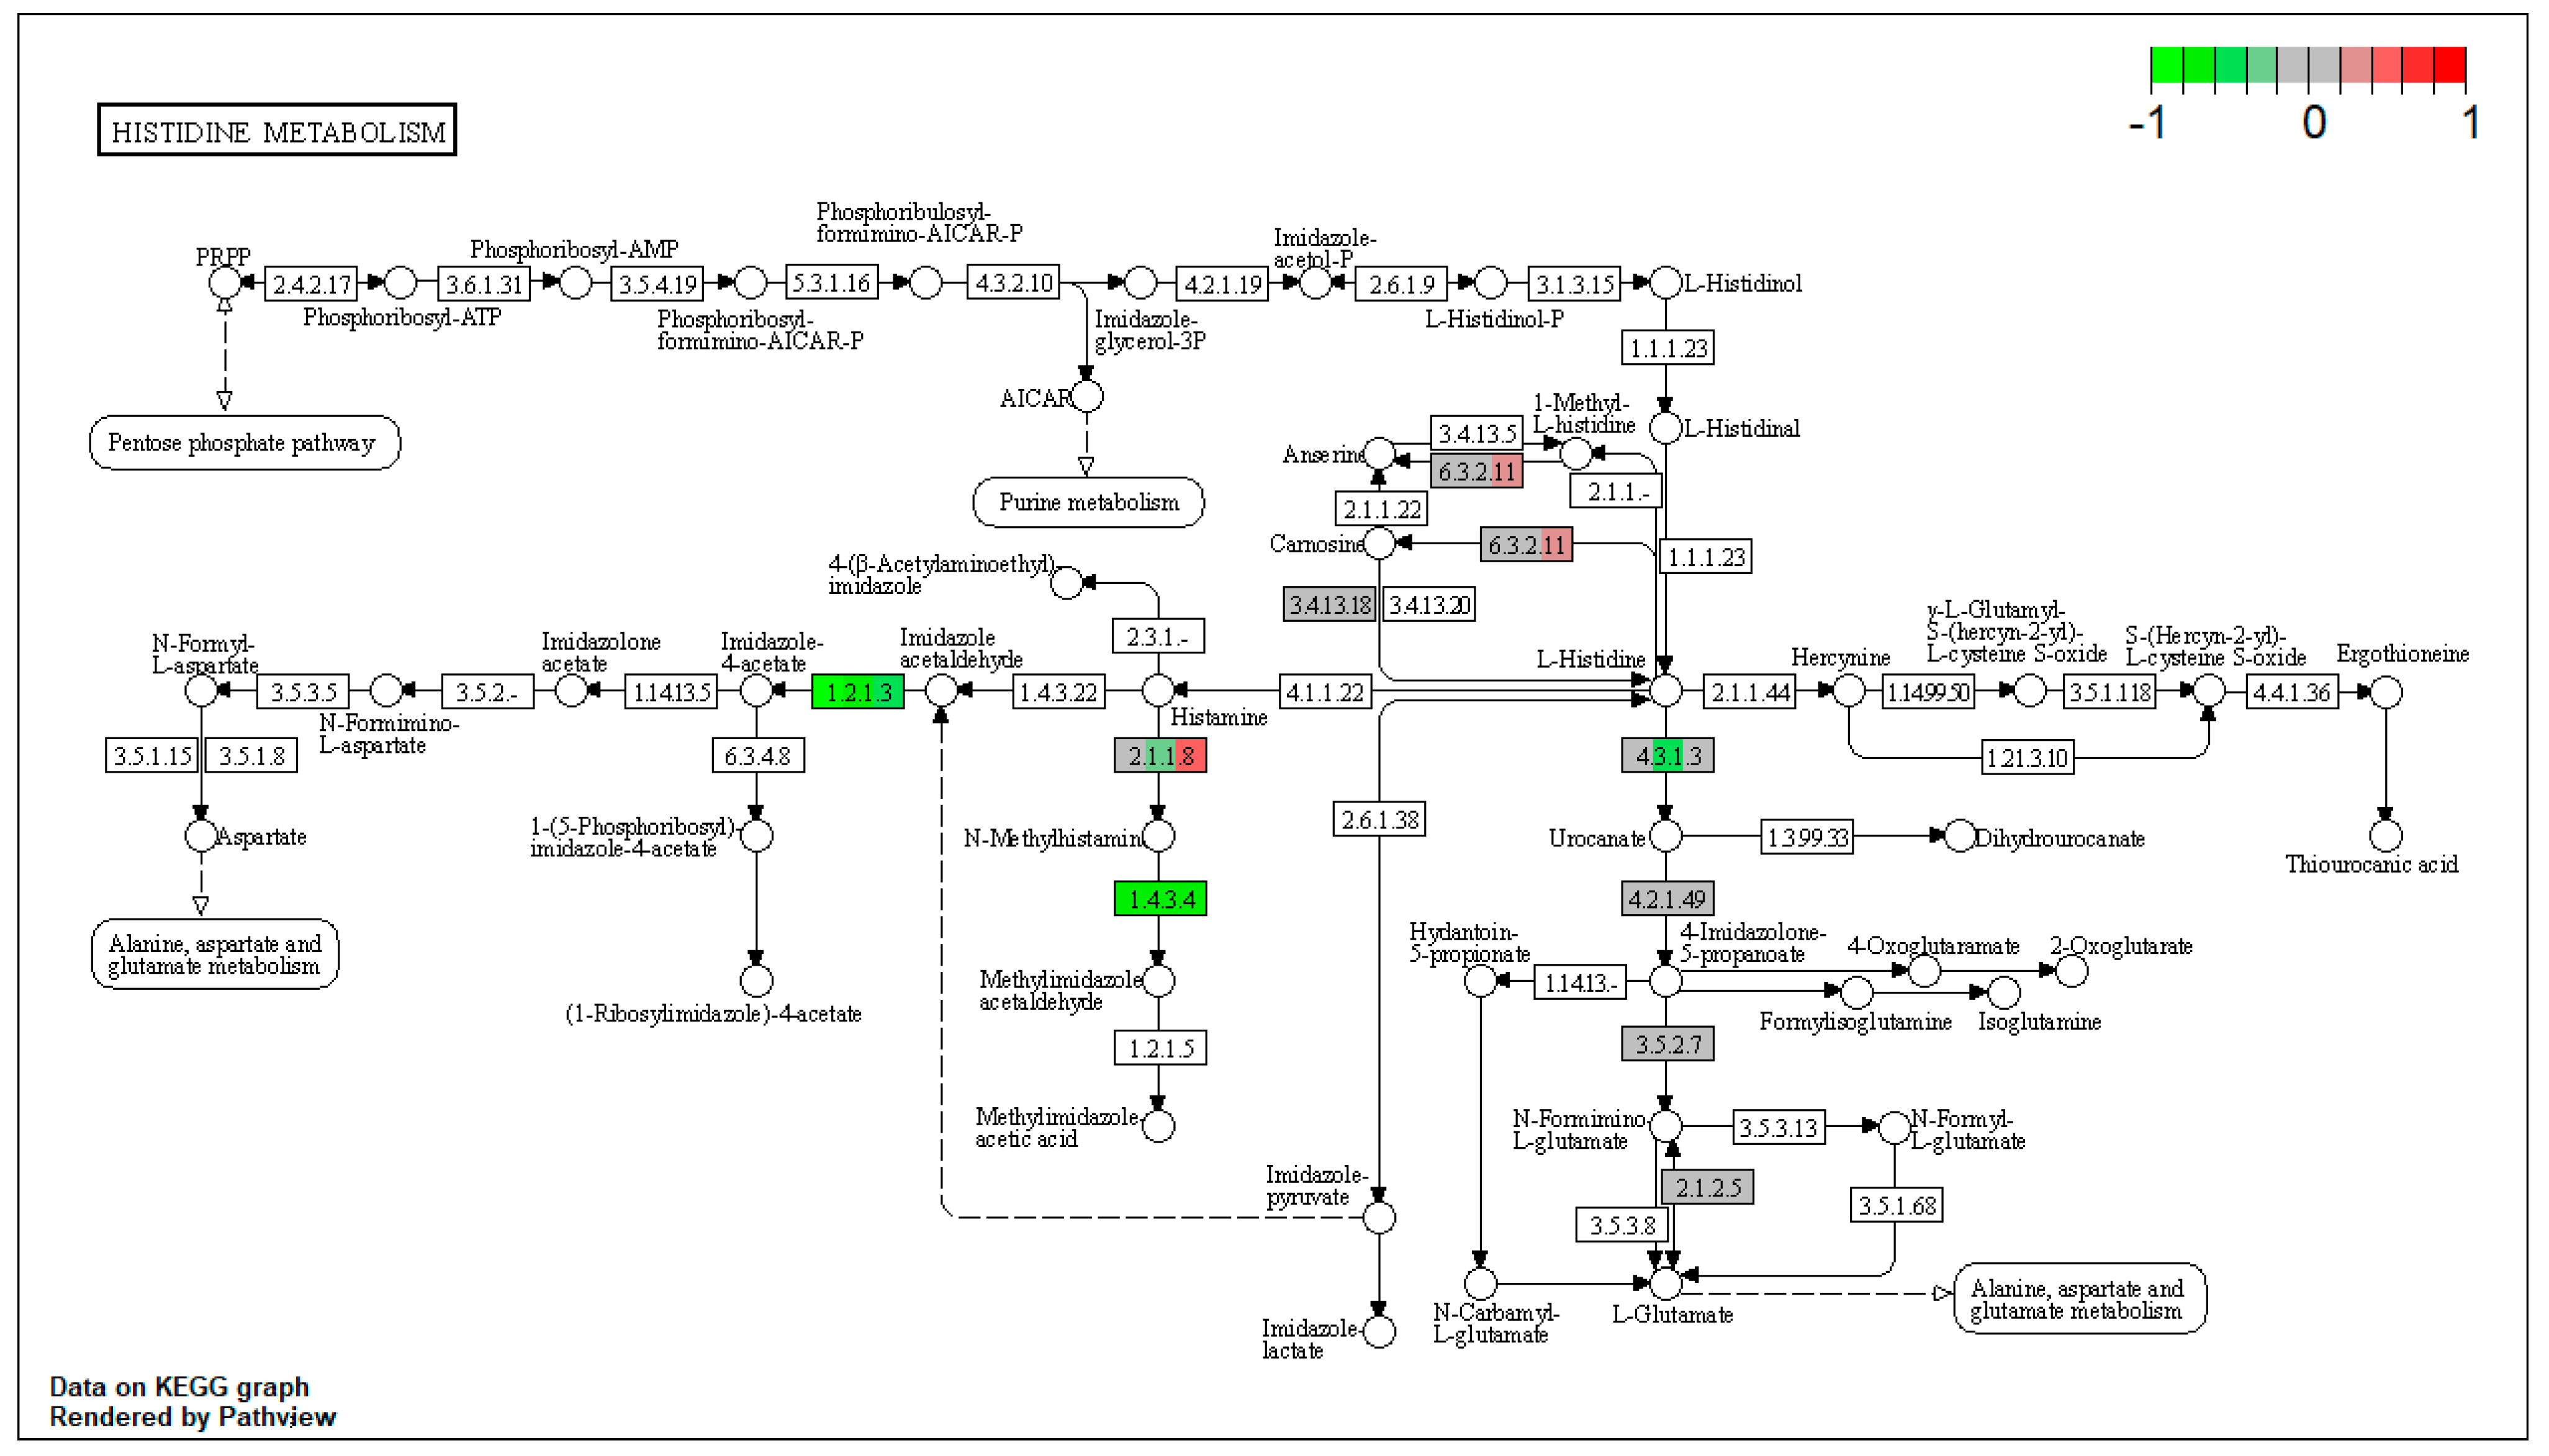
| ssc00340 | Histidine metabolism | 5.98251 | 4.18 × 10⁻⁵ | 4.18 × 10⁻⁵ | ALDH3A2 | ALDH7A1, MAOB |
| ssc00410 | beta-Alanine metabolism | 7.038247 | 4.66 × 10⁻⁵ | 5.89 × 10⁻⁵ | ALDH3A2 | ALDH7A1, EHHADH, ACOX1, ALDH6A1 |
| ssc00350 | Tyrosine metabolism | 5.630598 | 0.000129 | 0.000129 | HPD | GSTZ1, COMT, MAOB |
| ssc00220 | Arginine biosynthesis | 7.97668 | 0.000249 | 0.000343 | ACY1 | ASS1, ASL, CPS1 |
| ssc00230 | Purine metabolism | 1.734061 | 0.000383 | 0.000383 | GART, ENTPD8, XDH | PGM2, AK3 |
| ssc00310 | Lysine degradation | 5.776217 | 0.000454 | 0.000573 | DLST, ALDH3A2 | AASS, ALDH7A1, EHHADH, ACAT2, PLOD3 |
| ssc00760 | Nicotinate and nicotinamide metabolism | 3.778428 | 0.000512 | 0.000512 | NAMPT, NNMT | NNT |
| ssc00500 | Starch and sucrose metabolism | 2.518952 | 0.000512 | 0.000512 | PYGL | PGM2 |
| ssc04961 | Endocrine and other factor-regulated calcium reabsorption | 2.658893 | 0.000963 | 0.000963 | AP2A1, AP2M1, CLTC | |
| ssc03320 | PPAR signaling pathway | 5.469724 | 0.000989 | 0.001231 | APOC3 | CYP27A1, ACSL1, EHHADH, ACAA1, ACOX1, ACADM, PCK2 |
| ssc04918 | Thyroid hormone synthesis | 3.14869 | 0.001585 | 0.002762 | HSP90B1, CANX, PDIA4 | ASGR1, ASGR2 |
| ssc00240 | Pyrimidine metabolism | 1.595336 | 0.002128 | 0.002128 | ENTPD8 | CMPK1 |
| ssc00053 | Ascorbate and aldarate metabolism | 9.572016 | 0.002765 | 0.002765 | ALDH3A2 | ALDH7A1 |
| ssc00630 | Glyoxylate and dicarboxylate metabolism | 7.97668 | 0.006161 | 0.007302 | ACAT2, PCCA, HAO1, CAT, GRHPR, AMT | |
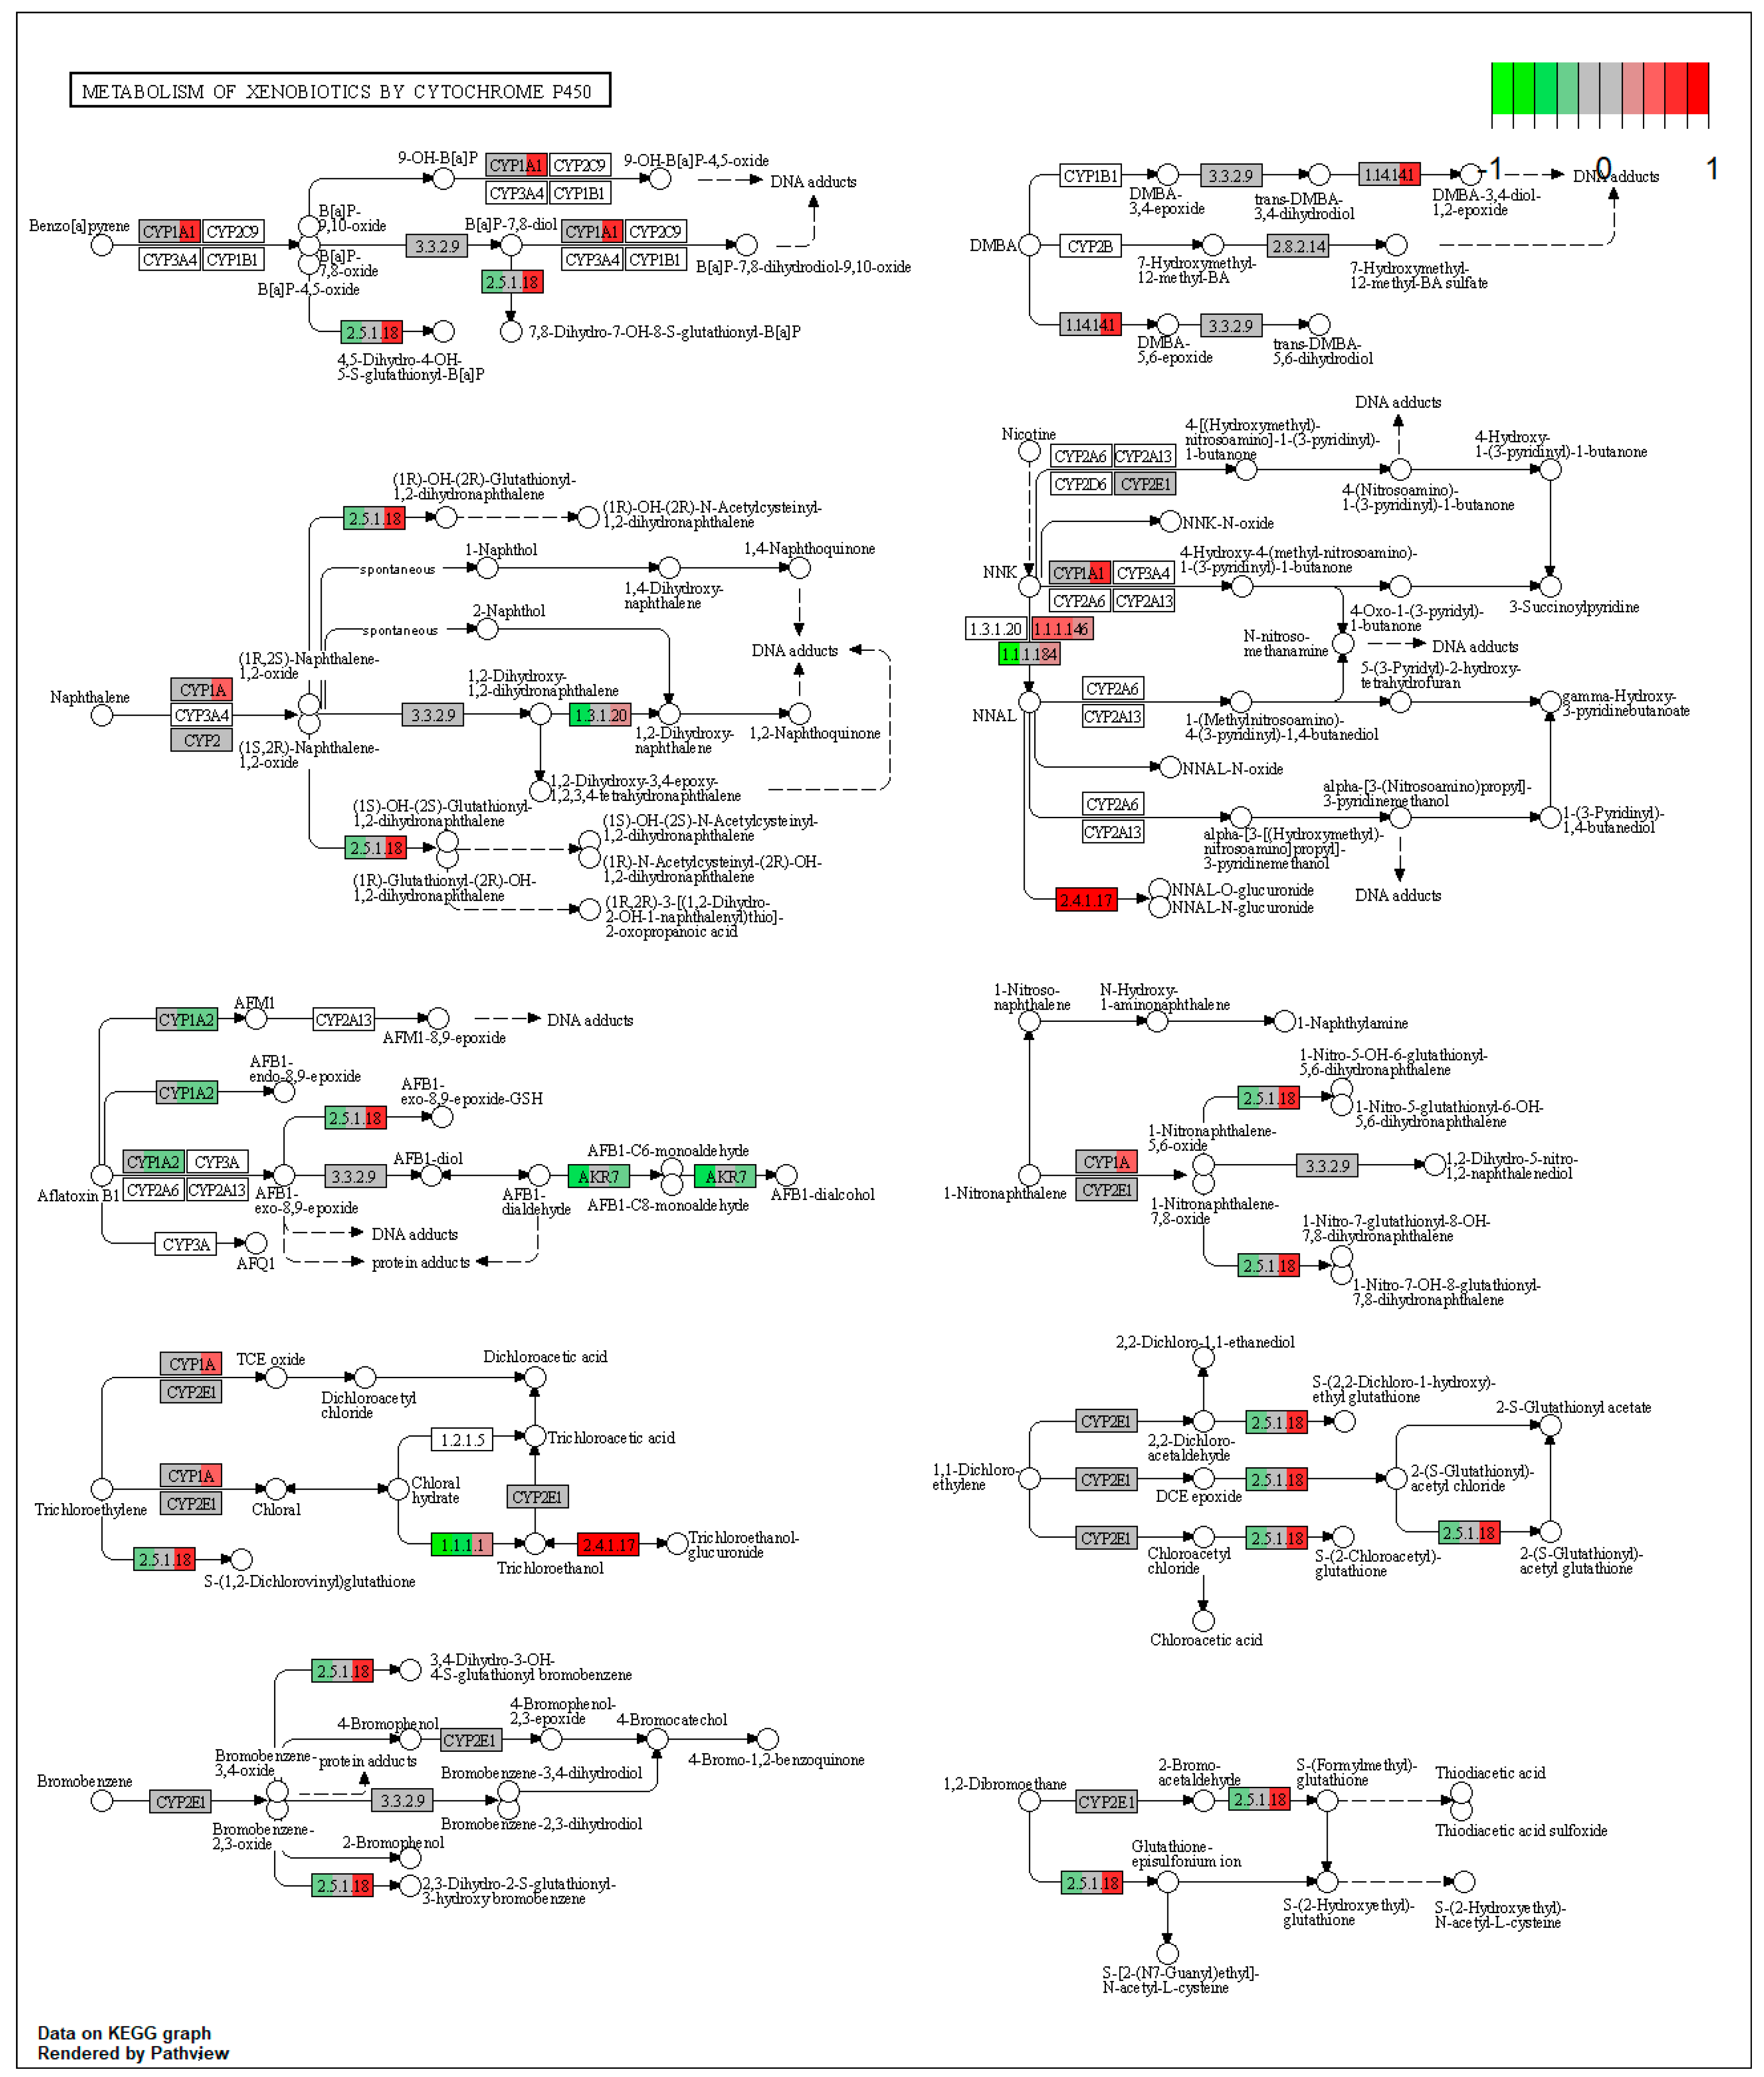
| ssc00980 | Metabolism of xenobiotics by cytochrome P450 | 2.658893 | 0.009935 | 0.009935 | HSD11B1 | |
| ssc00982 | Drug metabolism—cytochrome P450 | 2.991255 | 0.023128 | 0.023128 | MAOB | |
| ssc00770 | Pantothenate and CoA biosynthesis | 1.99417 | 0.033874 | 0.033874 | ALDH3A2 | |
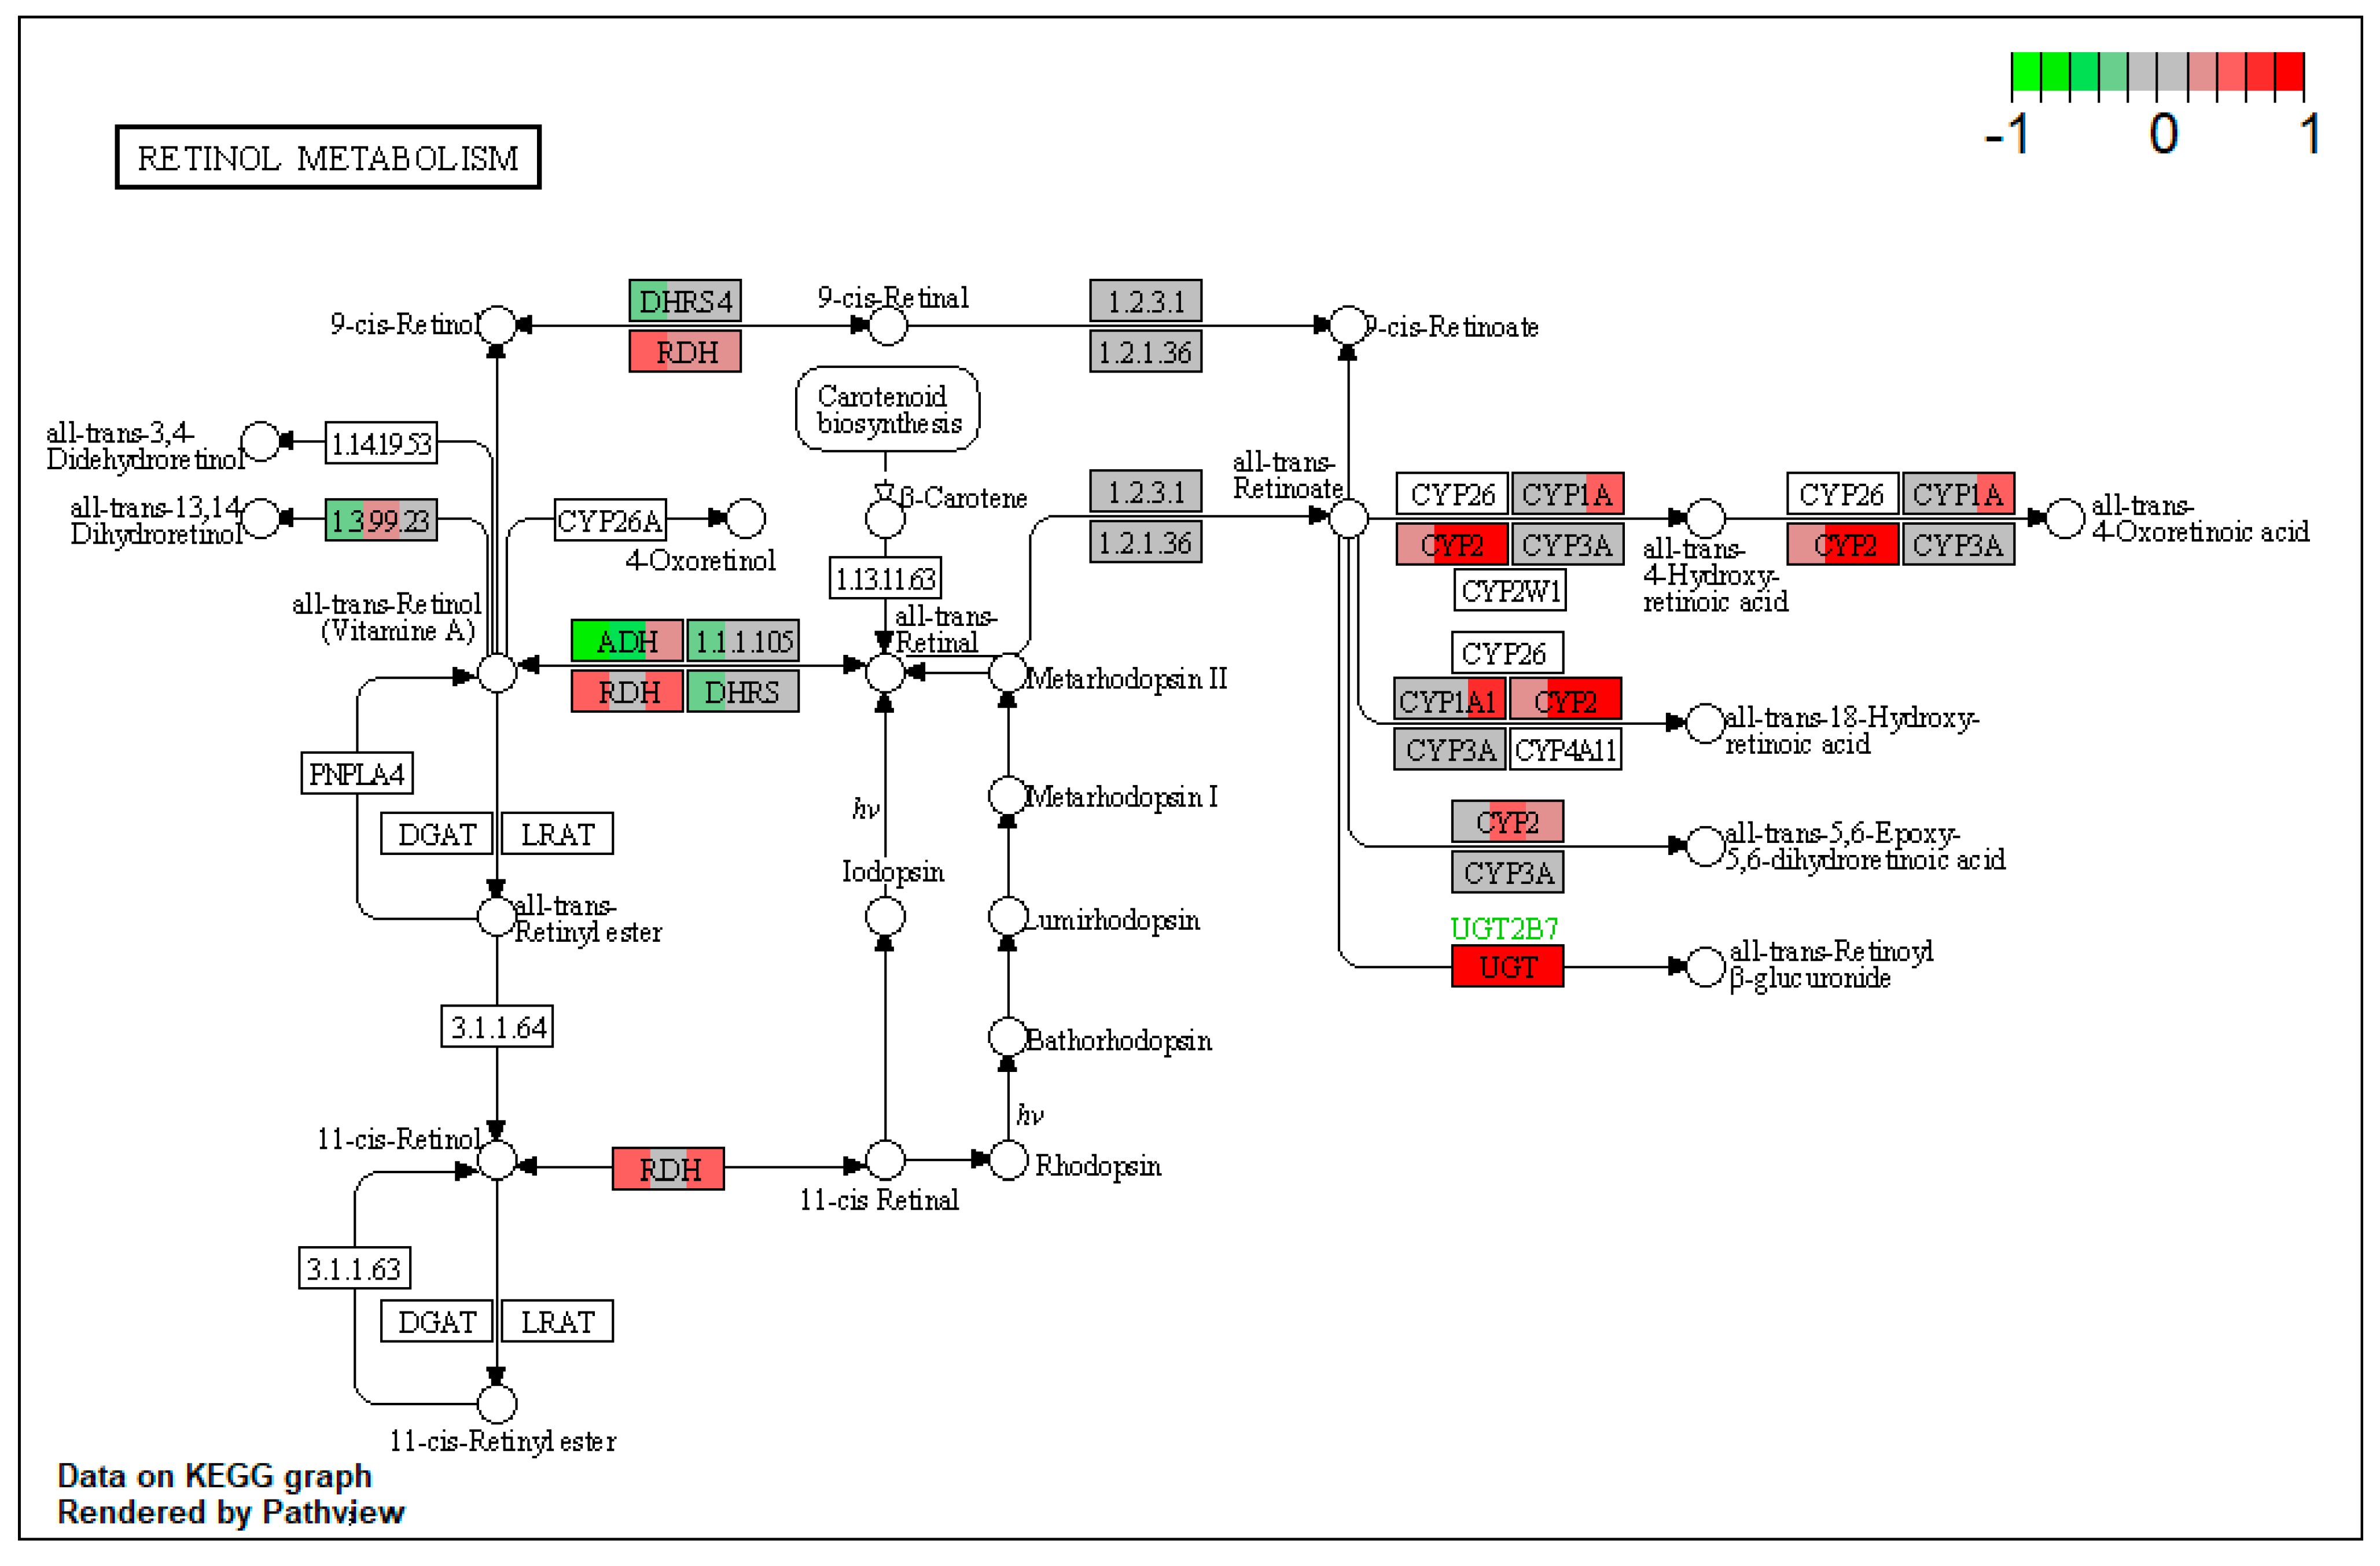
| ssc00830 | Retinol metabolism | 2.518952 | 0.046974 | 0.046974 | RDH11 | ALDH1A1 |
| ID | Term Description | FE | Lowest p | Highest p | Up_Regulated | Down_Regulated |
|---|---|---|---|---|---|---|
| ssc00640 | Propanoate metabolism | 19.85997 | 6.32 × 10⁻¹⁴ | 6.32 × 10⁻¹⁴ | ACSS2, ECHDC1 | BCKDHA, BCKDHB, DBT, EHHADH, PCCA, SUCLG1, SUCLG2, ALDH6A1 |
| ssc00020 | Citrate cycle (TCA cycle) | 11.91598 | 8.70 × 10⁻¹⁴ | 4.11 × 10⁻¹² | ACO2, IDH2, SUCLG1, SUCLG2, SDHA, SDHB, SDHC, PC, PCK2 | |
| ssc00190 | Oxidative phosphorylation | 6.355191 | 3.61 × 10⁻¹³ | 5.32 × 10⁻¹¹ | NDUFS1, NDUFS4, NDUFV1, NDUFA4, NDUFA9, SDHA, SDHB, SDHC | |
| ssc00100 | Steroid biosynthesis | 15.88798 | 4.51 × 10⁻¹³ | 4.51 × 10⁻¹³ | SQLE, LSS, TM7SF2, DHCR24, DHCR7, LIPA | |
| ssc04141 | Protein processing in endoplasmic reticulum | 3.851631 | 1.66 × 10⁻¹² | 1.66 × 10⁻¹² | HYOU1, DNAJC3, HSP90B1, GANAB, CANX, LMAN1, SEC13, SEC31A, BCAP31, RAD23B | RRBP1, VCP |
| ssc05208 | Chemical carcinogenesis—reactive oxygen species | 4.952097 | 2.01 × 10⁻¹⁰ | 1.37 × 10⁻⁸ | AS3MT | NDUFV1, NDUFA4, NDUFA9, NDUFS1, NDUFS4, SDHA, SDHB, SDHC, SLC25A4, CAT, EGFR |
| ssc04714 | Thermogenesis | 3.758446 | 1.17 × 10⁻⁹ | 6.44 × 10⁻⁸ | ACSL5, ACSL1 | NDUFS1, NDUFS4, NDUFV1, NDUFA4, NDUFA9, SDHA, SDHB, SDHC, SLC25A20 |
| ssc04146 | Peroxisome | 5.957992 | 6.36 × 10⁻⁸ | 6.36 × 10⁻⁸ | ABCD3, ACSL5, ACSL1, PRDX1 | EHHADH, ACAA1, IDH2, HAO1, CAT |
| ssc00071 | Fatty acid degradation | 9.670943 | 1.48 × 10⁻⁷ | 1.48 × 10⁻⁷ | ACSL5, ACSL1, ALDH3A2 | ACAA1, EHHADH, ADH4, ALDH7A1 |
| ssc00280 | Valine, leucine, and isoleucine degradation | 13.14867 | 5.18 × 10⁻⁷ | 5.18 × 10⁻⁷ | ALDH3A2, HMGCS1 | BCKDHA, BCKDHB, DBT, EHHADH, ACAA1, PCCA, ALDH6A1, ALDH7A1, MCCC1, AUH |
| ssc00330 | Arginine and proline metabolism | 7.221808 | 7.16 × 10⁻⁷ | 0.000508 | ALDH3A2 | AGMAT, ALDH7A1, MAOB, ALDH4A1 |
| ssc03320 | PPAR signaling pathway | 7.263076 | 1.41 × 10⁻⁶ | 1.41 × 10⁻⁶ | HMGCS1, APOC3, ACSL5, ACSL1 | CYP27A1, EHHADH, ACAA1, PCK2 |
| ssc00650 | Butanoate metabolism | 11.91598 | 1.49 × 10⁻⁶ | 1.49 × 10⁻⁶ | HMGCS1 | EHHADH, ACSM3, ACSM4, ALDH5A1, BDH1 |
| ssc00620 | Pyruvate metabolism | 8.66617 | 1.56 × 10⁻⁵ | 3.35 × 10⁻⁵ | ACSS2, ALDH3A2 | ADH4, ALDH7A1, PC, PCK2 |
| ssc00360 | Phenylalanine metabolism | 7.943989 | 2.98 × 10⁻⁵ | 2.98 × 10⁻⁵ | PAH | MAOB |
| ssc00500 | Starch and sucrose metabolism | 5.017256 | 3.68 × 10⁻⁵ | 3.68 × 10⁻⁵ | GYS2, GBE1, PYGL | |
| ssc00340 | Histidine metabolism | 7.943989 | 4.18 × 10⁻⁵ | 7.30 × 10⁻⁵ | ALDH3A2 | ALDH7A1, MAOB |
| ssc00380 | Tryptophan metabolism | 6.110761 | 4.74 × 10⁻⁵ | 4.74 × 10⁻⁵ | ALDH3A2 | EHHADH, MAOB, ALDH7A1, CAT |
| ssc00830 | Retinol metabolism | 3.344838 | 9.19 × 10⁻⁵ | 9.19 × 10⁻⁵ | ADH4, ALDH1A1 | |
| ssc00760 | Nicotinate and nicotinamide metabolism | 3.344838 | 0.00032 | 0.00032 | NAMPT | NNT |
| ssc00010 | Glycolysis / Gluconeogenesis | 4.539422 | 0.001231 | 0.002146 | ALDH3A2, ACSS2 | ADH4, ALDH7A1, PCK2 |
| ssc00410 | beta-Alanine metabolism | 7.476696 | 0.001402 | 0.001402 | ALDH3A2 | ALDH7A1, EHHADH, ALDH6A1 |
| ssc00630 | Glyoxylate and dicarboxylate metabolism | 8.826655 | 0.00168 | 0.00168 | ACSS2 | ACO2, PCCA, HAO1, CAT |
| ssc04961 | Endocrine and other factor-regulated calcium reabsorption | 3.530662 | 0.002297 | 0.002297 | AP2A1, AP2M1, CLTC | |
| ssc03010 | Ribosome | 1.765331 | 0.00234 | 0.00234 | RPS7 | RPS3 |
| ssc00053 | Ascorbate and aldarate metabolism | 12.71038 | 0.002765 | 0.003869 | ALDH3A2 | ALDH7A1 |
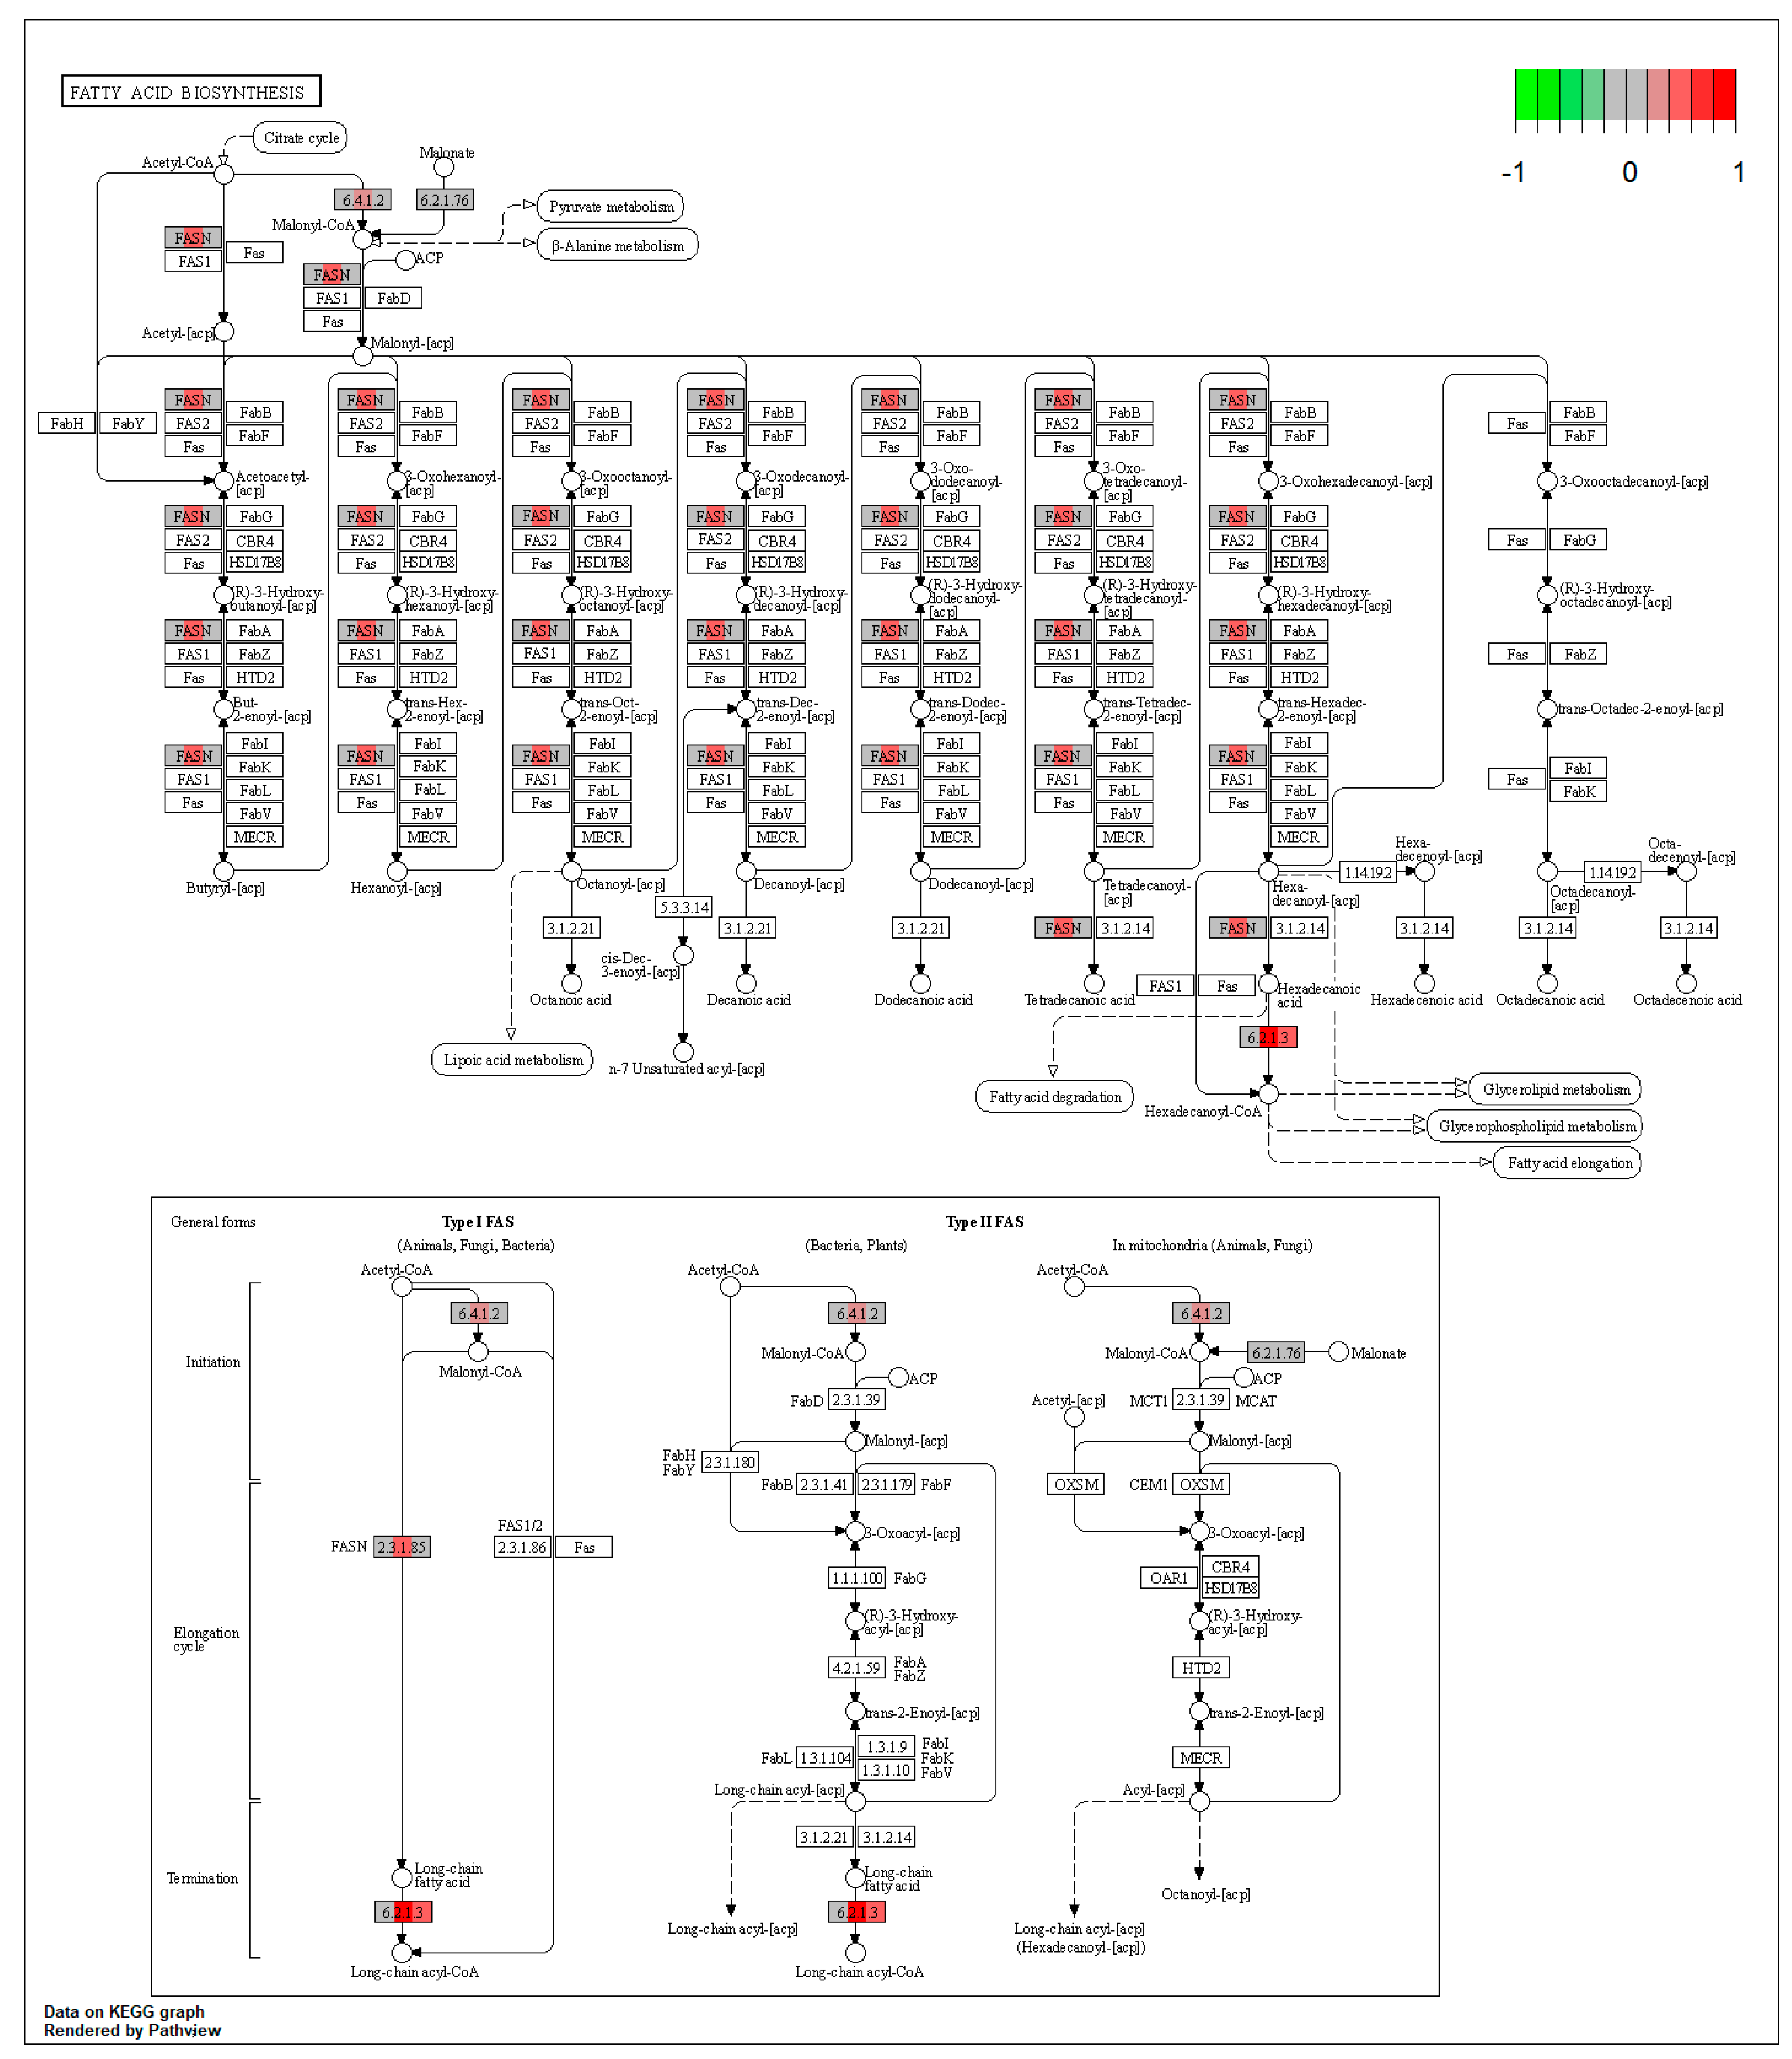
| ssc00061 | Fatty acid biosynthesis | 9.078845 | 0.003869 | 0.003869 | ACSL5, ACSL1 | |
| ssc00982 | Drug metabolism—cytochrome P450 | 7.943989 | 0.007731 | 0.010815 | ADH4, MAOB | |
| ssc00230 | Purine metabolism | 0.921042 | 0.01688 | 0.01688 | ENTPD8 | AK3 |
| ssc00350 | Tyrosine metabolism | 5.607522 | 0.024972 | 0.024972 | FAH | MAOB, ADH4 |
| ssc00220 | Arginine biosynthesis | 2.647996 | 0.025435 | 0.025435 | CPS1 | |
| ssc04142 | Lysosome | 2.978996 | 0.031794 | 0.031794 | LGMN, LIPA, CLTC, AP1G1, AP1M1 | SORT1 |
| ssc00592 | alpha-Linolenic acid metabolism | 3.971995 | 0.033874 | 0.033874 | ACAA1 | |
| ssc00900 | Terpenoid backbone biosynthesis | 3.177596 | 0.045305 | 0.045305 | HMGCS1 |
| ID | Term Description | FE | Lowest p | Highest p | Up_Regulated | Down_Regulated |
|---|---|---|---|---|---|---|
| ssc00071 | Fatty acid degradation | 12.96544 | 5.99 × 10⁻¹⁴ | 5.99 × 10⁻¹⁴ | ACSL5, ALDH3A2 | ACAA1, EHHADH, ACOX1, ACADM, ACADSB, CPT2, ECI2, ALDH7A1 |
| ssc00190 | Oxidative phosphorylation | 6.709615 | 1.91 × 10⁻¹³ | 1.91 × 10⁻¹³ | ATP6V0D1 | NDUFS1, NDUFS4, NDUFV1, NDUFA4, NDUFA6, SDHA, SDHB, SDHC |
| ssc00280 | Valine, leucine, and isoleucine degradation | 11.31123 | 5.21 × 10⁻¹³ | 5.21 × 10⁻¹³ | ALDH3A2 | BCAT2, BCKDHA, DBT, ACADM, ACADSB, EHHADH, ACAA1, PCCA, ALDH7A1, MCCC1 |
| ssc05208 | Chemical carcinogenesis—reactive oxygen species | 5.421911 | 1.07 × 10⁻¹⁰ | 1.07 × 10⁻¹⁰ | AS3MT, CYP1A1, MAPK1 | NDUFV1, NDUFA4, NDUFA6, NDUFS1, NDUFS4, SDHA, SDHB, SDHC, SLC25A4, SOD1, CYP1A2 |
| ssc04714 | Thermogenesis | 3.527157 | 6.23 × 10⁻¹⁰ | 6.23 × 10⁻¹⁰ | ACSL5 | NDUFS1, NDUFS4, NDUFV1, NDUFA4, NDUFA6, SDHA, SDHB, SDHC, CPT2, SLC25A20 |
| ssc03040 | Spliceosome | 2.451001 | 1.33 × 10⁻⁹ | 8.09 × 10⁻⁸ | DDX39B, SNRNP70, HNRNPM, SRSF1, SRSF3, SRSF7 | |
| ssc00980 | Metabolism of xenobiotics by cytochrome P450 | 9.940171 | 4.13 × 10⁻⁹ | 4.13 × 10⁻⁹ | CYP1A1, HSD11B1 | CYP1A2 |
| ssc00020 | Citrate cycle (TCA cycle) | 6.212607 | 5.01 × 10⁻⁹ | 5.01 × 10⁻⁹ | SDHA, SDHB, SDHC, PC, PCK2 | |
| ssc04146 | Peroxisome | 6.212607 | 5.59 × 10⁻⁹ | 5.59 × 10⁻⁹ | ACSL5, XDH | HACL1, ACOX1, EHHADH, ACAA1, PECR, ECI2, HAO1, SOD1 |
| ssc00640 | Propanoate metabolism | 11.18269 | 6.16 × 10⁻⁹ | 6.16 × 10⁻⁹ | ECHDC1 | BCKDHA, DBT, ACOX1, EHHADH, PCCA |
| ssc04530 | Tight junction | 2.899217 | 6.31 × 10⁻⁹ | 6.31 × 10⁻⁹ | HSPA4, EZR, MSN, ACTR3, ARPC1B, TUBA1A | MYL6 |
| ssc00140 | Steroid hormone biosynthesis | 6.39011 | 3.28 × 10⁻⁸ | 3.28 × 10⁻⁸ | HSD11B1, CYP1A1 | CYP1A2 |
| ssc00380 | Tryptophan metabolism | 8.0286 | 9.21 × 10⁻⁸ | 9.21 × 10⁻⁸ | KYAT3, ALDH3A2, CYP1A1 | EHHADH, MAOB, ALDH7A1, CYP1A2 |
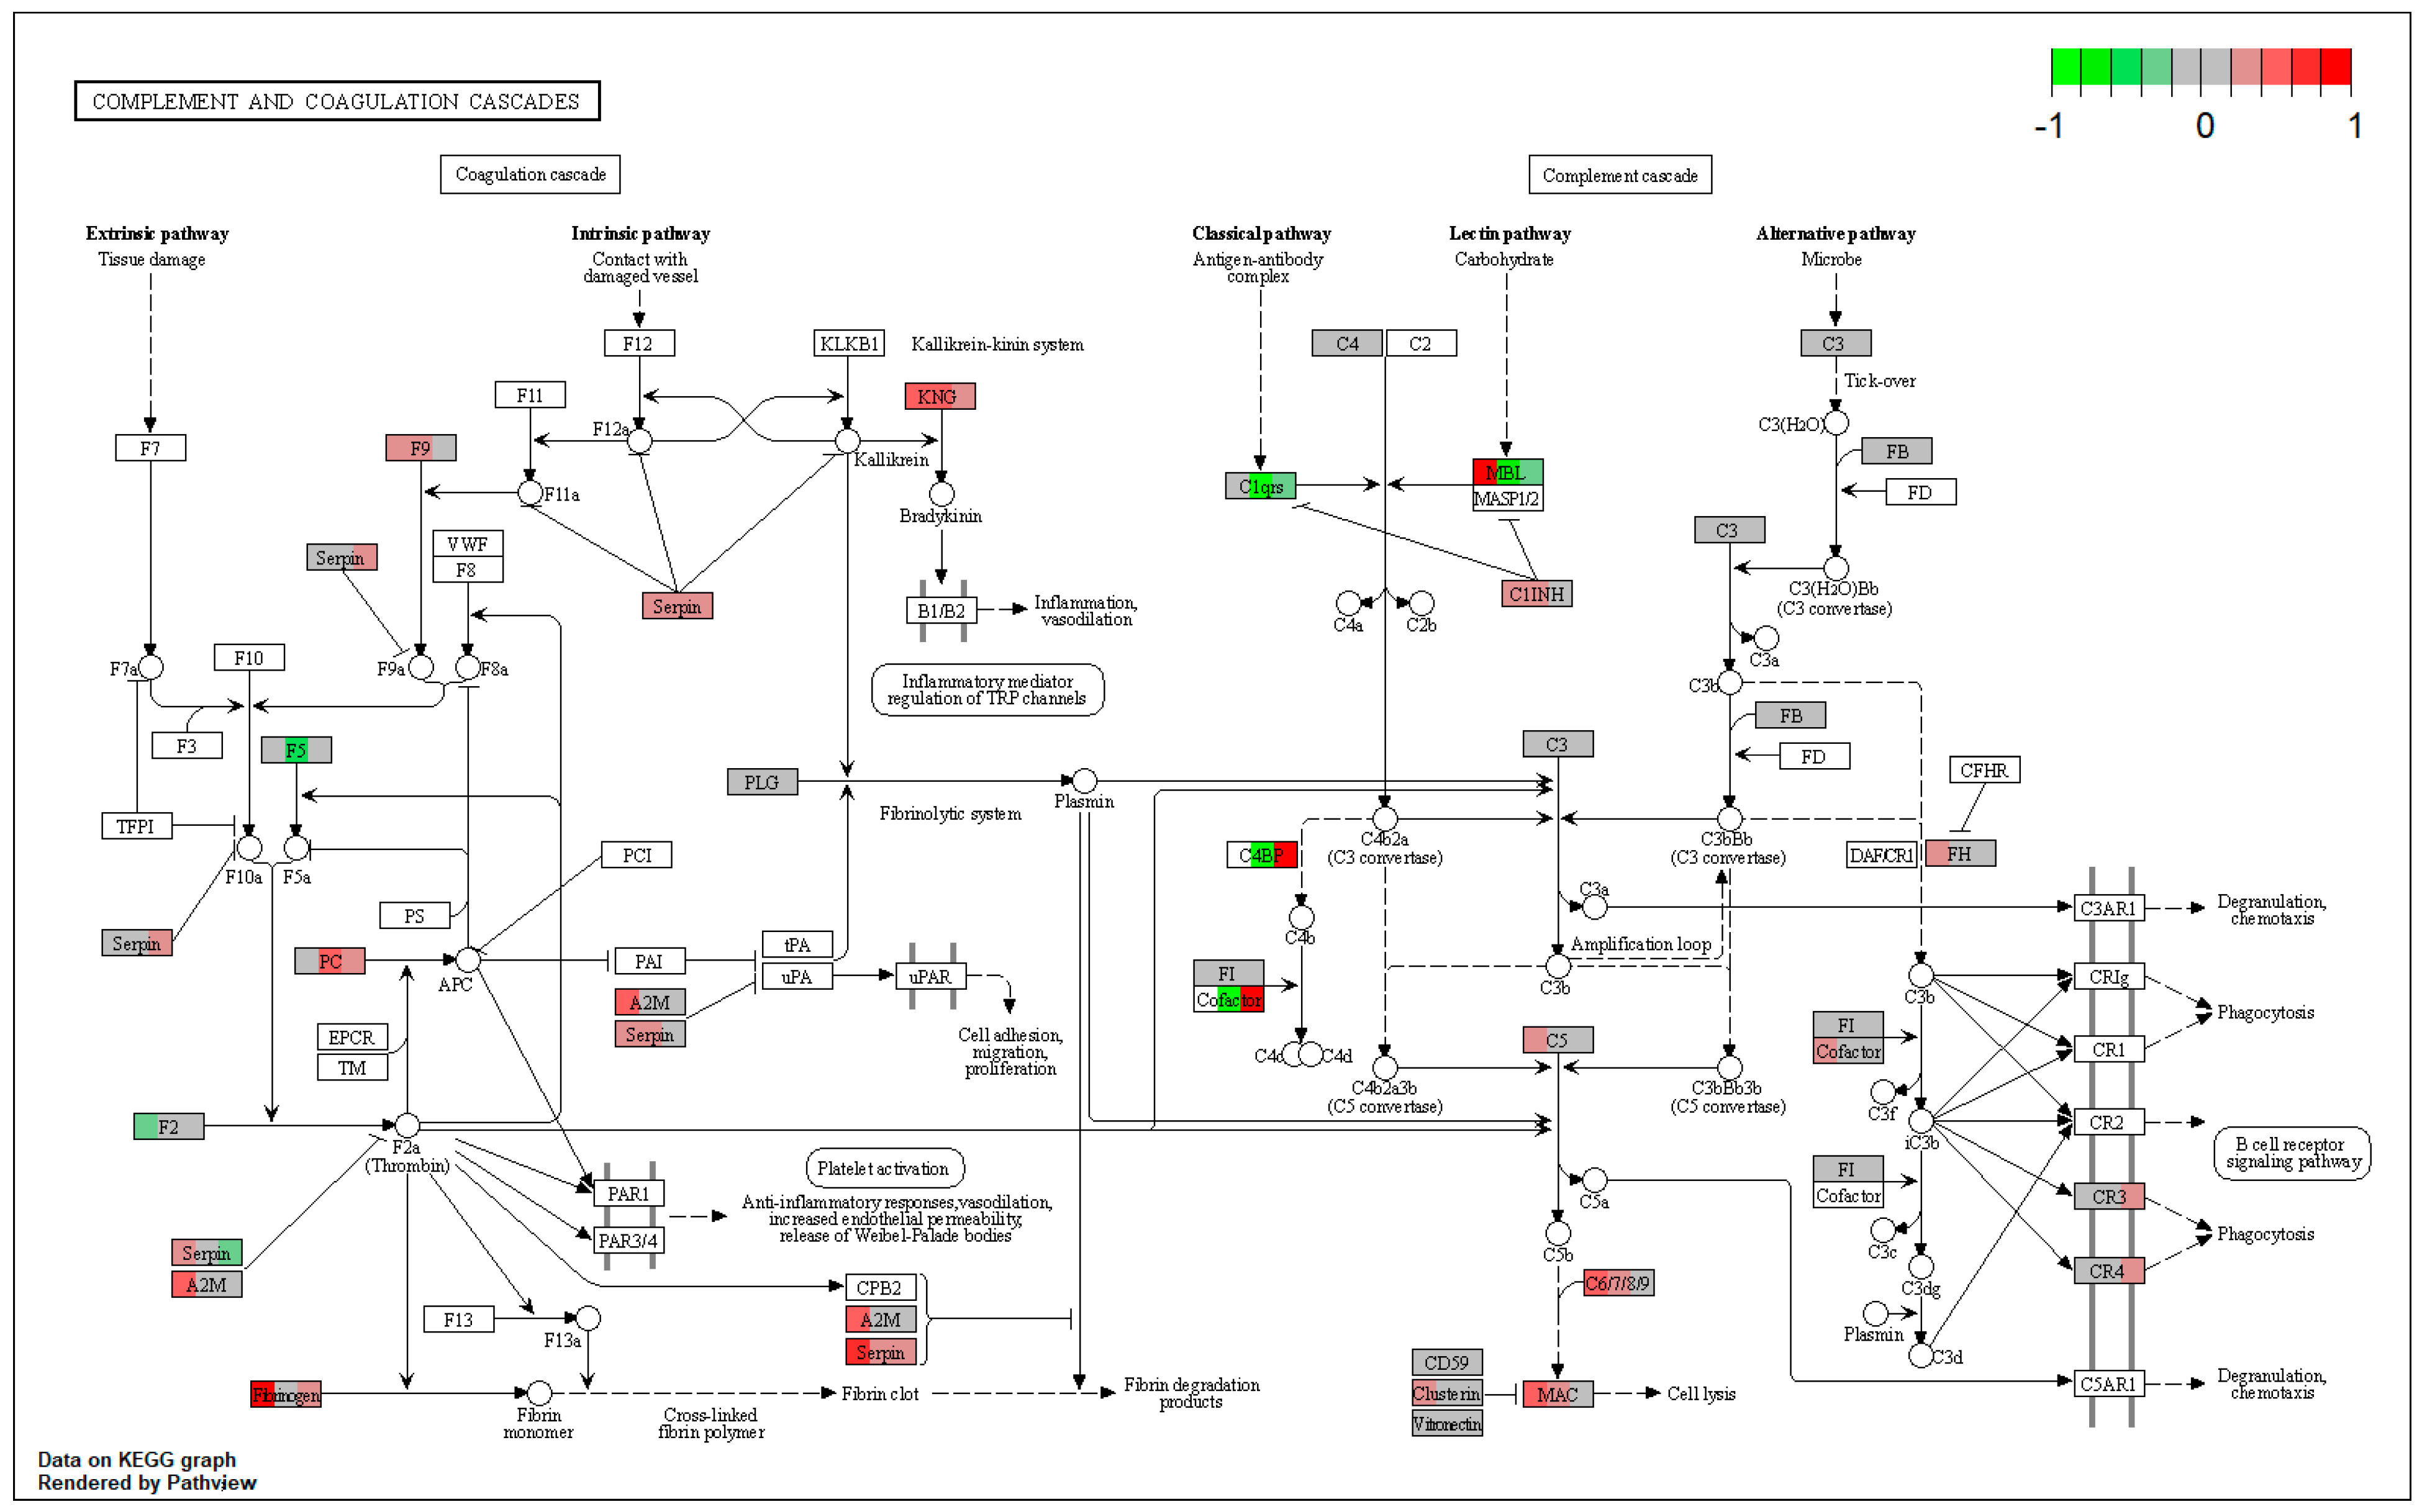
| ssc04610 | Complement and coagulation cascades | 2.485043 | 1.92 × 10⁻⁶ | 1.92 × 10⁻⁶ | PROC, KNG1 | SERPIND1 |
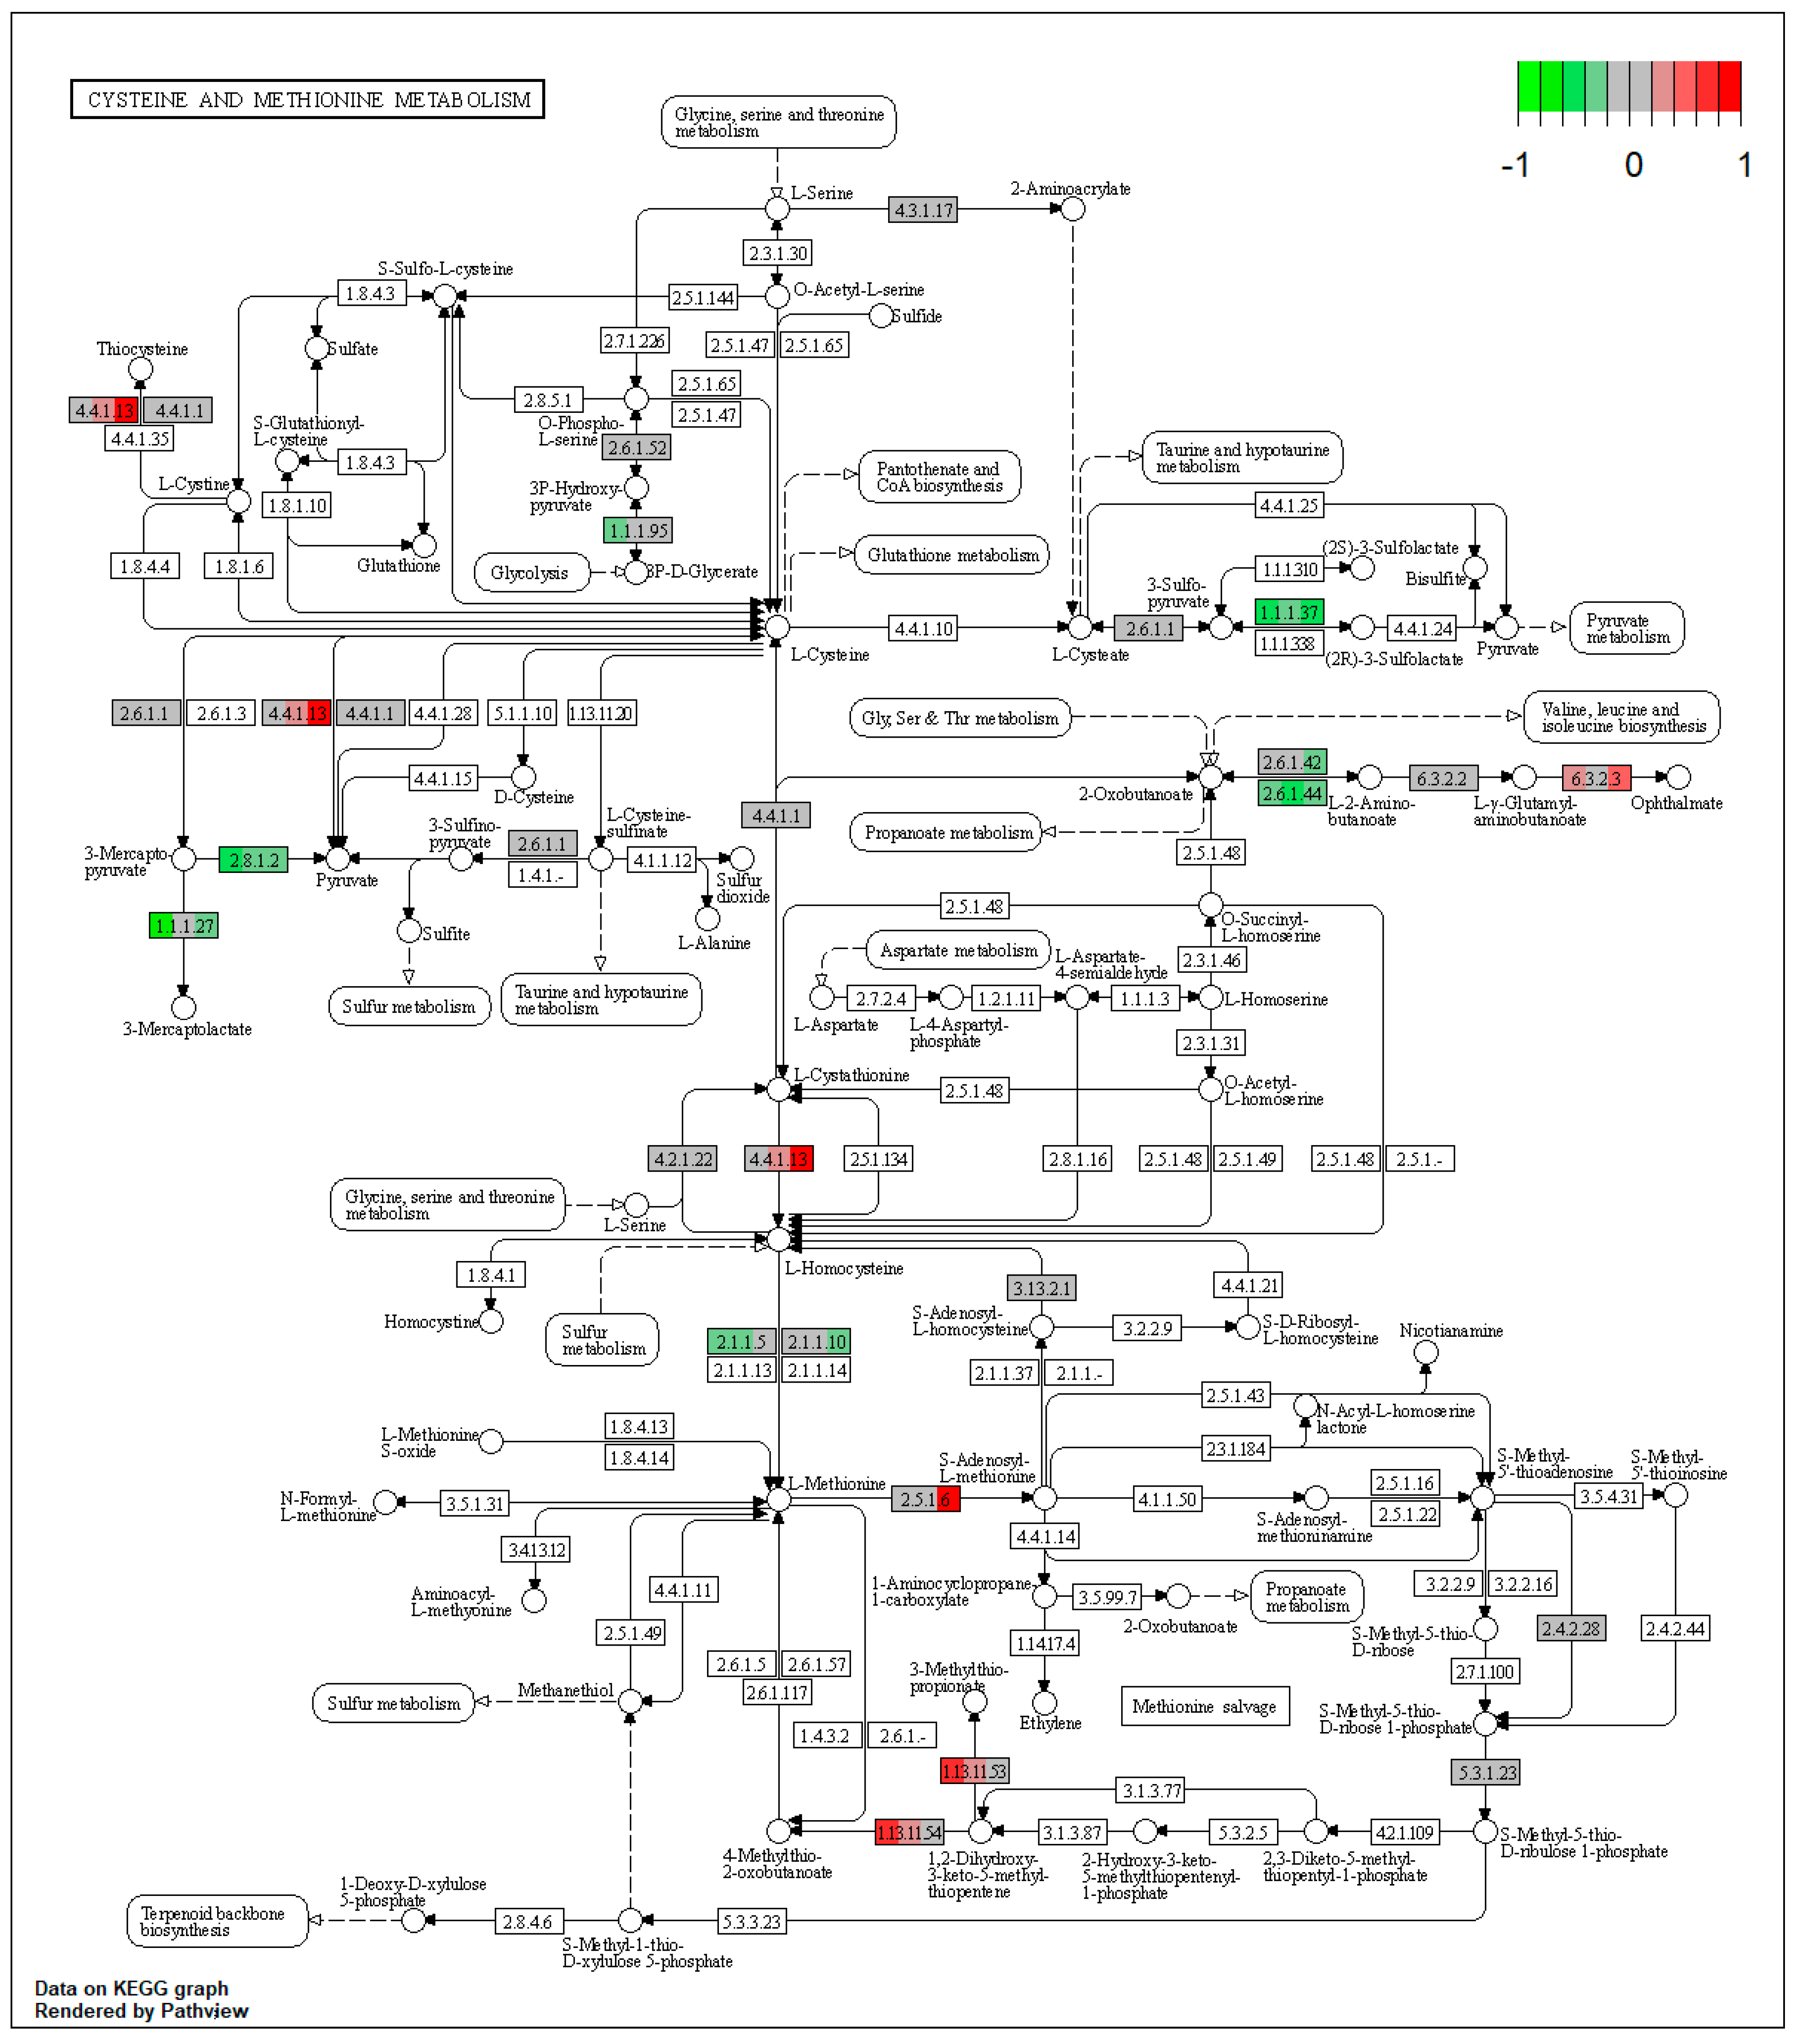
| ssc00270 | Cysteine and methionine metabolism | 3.195055 | 2.00 × 10⁻⁶ | 2.00 × 10⁻⁶ | KYAT3 | BCAT2, TST |
| ssc04141 | Protein processing in endoplasmic reticulum | 3.614608 | 2.81 × 10⁻⁶ | 2.81 × 10⁻⁶ | RRBP1, DNAJB11, CANX, PREB, SEC13, SEC31A, SEC23A, SEC24C, PDIA6, BCAP31, RAD23B | VCP |
| ssc00830 | Retinol metabolism | 4.708502 | 5.27 × 10⁻⁶ | 5.27 × 10⁻⁶ | DHRS3, CYP1A1 | CYP1A2 |
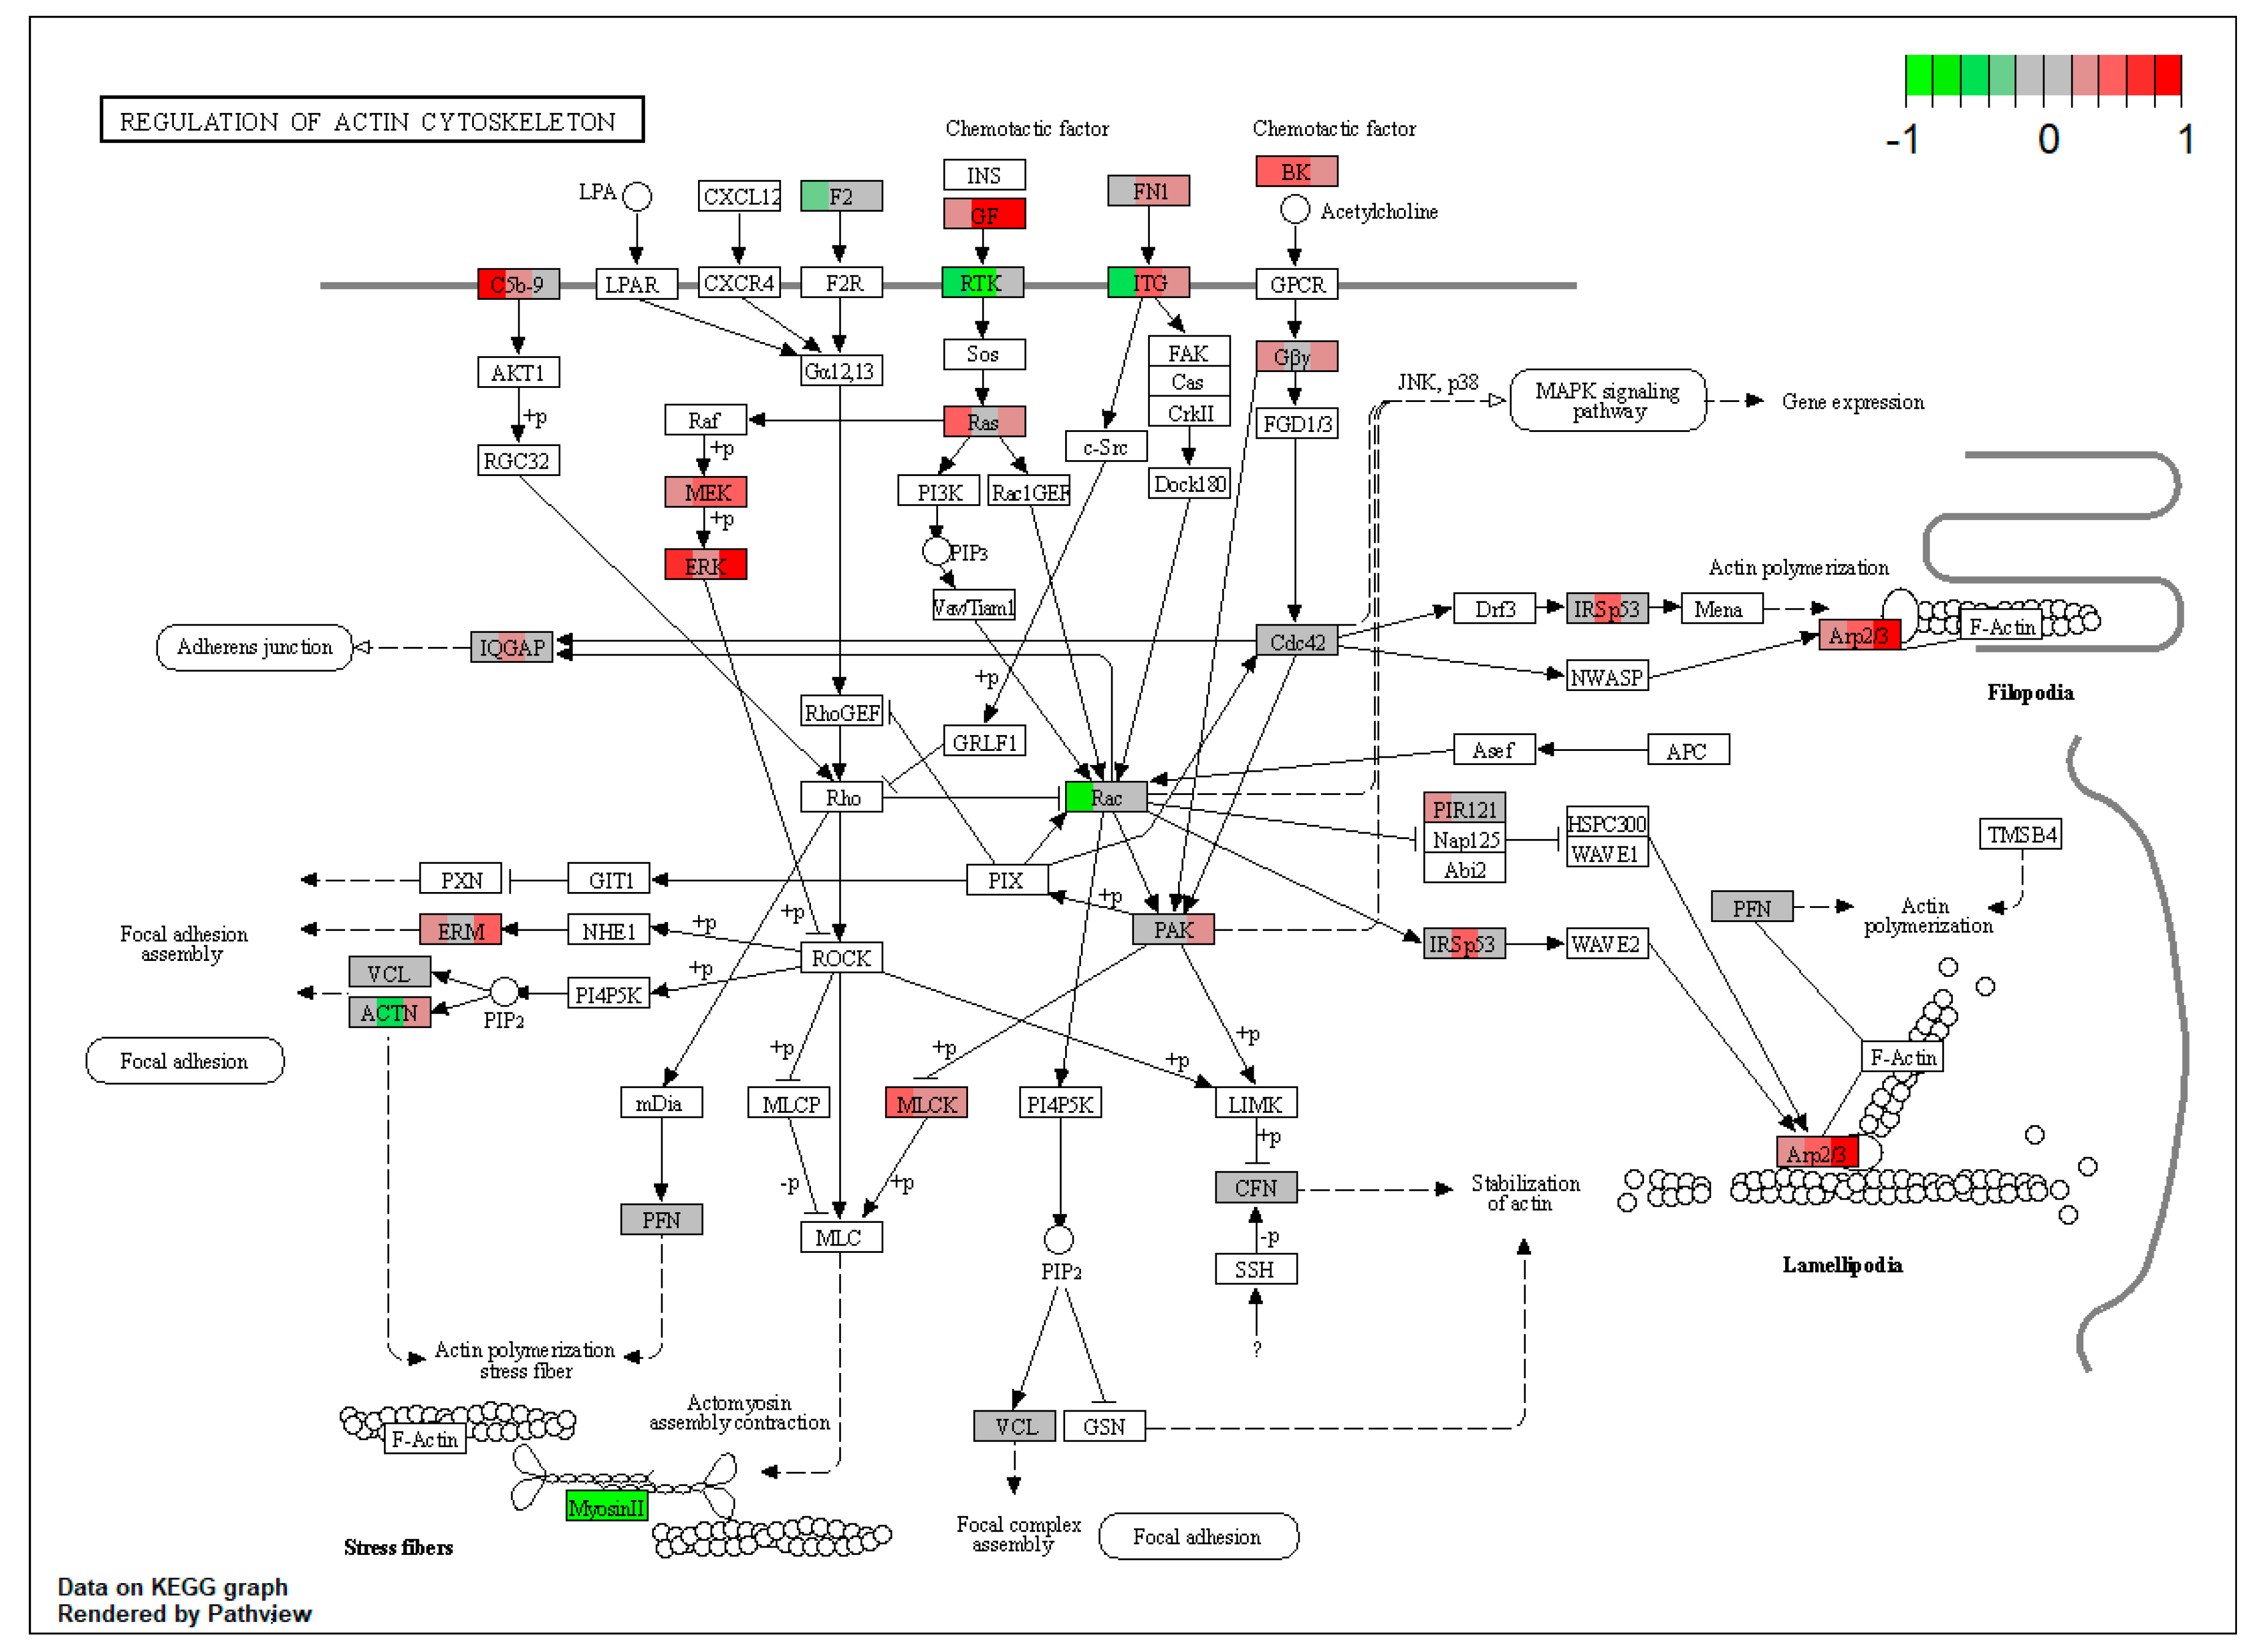
| ssc04810 | Regulation of actin cytoskeleton | 2.274446 | 2.01 × 10⁻⁵ | 2.01 × 10⁻⁵ | FN1, KNG1, MAPK1, PAK2, MYLK, ACTR3, ARPC1B, EZR, MSN | |
| ssc00340 | Histidine metabolism | 7.455128 | 2.09 × 10⁻⁵ | 2.09 × 10⁻⁵ | ALDH3A2 | ALDH7A1, MAOB |
| ssc00982 | Drug metabolism—cytochrome P450 | 7.455128 | 6.37 × 10⁻⁵ | 6.37 × 10⁻⁵ | MAOB, CYP1A2 | |
| ssc00330 | Arginine and proline metabolism | 5.421911 | 0.000146 | 0.000146 | ALDH3A2 | AGMAT, ALDH7A1, MAOB |
| ssc00620 | Pyruvate metabolism | 5.421911 | 0.000146 | 0.000146 | ALDH3A2 | ALDH7A1, PC, PCK2 |
| ssc04142 | Lysosome | 3.727564 | 0.000504 | 0.000504 | ATP6V0D1, PSAP, LAMP1, CLTC, AP1G1, AP1M1, AP1S1 | SORT1 |
| ssc03320 | PPAR signaling pathway | 7.668132 | 0.000593 | 0.000593 | ACSL5 | APOC3, CYP27A1, EHHADH, ACAA1, ACOX1, CPT2, ACADM, PCK2 |
| ssc00010 | Glycolysis/Gluconeogenesis | 3.408059 | 0.000618 | 0.000618 | ALDH3A2 | PFKL, ALDH7A1, PCK2 |
| ssc00053 | Ascorbate and aldarate metabolism | 11.92821 | 0.001844 | 0.001844 | ALDH3A2 | ALDH7A1 |
| ssc00410 | beta-Alanine metabolism | 7.016591 | 0.003543 | 0.003543 | ALDH3A2 | ALDH7A1, EHHADH, ACOX1 |
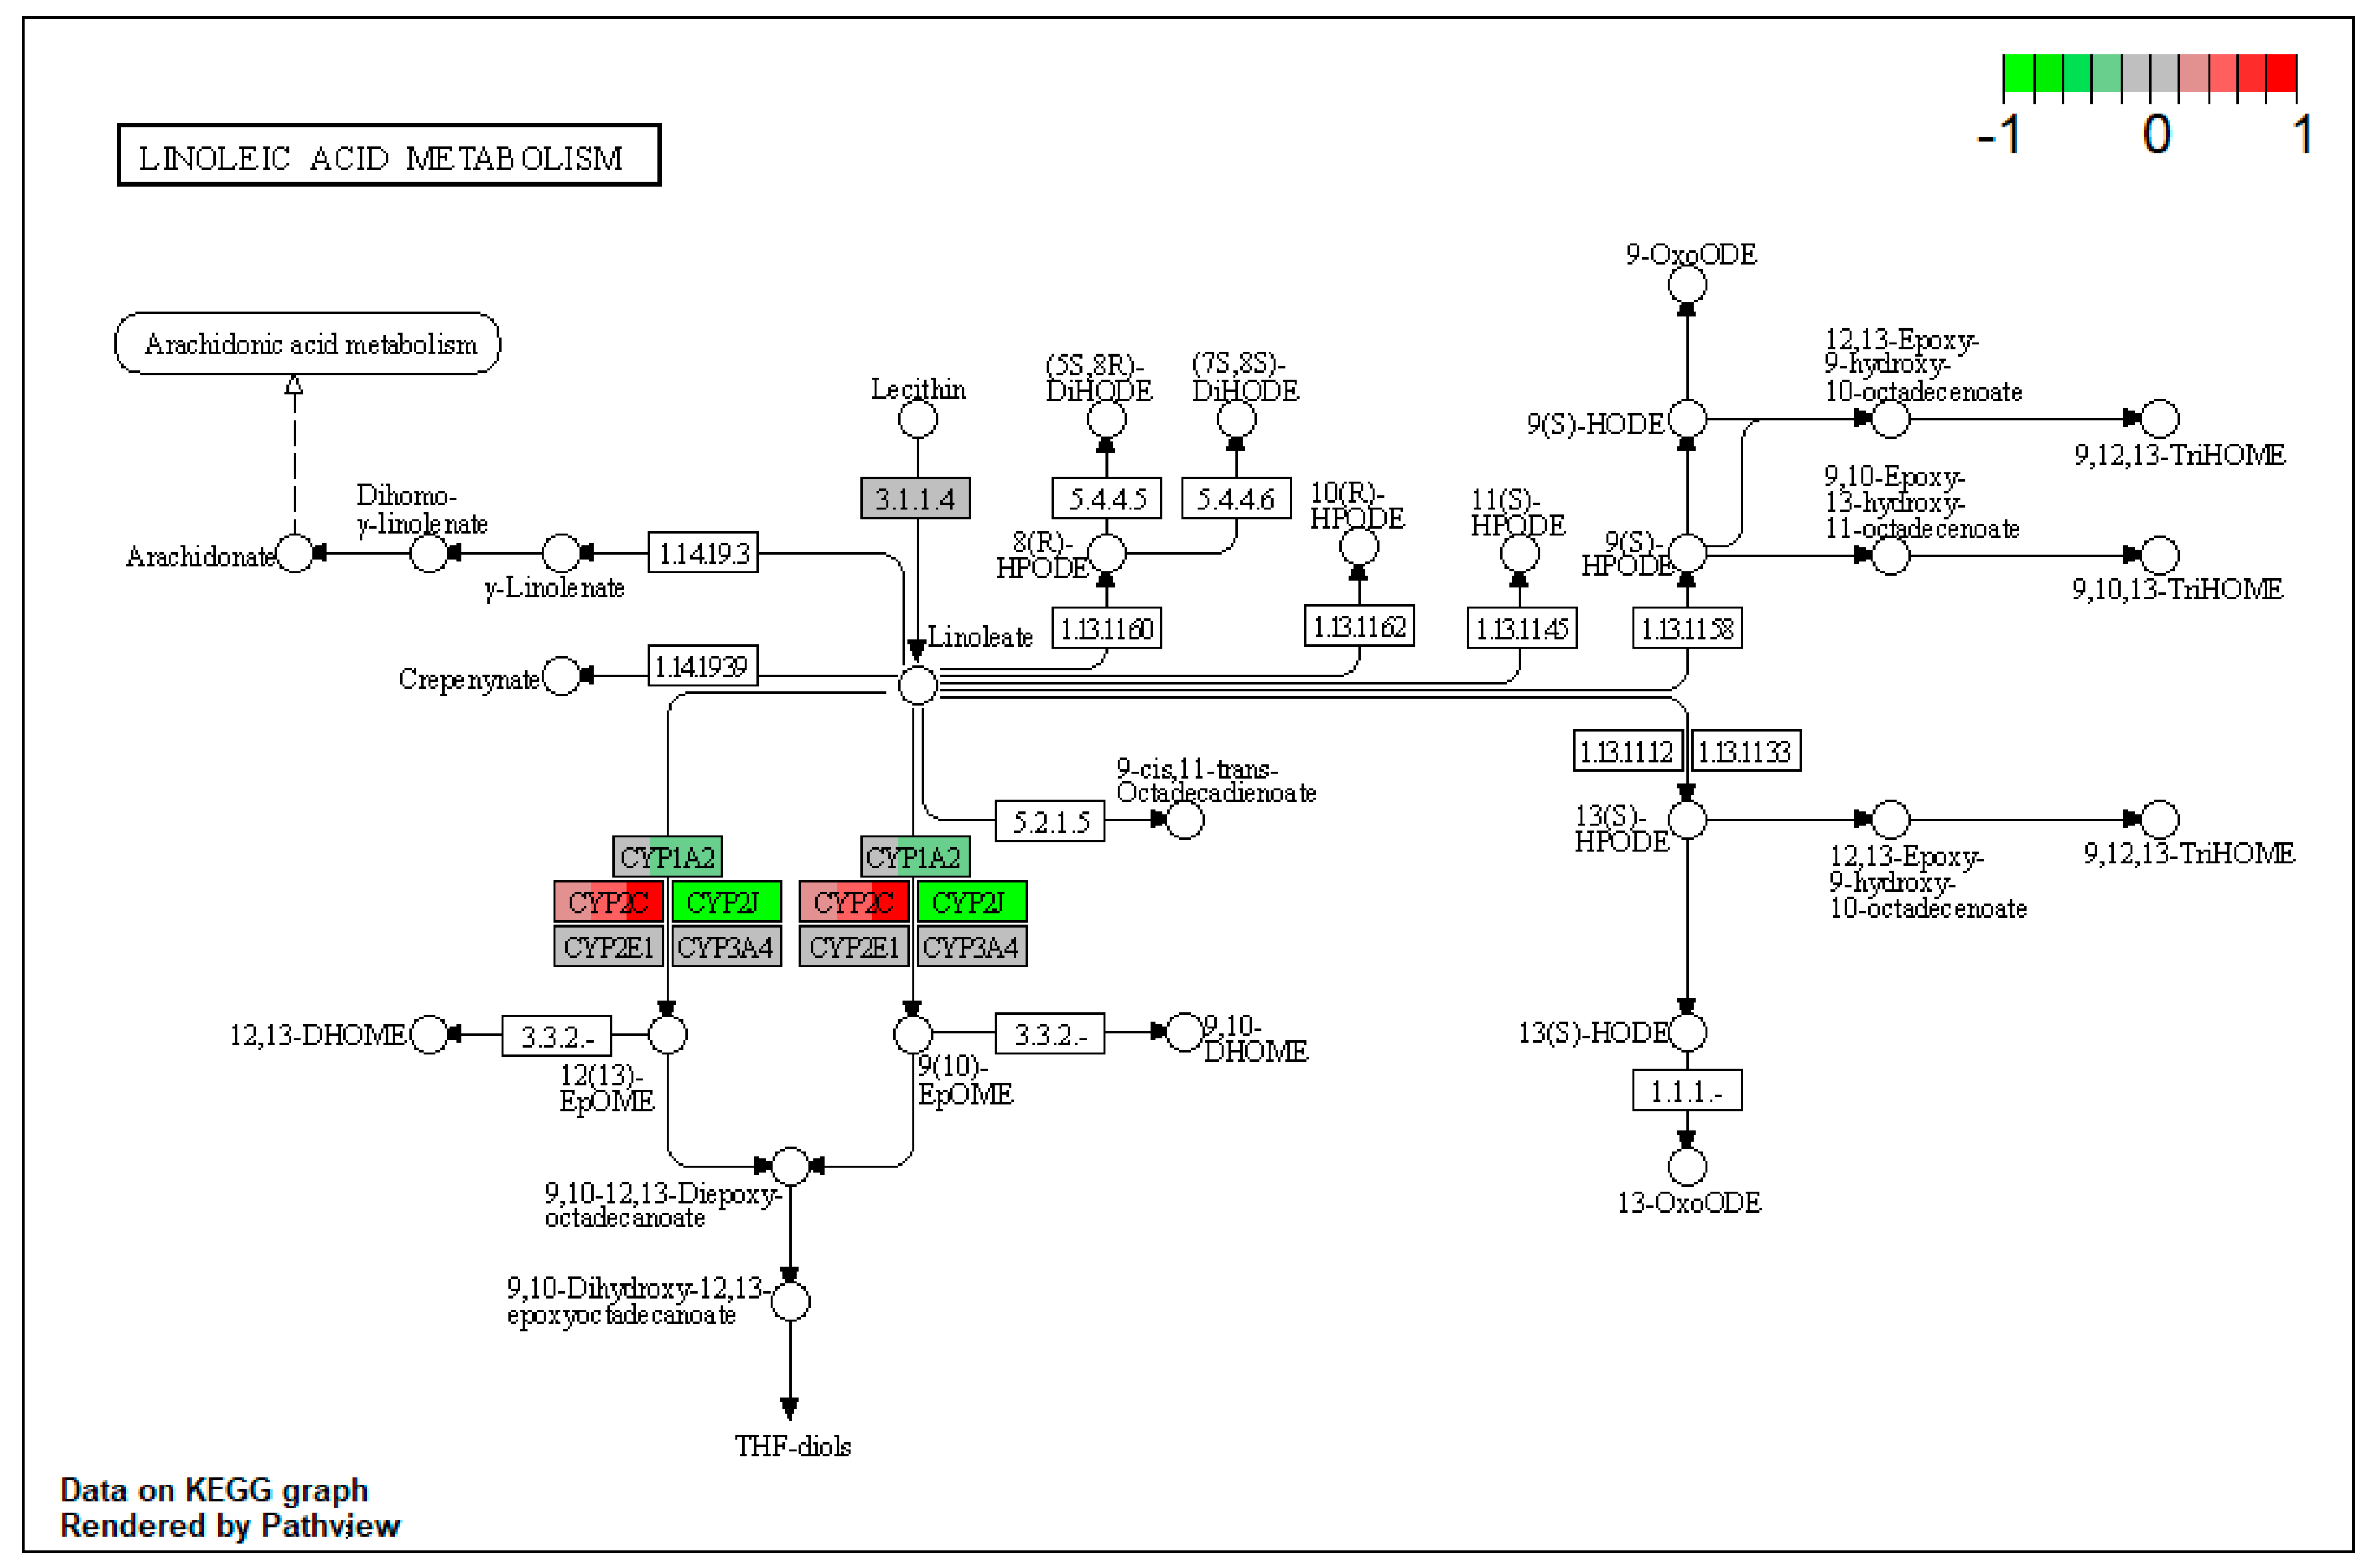
| ssc00591 | Linoleic acid metabolism | 4.260073 | 0.003869 | 0.003869 | CYP1A2 | |
| ssc00230 | Purine metabolism | 1.296544 | 0.004906 | 0.004906 | ENTPD8, XDH, AK1 | |
| ssc03010 | Ribosome | 1.656695 | 0.005569 | 0.005569 | RPS7, RPL29 | |
| ssc04110 | Cell cycle | 0.828348 | 0.00558 | 0.00558 | YWHAB, YWHAQ | |
| ssc04390 | Hippo signaling pathway | 0.764629 | 0.007107 | 0.007107 | YWHAB, YWHAQ | |
| ssc04670 | Leukocyte transendothelial migration | 1.146943 | 0.007183 | 0.007183 | EZR, MSN | |
| ssc00360 | Phenylalanine metabolism | 3.727564 | 0.007731 | 0.007731 | MAOB | |
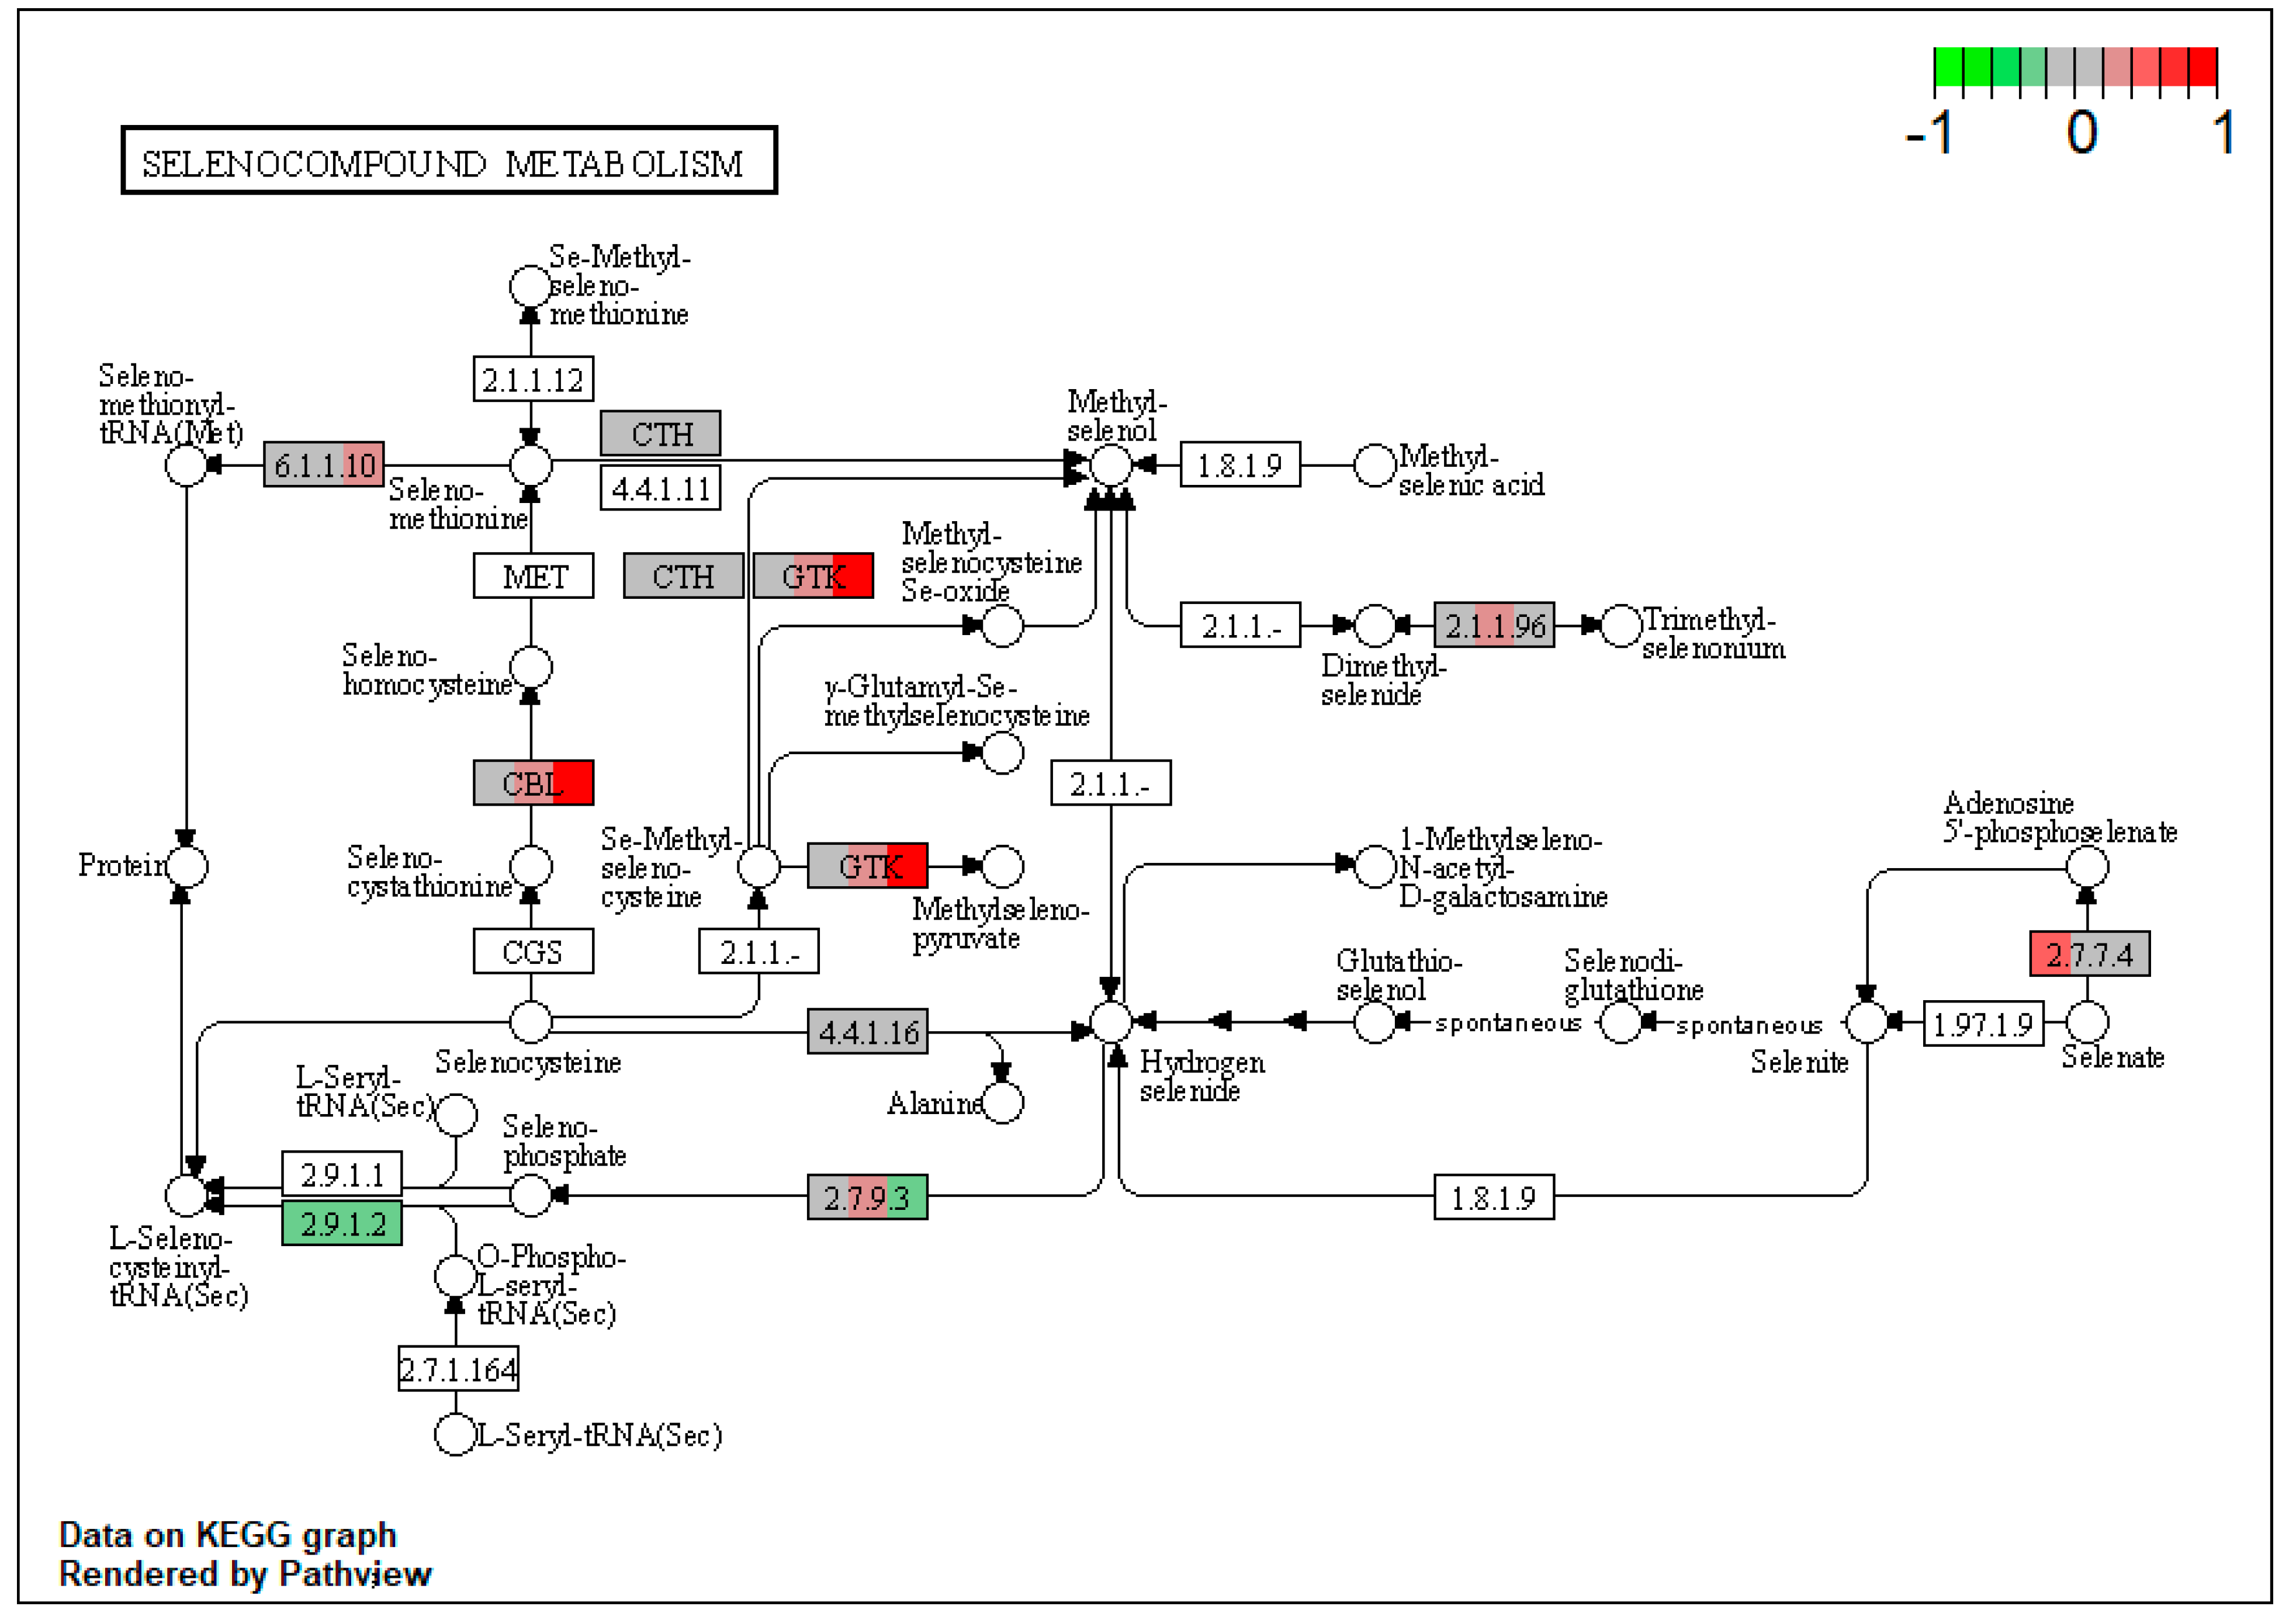
| ssc00450 | Selenocompound metabolism | 3.727564 | 0.007731 | 0.007731 | KYAT3 | |
| ssc00100 | Steroid biosynthesis | 4.970085 | 0.01214 | 0.01214 | TM7SF2, DHCR7 | |
| ssc00220 | Arginine biosynthesis | 4.970085 | 0.018189 | 0.018189 | ACY1 | CPS1 |
| ssc05205 | Proteoglycans in cancer | 1.114786 | 0.018403 | 0.018403 | MAPK1, FN1, EZR, MSN | |
| ssc00310 | Lysine degradation | 5.141468 | 0.018658 | 0.018658 | ALDH3A2 | AASS, ALDH7A1, EHHADH, PLOD3 |
| ssc00350 | Tyrosine metabolism | 1.754148 | 0.024972 | 0.024972 | MAOB | |
| ssc00630 | Glyoxylate and dicarboxylate metabolism | 3.31339 | 0.042049 | 0.042049 | PCCA, HAO1 |
| Protein Name | Log2FC A vs. C | Log2FC M vs. C | Log2FC AM vs. C | FDR A vs. C | FDR M vs. C | FDR AM vs. C |
|---|---|---|---|---|---|---|
| PRDX3 (peroxiredoxin 3) | 1.258614154 | 1.529266 | 1.193005 | 2.55 × 10⁻⁵ | 6.32 × 10⁻⁷ | 7.74 × 10⁻⁵ |
| AGL (amylo-alpha-1, 6-glucosidase, 4-alpha-glucanotransferase) | 0.815832392 | 1.407128 | 1.036078 | 0.000266 | 8.55 × 10⁻⁹ | 9.87 × 10⁻⁶ |
| PYGL (glycogen phosphorylase L) | 0.486029891 | 1.451883 | 1.050166 | 0.036186 | 3.52 × 10⁻⁷ | 0.000158 |
| CYP2C301 (cytochrome P450 family 2 subfamily C member 301) | 0.85546147 | 0.416917 | 1.181411 | 0.034991 | 0.501544 | 0.002352 |
| PPP4R4 (protein phosphatase 4 regulatory subunit 4) | 1.609917423 | 0.978918 | 0.55693 | 0.001337 | 0.077077 | 0.346479 |
| COL18A1 (collagen, type XVIII, alpha 1) | 1.065421972 | 0.62971 | 0.11707 | 2.33 × 10⁻¹⁰ | 1.56 × 10⁻⁵ | 0.51763 |
| UBASH3A (ubiquitin-associated and SH3 domain containing A) | 1.079719585 | 0.262833 | 0.51158 | 0.000499 | 0.608022 | 0.160859 |
| CNTRL (centriolin) | 0.500587122 | −0.07292 | 1.383758 | 0.271479 | 1 | 0.001199 |
| MX1 (MX dynamin like GTPase 1) | −0.188707549 | 0.101622 | 1.40425 | 0.390073 | 0.011692 | 0.004935 |
| PRCP (prolylcarboxypeptidase) | 0.384300517 | 0.445297 | 1.038305 | 0.36654 | 0.502516 | 0.015257 |
| RPL10 (ribosomal protein L10) | −0.115559617 | 0.484204 | 2.293986 | 0.962586 | 0.461103 | 0.017532 |
| RTN3 (reticulon 3) | 0.150853392 | 0.494111 | 1.48471 | 0.539651 | 0.021141 | 1.35 × 10⁻⁶ |
| FGF22 (fibroblast growth factor 22) | 0.340986241 | 1.202735 | 1.203546 | 0.449717 | 0.007073 | 0.003019 |
| CFAP119 (cilia and flagella-associated protein 119) | −1.049586098 | −0.36016 | −0.02325 | 0.004013 | 0.428574 | 1 |
| BDH1 (3-hydroxybutyrate dehydrogenase 1) | −1.137408133 | −1.149 | −0.8668 | 1.55 × 10⁻¹⁰ | 3.17 × 10⁻¹¹ | 8.77 × 10⁻⁸ |
| MPC2 (mitochondrial pyruvate carrier 2) | −0.589203615 | −1.03423 | −0.85404 | 0.001754 | 2.40 × 10⁻⁷ | 1.59 × 10⁻⁵ |
| NDUFA6 (NADH:ubiquinone oxidoreductase subunit A6) | −0.822450977 | −0.85757 | −1.07614 | 0.034965 | 0.080535 | 0.014266 |
| NDUFA8 (NADH:ubiquinone oxidoreductase subunit A8) | −0.814210357 | −0.78726 | −1.09126 | 0.018491 | 0.083708 | 0.007074 |
| LOC100524873 (cytochrome b-c1 complex subunit 6, mt) | −1.052389525 | −0.90247 | −0.58203 | 0.011395 | 0.016436 | 0.072888 |
| COX6A1 (cytochrome c oxidase subunit 6A1) | −1.115583202 | −1.3148 | −1.15173 | 0.003131 | 0.000488 | 0.01032 |
| ATP5PB (ATP synthase peripheral stalk-membrane subunit b) | −0.831488452 | −1.01989 | −0.81775 | 9.84 × 10⁻⁶ | 1.52 × 10⁻⁷ | 1.80 × 10⁻⁵ |
| ATP5PD (ATP synthase peripheral stalk subunit d) | −1.045104464 | −1.24739 | −0.76175 | 3.21 × 10⁻⁸ | 2.15 × 10⁻¹⁰ | 2.06 × 10⁻⁵ |
| SDHC (succinate dehydrogenase complex subunit C) | −0.885137794 | −1.01039 | −0.95537 | 1.26 × 10⁻⁷ | 4.76 × 10⁻⁹ | 4.18 × 10⁻⁸ |
| COX4I1 (cytochrome c oxidase subunit 4I1) | −0.822175296 | −1.09644 | −0.81609 | 2.02 × 10⁻⁸ | 7.46 × 10⁻¹² | 3.34 × 10⁻⁸ |
| ATP5MG (ATP synthase membrane subunit g) | −0.882912451 | −1.03223 | −0.8393 | 5.48 × 10⁻⁸ | 7.61 × 10⁻¹⁰ | 2.24 × 10⁻⁷ |
| ATP5F1C (ATP synthase F1 subunit gamma) | −1.118273993 | −1.23754 | −1.06335 | 1.69 × 10⁻⁸ | 6.35 × 10⁻¹⁰ | 6.40 × 10⁻⁸ |
| ATP5F1A (ATP synthase F1 subunit alpha) | −0.934445513 | −1.11394 | −0.90318 | 5.63 × 10⁻⁸ | 5.63 × 10⁻¹⁰ | 1.78 × 10⁻⁷ |
| ATP5F1B (ATP synthase F1 subunit beta) | −0.957688895 | −1.11768 | −0.93965 | 1.57 × 10⁻⁹ | 1.94 × 10⁻¹¹ | 5.81 × 10⁻⁹ |
| ATP5F1D (ATP synthase F1 subunit delta) | −0.82234898 | −1.05501 | −0.77117 | 9.57 × 10⁻⁷ | 2.63 × 10⁻⁹ | 4.83 × 10⁻⁶ |
| ATP5MF (ATP synthase membrane subunit f) | −0.824097973 | −1.14139 | −0.83169 | 0.000149 | 4.42 × 10⁻⁷ | 0.000163 |
| ATP5ME (ATP synthase membrane subunit e) | −0.780345693 | −1.09737 | −0.82017 | 0.000598 | 3.42 × 10⁻⁶ | 0.000417 |
| SIGLEC1 (sialic acid binding Ig like lectin 1) | −0.887453438 | −1.0351 | −0.66508 | 0.0002 | 2.13 × 10⁻⁵ | 0.006319 |
| ATP5PO (ATP synthase peripheral stalk subunit OSCP) | −0.638347295 | −1.01715 | −0.46444 | 0.000147 | 1.64 × 10⁻⁸ | 0.00638 |
| NDUFV3 (NADH:ubiquinone oxidoreductase subunit V3) | −0.763715269 | −1.20934 | −0.68555 | 0.002027 | 2.99 × 10⁻⁶ | 0.004935 |
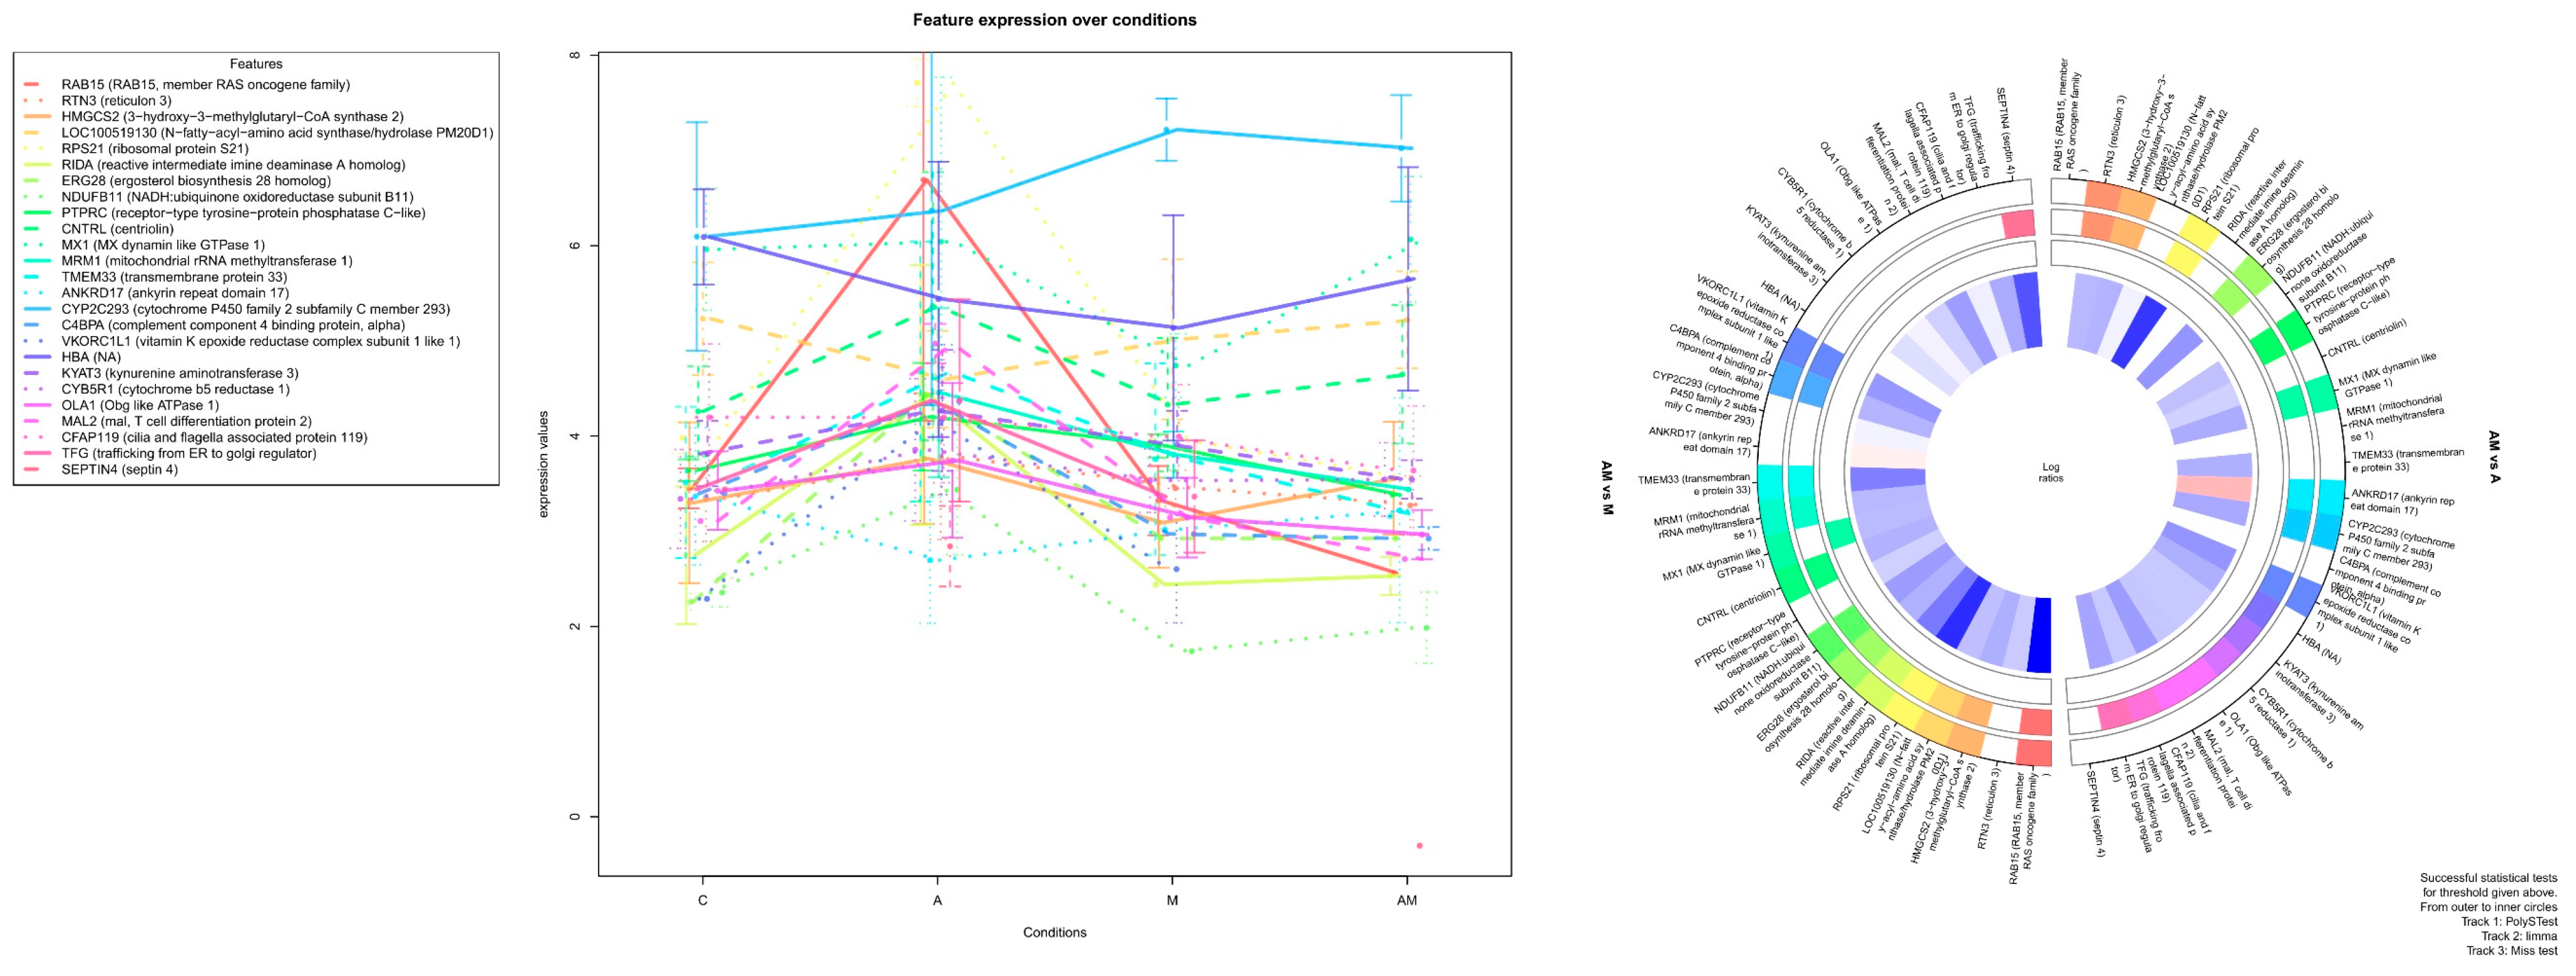
| Protein Name | Log2FC AM vs. A | FDR AM vs. A |
|---|---|---|
| RTN3 (reticulon 3) | 1.333856488 | 9.52 × 10⁻⁵ |
| HMGCS2 (3-hydroxy-3-methylglutaryl-CoA synthase 2) | 1.444551447 | 0.000281205 |
| RPS21 (ribosomal protein S21) | 3.612517926 | 0.000827373 |
| ERG28 (ergosterol biosynthesis 28 homolog) | 1.975858933 | 0.000827702 |
| PTPRC (receptor-type tyrosine-protein phosphatase C-like) | 1.190814103 | 0.004299025 |
| MX1 (MX dynamin like GTPase 1) | 1.592957592 | 0.005482088 |
| ANKRD17 (ankyrin repeat domain 17) | −1.300765515 | 0.00768479 |
| CYP2C293 (cytochrome P450 family 2 subfamily C member 293) | 1.629403286 | 0.008207595 |
| VKORC1L1 (vitamin K epoxide reductase complex subunit 1 like 1) | 1.966681037 | 0.008886381 |
| Protein Name | Log2FC AM vs. M | FDR AM vs. M |
|---|---|---|
| RAB15 (RAB15, member RAS oncogene family) | 4.664835366 | 2.37 × 10⁻⁶ |
| HMGCS2 (3-hydroxy-3-methylglutaryl-CoA synthase 2) | 1.509156307 | 0.000181408 |
| LOC100519130 (N-fatty-acyl-amino acid synthase/hydrolase PM20D1) | 1.210067496 | 0.000272316 |
| RPS21 (ribosomal protein S21) | 3.801722021 | 0.0002976 |
| RIDA (reactive intermediate imine deaminase A homolog) | 2.4589452 | 0.000315547 |
| NDUFB11 (NADH:ubiquinone oxidoreductase subunit B11) | 1.85720825 | 0.001889375 |
| RTN3 (reticulon 3) | 0.990599268 | 0.003772517 |
| CNTRL (centriolin) | 1.456675854 | 0.004866641 |
| MX1 (MX dynamin like GTPase 1) | 1.302627789 | 0.005956324 |
| MRM1 (mitochondrial rRNA methyltransferase 1) | 1.341183314 | 0.007101537 |
| TMEM33 (transmembrane protein 33) | 2.378798247 | 0.007127983 |
| ERG28 (ergosterol biosynthesis 28 homolog) | 1.480329632 | 0.00853595 |
| VKORC1L1 (vitamin K epoxide reductase complex subunit 1 like 1) | 1.934924004 | 0.00853595 |
| C4BPA (complement component 4 binding protein, alpha) | 1.426021648 | 0.00853595 |
Disclaimer/Publisher’s Note: The statements, opinions and data contained in all publications are solely those of the individual author(s) and contributor(s) and not of MDPI and/or the editor(s). MDPI and/or the editor(s) disclaim responsibility for any injury to people or property resulting from any ideas, methods, instructions or products referred to in the content. |
© 2023 by the authors. Licensee MDPI, Basel, Switzerland. This article is an open access article distributed under the terms and conditions of the Creative Commons Attribution (CC BY) license (https://creativecommons.org/licenses/by/4.0/).
Share and Cite
Popescu, R.G.; Marinescu, G.C.; Rădulescu, A.L.; Marin, D.E.; Țăranu, I.; Dinischiotu, A. Natural Antioxidant By-Product Mixture Counteracts the Effects of Aflatoxin B1 and Ochratoxin A Exposure of Piglets after Weaning: A Proteomic Survey on Liver Microsomal Fraction. Toxins 2023, 15, 299. https://doi.org/10.3390/toxins15040299
Popescu RG, Marinescu GC, Rădulescu AL, Marin DE, Țăranu I, Dinischiotu A. Natural Antioxidant By-Product Mixture Counteracts the Effects of Aflatoxin B1 and Ochratoxin A Exposure of Piglets after Weaning: A Proteomic Survey on Liver Microsomal Fraction. Toxins. 2023; 15(4):299. https://doi.org/10.3390/toxins15040299
Chicago/Turabian StylePopescu, Roua Gabriela, George Cătălin Marinescu, Andreea Luminița Rădulescu, Daniela Eliza Marin, Ionelia Țăranu, and Anca Dinischiotu. 2023. "Natural Antioxidant By-Product Mixture Counteracts the Effects of Aflatoxin B1 and Ochratoxin A Exposure of Piglets after Weaning: A Proteomic Survey on Liver Microsomal Fraction" Toxins 15, no. 4: 299. https://doi.org/10.3390/toxins15040299
APA StylePopescu, R. G., Marinescu, G. C., Rădulescu, A. L., Marin, D. E., Țăranu, I., & Dinischiotu, A. (2023). Natural Antioxidant By-Product Mixture Counteracts the Effects of Aflatoxin B1 and Ochratoxin A Exposure of Piglets after Weaning: A Proteomic Survey on Liver Microsomal Fraction. Toxins, 15(4), 299. https://doi.org/10.3390/toxins15040299