Article

The Effect of Microcystis on the Monitoring of Faecal Indicator Bacteria

1
School of Environmental Studies, Queen’s University, Kingston, ON K7L 3N6, Canada
2
Department of Biology, Queen’s University, Kingston, ON K7L 3N6, Canada
3
Department of Chemistry, Queen’s University, Kingston, ON K7L 3N6, Canada
*
Authors to whom correspondence should be addressed.
Toxins 2023, 15(11), 628; https://doi.org/10.3390/toxins15110628
Submission received: 15 July 2023 / Revised: 27 September 2023 / Accepted: 7 October 2023 / Published: 26 October 2023

Abstract

:
The survival of Escherichia coli (E. coli) bacteria, the most common faecal indicator bacteria (FIB), may be significantly affected by cyanobacteria present during a harmful algal bloom (HAB). Therefore, the effect of Microcystis on the survival of FIB E.coli and coliforms was investigated. Microcosms containing two species of Microcystis (M. aeruginosa and M. smithii) were established and then inoculated with four reference strains of E. coli (ATCC 25922, 8739, 51813, and 11775) to explore the cyanobacteria-bacteria dynamics at a laboratory setting. Monitoring over several days showed normal growth of Microcystis, with or without the presence of E. coli. However, Microcystis was shown to dramatically decrease the survival of E. coli over time. Analysis of microcystin production by Microcystis was found to correlate with loss of E. coli, suggesting a toxic effect of microcystins on E. coli bacteria. This phenomenon was also demonstrated for a natural consortium of E. coli and coliform bacteria by inoculating with contaminated lake water. The results indicate that the use of E. coli as FIB may be greatly compromised in the presence of Microcystis spp. such as during a HAB when associated toxins are produced.
Key Contribution: Microcystis aeruginosa and M. smithii that produce microcystins caused the loss of Escherichia coli, compromising the utility of faecal indicator bacteria.

1. Introduction

Water bodies in North America and around the world have experienced increased algal blooms, including harmful algal blooms (HABs) caused by cyanobacteria as a result of enhanced human- and climate-driven environmental changes [1]. HABs affect the ecological integrity of the affected water by disrupting or altering the biological communities. Cyanotoxins such as microcystins that are produced by cyanobacteria, most notably Microcystis species, are known to cause numerous toxic effects in mammals, other animals and plants [2]. Although these compounds can negatively impact the growth and carbon fixation of photosynthetic prokaryotes [3], there is little information concerning their effects on heterotrophic prokaryotes [4,5,6]. Even though changes in bacterial assemblages have been detected in response to Microcystis colonies [7] and microcystins [8], there are no available reports addressing directly the dynamics of cyanobacteria and E. coli or other coliform bacteria, especially from the point of view of the effectiveness of faecal indicator bacteria (FIB) to indicate water quality when there is a risk of HABs being present. Harmful impacts on species such as FIB could significantly impact water management monitoring and any consequential remediative practices.
Transmission of microbial pathogens by water is a significant cause of waterborne illnesses worldwide [9,10]. It is impractical to perform tests for all potential pathogenic microbes in water. Furthermore, many waterborne pathogens tend to travel through the environment and may be diluted below normal detection limits, even if still present at clinically effective concentrations. These limitations led to the birth of the ‘indicator’ approach: to use easily detectable and representative microorganisms that are normally present in faecal pollution to indicate the possible presence of faecal pathogens, and therefore, an elevated risk of microbiological contamination in the water [11,12]. An effective indicator organism must fulfill certain criteria, such as having similar sources and fate as the associated pathogens, and there must be readily available, easy and affordable tests for the indicator [11]. Since the majority of pathogenic microbes are derived faecally, FIB are utilized widely to assess microbial water quality, including E. coli, total coliforms, faecal coliforms, faecal streptococci, and Enterococci [13]. E. coli bacteria have emerged as the preferred FIB as a result of demonstrated correlation with pathogen presence [11] along with the availability of a number of reliable, low-cost testing methods [14,15].
While significant attention has been paid to the correlation between FIB and pathogen sources, less attention has been devoted to assessing whether FIB and pathogens have the same fate in environmental waters. To interpret better the FIB absence/presence/abundance as a surrogate for microbial water quality, it is crucial to understand the dynamics and association of FIB and coexistent microorganisms in natural waters.
This paper reports an investigation into the growth pattern of selected FIB in the presence of the cyanobacteria Microcystis in laboratory settings. Microcystis was chosen because this genus is a major contributor to cyanobacterial harmful algal blooms, and the cytotoxin microcystin, in Canada and the United States [16,17,18]. Microcosms containing FIB (E. coli consortium) and cyanobacteria (Microcystis aeruginosa; Microcystis smithii) were prepared, and the water was sampled regularly to monitor the growth of both FIB and cyanobacteria. E. coli was severely suppressed by the presence of both Microcystis species, especially M. aeruginosa. Possible contributing factors include microcystins and cellular contact.

2. Results

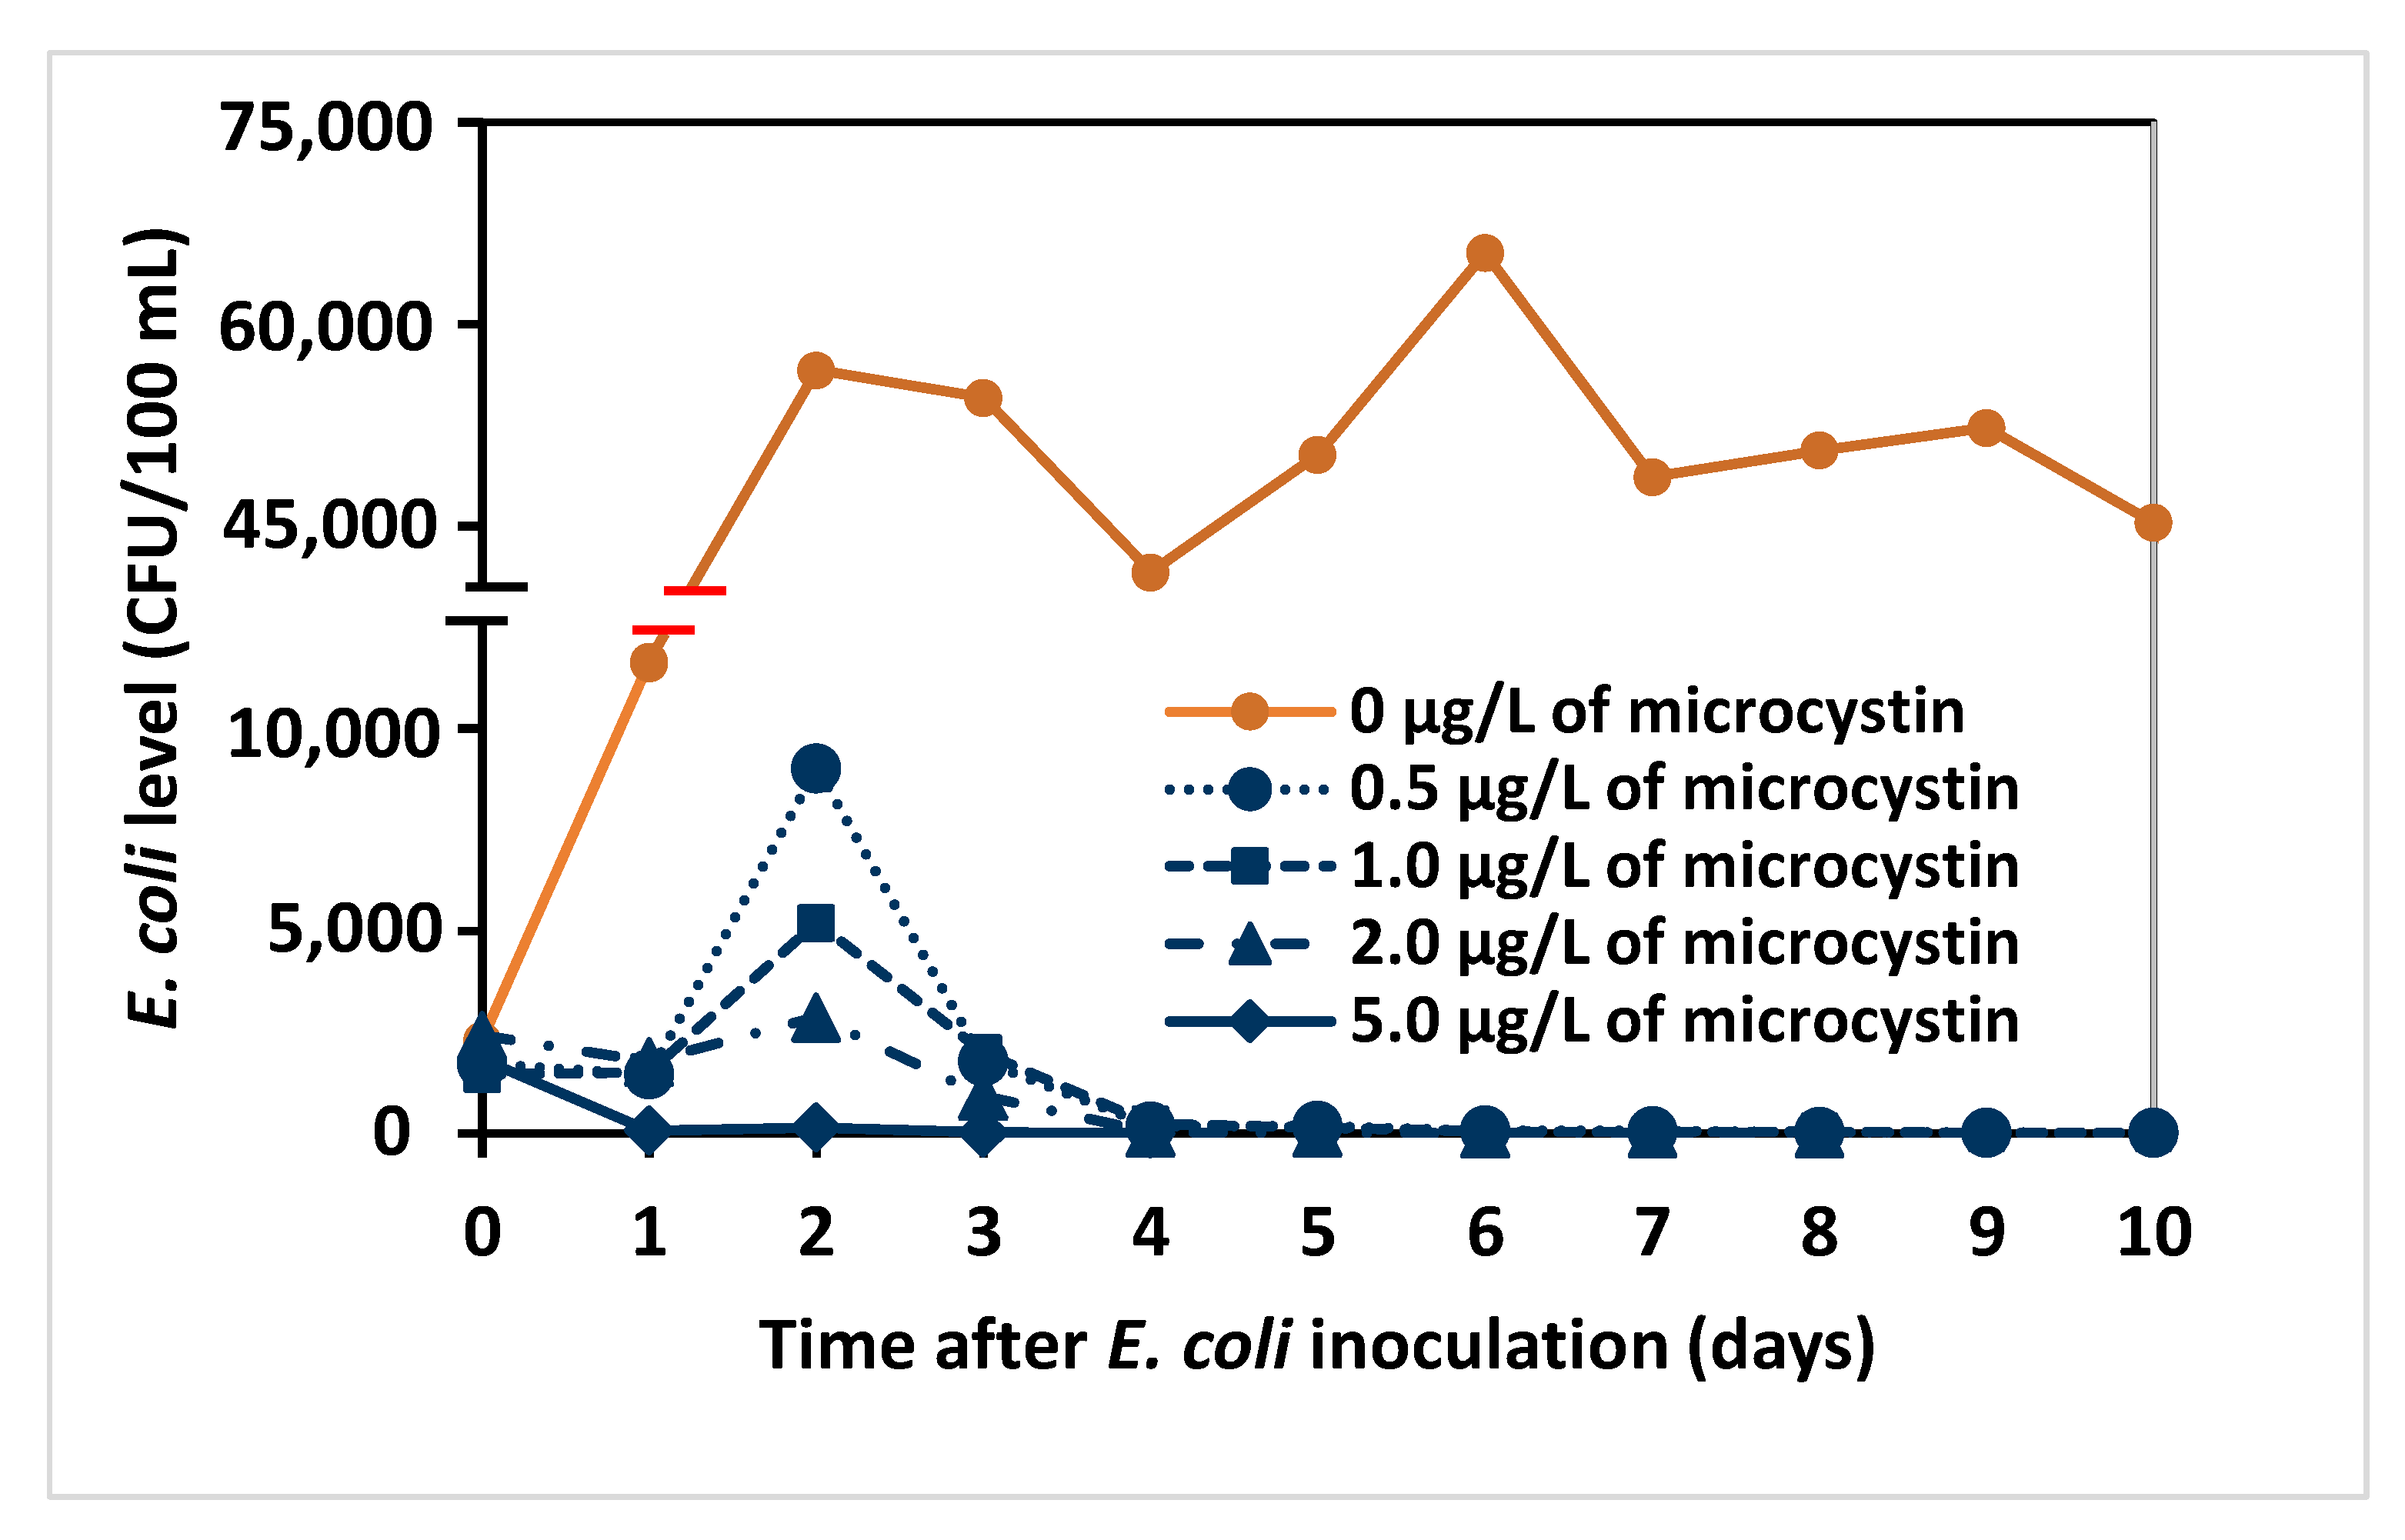
2.1. Survival of E. coli Consortium in Microcystis Cultures

M. aeruginosa and M. smithii were cultured for 3 days with MA medium [19] and survival of E. coli inoculated at 40,000 CFUs/100 mL in the MA medium with and without Microcystis is shown in Figure 1. CFU refers to “colony forming units”, which is the standard unit of microbiological culture methods used to enumerate bacteria, but can be compared with cells in this context. For comparison with Microcystis levels (see below), the E. coli inoculation was at 0.4 cells/µL.
E. coli amounts are normally stable in water bodies after leaving their enteric habitats, but the E. coli level increased slightly in MA medium, which contains a carbon source in the form of 0.163 mM β-glycerophosphate, and then its level slowly decreased but remained above the initial level for at least 28 days. When inoculated into the M. smithii culture, the E. coli level dropped quickly, with no E. coli being detected after 8 days. When inoculated with M. aeruginosa, the E. coli counts dropped more rapidly, with no E. coli being detected after 2 days.
The decrease in E. coli counts in Figure 1 was analyzed assuming a pseudo-first-order decay (see Materials and Methods) by regression analysis of loge-transformed E. coli counts versus days from inoculation. Half-life values ( t 1 2 ), defined as the time required for decay to reduce the population by 50%, were determined along with 95% confidence intervals (95% CI) reported as the 95% CI range of half-life values. The E. coli inoculated into M. smithii culture decreased with a half-life of 0.67 days (95% CI 0.59 to 0.79 days), while the E. coli inoculated into M. aeruginosa culture decreased with a half-life of 0.21 days (95% CI 0.14 to 0.47 days), consistent with the observed times for loss of bacteria. The control culture, starting from day 1, showed a half-life of 6.7 days (95% CI 4.9 to 10.5 days). Duplicated experiments showed the same pattern. These results indicate that some parameters associated with the presence of Microcystis, especially M. aeruginosa, appear to be detrimental to E. coli survival.

2.2. Growth of Microcystis Cultures in the Presence of E. coli

The growth of cyanobacteria was monitored for the possible effects of E. coli. During the same experiment that provided the results of E.coli growth with and without Microcystis present (Figure 1), Chlorophyll a concentrations and cell counts of Microcystis cultures with and without E. coli were measured and are plotted in Figure 2. Figure 2a shows that chlorophyll a concentrations in M. smithii and M. aeruginosa both increased slowly over the first eight days and then rose rapidly through day 16. Cell counts of the two Microcystis species (Figure 2b) also exhibited a significant increase, except with the increase being noticed after five days. The similar trends in the chlorophyll a and cell count results for cultures with and without E. coli indicate that the presence of E. coli had little impact on Microcystis growth.

2.3. pH and Microcystin Levels in Microcystis Cultures in Relation to E. coli Survival

Laboratory measurements investigated possible links between E. coli survival, pH, and microcystin levels associated with the growth of Microcystis. pH is an important variable affecting aquatic environments and habitat dynamics [4,20]. To investigate the possible influence of pH, it was monitored throughout the growth period of M. aeruginosa and M. smithii cultures and showed gradual increases from 8.25 ± 0.08 to 9.59 ± 0.04 and 9.88 ± 0.05 (mean ± SD), respectively. The pH of the control culture with only E. coli remained within 0.02 units of the initial pH of 8.25 over 28 days. E. coli was still alive in M. smithii when pH reached 8.52 ± 0.04 on Day 8, but already absent in M. aeruginosa when pH reached 8.34 ± 0.03 on Day 5.
To determine the potential role of microcystin in these E. coli survival studies, microcystin levels were measured throughout the culture period. The results are shown in Figure 3. Combined with the growth variables in Figure 1, it is obvious that microcystin concentrations in both species increase with the growth of the cyanobacteria. Meanwhile, M. aeruginosa constantly produced more microcystin (from 1.12 to 26.7 ppb) than M. smithii (from 0.60 to 15.0 ppb) at comparable chlorophyll a/cell count levels, with a statistically significant difference at day 23 (p = 0.001).
To assess the possible effect of direct cellular competition with Microcystis on the decline of E. coli, MA culture medium was prepared with different concentrations of microcystins using sequential dilutions of filtered M. aeruginosa culture containing 20.0 μg/L microcystin. The same level of E. coli consortium (40,000 CFU/100 mL) was then inoculated into 3 L of each culture medium and monitored for E. coli survival. A plot of E. coli levels versus time (Figure 4) showed an initial increase at low microcystin concentrations with a decrease beginning on day 2, while the E. coli levels at 5.0 μg/L decreased from inoculation. This may indicate that 2.0 μg/L microcystin was lower than the concentrations for the earlier experiments (Figure 1 plots with Microcystis present) and that the dynamics of microcystin toxicity to E. coli are more complicated. The results show that the survival time of E. coli decreased from 20 to 5 days as microcystin concentration increased from 0.5 to 5.0 μg/L (Table 1). Using the data starting at day 2 when a pseudo-first-order decrease in E. coli was apparent, the half-life (t1/2) of E. coli was calculated (Table 1) and followed a corresponding pattern to survival time at increasing microcystin levels. Statistical analysis showed that E. coli survival was significantly reduced at all microcystin concentrations compared with the control, and the reduction at 2.0 μg/L was greater than at 0.5 and 1.0 μg/L (p < 0.05).

2.4. Survival of E. coli and Total Coliforms from Lake Water in Microcystis Cultures

Lake water containing a natural consortium of E. coli and total coliform bacteria was collected at a location known to receive combined-sewage outflows from Lake Ontario at Kingston, Ontario, Canada. The lake water was determined to have E. coli and total coliform levels of 6450 and 43,520 CFU/100 mL, respectively. Lake water was inoculated into the M. smithii and M. aeruginosa cultures, along with an MA medium control sample, to explore the survival of natural bacteria strains under the same conditions studied for the laboratory strains. As seen in Figure 5, the lake water bacterial E. coli and coliform strains showed similar survival patterns to the E. coli lab strains. They survived longer in M. smithii (2–3 days) than in M. aeruginosa (1 day), while both bacteria levels remained high for over 14 days in the control medium. The regression analysis of loge-transformed E. coli levels in M. smithii culture was not statistically significant (p = 0.089), so the half-life could only be estimated as 0.38 days. The half-life value for E. coli in M. aeruginosa culture was 0.33 days (95% CI 0.31 to 0.35 days), consistent with the faster decay compared with the M. smithii culture. Starting from day 1, the control culture showed a half-life of 6.5 days (95% CI 3.9 to 20.0 days). Total coliforms also had a longer half-life in M. smithii (0.93 days, 95% CI 0.71 to 1.35 days) than in M. aeruginosa (0.36 days, 95% CI 0.28 to 0.51 days). Starting from day 1, the control culture showed a total coliform half-life of 6.2 days (95% CI 3.7 to 18.9 days). Meanwhile, a non-toxin-producing green algae, Chlorella (identified by microscopy), was observed to grow in the control sample without any effect on the survival of E. coli and total coliforms (Figure 5). It was noted that the starting concentrations (day 0) of E. coli and total coliforms were lower in the Microcystis cultures than in the control, unlike the case for inoculating lab strains of E. coli as shown in Figure 1. The exact explanation of this difference is not known, but there may be a more immediate effect of the Microcystic culture on the survival of natural E. coli and total coliform strains in lake water such that it was seen immediately after the short time (several minutes) between mixing the lake water into the culture and withdrawing the samples for enumeration. This should be studied more extensively in the future. Nonetheless, we believe a general comparison of bacteria survival and measured half-life values following lake water inoculations to the laboratory isolate inoculations can still be made.

3. Discussion

The cyanobacteria-E. coli dynamic investigation shows that E. coli survival was severely affected (shortened) by the presence of Microcystis, especially by M. aeruginosa. However, this could not be attributed to a large degree to changes in pH. During pH monitoring throughout cyanobacteria growth and E. coli decline, it was observed that pH in both M. aeruginosa and M. smithii increased as expected during photosynthetic activity consuming CO2 [21,22,23].
Although the increase in pH exceeded the optimal range for E. coli growth, it was still in their reported bearable range. Even if elevated pH could combine with other adverse factors to reduce the survival of E. coli in the two Microcystis cultures, it cannot explain the significant difference between the effects of the two Microcystis species, where the effect is less in the higher pH of M. smithii. Nevertheless, high pH might serve as an auxiliary element in the decline of E. coli. On the other hand, M. aeruginosa constantly produced more microcystin (from 1.12 to 26.7 ppb) than M. smithii (from 0.60 to 15.0 ppb) at comparable chlorophyll a/cell count levels. This is the only parameter studied that differed significantly between the M. aeruginosa and M. smithii cultures, which makes microcystins the most likely candidate for explaining the difference in survival of E. coli between the cultures.
The major causes of the decline in E. coli are not likely to be direct contact with the cyanobacteria or competition for resources within the medium given the results in the filtered cell-free treatments with microcystin (Figure 4). Compared to the cultures with cyanobacteria growing at the same time (Figure 1), E. coli generally had longer survival times (longer half-life) in the filtered samples at similar microcystin levels. These results are consistent with the previous suggestion that microcystin production might be the main cause of reduced E. coli survival, though other factors such as high pH values and the presence of Microcystis cells cannot be entirely ruled out.
This study indicates that the major cause of the decline in E. coli was linked to the presence of microcystins, which is consistent with these being the most significant toxins produced by Microcystis species. This is of particular interest because the levels of microcystins in this study were comparable to those found in the local waters of Lake Ontario during HAB events [24]. Given the high toxicity to a variety of organisms, microcystins have long been assumed to serve a defensive function against predators or competitors [25]. When a natural consortium of E. coli and total coliform bacteria from Lake Ontario was inoculated into the M. smithii and M. aeruginosa cultures to explore the survival of natural bacteria strains under the same conditions studied for the laboratory strains, the results were similar to that of the latter. In addition, when Chlorella was present in the absence of the Microcystis species in lake water, there was no deleterious effect on E. coli, further supporting the notion that toxin from cyanobacteria played an important role in reducing survival of the tested FIB. It is known that Microcystis can alter native bacterial assemblages in lakes [7], that microcystins modify bacterial communities in sediments [8] and affect bacterial growth in freshwater reservoirs [6].
More specifically, Ostensvik and colleagues [26] showed inhibition of bacteria by extracts from five different cyanobacteria, including Microcystis aeruginosa, that may contain microcystins, but they did not monitor the fecal indicator bacteria, E. coli or coliforms. Another study tested E. coli from sewage [27], however, it did not reveal any possible effects of cyanobacteria because the bacteria died under all investigated conditions.
In contrast to our findings, two previous investigations did not see growth inhibition of E. coli challenged with pure microcystin-RR [28,29]. These investigations, however, used laboratory E. coli strains growing in rich nutrient broth. Such a rich medium might be expected to provide an abundance of resources with which the bacteria could cope with toxins. By comparison, the present study used environmental E. coli strains and coliforms found in lake water grown in a minimal medium with microcystin produced by Microcystis. The latter better emulates more natural conditions of real aquatic ecosystems and would be expected to provide more credible results.
Halac and colleagues [30] have reported a negative correlation suggesting a similar problem with fecal indicators to the present findings, however, they did not directly measure microcystin and so only infer the effect of toxins based on cyanobacteria levels.
Our results indicate that E. coli should be added to the list of bacteria affected by toxic Microcystis. Although native consortia of E. coli were eliminated by Microcystis in laboratory microcosms, further research is needed to determine if similar dynamic relationships are expressed in water systems containing natural populations of Microcystis.
The present findings point toward the possibility that E. coli abundance might not be a reliable indicator of faecal contamination in waters also containing toxin-producing cyanobacteria. The interpretation of E. coli test results should take into account the possible influence of co-existing cyanobacteria, and when tests show E. coli negative results, supplementary tests might be needed before concluding the absence of faecal contamination.
On the other hand, these results could indicate a new opportunity for the use of E. coli and coliforms for Microcystis monitoring. If a water system normally has E. coli or coliform bacteria present, the sudden reduction or loss of these bacterial populations could indicate the onset of Microcystis growth as in a HAB. Therefore, the relationship between the disappearance of E. coli and the level of cyanobacterial toxins could be of great use for water quality management that pertains to FIB screening and HAB prediction and control. Work in this paper is an initial step in exploring the dynamics of cyanobacteria-coliform bacteria populations in laboratory cultures. Apart from microcystins, of which numerous variants are known, cyanobacteria are capable of synthesizing a whole set of secondary metabolites [31] that could be expelled into the medium. As far as is known, M. aeruginosa contains mainly microcystins, only occasionally accompanied by aeruginosins. Nevertheless, the impact of these other compounds on bacterial growth should be investigated.

4. Conclusions

The fate and persistence of an ideal faecal indicator in the natural environment should be similar to the target faecal pathogens indicated. Results in this paper indicate that this similarity may not be true if the presence of Microcystis affects the detection of E. coli while not affecting the survival of other pathogens such as viruses and protozoa. Because many protozoa are known to grow or survive in the presence of HABs [32], they may present alternative choices for faecal indicators, rather than E. coli and coliforms, in water bodies susceptible to blooms. Low levels of E. coli in water samples impacted by HABs may result in a false assessment of faecal contamination risk, even if the presence of HABs may eventually be noticed and trigger a separate warning about water quality.

5. Materials and Methods

5.1. Bacterial Cultures

Reference E. coli strains, ATCC 25922, 8739, 51813, and 11775, were purchased in lyophilized form (Med-Ox Diagnostics, Ottawa, ON, Canada) and reconstituted and cultured in Tryptic Soy Broth. In addition, lake water was collected from Lake Ontario near Kingston, ON, as a source of naturally occurring strains of E. coli and total coliforms. Determination of E. coli and coliforms used the TECTA™ B16 microbiology system with TECTA™ CCA test cartridges (TECTA-PDS, now IDEXX-Tecta, Kingston, ON, Canada) described below in Section 5.4, and with additional analysis using Colilert-18 with Quanti-Tray (IDEXX Laboratories, Inc., Westbrook, ME, USA).

5.2. Cultures of Cyanobacteria

Two Microcystis species, M. smithii and M. aeruginosa, were isolated from Leonard’s Fish Farm, a collection of small baitfish ponds in Hartington, ON, Canada and cultured in MA medium [19] to establish axenic stock cultures. The chemicals used were analytical grade or the highest purity available from Thermo Fisher Scientific (Ottawa, ON, Canada). Treatments were performed in 4 L Erlenmeyer flasks containing 3 L of autoclaved MA medium. All cultures were incubated with continuous aeration using filtered air (Cytiva Whatman™ ReZist Air Venting Filter, 50 mm, PTFE, 0.2μm; Thermo Fisher) at 22 ± 1°C, illuminated by four 32-watt T8 48-inch cool white fluorescent tubes at 220 W·.m−2 on a 16:8 light:dark cycle.

5.3. Addition of E. coli Consortium to Cyanobacterial Culture Media and Control Medium

Treatments were inoculated with M. smithii (flasks 1 and 2), M. aeruginosa (flasks 3 and 4) or no cyanobacteria (flask 5) and incubated for 3 days. Then an E. coli consortium comprised of four lab stains, ATCC 25922, 8739, 51813, and 11775 in a 1:1:1:1 mixture, was added to flasks 1, 3, and 5 at approximately 40,000 CFUs (colony forming units, 10,000 CFUs for each strain) per 100 mL. These three flasks were sampled and monitored for E. coli levels daily after the inoculation. Flasks 2 and 4 served as the no-E. coli control groups. Concurrently, flasks 1–4 were sampled to monitor cyanobacterial growth. The data presented is from one of three independent experiments. The E. coli consortium employed in these experiments more closely represents the diversity of strains that occur in lake water compared to using single strains.

5.4. E. coli and Total Coliform Detection Using the TECTA Microbiology System

The TECTA B16 system and test cartridge provides a culture-based method for E. coli and coliform testing with automated instrumental detection of fluorescent products of selective enzyme-substrate reactions [33,34]. It features a polymer-based optical sensor that extracts the fluorescent products from the broth culture to enable detection even in the presence of color and turbidity from other organisms. Bacteria levels in the initial sample are estimated by noting the time-to-detection (TTD), which varies inversely with the logarithm (base ten) of the bacteria level. The TECTA B16 offers an additional advantage of a wide dynamic range so that samples with unknown bacteria levels can be analyzed without running multiple dilutions. To calibrate the TECTA response in the testing matrix, culture media spiked with known amounts of E. coli (confirmed with separate tests using Colilert-18) were prepared to produce five test levels ranging from 490 to 4900 CFU/100 mL. Three 100 mL calibration samples of each level were tested, and the average TTD for each set was plotted against the log of the E coli counts. The linear regression equation of this plot (R² = 0.97) was used for E. coli quantitation in subsequent experiments. For most experiments, a 10 mL sample was added to a test cartridge containing 90 mL sterile water (10-fold dilution) to reduce consumption of medium while still being sensitive enough for tracking bacteria populations. Tests were run in triplicate. A separate positive control with E. coli inoculated directly in the test cartridge showed that the presence of cyanobacteria did not affect the TTD value for 10 mL samples even at the 1000 cells/μL level.

5.5. Chlorophyll a Measurement and Cell Counts to Monitor Algal Growth

Chlorophyll a is a major microphyte pigment and was used as an indicator of microphyte biomass. The measurement procedure was a standard method using visible wavelength spectrometry [35]. Briefly, a 10 to 50 mL volume of sample was filtered, depending on the estimated chlorophyll a content, through Whatman 47 mm GF/F glass microfiber filters (VWR Canlab, Mississauga, ON, Canada) of 0.8 µm pore size, applying vacuum filtration until the filter was dry. The filter was folded into quarters, wrapped in aluminum foil, and stored frozen (−20 °C) in ziplock bags for at least 24 h. Frozen samples could be held for up to 28 days from the time of filtration until extraction. For chlorophyll a extraction, a freeze/thaw cycle (20 min/5 min) was repeated three times to break the cell membranes. Sample filters were then removed from the foil wrap, placed in a 15 mL centrifuge tube, and steeped in 10 mL 90% acetone to extract chlorophyll from the microphyte cells. The centrifuge tubes were vortexed vigorously to mix well and then stored at 4 °C for 8–10 h, to allow for complete extraction. The extract was clarified by centrifuging for 15 min at 2200× g. 1.0 mL samples of the clear supernatant were carefully transferred to 1 cm pathlength quartz cuvettes and absorbances at 750, 664, 647, and 630 nm were measured using a SpectraMax Plus 384 spectrophotometer (Molecular Devices, Sunnyvale, CA, USA). The chlorophyll a concentration was calculated using Jeffrey and Humphrey’s Trichromatic Equation (18) [35]:
C h l o r o p h y l l   a   μ g L = 11.85 A 664 A 750 1.54 A 647 A 750 0.08 A 630 A 750 V 1 V 2 L
where An = absorbance at wavelength n, V1 = the volume of 90% acetone used for extraction (mL), V2 = the volume of water filtered (L), and L = the cell path length (cm).
The Microcystis species consisted of single cells as cultured and cell counts were determined using a hemocytometer (Qiujing Biochemical Reagent and Instrument Co., Ltd., Shanghai, China) and a Labophot microscope (Nikon, Japan) at 400× magnification with camera attachment.

5.6. Microcystin Determination

Microcystins are cyclic peptides with seven amino acids and are the most common toxins produced by cyanobacteria. They are named for the various amino acids in their structures, with Microcystin-LR being the most common and also the most toxic. Microcystins were determined by Enzyme-Linked Immunosorbent Assay (ELISA) using a QuantiPlateTM Kit for Microcystins (Envirologix, Portland, ME, USA). This is a competitive ELISA where microcystin-labelled horseradish peroxidase enzyme competes with microcystin from the sample to bind with an immobilized antibody. After a washing step, enzyme activity is determined with a colourimetric substrate, giving a detection limit of 0.2 ppb reported by the manufacturer. This assay only detects extracellular microcystins because cells were not disrupted during this analysis. Moreover, this assay does not distinguish between the microcystin toxin variants. Microcystin in the sample competed with enzyme (horseradish peroxidase)-labeled microcystin for a limited number of antibodies immobilized on the inside surface of the test wells. After washing off the non-binding material, a color development step produced a solution with absorbance that was inversely proportional to microcystin concentration. A calibration curve was produced (R2 = 0.99) using standard calibrator solutions, according to the manufacturer’s instructions.

5.7. Determination of Half-Life for Decline of Bacteria Cultures

Culture half-life ( t 1 2 ) for cases where there was a bacteria population decrease over time (Figure 1, Figure 4 and Figure 5) was determined by assuming a pseudo-first-order kinetic decline. The slope of a plot of loge(population) vs. time was determined by linear regression, and the half-life was calculated as 0.693/(−1 × slope). In samples where there was an increase in population followed by a decrease, the starting day for the regression was shifted as noted in the text. The 95% confidence interval range for the half-life was determined by calculating lower and upper limit values from the 95% confidence interval of the slope. Since the half-life value is an inverse of the slope values, the 95% CI range is not symmetrical around the mean half-life value, so the two range limits are given rather than plus/minus a single value.

Author Contributions

Conceptualization, J.Z., R.S.B., Y.W. and D.D.L.; methodology, R.S.B., Y.W., C.D. and M.Q.; data analysis, J.Z. and R.S.B.; original draft preparation, J.Z., R.S.B. and D.D.L.; review and editing, R.S.B., Y.W. and D.D.L. All authors have read and agreed to the published version of the manuscript.

Funding

Funding for this work was provided by TECTA-PDS (Kingston, ON, Canada), the Natural Sciences and Engineering Research Council of Canada, the Ontario Centres of Excellence, and China Scholarship Council.

Acknowledgments

Special thanks to Amanda Luke and Lynne O’Donnell for assistance with bacteria cultures, Michelle Douma for assistance with experimental material and apparatus preparation, and TECTA-PDS for use of the TECTA B16 instrument.

Conflicts of Interest

The authors declare no conflict of interest.

References

  1. Chen, L.; Giesy, J.P.; Adamovsky, O.; Svirčev, Z.; Meriluoto, J.; Codd, G.A.; Mijovic, B.; Shi, T.; Tuo, X.; Li, S.-C.; et al. Challenges of using blooms of Microcystis spp. in animal feeds: A comprehensive review of nutritional, toxicological and microbial health evaluation. Sci. Tot. Environ. 2021, 764, 142319. [Google Scholar] [CrossRef] [PubMed]
  2. Melaram, R.; Newton, A.R.; Chafin, J. Microcystin Contamination and Toxicity: Implications for Agriculture and Public Health. Toxins 2022, 14, 350. [Google Scholar] [CrossRef] [PubMed]
  3. Chia, M.A.; Kramer, B.J.; Jankowiak, J.G.; Bittencourt-Oliveira, M.d.C.; Gobler, C.J. The Individual and Combined Effects of the Cyanotoxins, Anatoxin-a and Microcystin-LR, on the Growth, Toxin Production, and Nitrogen Fixation of Prokaryotic and Eukaryotic Algae. Toxins 2019, 11, 43. [Google Scholar] [CrossRef] [PubMed]
  4. Grossart, H.-P.; Simon, M. Interactions of planktonic algae and bacteria: Effects on algal growth and organic matter dynamics. Aquat. Microb. Ecol. 2007, 47, 163–176. [Google Scholar] [CrossRef]
  5. Pernthaler, J.; Amann, R. Fate of heterotrophic microbes in pelagic habitats: Focus on populations. Microbiol. Mol. Biol. Rev. 2005, 69, 440–461. [Google Scholar] [CrossRef]
  6. Miguéns, D.; Valério, E. The impact of some microcystins on the growth of heterotrophic bacteria from Portuguese freshwater reservoirs. Limnetica 2015, 34, 215–226. [Google Scholar] [CrossRef]
  7. Jankowiak, J.G.; Gobler, C.J. The composition and function of microbiomes within Microcystis colonies are significantly different than native bacterial assemblages in two North American lakes. Front. Microbiol. 2020, 11, 1016. [Google Scholar] [CrossRef]
  8. Ding, Q.; Liu, K.; Song, Z.; Sun, R.; Zhang, J.; Yin, L.; Pu, Y. Effects of Microcystin-LR on Metabolic Functions and Structure Succession of Sediment Bacterial Community under Anaerobic Conditions. Toxins 2020, 12, 183. [Google Scholar] [CrossRef]
  9. Fenwick, A. Waterborne infectious diseases-could they be consigned to history? Science 2006, 313, 1077–1081. [Google Scholar] [CrossRef]
  10. World Health Organization. Protecting Surface Water for Health. Identifying, Assessing and Managing Drinking-Water Quality Risks in Surface-Water Catchments. 2016. Available online: https://www.who.int/publications/i/item/9789241510554 (accessed on 15 June 2023).
  11. Payment, P.; Waite, M.; Dufour, A. Introducing parameters for the assessment of drinking water quality. Assess. Microb. Saf. Drink. Water 2003, 4, 47–77. [Google Scholar]
  12. Savichtcheva, O.; Okabe, S. Alternative indicators of fecal pollution: Relations with pathogens and conventional indicators, current methodologies for direct pathogen monitoring and future application perspectives. Water Res. 2006, 40, 2463–2476. [Google Scholar] [CrossRef] [PubMed]
  13. LeChevallier, M.W.; Welch, N.J.; Smith, D.B. Full-scale studies of factors related to coliform regrowth in drinking water. Appl. Env. Microbiol. 1996, 62, 2201–2211. [Google Scholar] [CrossRef] [PubMed]
  14. Niemela, S.; Lee, J.; Fricker, C. A comparison of the International Standards Organisation reference method for the detection of coliforms and Escherichia coli in water with a defined substrate procedure. J. Appl. Microbiol. 2003, 95, 1285–1292. [Google Scholar] [CrossRef] [PubMed]
  15. Rompré, A.; Servais, P.; Baudart, J.; De-Roubin, M.-R.; Laurent, P. Detection and enumeration of coliforms in drinking water: Current methods and emerging approaches. J. Microbiol. Methods 2002, 49, 31–54. [Google Scholar] [CrossRef]
  16. Steffen, M.M.; Davis, T.W.; McKay, R.M.L.; Bullerjahn, G.S.; Krausfeldt, L.E.; Stough, J.M.A.; Neitzey, M.L.; Gilbert, N.E.; Boyer, G.L.; Johengen, T.H.; et al. Ecophysiological examination of the Lake Erie Microcystis bloom in 2014: Linkages between biology and the water supply shutdown of Toledo, OH. Environ. Sci. Technol. 2017, 51, 6745–6755. [Google Scholar] [CrossRef]
  17. Harke, M.J.; Steffen, M.M.; Gobler, C.J.; Otten, T.G.; Wilhelm, S.W.; Wood, S.A.; Paerl, H.W. A review of the global ecology, genomics, and biogeography of the toxic cyanobacterium, Microcystis spp. Harmful Algae 2016, 54, 4–20. [Google Scholar] [CrossRef]
  18. Qin, B.; Zhu, G.; Gao, G.; Zhang, Y.; Li, W.; Paerl, H.W.; Carmichael, W.W. A drinking water crisis in Lake Taihu, China: Linkage to climatic variability and lake management. Environ. Manag. 2010, 45, 105–112. [Google Scholar] [CrossRef]
  19. Ichimura, T. Media for blue-green algae. In Methods in Algological Studies; Nishizawa, K., Chihara, M., Eds.; Kyoritsu: Tokyo, Japan, 1979; pp. 294–305. [Google Scholar]
  20. American Public Health Association. Standard Methods for the Examination of Water and Wastewater, 21st ed.; American Public Health Association: Washington, DC, USA, 2005. [Google Scholar]
  21. Verspagen, J.M.; Van de Waal, D.B.; Finke, J.F.; Visser, P.M.; Van Donk, E.; Huisman, J. Rising CO2 levels will intensify phytoplankton blooms in eutrophic and hypertrophic lakes. PLoS ONE 2014, 9, e104325. [Google Scholar] [CrossRef]
  22. Bullerjahn, G.S.; McKay, R.M.; Davis, T.W.; Baker, D.B.; Boyer, G.L.; D’Anglada, L.V.; Doucette, G.J.; Ho, J.C.; Irwin, E.G.; Kling, C.L.; et al. Global solutions to regional problems: Collecting global expertise to address the problem of harmful cyanobacterial blooms. A Lake Erie case study. Harmful Algae 2016, 54, 223–238. [Google Scholar] [CrossRef]
  23. Krausfeldt, L.E.; Farmer, A.T.; Castro Gonzalez, H.F.; Zepernick, B.N.; Campagna, S.R.; Wilhelm, S.W. Urea is both a carbon and nitrogen Source for Microcystis aeruginosa: Tracking 13C incorporation at bloom pH conditions. Front. Microbiol. 2019, 10, 1064. [Google Scholar] [CrossRef]
  24. Kelly, N.E.; Javed, A.; Shimoda, Y.; Zastepa, A.; Watson, S.; Shan Mugalingam, S.; Arhonditsis, G.B. A Bayesian risk assessment framework for microcystin violations of drinking water and recreational standards in the Bay of Quinte, Lake Ontario, Canada. Water Res. 2019, 162, 288–301. [Google Scholar] [CrossRef] [PubMed]
  25. Anderson, D.M.; Cembella, A.D.; Hallegraeff, G.M. Progress in understanding harmful algal blooms: Paradigm shifts and new technologies for research, monitoring, and management. Ann. Rev. Mar. Sci. 2012, 4, 143–176. [Google Scholar] [CrossRef]
  26. Ostensvik, O.; Skulberg, O.M.; Underdal, B.; Hormazabal, V. Antibacterial properties of extracts from selected planktonic freshwater cyanobacteria–a comparative study of bacterial bioassays. J. Appl. Microbiol. 1998, 84, 1117–1124. [Google Scholar] [CrossRef] [PubMed]
  27. Bomo, A.M.; Tryland, I.; Haande, S.; Hagman, C.H.; Utkilen, H. The impact of cyanobacteria on growth and death of opportunistic pathogenic bacteria. Water Sci. Technol. 2011, 64, 384–390. [Google Scholar] [CrossRef] [PubMed]
  28. Dixon, R.A.; Al-Nazawi, M.; Alderson, G. Permeabilising effects of sub-inhibitory concentrations of microcystin on the growth of Escherichia coli. FEMS Microbiol. Let. 2004, 230, 167–170. [Google Scholar] [CrossRef]
  29. Yang, C.Y.; Wang, W.B.; Li, D.H.; Liu, Y.D. Growth and antioxidant system of Escherichia coli in response to microcystin-RR. Bull. Environ. Contam. Toxicol. 2008, 81, 427–431. [Google Scholar] [CrossRef]
  30. Halac, S.R.; Bazán, R.D.V.; Larrosa, N.B.; Nadal, A.F.; Ruibal-Conti, A.L.; Rodriguez, M.I.; Ruiz, M.A.; López, A.G. First report on negative association between cyanobacteria and fecal indicator bacteria at San Roque reservoir (Argentina): Impact of environmental factors. J. Freshw. Ecol. 2019, 34, 273–291. [Google Scholar] [CrossRef]
  31. Fastner, J.; Erhard, M.; von Döhren, H. Determination of oligopeptide diversity within a natural population of Microcystis spp. (cyanobacteria) by typing single colonies by matrix-assisted laser desorption ionization–time of flight mass spectrometry. Appl. Env. Microbiol. 2001, 67, 5069–5076. [Google Scholar] [CrossRef]
  32. Cabral, J.P. Water microbiology. Bacterial pathogens and water. Int. J. Environ. Res. Public. Health 2010, 7, 3657–3703. [Google Scholar] [CrossRef]
  33. Brown, R.S.; Marcotte, E.J.-P.; Dunkinson, C.E.; Aston, W.P.; Gallant, P.; Wilton, D. An automated detection technology for on-site E. coli and coliform bacteria monitoring. Proc. Water Environ. Federation. 2010, 2010, 7433–7442. [Google Scholar] [CrossRef]
  34. Schang, C.; Henry, R.; Kolotelo, P.A.; Prosser, T.; Crosbie, N.; Grant, T.; Cottam, D.; O’Brien, P.; Coutts, S.; Deletic, A. Evaluation of techniques for measuring microbial hazards in bathing waters: A comparative study. PLoS ONE 2016, 11, e0155848. [Google Scholar] [CrossRef] [PubMed]
  35. Glover, H.; Campbell, L.; Prezelin, B. Contribution of Synechococcus spp. to size-fractioned primary productivity in three water masses in the Northwest Atlantic Ocean. Mar. Biol. 1986, 91, 193–203. [Google Scholar] [CrossRef]
Figure 1. E. coli levels (CFU/100 mL) in Microcystis cultures and the control medium after inoculation with E. coli (mean ± SD; n = 4). Statistical testing on day 2 shows that both Microcystis cultures are significantly different from the control (p = 3 × 10⁻⁷ for both) and that M. aeruginosa culture levels are different from M. smithii (p = 0.006), as indicated by letters a, b, c.
Toxins 15 00628 g001
Figure 2. Chlorophyll a concentration (µg/L) (a) and cell density (cells/µL) (b) in Microcystis cultures with and without E. coli recorded on various days after inoculation of the culture (mean ± SD; n = 3).
Toxins 15 00628 g002
Figure 3. Microcystin concentration (µg/L) in two microcystin producing Microcystis cultures with and without E. coli recorded on various days after inoculation of the culture (means ± SD; n = 2). By day 23, the microcystin levels with and without E. coli present were not significantly different, but the microcystin levels in M. aeruginosa cultures were significantly different from M. smithii cultures (p = 0.001), as indicated by letters a, b.
Toxins 15 00628 g003
Figure 4. E. coli counts (CFU/100 mL) in MA cultures containing different levels of microcystin adjusted with cell-free filtrate of M. aeruginosa culture containing 20.0 µg/L microcystin.
Toxins 15 00628 g004
Figure 5. Survival of lake strain E. coli shown in level (CFU/100 mL) over time (days) (a) and total coliforms level (CFU/100 mL) (b) in two Microcystis cultures and control medium recorded on various days after inoculation of the culture (means ± SD; n = 2). Letters indicate curves that are statistically significantly different from each other (p < 0.05).
Toxins 15 00628 g005
Table 1. E. coli survival time (last day with bacteria detected) and half-life (t1/2) in cultures with different levels of microcystin. Half-life (t1/2) and 95% CI ranges were determined by linear regression of loge-transformed data from Figure 4, starting at day 2 (see Section 5).
Microcystin (μg/L)00.51.02.05.0
Survival time (day)>25201895
t1/2
(95% CI range)
>13.3 a0.97 b
(0.79–1.25)
0.74 b
(0.62–0.93)
0.33 c
(0.23–0.58)
0.40 b,c
(0.24–1.19)
a, b, c indicate results in statistically significantly different groups (p < 0.05).
Disclaimer/Publisher’s Note: The statements, opinions and data contained in all publications are solely those of the individual author(s) and contributor(s) and not of MDPI and/or the editor(s). MDPI and/or the editor(s) disclaim responsibility for any injury to people or property resulting from any ideas, methods, instructions or products referred to in the content.

